
Malondialdehyde, an Oxidative Stress Marker in Oral Squamous Cell Carcinoma—A Systematic Review and Meta-Analysis

 ,
,  , and
, and 
Abstract
:1. Introduction
2. Materials and Methods
2.1. Protocol and Registration
2.2. Focused Question
- (i)
- Population: patients with OSCC
- (ii)
- Exposure or Diagnostic marker: mean and standard deviation value of MDA
- (iii)
- Comparison: between patients with oral squamous cell carcinoma and healthy subjects
- (iv)
- Outcome: assessment of MDA in various biological samples of patients with OSCC
- (v)
- Study: identify related cross-sectional and case-controlled studies investigating the status of MDA in OSCC and control from 1999 to 2020.
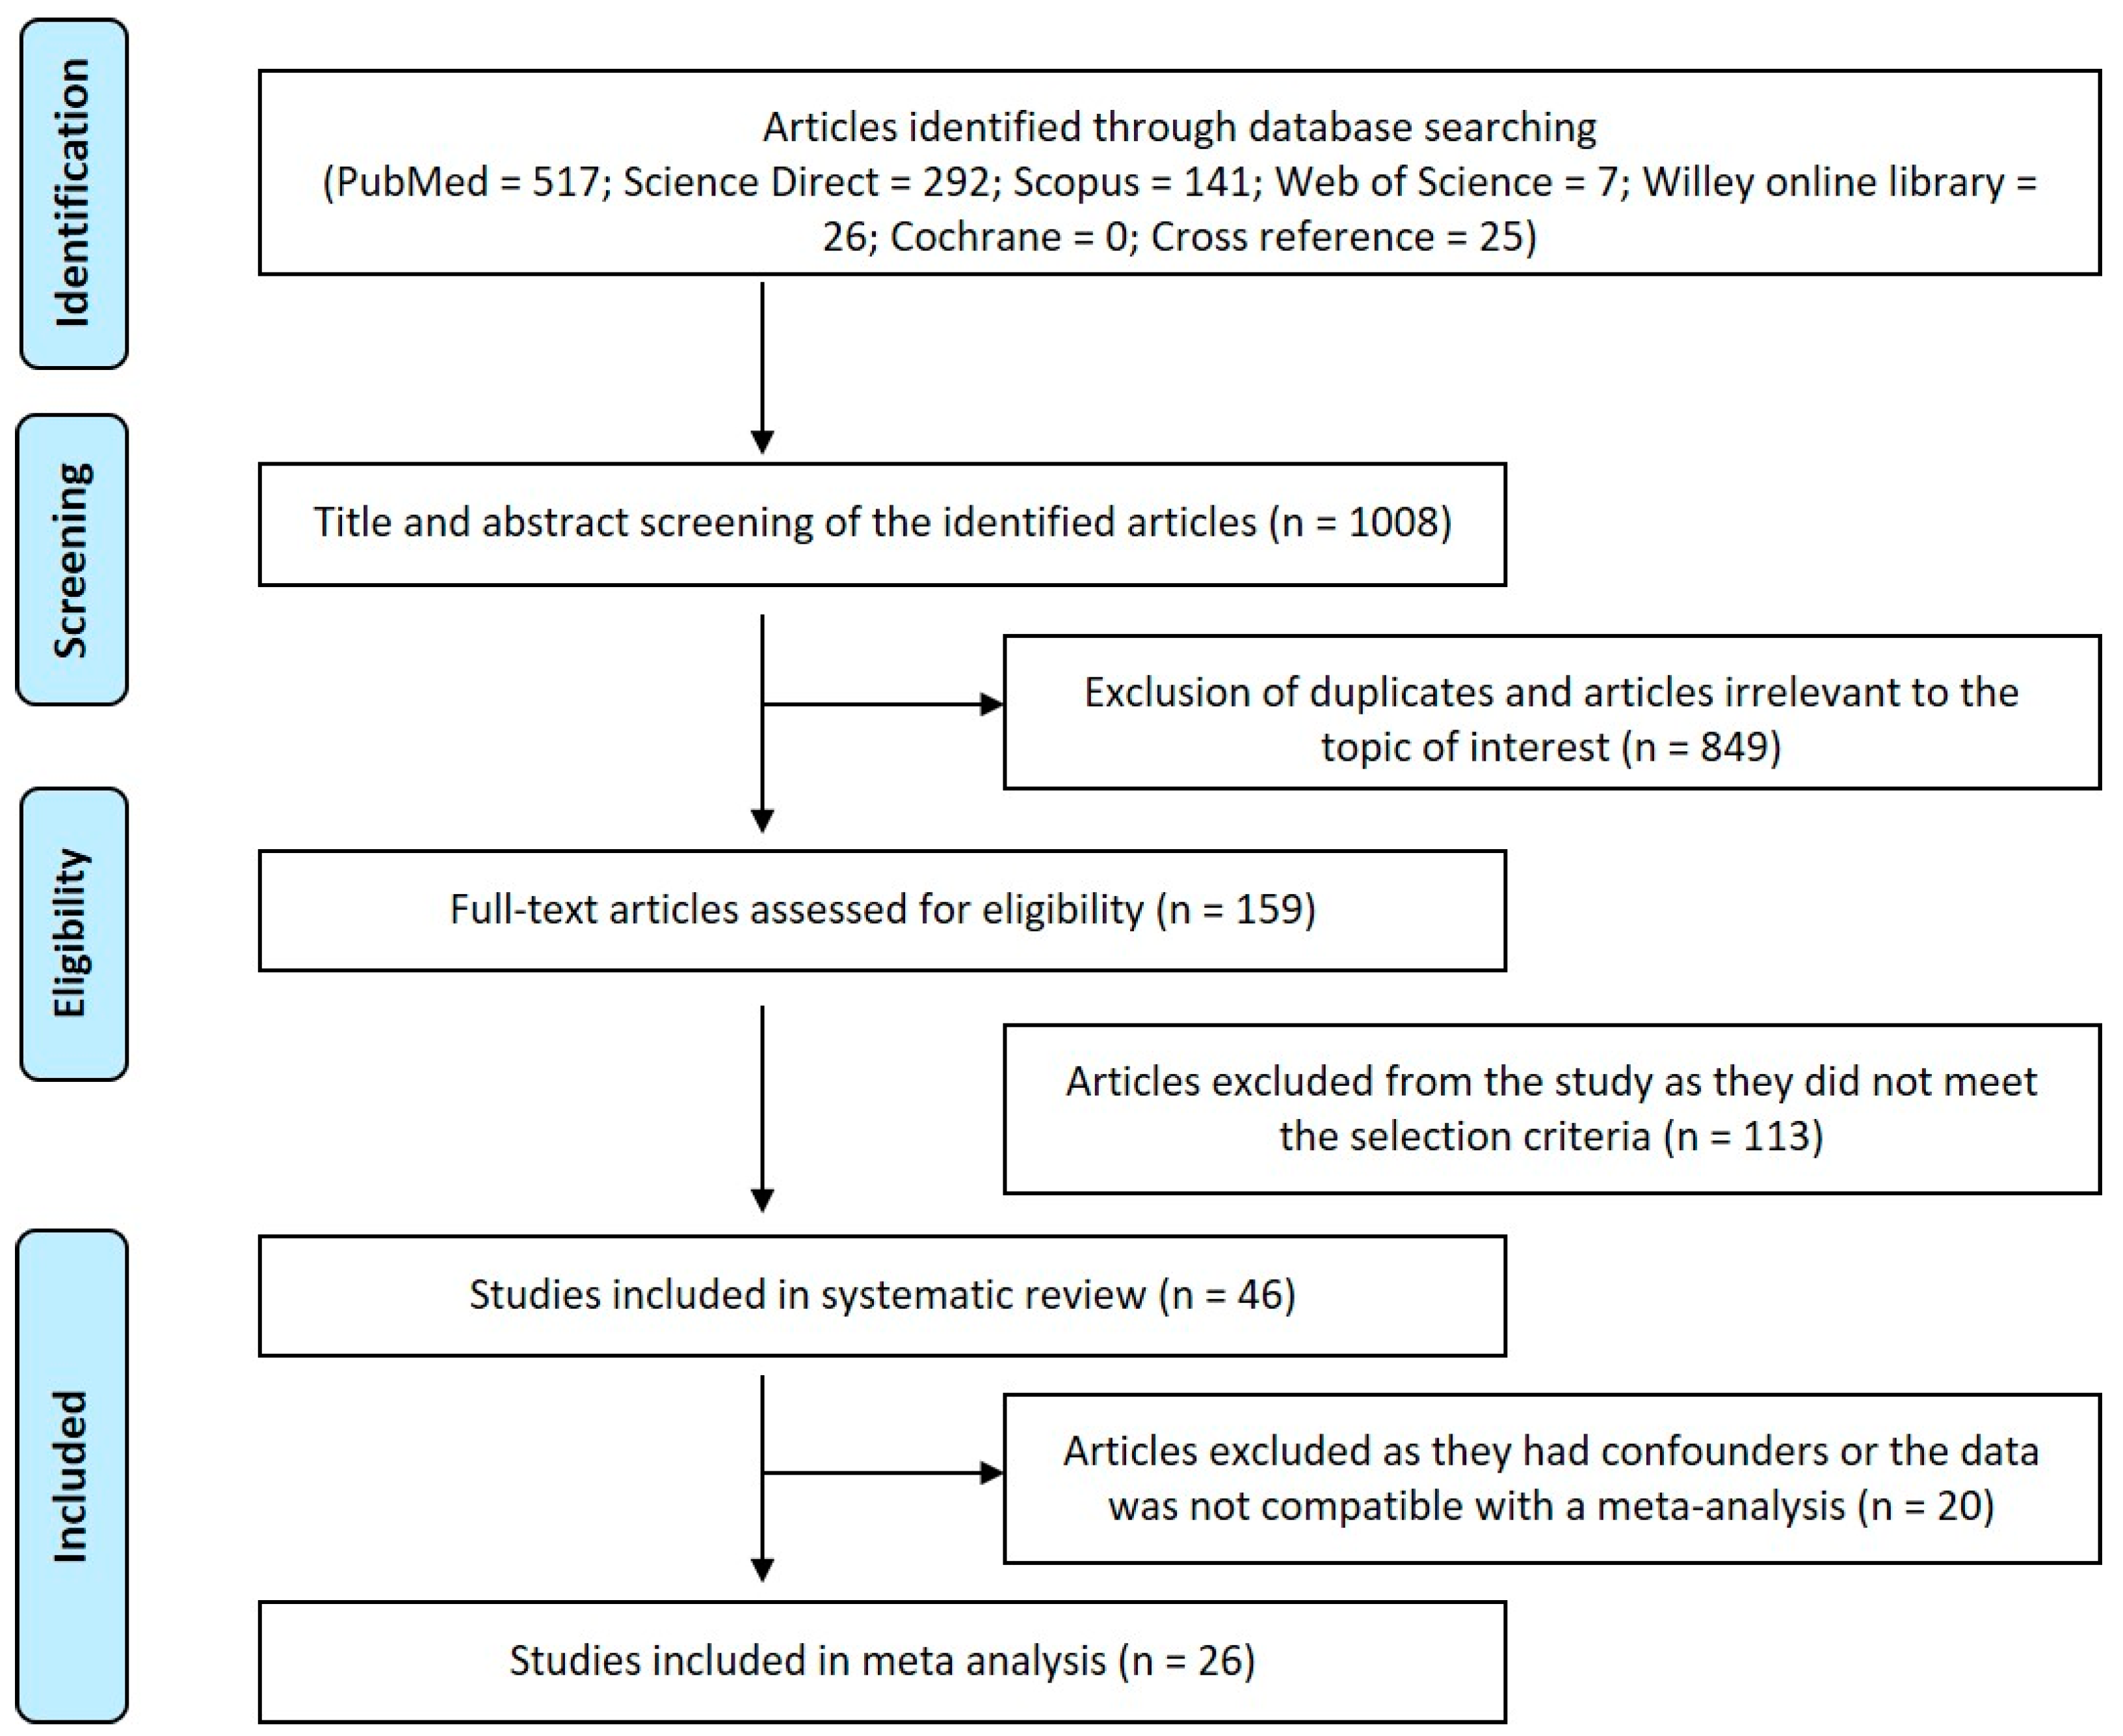
2.3. Electronic Search Identification
2.4. Screening for Relevance
2.5. Inclusion Criteria
- (a)
- Studies discussed the oxidative status of OSCC using lipid peroxidation marker-Malondialdehyde (MDA);
- (b)
- Studies involving various biological samples and expressed the MDA data in mean, standard deviation along with p-value;
- (c)
- Papers provided sufficient data to allow comparison of OSCC and control groups.
2.6. Exclusion Criteria
- Articles with the unmatched objective and abstract;
- Being literature reviews and systematic reviews;
- Studies used other oxidative stress markers as a marker of evaluation;
- The works provided inadequate data for the comparison between control and OSCC groups;
- Studies related to head and neck squamous cell carcinoma
2.7. Retrieval of Full-Text Articles and Evaluation
2.8. Data Extraction
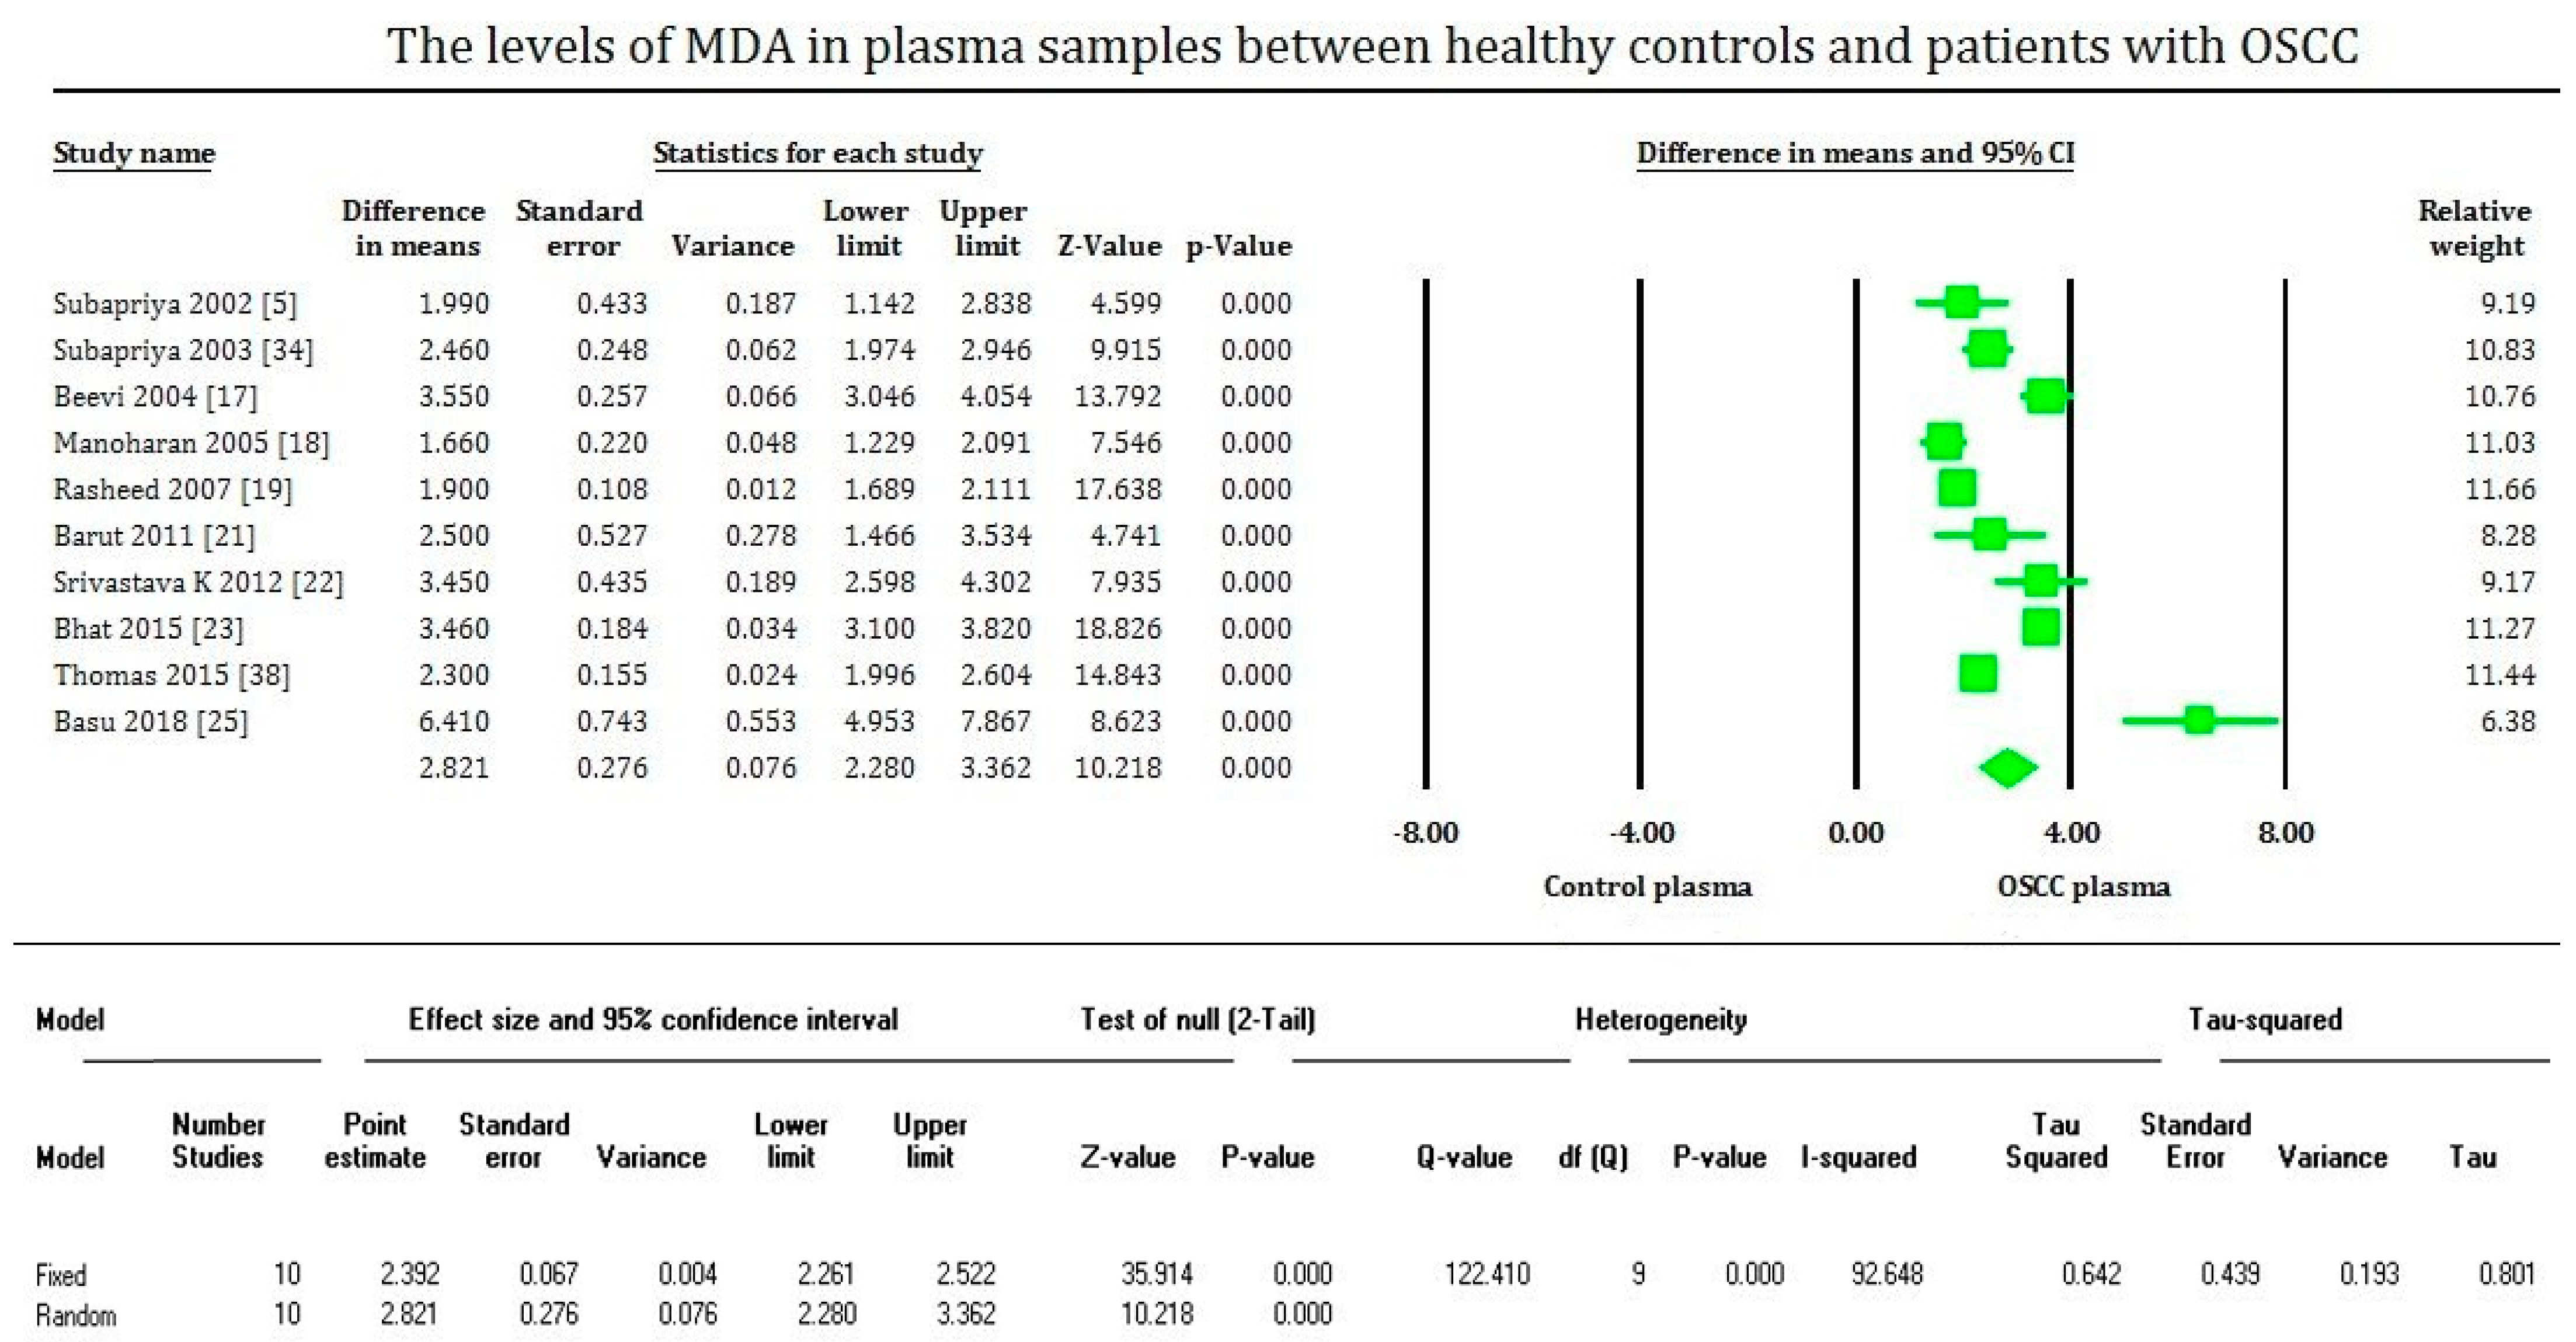
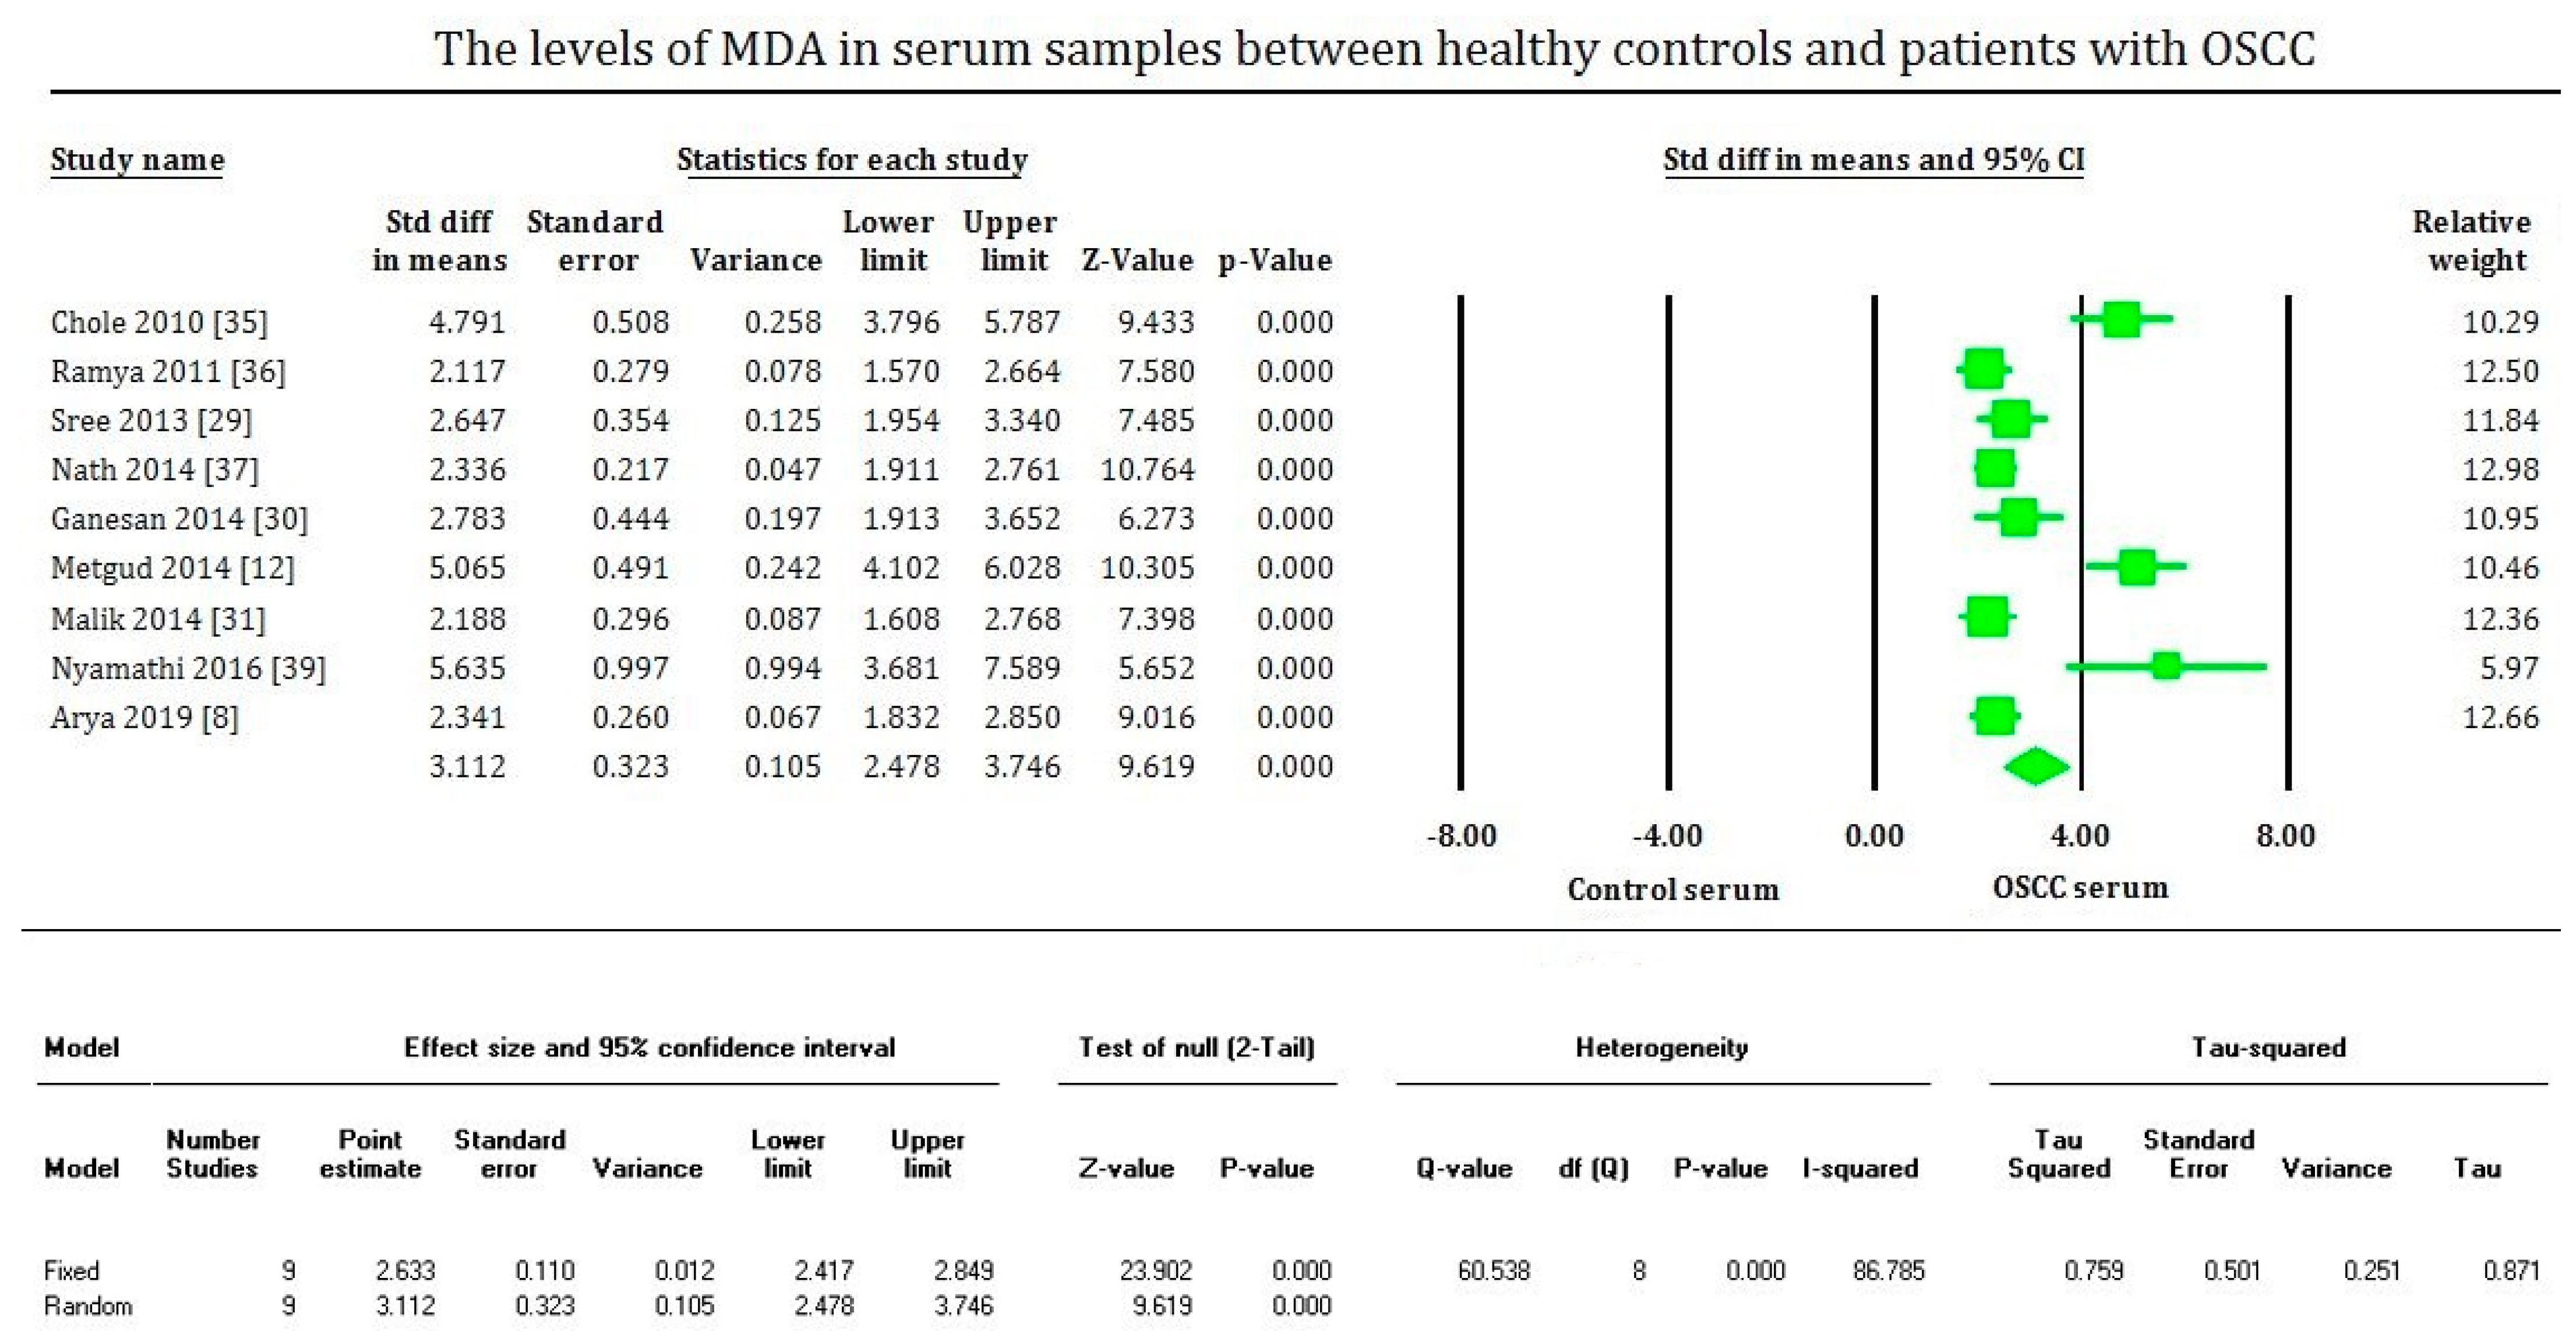
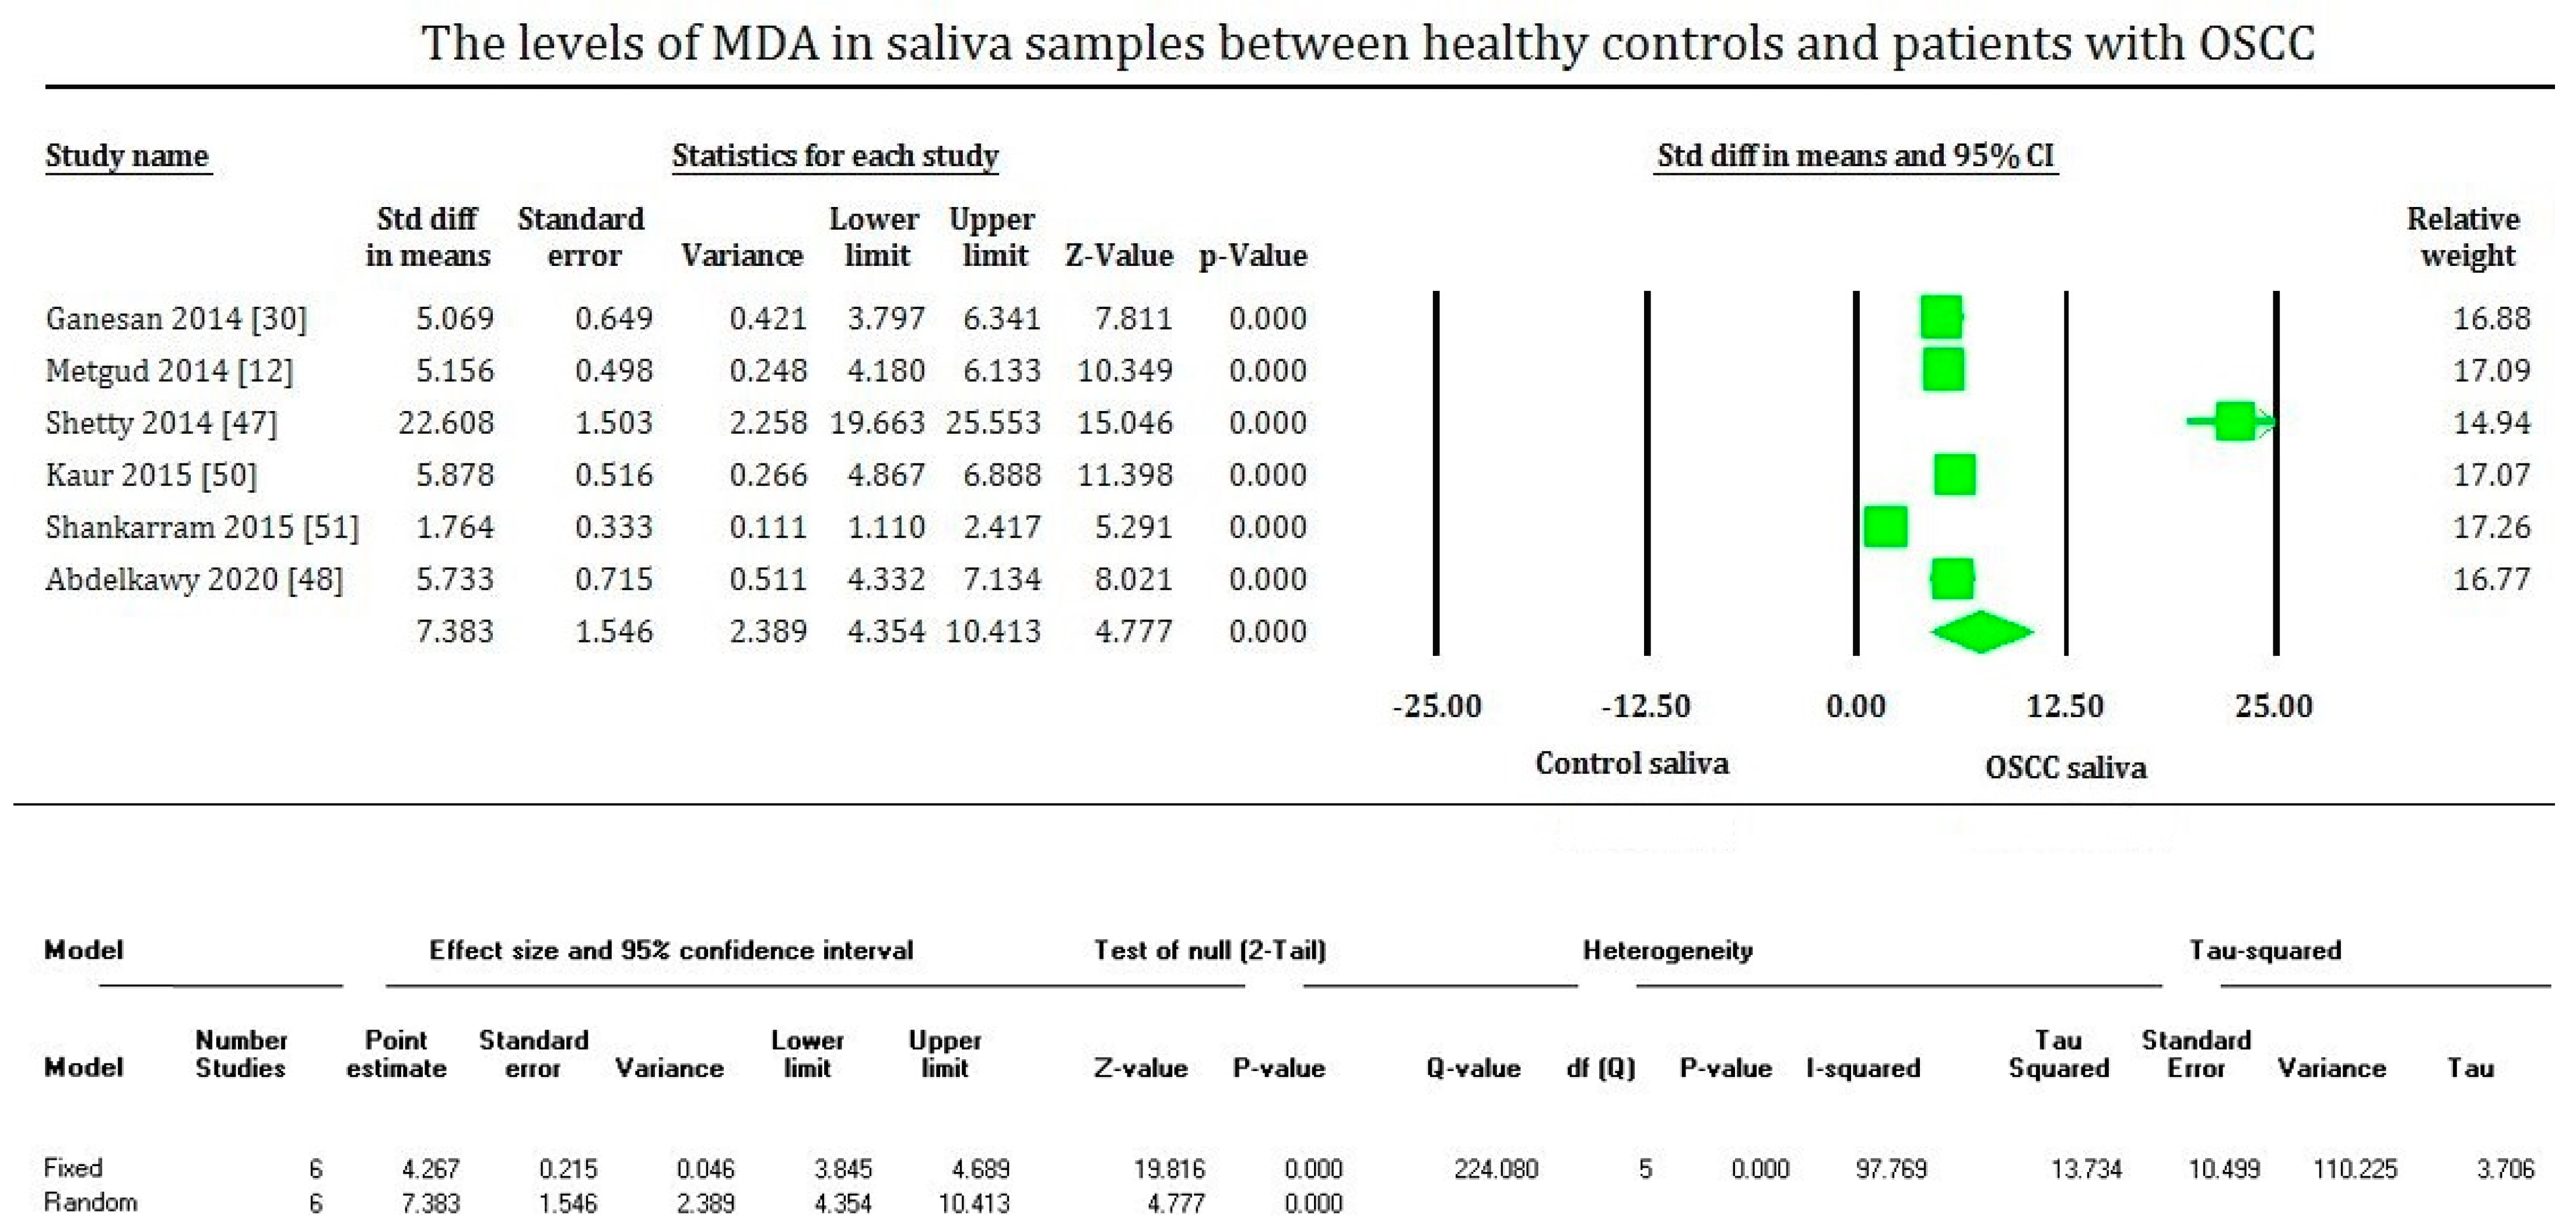
2.9. Statistical Analysis
3. Results
4. Discussion
5. Conclusions
Author Contributions
Funding
Institutional Review Board Statement
Informed Consent Statement
Acknowledgments
Conflicts of Interest
References
- Zanaruddin, S.N.S.; Yee, P.S.; Hor, S.Y.; Kong, Y.H.; Ghani, W.M.N.W.A.; Mustafa, W.M.W.; Zain, R.B.; Prime, S.S.; Rahman, Z.A.A.; Cheong, S.-C. Common Oncogenic Mutations Are Infrequent in Oral Squamous Cell Carcinoma of Asian Origin. PLoS ONE 2013, 8, e80229. [Google Scholar] [CrossRef]
- Chaturvedi, A.K.; Anderson, W.F.; Lortet-Tieulent, J.; Curado, M.P.; Ferlay, J.; Franceschi, S.; Rosenberg, P.S.; Bray, F.; Gillison, M.L. Worldwide Trends in Incidence Rates for Oral Cavity and Oropharyngeal Cancers. J. Clin. Oncol. 2013, 31, 4550–4559. [Google Scholar] [CrossRef] [Green Version]
- Saedi, B.; Razmpa, E.; Ghalandarabadi, M.; Ghadimi, H.; Saghafi, F.; Naseri, M. Epidemiology of oral cavity cancers in a country located in the esophageal cancer belt: A case control study. Iran. J. Otorhinolaryngol. 2012, 24, 113–118. [Google Scholar]
- Glick, M.; Feagans, W. Burket’s Oral Medicine and Diagnosis; People’s Medical Publishing House: Beijing, China, 2015; ISBN 5856420187. [Google Scholar]
- Subapriya, R.; Kumaraguruparan, R.; Ramachandran, C.R.; Nagini, S. Oxidant-antioxidant status in patients with oral squamous cell carcinomas at different intraoral sites. Clin. Biochem. 2002, 35, 489–493. [Google Scholar] [CrossRef]
- Flint, P.W.; Haughey, B.H.; Robbins, K.T.; Thomas, J.R.; Niparko, J.K.; Lund, V.J.; Lesperance, M.M. Cummings Otolaryngology—Head and Neck Surgery E-book, 5th ed.; Elsevier: Amsterdam, The Netherlands, 2010; p. 96. ISBN 9780323080873. [Google Scholar]
- Lobo, V.; Patil, A.; Phatak, A.; Chandra, N. Free radicals, antioxidants and functional foods: Impact on human health. Pharmacogn. Rev. 2010, 4, 118. [Google Scholar] [CrossRef] [Green Version]
- Arya, H.; Ganvir, S.M.; Begde, D.N.; Passi, A.D. Comparative Evaluation of Serum Malondialdehyde (MDA) Level in Oral Submucous Fibrosis and Oral Squamous Cell Carcinoma. J. Clin. Diagnostic Res. 2019, 13, 27–31. [Google Scholar] [CrossRef]
- Katakwar, P.; Metgud, R.; Naik, S.; Mittal, R. Oxidative stress marker in oral cancer: A review. J. Cancer Res. Ther. 2016, 12, 438. [Google Scholar] [CrossRef]
- Gurudath, S.; Ganapathy, K.S.; Pai, A.; Ballal, S.; Asha, M.L. Estimation of superoxide dismutase and glutathione peroxidase in oral submucous fibrosis, oral leukoplakia and oral cancer—A comparative study. Asian Pac. J. Cancer Prev. 2012, 13, 4409–4412. [Google Scholar] [CrossRef] [PubMed] [Green Version]
- D’souza, D.; Subhas, B.G.; Shetty, S.R.; Balan, P. Estimation of serum malondialdehyde in potentially malignant disorders and post-antioxidant treated patients: A biochemical study. Contemp. Clin. Dent. 2012, 3, 448–451. [Google Scholar] [CrossRef] [PubMed]
- Metgud, R.; Bajaj, S. Evaluation of salivary and serum lipid peroxidation, and glutathione in oral leukoplakia and oral squamous cell carcinoma. J. Oral Sci. 2014, 56, 135–142. [Google Scholar] [CrossRef] [PubMed] [Green Version]
- Lieberman, M.A.; Marks, A.D. Oxygen toxicity and free radical injury. In Marks’ Basic Medical Biochemistry: A Clinical Approach; Lippincott Williams & Wilkins: Philadelphia, PA, USA, 2013; pp. 437–455. ISBN1 9781608315727. ISBN2 160831572X. [Google Scholar]
- Saroja, M.; Balasenthil, S.; Nagini, S. Tissue lipid peroxidation and glutathione-dependent enzyme status in patients with oral squamous cell carcinoma. Cell Biochem. Funct. 1999, 17, 213–216. [Google Scholar] [CrossRef]
- Sabitha, K.E.; Shyamaladevi, C.S. Oxidant and antioxidant activity changes in patients with oral cancer and treated with radiotherapy. Oral Oncol. 1999, 35, 273–277. [Google Scholar] [CrossRef]
- Balasenthil, S.; Saroja, M.; Ramachandran, C.R.; Nagini, S. Of humans and hamsters: Comparative analysis of lipid peroxidation, glutathione, and glutathione-dependent enzymes during oral carcinogenesis. Br. J. Oral Maxillofac. Surg. 2000, 38, 267–270. [Google Scholar] [CrossRef] [PubMed]
- Subapriya, R.; Kumaraguruparan, R.; Nagini, S.; Thangavelu, A. Oxidant-antioxidant status in oral precancer and oral cancer patients. Toxicol. Mech. Methods 2003, 13, 77–81. [Google Scholar] [CrossRef]
- Kolanjiappan, K.; Ramachandran, C.; Manoharan, S. Biochemical changes in tumor tissues of oral cancer patients. Clin. Biochem. 2003, 36, 61–65. [Google Scholar] [CrossRef]
- Beevi, S.S.S.; Rasheed, A.M.H.; Geetha, A. Evaluation of oxidative stress and nitric oxide levels in patients with oral cavity cancer. Jpn. J. Clin. Oncol. 2004, 34, 379–385. [Google Scholar] [CrossRef] [Green Version]
- Manoharan, S.; Kolanjiappan, K.; Suresh, K.; Panjamurthy, K. Lipid peroxidation & antioxidants status in patients with oral squamous cell carcinoma. Indian J. Med. Res. 2005, 122, 529–534. [Google Scholar]
- Khanna, R.; Thapa, P.B.; Khanna, H.D.; Khanna, S.; Khanna, A.K.; Shukla, H.S. Lipid peroxidation and antioxidant enzyme status in oral carcinoma patients. Kathmandu Univ. Med. J. 2005, 3, 334–339. [Google Scholar]
- Rasheed, M.H.; Beevi, S.S.; Geetha, A. Enhanced lipid peroxidation and nitric oxide products with deranged antioxidant status in patients with head and neck squamous cell carcinoma. Oral Oncol. 2007, 43, 333–338. [Google Scholar] [CrossRef]
- Rai, B.; Kharb, S.; Jain, R.; Anand, S.C. Salivary lipid peroxidation product malonaldehyde in pre-cancer and cancer. Adv. Med. Dent. Sci. 2008, 2, 7–8. [Google Scholar]
- Bathi, R.J.; Rao, R.; Mutalik, S. GST null genotype and antioxidants: Risk indicators for oral pre-cancer and cancer. Indian J. Dent. Res. 2009, 20, 298–303. [Google Scholar] [CrossRef]
- Chole, R.H.; Patil, R.N.; Basak, A.; Palandurkar, K.; Bhowate, R. Estimation of serum malondialdehyde in oral cancer and precancer and its association with healthy individuals, gender, alcohol, and tobacco abuse. J. Cancer Res. Ther. 2010, 6, 487–491. [Google Scholar] [CrossRef]
- Raghavendra, U.; D’Souza, V.; D’Souza, B. Erythrocyte malondialdeyde and antioxidant status in oral squamous cell carcinoma patients and tobacco chewers/smokers. Biomed. Res. 2010, 21, 441–444. [Google Scholar]
- Gokul, S.; Patil, V.S.; Jailkhani, R.; Hallikeri, K.; Kattappagari, K.K. Oxidant-antioxidant status in blood and tumor tissue of oral squamous cell carcinoma patients. Oral Dis. 2010, 16, 29–33. [Google Scholar] [CrossRef] [PubMed]
- Burlakova, E.B.; Zhizhina, G.P.; Gurevich, S.M.; Fatkullina, L.D.; Kozachenko, A.I.; Nagler, L.G.; Zavarykina, T.M.; Kashcheev, V.V. Biomarkers of oxidative stress and smoking in cancer patients. J. Cancer Res. Ther. 2010, 6, 47–53. [Google Scholar] [CrossRef] [PubMed]
- Arathi, A.; D’Souza, B.; Sayanthan, M.; Raksha, S.; Buthesh, G.A.; Jisha, K.; Hegde, M.C.; D’Souza, V. Department Salivary malondialdeyde and antioxidant status in oral squamous cell carcinoma patients and smokers. Biomed. Res. 2010, 21, 67–70. [Google Scholar]
- Barut, O.; Vural, P.; Şirin, Ş.; Aydin, S.; Dizdar, Y. The oxidant/antioxidant status and cell death mode in oral squamous cell carcinoma. Acta Odontol. Scand. 2012, 70, 303–308. [Google Scholar] [CrossRef] [PubMed]
- Ramya, R.; Prakash, S.; Sudha, S. Assessment of Serum Malondialdehyde in Oral Squamous Cell Carcinoma patients and its association with tobacco habits. J. Pharm. Biomed. Sci. 2011, 10, 1–3. [Google Scholar]
- Srivastava, K.C.; Austin, R.D.; Shrivastava, D.; Sethupathy, S.; Rajesh, S. A Case control study to evaluate oxidative stress in plasma samples of oral malignancy. Contemp. Clin. Dent. 2012, 3, 271–276. [Google Scholar] [CrossRef]
- Shetty, S.R.; Babu, S.; Kumari, S.; Shetty, P.; Hegde, S.; Castelino, R. Status of salivary lipid peroxidation in oral cancer and precancer. Indian J. Med. Paediatr. Oncol. 2014, 35, 156–158. [Google Scholar] [CrossRef] [Green Version]
- Nath, A.; Anand, V.; Anshu, A.K.; Rashmi, T.; Singh, J.; Jain, P.; Sinha, R.; Kumar, S. Significantly high levels of estrogen and MDA together induce tumor progression in Oral squamous cell carcinoma. IOSR J. Environ. Sci. Toxicol. Food Technol. 2014, 8, 18–25. [Google Scholar] [CrossRef]
- Rasool, M.; Khan, S.R.; Malik, A.; Khan, K.M.; Zahid, S.; Manan, A.; Qazi, M.H.; Naseer, M.I. Comparative Studies of Salivary and Blood Sialic Acid, Lipid Peroxidation and Antioxidative Status in Oral Squamous Cell Carcinoma (OSCC). Pak. J. Med. Sci. 2014, 30, 466–471. [Google Scholar] [CrossRef]
- Ganesan, A.; Kumar, G. Assessment of lipid peroxides in multiple biofluids of leukoplakia and oral squamous cell carcinoma patients-a clinico-biochemical study. J. Clin. Diagn. Res. 2014, 8, ZC55–ZC58. [Google Scholar] [CrossRef] [PubMed]
- Malik, U.U.; Siddiqui, I.A.; Hashim, Z.; Zarina, S. Measurement of serum paraoxonase activity and MDA concentrations in patients suffering with oral squamous cell carcinoma. Clin. Chim. Acta 2014, 430, 38–42. [Google Scholar] [CrossRef] [PubMed]
- Huo, W.; Li, Z.-M.; Pan, X.-Y.; Bao, Y.-M.; An, L.-J. Antioxidant enzyme levels in pathogenesis of oral squamous cell carcinoma (OSCC). Drug Res. 2014, 64, 629–632. [Google Scholar] [CrossRef]
- Bhat, V.S.; Nayak, K.R.; Kini, S.; Bhat, S.P. Assessment of serum antioxidant levels in oral and oropharyngeal carcinoma patients. Internet J. Pathol. Lab. Med. 2016, 2, 1–5. [Google Scholar]
- Rai, S.; Sharma, A.; Ranjan, V.; Misra, D.; Panjwani, S. Estimation of serum antioxidant enzymes in histopathological grades of oral leukoplakia, oral submucous fibrosis, and oral cancer: A clinicopathologic study. J. Indian Acad. Oral Med. Radiol. 2015, 27, 349. [Google Scholar] [CrossRef]
- Kaur, J.; Politis, C.; Jacobs, R. Salivary 8-hydroxy-2-deoxyguanosine, malondialdehyde, vitamin C, and vitamin E in oral pre-cancer and cancer: Diagnostic value and free radical mechanism of action. Clin. Oral Investig. 2016, 20, 315–319. [Google Scholar] [CrossRef]
- Shankarram, V.; Narayanan, M.L.; Sudhakar, M.U.; Moses, M.J.; Selvan, M.T.; Parthiban MD, S.S. Detection of Oxidative Stress in Periodontal Disease and Oral Cancer. Biomed. Pharmacol. J. 2015, 8, 725–729. [Google Scholar] [CrossRef]
- Misra, D.; Rai, S.; Panjwani, S.; Sharma, A.; Singh, N. Role of antioxidants as a stress factor for potentially malignant, malignant disorders and healthy individuals: A correlative study. J. Dr. NTR Univ. Health Sci. 2016, 5, 147. [Google Scholar] [CrossRef]
- Nyamati, S.B.; Annapoorna, H.B.; Tripathi, J.; Sinha, N.; Roy, S.; Agrawal, R. Evaluation of serum antioxidant enzymes in oral submucous fibrosis and oral squamous cell carcinoma: A clinical and biochemical study. J. Adv. Med. Dent. Sci. Res. 2016, 4, 83–87. [Google Scholar] [CrossRef]
- Srivastava, K.C.; Austin, R.D.; Shrivastava, D. Evaluation of oxidant-antioxidant status in tissue samples in oral cancer: A case control study. Dent. Res. J. 2016, 13, 181–187. [Google Scholar] [CrossRef] [PubMed]
- Verma, S.; Saxena, R.; Siddiqui, M.H.; Santha, K.; Sethupathy, S. Evaluation of CYP1B1 Expression, Oxidative Stress and Phase 2 Detoxification Enzyme Status in Oral Squamous Cell Carcinoma Patients. J. Clin. Diagn. Res. 2017, 11, BC01–BC05. [Google Scholar] [CrossRef] [PubMed]
- Madhulatha, G.; Venkateswarlu, N.; Das, S.V. Estimations of various antioxidants in oral cancer patients in comparison with smokers and non-smokers—A biochemical study. Int. J. Res. Med. Sci. 2017, 5, 4743. [Google Scholar] [CrossRef] [Green Version]
- Banerjee, S.; Mukherjee, S.; Mitra, S.; Singhal, P. Altered expression of mitochondrial antioxidants in oral squamous cell carcinoma. J. Oral Sci. 2017, 59, 439–446. [Google Scholar] [CrossRef] [PubMed] [Green Version]
- Basu, S. Medpulse International Journal of Biochemistry; MedPulse Publishing Corporation: Lagos, Nigeria, 2018; pp. 54–55. ISBN 2550-763X. [Google Scholar]
- Sabarathinam, J.; Selvaraj, J.; Devi, S. Estimation of Levels of Glutathione Peroxidase (Gpx), Malondialdehyde (Mda), Tumor Necrosis Factor Alpha (Tnf Alpha) and Alpha Feto Protein (Afp) In Saliva of Potentially Malignant Disorders and Oral Squamous Cell Carcinoma. Biomed. Pharmacol. J. 2019, 12, 1881–1886. [Google Scholar] [CrossRef]
- Babiuch, K.; Bednarczyk, A.; Gawlik, K.; Pawlica-Gosiewska, D.; Kęsek, B.; Darczuk, D.; Stępień, P.; Chomyszyn-Gajewska, M.; Kaczmarzyk, T. Evaluation of enzymatic and non-enzymatic antioxidant status and biomarkers of oxidative stress in saliva of patients with oral squamous cell carcinoma and oral leukoplakia: A pilot study. Acta Odontol. Scand. 2019, 77, 408–418. [Google Scholar] [CrossRef]
- Shahi, Y.; Samadi, F.M.; Mukherjee, S. Plasma lipid peroxidation and antioxidant status in patients with oral precancerous lesions and oral cancer. Oral Sci. Int. 2020, 17, 86–93. [Google Scholar] [CrossRef]
- Oswal, R.G.; Nandan, K.R.; Prashant, D.I.G.M. Evaluation of serum antioxidant enzymes in oral submucous fibrosis and oral squamous cell carcinoma: A clinical and biochemical study. Eur. J. Mol. Clin. Med. 2020, 7, 3205–3209. [Google Scholar]
- Abdelkawy, M.; El Refai, S.; Shaker, O.G.; Elbattawy, W. Malondialdehyde and Nitrous Oxide as Salivary Biomarkers for Different Oral Lesions. Adv. Dent. Res. 2020, 2, 117–128. [Google Scholar] [CrossRef]
- Ohkawa, H.; Ohishi, N.; Yagi, K. Assay for lipid peroxides in animal tissues by thiobarbituric acid reaction. Anal. Biochem. 1979, 95, 351–358. [Google Scholar] [CrossRef]
- Suematsu, T.; Kamada, T.; Abe, H.; Kikuchi, S.; Yagi, K. Serum lipoperoxide level in patients suffering from liver diseases. Clin. Chim. Acta 1977, 79, 267–270. [Google Scholar] [CrossRef]
- Yagi, K. Lipid peroxides and human diseases. Chem. Phys. Lipids 1987, 45, 337–351. [Google Scholar] [CrossRef]
- Donnan, S.K. The Thiobarbituric Acid Test Applied to Tissues from Rats Treated in Various Ways. J. Biol. Chem. 1950, 182, 415–419. [Google Scholar] [CrossRef]
- Buege, J.A.; Aust, S.D. Microsomal lipid peroxidation. In Methods in Enzymology; Academic Press: Cambridge, MA, USA, 1978; Volume 52, pp. 302–310. [Google Scholar]
- Draper, H.H.; Hadley, M. Malondialdehyde determination as index of lipid Peroxidation. In Methods in Enzymology; Academic Press: Cambridge, MA, USA, 1990; Volume 186, pp. 421–431. [Google Scholar]
- Bergmeyer, H.-U. (Ed.) Methods of Enzymatic Analysis V2, 2nd ed.; Academic Press: Cambridge, MA, USA, 1974; pp. 276–286. ISBN 9780323161374. [Google Scholar]
- Jain, S.K.; McVie, R.; Duett, J.; Herbst, J.J. Erythrocyte membrane lipid peroxidation and glycosylated hemoglobin in diabetes. Diabetes 1989, 38, 1539–1543. [Google Scholar] [CrossRef]
- Stocks, J.; Dormandy, T.L. The Autoxidation of Human Red Cell Lipids Induced by Hydrogen Peroxide. Br. J. Haematol. 1971, 20, 95–111. [Google Scholar] [CrossRef]
- Valenzuela, A. The biological significance of malondialdehyde determination in the assessment of tissue oxidative stress. Life Sci. 1991, 48, 301–309. [Google Scholar] [CrossRef]
- Shilpasree, A.S.; Kumar, K.; Itagappa, M.; Ramesh, G. Study of oxidative stress and antioxidant status in oral cancer patients. Int. J. Oral Maxillofac. Pathol. 2013, 2, 2–6. [Google Scholar]
- Satoh, K. Serum lipid peroxide in cerebrovascular disorders determined by a new colorimetric method. Clin. Chim. Acta. 1978, 90, 37–43. [Google Scholar] [CrossRef]
- Thomas, S.A.; Sethupathy, S. Evaluation of Oxidative Stress in Patients with Oral Squamous Cell Carcinoma. Int. J. Pharm. Bio. Sci. 2015, 6, 289–293. [Google Scholar]
- Mahfouz, M.O.; Hariprasad, C.H.; Shaffie, I.A.; Sadasivudu, B. Serum Malondialdehyde levels in myocardial infarction and chronic renal failure. IRCS Med. Sci. 1986, 14, 1110–1111. [Google Scholar]
- Sinnhuber, R.O.; Yu, T.C.; Yu, T.C. Characterization of the Red Pigment Formed in the 2-thiobarbituric Acid Determination of Oxidative Rancidity b. J. Food Sci. 1958, 23, 626–634. [Google Scholar] [CrossRef]
- Gavino, V.C.; Miller, J.S.; Ikharebha, S.O.; Milo, G.E.; Cornwell, D.G. Effect of polyunsaturated fatty acids and antioxidants on lipid peroxidation in tissue cultures. J. Lipid Res. 1981, 22, 763–769. [Google Scholar] [CrossRef]
- Ogura, R.; Sakanashi, T.; Nagata, O.; Sugiyama, M.; Kajiyama, K.; Nakagawa, T.; Shin, G.; Hidaka, T. Assay for lipid peroxide content in mitochondria by the thiobarbituric acid reaction. Kurume Med. J. 1987, 34, 53–58. [Google Scholar] [CrossRef]
- Nair, V.; Turner, G.A. The thiobarbituric acid test for lipid peroxidation: Structure of the adduct with malondialdehyde. Lipids 1984, 19, 804–805. [Google Scholar] [CrossRef]
- Sobin, L.H.W.C. International Union Against Cancer (UICC): TNM Classification of Malignant Tumours; Wiley Liss Publications: New York, NY, USA, 1997; pp. 17–42. [Google Scholar]
- Bryne, M.; Koppang, H.S.; Lilleng, R.; Stene, T.; Bang, G.; Dabelsteen, E. New malignancy grading is a better prognostic indicator than Broders’ grading in oral squamous cell carcinomas. J. Oral Pathol. Med. 1989, 18, 432–437. [Google Scholar] [CrossRef]
- Akhter, M.; Hossain, S.; Rahman, Q.B.; Molla, M.R. A study on histological grading of oral squamous cell carcinoma and its co-relationship with regional metastasis. J. Oral Maxillofac. Pathol. 2011, 15, 168–176. [Google Scholar] [CrossRef] [PubMed] [Green Version]
- Anneroth, G.; Batsakis, J.; Luna, M. Review of the literature and a recommended system of malignancy grading in oral squamous cell carcinomas. Scand. J. Dent. Res. 1987, 95, 229–249. [Google Scholar] [CrossRef]
- Mayes, P.A.; Murray, R.K.; Granner, D.K. Harper’s Biochemistry; McGraw-Hill Publishing Co: New York, NY, USA, 2000; pp. 169–170. ISBN 9780838536841. [Google Scholar]
- Klaunig, J.E.; Kamendulis, L.M.; Hocevar, B.A. Oxidative Stress and Oxidative Damage in Carcinogenesis. Toxicol. Pathol. 2010, 38, 96–109. [Google Scholar] [CrossRef] [Green Version]
- Tseng, S.-K.; Chang, M.-C.; Su, C.-Y.; Chi, L.-Y.; Chang, J.Z.-C.; Tseng, W.-Y.; Yeung, S.-Y.; Hsu, M.-L.; Jeng, J.-H. Arecoline induced cell cycle arrest, apoptosis, and cytotoxicity to human endothelial cells. Clin. Oral Investig. 2012, 16, 1267–1273. [Google Scholar] [CrossRef]
- Salzman, R.; Pácal, L.; Tomandl, J.; Kanková, K.; Tóthová, E.; Gál, B.; Kostrica, R.; Salzman, P. Elevated malondialdehyde correlates with the extent of primary tumor and predicts poor prognosis of oropharyngeal cancer. Anticancer Res. 2009, 29, 4227–4231. [Google Scholar] [PubMed]
- Fleming, I.D.; Cooper, J.S.; Henson, D.E.; Hutter, R.V.; Kennedy, B.J.; Murphy, G.; O’Sullivan, B.; Sobin, L.H.; Yarbro, J.W. AJCC Cancer Staging Manual, 5th ed.; Lippincott-Raven: Philadelphia, PA, USA, 1997; pp. 31–46. [Google Scholar]
- Bennardo, L.; Bennardo, F.; Giudice, A.; Passante, M.; Dastoli, S.; Morrone, P.; Provenzano, E.; Patruno, C.; Nisticò, S.P. Local Chemotherapy as an Adjuvant Treatment in Unresectable Squamous Cell Carcinoma: What Do We Know So Far? Curr. Oncol. 2021, 28, 2317–2325. [Google Scholar] [CrossRef] [PubMed]
- Pentangelo, G.; Nisticò, S.P.; Provenzano, E.; Cisale, G.Y.; Bennardo, L. Topical 5% Imiquimod Sequential to Surgery for HPV-Related Squamous Cell Carcinoma of the Lip. Medicina 2021, 57, 563. [Google Scholar] [CrossRef] [PubMed]


| Selection | Comparability | Exposure | |||||||||
|---|---|---|---|---|---|---|---|---|---|---|---|
| Study (Reference Number) | Case Definition | Case Representativeness | Control Selection | Control Definition | Matching Known Confounding Factor | Matching Potential Confounding Factor | Secure Patient Records | Interviewer Blinded to Cases and Control | Similarityin Case and Control Ascertainment | Non-Response Rate | Total Stars |
| Saroja et al. 1999 [14] | * | * | * | * | * | - | * | - | * | * | 8 |
| Sabitha et al. 1999 [15] | * | * | * | * | * | - | - | - | * | * | 7 |
| Balasenthil et al. 2000 [16] | * | * | * | * | * | - | * | - | * | - | 7 |
| Subapriya et al. 2002 [5] | * | * | * | * | * | * | * | - | * | - | 8 |
| Subapriya et al. 2003 [17] | * | * | * | * | * | - | * | - | - | * | 7 |
| Kolanjiappan et al. 2003 [18] | * | * | * | * | * | - | * | - | - | * | 7 |
| Beevi et al. 2004 [19] | * | * | * | * | * | * | * | - | * | - | 8 |
| Manoharan et al. 2005 [20] | * | * | * | * | * | * | * | - | * | * | 9 |
| Khanna et al. 2005 [21] | * | * | * | * | * | * | * | - | * | * | 9 |
| Rasheed et al. 2007 [22] | * | * | * | * | * | - | * | - | * | * | 8 |
| Rai B et al. 2008 [23] | * | * | * | * | * | - | * | - | * | - | 7 |
| Bathi et al. 2009 [24] | * | * | * | * | * | * | * | - | * | * | 9 |
| Chole et al. 2010 [25] | * | * | * | * | * | * | - | - | * | * | 8 |
| Raghavendra et al. 2010 [26] | * | * | * | * | * | - | * | - | * | * | 8 |
| Gokul et al. 2010 [27] | * | * | * | * | * | * | * | - | * | - | 8 |
| Burlakova et al. 2010 [28] | * | * | * | * | * | - | * | - | * | * | 8 |
| Arathi et al. 2010 [29] | * | * | * | * | * | - | * | - | * | * | 8 |
| Barut et al. 2011 [30] | * | * | * | * | * | * | * | - | * | * | 9 |
| Ramya et al. 2011 [31] | * | * | * | * | * | * | - | - | * | * | 8 |
| Srivastava K et al. 2012 [32] | * | * | * | * | * | - | - | - | * | * | 7 |
| Sree et al. 2013 [33] | * | * | * | * | * | - | * | - | - | * | 7 |
| Nath et al. 2014 [34] | * | * | * | * | - | - | * | - | - | * | 6 |
| Metgud et al. 2014 [12] | * | * | * | * | * | - | * | - | * | * | 8 |
| Rasool et al. 2014 [35] | * | * | * | * | * | - | * | - | - | * | 7 |
| Ganesan et al. 2014 [36] | * | * | * | * | * | - | * | - | * | * | 8 |
| Malik et al. 2014 [37] | * | * | * | * | * | - | * | - | * | * | 8 |
| Huo et al. 2014 [38] | * | * | * | * | * | - | - | - | * | * | 7 |
| Shetty et al. 2014 [33] | * | * | * | * | * | - | * | - | * | * | 8 |
| Bhat et al. 2015 [39] | * | * | * | * | * | - | * | - | - | * | 7 |
| Rai S et al. 2015 [40] | * | * | * | * | - | * | * | - | - | * | 7 |
| Thomas et al. 2015 [38] | * | * | * | * | * | - | * | - | - | * | 7 |
| Kaur et al. 2015 [41] | * | * | * | * | * | - | * | - | * | * | 8 |
| Shankarram et al. 2015 [42] | * | * | * | * | - | - | * | - | - | * | 6 |
| Mishra et al. 2016 [43] | * | * | * | * | - | * | * | - | * | - | 7 |
| Nyamathi et al. 2016 [44] | * | * | * | * | * | - | * | - | * | - | 7 |
| Srivastava K et al. 2016 [45] | * | * | * | * | * | * | * | - | * | * | 9 |
| Verma et al. 2017 [46] | * | * | * | * | * | - | * | - | * | * | 8 |
| Madhulatha et al. 2017 [47] | * | * | * | * | - | * | * | - | - | * | 7 |
| Banerjee et al. 2017 [48] | * | * | * | * | * | * | * | - | * | * | 9 |
| Basu et al. 2018 [49] | * | * | * | * | * | - | - | - | - | * | 6 |
| Arya et al. 2019 [8] | * | * | * | * | * | - | * | - | * | * | 8 |
| Sabarathnam et al. 2019 [50] | * | * | * | * | - | - | - | - | * | * | 6 |
| Babiuch et al. 2019 [51] | * | * | * | * | * | * | * | - | * | * | 9 |
| Shahi et al. 2020 [52] | * | * | * | * | * | * | * | - | * | * | 9 |
| Oswal et al. 2020 [53] | * | * | * | * | * | - | * | - | - | * | 7 |
| Abdelkawy et al. 2020 [54] | * | * | * | * | * | - | * | - | * | * | 8 |
| Author | OSCC | Control | Method | ||||||
|---|---|---|---|---|---|---|---|---|---|
| Sample | Unit | Mean | Std. Dev | Sample Size | Mean | Std. Dev | Sample Size | ||
| Saroja 1999 [14] * | Ti | nmol/100 mg protein | 86.56 | 8.03 | 33 | 124.3 | 7.86 | 33 | Ohkawa et al. [55] |
| Sabitha 1999 [15] | Se | ηmol/mL | 0.598 | 0.169 | 12 | 12 | Suematsu et al. [56] | ||
| Balasenthil 2000 [16] * | Ti | nmol/100 mg protein | 85.5 | 4.4 | 10 | 125.3 | 4.8 | 10 | Ohkawa et al. [55] |
| Subapriya 2002 [5] | Ti | nmol/100 mg protein | 97.84 | 9.32 | 24 | 24 | Ohkawa et al. [55] | ||
| Subapriya 2002 [5] * | Pl | nmol/mL | 6.37 | 1.12 | 24 | 4.38 | 1.8 | 24 | Yagi et al. [57] |
| Subapriya 2002 [5] | Er | pm/mg Hg | 1.98 | 0.21 | 24 | 1.11 | 0.13 | 24 | Donnan et al. [58] |
| Subapriya 2003 [17] * | Pl | nmol/mL | 6.27 | 0.72 | 6 | 3.81 | 0.35 | 12 | Yagi et al. [57] |
| Subapriya 2003 [17] | Er | mg/dL | 39.44 | 3.6 | 6 | 34.61 | 3.3 | 12 | Buege et al. [59] |
| Kolanjiappan 2003 [18] * | Ti | nmol/100 mg protein | 93.4 | 10.5 | 48 | 123.9 | 14.5 | 16 | Ohkawa et al. [55] |
| Beevi 2004 [19] * | Pl | nmol/mL | 5.57 | 0.97 | 15 | 2.02 | 0.23 | 15 | Draper et al. [60] |
| Manoharan 2005 [20] * | Pl | nmol/mL | 3.75 | 0.87 | 48 | 2.09 | 0.17 | 16 | Yagi et al. [57] |
| Manoharan 2005 [20] | Er | pm/mg Hb | 3.35 | 0.43 | 48 | 2.43 | 0.17 | 16 | Donnan et al. [58] |
| Manoharan 2005 [20] | Er memb | nmol/mg protein | 0.62 | 0.2 | 48 | 0.34 | 0.06 | 16 | Donnan et al. [58] |
| Khanna 2005 [21] | Se | nmol/L | 0.67 | 0.57 | 20 | 0.321 | 0.06 | 20 | Bergmeyer et al. [61] |
| Rasheed 2007 [22] * | Pl | nmol/mL | 4.16 | 0.47 | 24 | 2.26 | 0.24 | 24 | Draper et al. [60] |
| Rai B 2008 [23] | Sa | ng/mL | 5.23 | 0.41 | 12 | 3.415 | 0.44 | 30 | Buege et al. [59] |
| Bathi 2009 [24] | Pl | 3.543 | 30 | 2.517 | 30 | Jain et al. [62] | |||
| Chole 2010 [25] * | Se | ηmol/mL | 14.34 | 1.43 | 30 | 5.107 | 2.32 | 30 | Ohkawa et al. [55] |
| Raghavendra 2010 [26] | Er | nmol/mL | 7.22 | 1.52 | 25 | 4.379 | 0.97 | 25 | Stocks et al. [63] |
| Gokul 2010 [27] | Er | nmol/g Hg | 159.8 | 36.4 | 18 | 139.4 | 22.3 | 25 | Ohkawa et al. [55] |
| Gokul 2010 [27] | Ti | nmol/mg protein | 1.12 | 0.76 | 18 | 0.68 | 0.33 | 18 | Ohkawa et al. [55] |
| Burlakova 2010 [28] | Er | µmol/106 Er | 3.5 | 0.52 | 50 | 3.92 | 1.06 | 54 | Valenzuela et al. [64] |
| Arathi 2010 [29] | Sa | nmol/L | 0.017 | 0.01 | 25 | 0.002 | 0 | 25 | Stocks et al. [63] |
| Barut 2011 [30] * | Pl | nmol/mL | 7.4 | 2.55 | 29 | 4.9 | 1.25 | 29 | Buege et al. [59] |
| Ramya 2011 [31] * | Se | nmol/mL | 1.79 | 0.29 | 40 | 1.16 | 0.31 | 40 | Ohkawa et al. [55] |
| Srivastava K 2012 [32] * | Pl | nmol/mL | 5.5 | 1.7 | 20 | 2.05 | 0.94 | 20 | Yagi et al. [57] |
| Sree 2013 [65] * | Se | nmol/mL | 5.32 | 1.12 | 30 | 3.18 | 0.23 | 30 | Ohkawa et al. [55] |
| Nath 2014 [34] * | Se | nmol/mL | 55.04 | 13.7 | 120 | 27.43 | 2.62 | 45 | Ohkhawa et al. [55] |
| Metgud 2014 [12] * | Se | nmol/mL | 6.02 | 0.43 | 40 | 2.93 | 0.79 | 30 | Okhawa et al. [55] |
| Metgud 2014 [12] * | Sa | nmol/mL | 0.32 | 0.03 | 40 | 0.2 | 0.01 | 30 | Ohkawa et al. [55] |
| Rasool 2014 [35] | Pl | µmol/mL | 4.55 | 1.48 | 30 | 3.15 | 0.58 | 10 | Spectrophotometry |
| Rasool 2014 [35] | Sa | µmol/mL | 0.54 | 0.25 | 30 | 0.19 | 0.02 | 10 | Spectrophotometry |
| Ganesan 2014 [36] * | Se | nmol/mL | 1.824 | 0.55 | 20 | 0.712 | 0.13 | 20 | Okhawa et al. [55] |
| Ganesan 2014 [36] * | Sa | nmol/mL | 1.007 | 0.16 | 20 | 0.349 | 0.09 | 20 | Okhawa et al. [55] |
| Ganesan 2014 [36] | Ti | nmol/mL | 1.115 | 0.12 | 20 | 0.59 | 0.13 | 20 | Ohkawa et al. [55] |
| Malik 2014 [37] * | Se | nmol/mL | 18.72 | 5.56 | 45 | 8.5 | 2.83 | 30 | Ohkawa et al. [55] |
| Huo 2014 [38] | Er | nmol/g Hg | 164 | 25 | 144 | 25 | Ohkawa et al. [55] | ||
| Huo 2014 [38] | Ti | nmol/mg protein | 3 | 15 | 0.8 | 15 | Ohkawa et al. [55] | ||
| Shetty 2014 [33] * | Sa | nmol/mL | 0.931 | 0.03 | 50 | 0.181 | 0.03 | 65 | TBA-TCA |
| Bhat 2015 [39] * | Pl | nmol/mL | 5.58 | 0.98 | 30 | 2.12 | 0.23 | 30 | Draper et al. [60] |
| Rai S 2015 [40] | Pl | 13.16 | 0.55 | 20 | 2.92 | 0.36 | 20 | Satoh et al. [66] | |
| Thomas 2015 [67] * | Pl | nmol/mL | 5.2 | 0.49 | 20 | 2.9 | 0.49 | 20 | Mahfouz et al. [68] |
| Kaur 2015 [41] * | Sa | nmol/mL | 1 | 0.21 | 40 | 0.08 | 0.07 | 40 | Buege et al. [59] |
| Shankaram 2015 [42] * | Sa | nmol/mL | 5.94 | 0.9 | 25 | 4.43 | 0.81 | 25 | NWLSS NWK |
| Mishra 2016 [43] | Se | 14.15 | 0.47 | 20 | 2.92 | 0.36 | 20 | Satoh et al. [66] | |
| Nyamathi 2016 [44] * | Se | nmol/mL | 13.22 | 2.4 | 10 | 3.4 | 0.56 | 10 | Satoh et al. [66] |
| Srivastava K 2016 [45] | Ti | nmol/mL | 87.53 | 2.65 | 20 | 127.9 | 2.97 | 20 | Ohkawa et al. [55] |
| Verma 2017 [46] | Pl | µmol/mL | 3.38 | 0.14 | 20 | 2.45 | 0.13 | 20 | Sinnhuber et al. [69] |
| Madhulatha 2017 [47] | Se | 4.34 | 1.69 | 25 | 2.97 | 1.09 | 25 | Gavino et al. [70] | |
| Bannerjee 2017 [48] | Mi | nmol/mg protein | 6.093 | 0.76 | 60 | 1.49 | 0.19 | 20 | Ogura et al. [71] |
| Basu 2018 [49] * | Pl | nmol/mL | 20.35 | 4.15 | 30 | 13.94 | 2.51 | 50 | Yagi et al. [57] |
| Arya 2019 [8] * | Se | nmol/mL | 57 | 26.8 | 50 | 10.5 | 8.43 | 50 | Oxitek Assay kit |
| Sabarathinam 2019 [50] | Sa | µg/mg | 2.7 | 0.15 | 10 | 0.9 | 0.05 | 15 | Spectrophotometry |
| Babiuch 2019 [51] | Sa | nmol/L | 8.58 | 6.23 | 20 | 2.32 | 5.36 | 20 | Kit-My BioSource (USA) |
| Shahi 2020 [52] | Pl | µmol/mL | 0.82 | 0.7 | 25 | 0.39 | 0.2 | 45 | Nair et al. [72] |
| Oswal 2020 [53] | Se | 13.4 | 25 | 2.91 | 30 | ||||
| Abdelkawy 2020 [54] * | Sa | nmol/mL | 3.62 | 0.61 | 20 | 1.03 | 0.19 | 20 | ELISA kit Sun Long Biotech |
| Author | OSCC Stage II | OSCC Stage III | OSCC Stage IV | ||||||||
|---|---|---|---|---|---|---|---|---|---|---|---|
| Sample | Sample Size | Unit | Mean | Std Dev | Mean | Std Dev | Mean | Std Dev | Stat Sig | Clinical Stage Criteria | |
| Manoharan 2005 [20] | Pl | 48 | nmol/mL | 2.88 | 0.24 | 3.54 | 0.88 | 4.83 | 1.51 | <0.01 | Sobin et al. (UICC) [73] |
| Srivastava K 2012 [32] | Pl | 20 | nmol/mL | 3.2 | 1.09 | 5.42 | 0.53 | 7.12 | 0.35 | <0.001 | TNM |
| Manoharan 2005 [20] | Er | 48 | pm/mg Hb | 2.67 | 0.21 | 3.35 | 0.91 | 4.02 | 0.16 | <0.01 | Sobin et al. (UICC) [73] |
| Manoharan 2005 [20] | Er memb | 48 | nmol/mg protein | 0.41 | 0.08 | 0.6 | 0.24 | 0.87 | 0.28 | <0.01 | Sobin et al. (UICC) [73] |
| Kolanjiappan 2003 [18] | Ti | 48 | nmol/100 mg protein | 105.4 | 11.1 | 94.3 | 10.4 | 80.51 | 9.96 | <0.01 | AJCC 1992 [74] |
| Srivastava K 2016 [32] | Ti | 20 | nmol/mL | 89.64 | 0.66 | 88.1 | 1.78 | 85.72 | 2.97 | > 0.05 | TNM |
| Banerjee 2017 [48] | Mi | 60 | nmol/mg protein | 8.25 | 0.841 | 3.3 | 0.743 | 5.33 | 0.659 | 0.986 | TNM |
| T1 | T2 | T3 | T4 | ||||||||
| Babiuch 2019 [51] | Sa | 20 | 10.5 | 8.22 | 8.7 | 5.85 | 8.59 | 7.57 | 4.16 | 0.73 | T Stage |
| Author | OSCC (WD) | OSCC (MD) | OSCC (PD) | ||||||||
|---|---|---|---|---|---|---|---|---|---|---|---|
| Sample | Sample SIZE | Unit | Mean | Std Dev | Mean | Std Dev | Mean | Std Dev | Stat Sig | Histological Grade Criteria | |
| Rai S 2015 [40] | Pl | 20 | 12.98 | 0.67 | 13.34 | 0.42 | - | - | <0.001 | Akhter et al. [75]. | |
| Chole 2010 [25] | Se | 30 | ηmol/mL | 14.81 | 1.54 | 14.68 | 1.8 | 13.2 | 0.54 | >0.05 | |
| Nath 2014 [34] | Se | 120 | nmol/mL | 39.11 | 9.031 | 49.6 | 6.53 | 76.4 | 25.68 | <0.01 | Anneroth et al. [76] |
| Metgud 2014 [12] | Se | 40 | nmol/mL | 6.12 | 0.36 | 5.92 | 0.49 | - | - | > 0.05 | |
| Arya 2019 [8] | Se | 50 | nmol/mL | 59.81 | 26.9 | 53.55 | 28.13 | 33.79 | 1.7 | >0.05 | Bryne et al. [74] |
| Metgud 2014 [12] | Sa | 40 | nmol/mL | 0.33 | 0.035 | 0.325 | 0.024 | - | - | >0.05 | |
Publisher’s Note: MDPI stays neutral with regard to jurisdictional claims in published maps and institutional affiliations. |
© 2021 by the authors. Licensee MDPI, Basel, Switzerland. This article is an open access article distributed under the terms and conditions of the Creative Commons Attribution (CC BY) license (https://creativecommons.org/licenses/by/4.0/).
Share and Cite
Mohideen, K.; Sudhakar, U.; Balakrishnan, T.; Almasri, M.A.; Al-Ahmari, M.M.; Al Dira, H.S.; Suhluli, M.; Dubey, A.; Mujoo, S.; Khurshid, Z.; et al. Malondialdehyde, an Oxidative Stress Marker in Oral Squamous Cell Carcinoma—A Systematic Review and Meta-Analysis. Curr. Issues Mol. Biol. 2021, 43, 1019-1035. https://0-doi-org.brum.beds.ac.uk/10.3390/cimb43020072
Mohideen K, Sudhakar U, Balakrishnan T, Almasri MA, Al-Ahmari MM, Al Dira HS, Suhluli M, Dubey A, Mujoo S, Khurshid Z, et al. Malondialdehyde, an Oxidative Stress Marker in Oral Squamous Cell Carcinoma—A Systematic Review and Meta-Analysis. Current Issues in Molecular Biology. 2021; 43(2):1019-1035. https://0-doi-org.brum.beds.ac.uk/10.3390/cimb43020072
Chicago/Turabian StyleMohideen, Khadijah, Uma Sudhakar, Thayumanavan Balakrishnan, Mazen A. Almasri, Manea Musa Al-Ahmari, Hajar Saeed Al Dira, Malath Suhluli, Alok Dubey, Sheetal Mujoo, Zohaib Khurshid, and et al. 2021. "Malondialdehyde, an Oxidative Stress Marker in Oral Squamous Cell Carcinoma—A Systematic Review and Meta-Analysis" Current Issues in Molecular Biology 43, no. 2: 1019-1035. https://0-doi-org.brum.beds.ac.uk/10.3390/cimb43020072