Computational Fluid Dynamics as an Engineering Tool for the Reconstruction of Hemodynamics after Carotid Artery Stenosis Operation: A Case Study

 ,
,  ,
, 
Abstract
:1. Introduction
2. Experimental Section
2.1. Medical Data
2.2. Mathematical Model
2.3. Mathematical Model Verification
3. Results
4. Discussion
5. Conclusions
Author Contributions
Acknowledgments
Conflicts of Interest
References
- Nicol, M.B.; Thrift, A.G. Knowledge of risk factors and warning signs of stroke. Vasc. Health Risk Manag. 2005, 1, 137–147. [Google Scholar] [CrossRef] [PubMed] [Green Version]
- Yamamoto, F.I. Ischemic stroke in young adults: An overview of etiological aspects. Arq. Neuro-Psiq. 2012, 70, 462–466. [Google Scholar] [CrossRef]
- Liu, C.H.; Lin, J.R.; Liou, C.W.; Lee, J.D.; Peng, T.I.; Lee, M.; Lee, T.H.; SRICHS Group. Causes of death in different subtypes of ischemic and hemorrhagic stroke. Angiology 2017, 1, 3319717738687. [Google Scholar]
- Tsze, D.S.; Valente, J.H. Pediatric stroke: A review. Emerg. Med. Int. 2011, 2011, 734506. [Google Scholar] [CrossRef] [PubMed]
- Idro, R.; Marsh, K.; John, C.C.; Newton, C.R. Cerebral malaria: Mechanisms of brain injury and strategies for improved neurocognitive outcome. Pediatr. Res. 2010, 68, 267–274. [Google Scholar] [CrossRef] [PubMed]
- Wang, Y.; Lu, Z.; Sun, S.; Yang, Y.; Zhang, B.; Kang, Z.; Hu, X.; Dai, Y. Risk factors, topographic patterns and mechanism analysis of intracranial atherosclerotic stenosis ischemic stroke. Int. J. Neurosci. 2017, 127, 267–275. [Google Scholar] [CrossRef] [PubMed]
- Lee, S.J.; Lee, D.G. Distribution of atherosclerotic stenosis determining early neurologic deterioration in acute ischemic stroke. PLoS ONE 2017, 12, e0185314. [Google Scholar] [CrossRef] [PubMed]
- Filardi, V. Carotid artery stenosis near a bifurcation investigated by fluid dynamic analyses. Neuroradiol. J. 2013, 26, 439–453. [Google Scholar] [CrossRef] [PubMed]
- Crea, F.; Libby, P. Acute coronary syndromes: The way forward from mechanisms to precision treatment. Circulation 2017, 136, 1155–1166. [Google Scholar] [CrossRef] [PubMed]
- Kim, J.S.; Nah, H.W.; Park, S.M.; Kim, S.K.; Cho, K.H.; Lee, J.; Lee, Y.S.; Kim, J.; Ha, S.W.; Kim, E.G.; et al. Risk factors and stroke mechanisms in atherosclerotic stroke: Intracranial compared with extracranial and anterior compared with posterior circulation disease. Stroke 2012, 43, 3313–3318. [Google Scholar] [CrossRef] [PubMed]
- Campbell, B.C.; Christensen, S.; Levi, C.R.; Desmond, P.M.; Donnan, G.A.; Davis, S.M.; Parsons, M.W. Comparison of computed tomography perfusion and magnetic resonance imaging perfusion-diffusion mismatch in ischemic stroke. Stroke 2012, 43, 2648–2653. [Google Scholar] [CrossRef] [PubMed]
- Vilela, P.; Rowley, H.A. Brain ischemia: CT and MRI techniques in acute ischemic stroke. Eur. J. Radiol. 2017, 96, 162–172. [Google Scholar] [CrossRef] [PubMed]
- Hirano, T. Searching for salvageable brain: The detection of ischemic penumbra using various imaging modalities? J. Stroke Cerebrovasc. Dis. 2014, 23, 795–798. [Google Scholar] [CrossRef] [PubMed]
- Iannaccone, F.; De Beule, M.; Verhegghe, B.; Segers, P. Computer simulations in stroke prevention: Design tools and virtual strategies towards procedure planning. Cardiovasc. Eng. Technol. 2013, 4, 291–308. [Google Scholar] [CrossRef]
- Wardlaw, J.M.; Sandercock, P.A.; Berge, E. Thrombolytic therapy with recombinant tissue plasminogen activator for acute ischemic stroke: Where do we go from here? A cumulative meta-analysis. Stroke 2003, 34, 1437–1442. [Google Scholar] [CrossRef] [PubMed]
- Thierfelder, K.M.; Sommer, W.H.; Baumann, A.B.; Klotz, E.; Meinel, F.G.; Strobl, F.F.; Nikolaou, K.; Reiser, M.F.; von Baumgarten, L. Whole-brain CT perfusion: Reliability and reproducibility of volumetric perfusion deficit assessment in patients with acute ischemic stroke. Neuroradiology 2013, 55, 827–835. [Google Scholar] [CrossRef] [PubMed]
- Dasari, P.; Venkatesan, B.; Thyagarajan, C.; Balan, S. Expectant and medical management of placenta increta in a primiparous woman presenting with postpartum haemorrhage: The role of Imaging. J. Radiol. Case Rep. 2010, 4, 32–40. [Google Scholar] [CrossRef] [PubMed]
- Paliwal, N.; Damiano, R.J.; Varble, N.A.; Tutino, V.M.; Dou, Z.; Siddiqui, A.H.; Meng, H. Methodology for computational fluid dynamic validation for medical use: Application to intracranial aneurysm. J. Biomech. Eng. 2017, 1, 139. [Google Scholar] [CrossRef] [PubMed]
- Liu, J.; Sun, Q.; Qian, Y.; Hong, H.; Liu, J. Numerical simulation and hemodynamic analysis of the modified Blalock-Taussig shunt. Conf. Proc. Annu. Int. Conf. IEEE Eng. Med. Biol. Soc. IEEE Eng. Med. Biol. Soc. Annu. Conf. 2013, 2013, 707–710. [Google Scholar]
- Zhang, W.; Liu, J.; Yan, Q.; Liu, J.; Hong, H.; Mao, L. Computational haemodynamic analysis of left pulmonary artery angulation effects on pulmonary blood flow. Interact. Cardiovasc. Thorac. Surg. 2016, 23, 519–525. [Google Scholar] [CrossRef] [PubMed] [Green Version]
- Polanczyk, A.; Piechota-Polanczyk, A.; Stefanczyk, L. A new approach for the pre-clinical optimization of a spatial configuration of bifurcated endovascular prosthesis placed in abdominal aortic aneurysms. PLoS ONE 2017, 12, e0182717. [Google Scholar] [CrossRef] [PubMed]
- Polanczyk, A.; Podyma, M.; Trebinski, L.; Chrzastek, J.; Zbicinski, I.; Stefanczyk, L. A novel attempt to standardize results of CFD simulations basing on spatial configuration of aortic stent-grafts. PLoS ONE 2016, 11, e0153332. [Google Scholar] [CrossRef] [PubMed]
- Polanczyk, A.; Podyma, M.; Stefanczyk, L.; Szubert, W.; Zbicinski, I. A 3D model of thrombus formation in a stent-graft after implantation in the abdominal aorta. J. Biomech. 2015, 48, 425–431. [Google Scholar] [CrossRef] [PubMed]
- Polanczyk, A.; Podyma, M.; Stefanczyk, L.; Zbicinski, I. Effects of stent-graft geometry and blood hematocrit on hemodynamic in abdominal aortic aneurysm. Chem. Process Eng. 2012, 33, 53–61. [Google Scholar] [CrossRef]
- Mattes, J.; Chemelli, A.; Wick, M.; Soimu, D.; Pontow, C.; Lopez, A.; Netzer, M.; Chemelli-Steingruber, I.E. Evaluation of a new computerized analysis system developed for the processing of CT follow-up scans after EVR of infrarenal aneurysm. Eur. J. Radiol. 2012, 81, 496–501. [Google Scholar] [CrossRef] [PubMed]
- Rouet, L.; Mory, B.; Attia, E.; Long, A.; Ardon, R. A minimally interactive and reproducible method for abdominal aortic aneurysm quantification in 3D ultrasound and computed tomography with implicit template deformations. Comput. Med. Imaging Graph. 2017, 58, 75–85. [Google Scholar] [CrossRef] [PubMed]
- Chen, L.; Tang, W.; John, N.W. Real-time geometry-aware augmented reality in minimally invasive surgery. Healthc. Technol. Lett. 2017, 4, 163–167. [Google Scholar] [CrossRef] [PubMed] [Green Version]
- Lindstrom, S.B.; Uhlin, F.; Bjarnegard, N.; Gylling, M.; Nilsson, K.; Svensson, C.; Yngman-Uhlin, P.; Länne, T. Computer-aided evaluation of blood vessel geometry from acoustic images. J. Ultrasound Med. 2018, 37, 1025–1031. [Google Scholar] [CrossRef] [PubMed]
- Kakkos, S.K.; Kakisis, I.; Tsolakis, I.A.; Geroulakos, G. Endarterectomy achieves lower stroke and death rates compared with stenting in patients with asymptomatic carotid stenosis. J. Vasc. Surg. 2017, 66, 607–617. [Google Scholar] [CrossRef] [PubMed]
- Arhuidese, I.; Obeid, T.; Nejim, B.; Locham, S.; Hicks, C.W.; Malas, M.B. Stenting versus endarterectomy after prior ipsilateral carotid endarterectomy. J. Vasc. Surg. 2017, 65, 1–11. [Google Scholar] [CrossRef] [PubMed]
- Long, Q.; Xu, X.Y.; Kohler, U.; Robertson, M.B.; Marshall, I.; Hoskins, P. Quantitative comparison of CFD predicted and MRI measured velocity fields in a carotid bifurcation phantom. Biorheology 2002, 39, 467–474. [Google Scholar] [PubMed]
- Liu, H.; Lan, L.; Leng, X.; Ip, H.L.; Leung, T.W.H.; Wang, D.; Wong, K.S. Impact of side branches on the computation of fractional flow in intracranial arterial stenosis using the computational fluid dynamics method. J. Stroke Cerebrovasc. Dis. 2018, 27, 44–52. [Google Scholar] [CrossRef] [PubMed]
- Schrauwen, J.T.C.; Coenen, A.; Kurata, A.; Wentzel, J.J.; van der Steen, A.F.W.; Nieman, K.; Gijsen, F.J.H. Functional and anatomical measures for outflow boundary conditions in atherosclerotic coronary bifurcations. J. Biomech. 2016, 49, 2127–2134. [Google Scholar] [CrossRef] [PubMed]
- Jia, Q.; Liu, H.; Li, Y.; Wang, X.; Jia, J.; Li, Y. Combination of magnetic resonance angiography and computational fluid dynamics may predict the risk of stroke in patients with asymptomatic carotid plaques. Med. Sci. Monit. Int. Med. J. Exp. Clin. Res. 2017, 23, 479–488. [Google Scholar] [CrossRef]
- Srivastava, V.P.; Rastogi, R. Blood flow through a stenosed catheterized artery: Effects of hematocrit and stenosis shape. Comput. Math. Appl. 2010, 59, 1377–1385. [Google Scholar] [CrossRef]
- Diamond, S.L.; Purvis, J.; Chatterjee, M.; Flamm, M. Systems biology of platelet-vessel wall interactions. Front. Physiol. 2013, 26, 229. [Google Scholar] [CrossRef] [PubMed]
- Pivkin, I.V.; Richardson, P.D.; Karniadakis, G. Blood flow velocity effects and role of activation delay time on growth and form of platelet thrombi. Proc. Natl. Acad. Sci. USA 2006, 46, 17164–17169. [Google Scholar] [CrossRef] [PubMed]
- Jung, J.; Hassanein, A. Three-phase CFD analytical modeling of blood flow. Med. Eng. Phys. 2008, 30, 91–103. [Google Scholar] [CrossRef] [PubMed]
- Jung, J.; Lyczkowski, R.W.; Panchal, C.B.; Hassanein, A. Multiphase hemodynamic simulation of pulsatile flow in a coronary artery. J. Biomech. 2006, 39, 2064–2073. [Google Scholar] [CrossRef] [PubMed]
- Leiderman, K.; Fogelson, A. An overview of mathematical modeling of thrombus formation under flow. Thromb. Res. 2014, 133, S12–S14. [Google Scholar] [CrossRef] [PubMed]
- Wu, Z.; Xu, Z.; Kim, O.; Alber, M. Three-dimensional multi-scale model of deformable platelets adhesion to vessel wall in blood flow. Philos. Trans. R. Soc. 2014, 6, 372. [Google Scholar] [CrossRef] [PubMed]
- Kamangar, S.; Badruddin, I.A.; Ameer Ahamad, N.; Soudagar, M.E.M.; Govindaraju, K.; Nik-Ghazali, N.; Salman Ahmed, N.J.; Yunus Khan, T.M. Patient specific 3-d modeling of blood flow in a multi-stenosed left coronary artery. Bio-Med. Mater. Eng. 2017, 28, 257–266. [Google Scholar] [CrossRef] [PubMed]


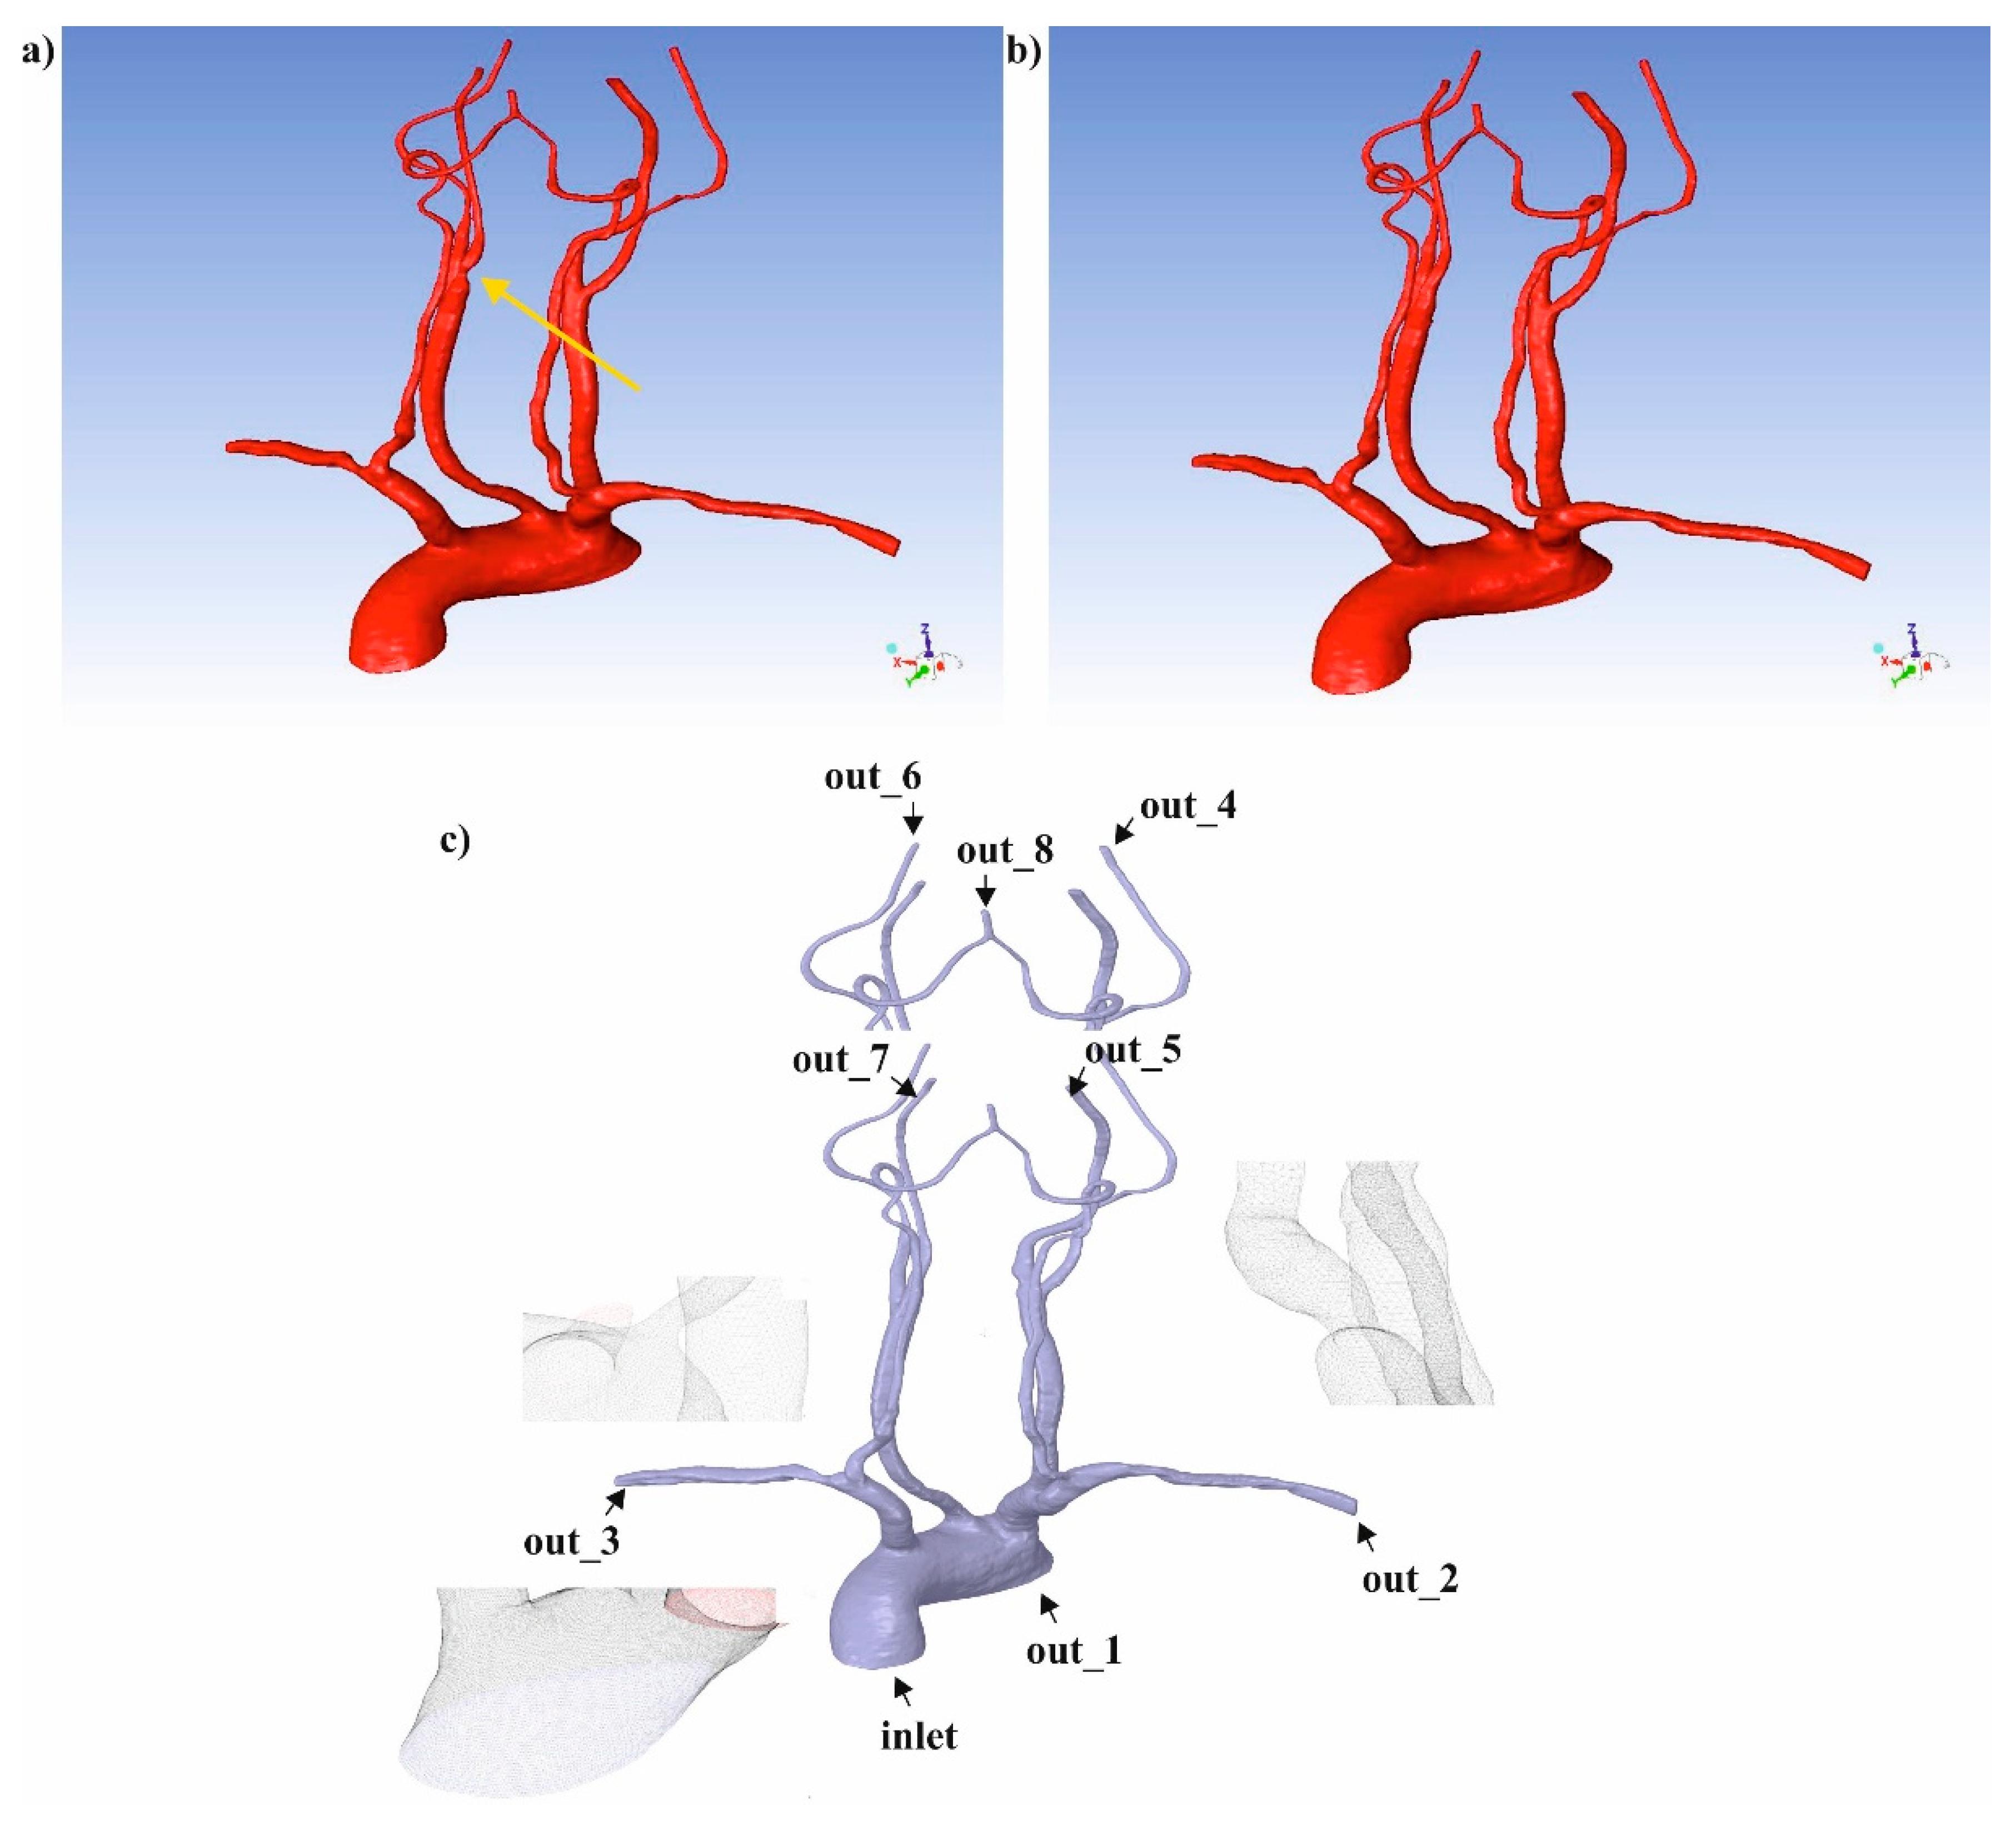
| Artery Type | Boundary Conditions | Pressure (Pa) | ||
|---|---|---|---|---|
| −20% Pressure | 0% Pressure | +20% Pressure | ||
| Artery arch | out_1 | 17,331.60 | 17,331.60 | 17,331.60 |
| Right subclavian artery | out_2 | 15,998.40 | 15,998.40 | 15,998.40 |
| Left subclavian artery | out_3 | 15,998.40 | 15,998.40 | 15,998.40 |
| Right external carotid artery | out_4 | 13,865.30 | 19,998.00 | 23,997.60 |
| Right internal carotid artery | out_5 | 13,865.30 | 19,998.00 | 23,997.60 |
| Left external carotid artery | out_6 | 13,865.30 | 19,998.00 | 23,997.60 |
| Left internal carotid artery | out_7 | 13,865.30 | 19,998.00 | 23,997.60 |
| Basilar artery | out_8 | 13,865.30 | 19,998.00 | 23,997.60 |
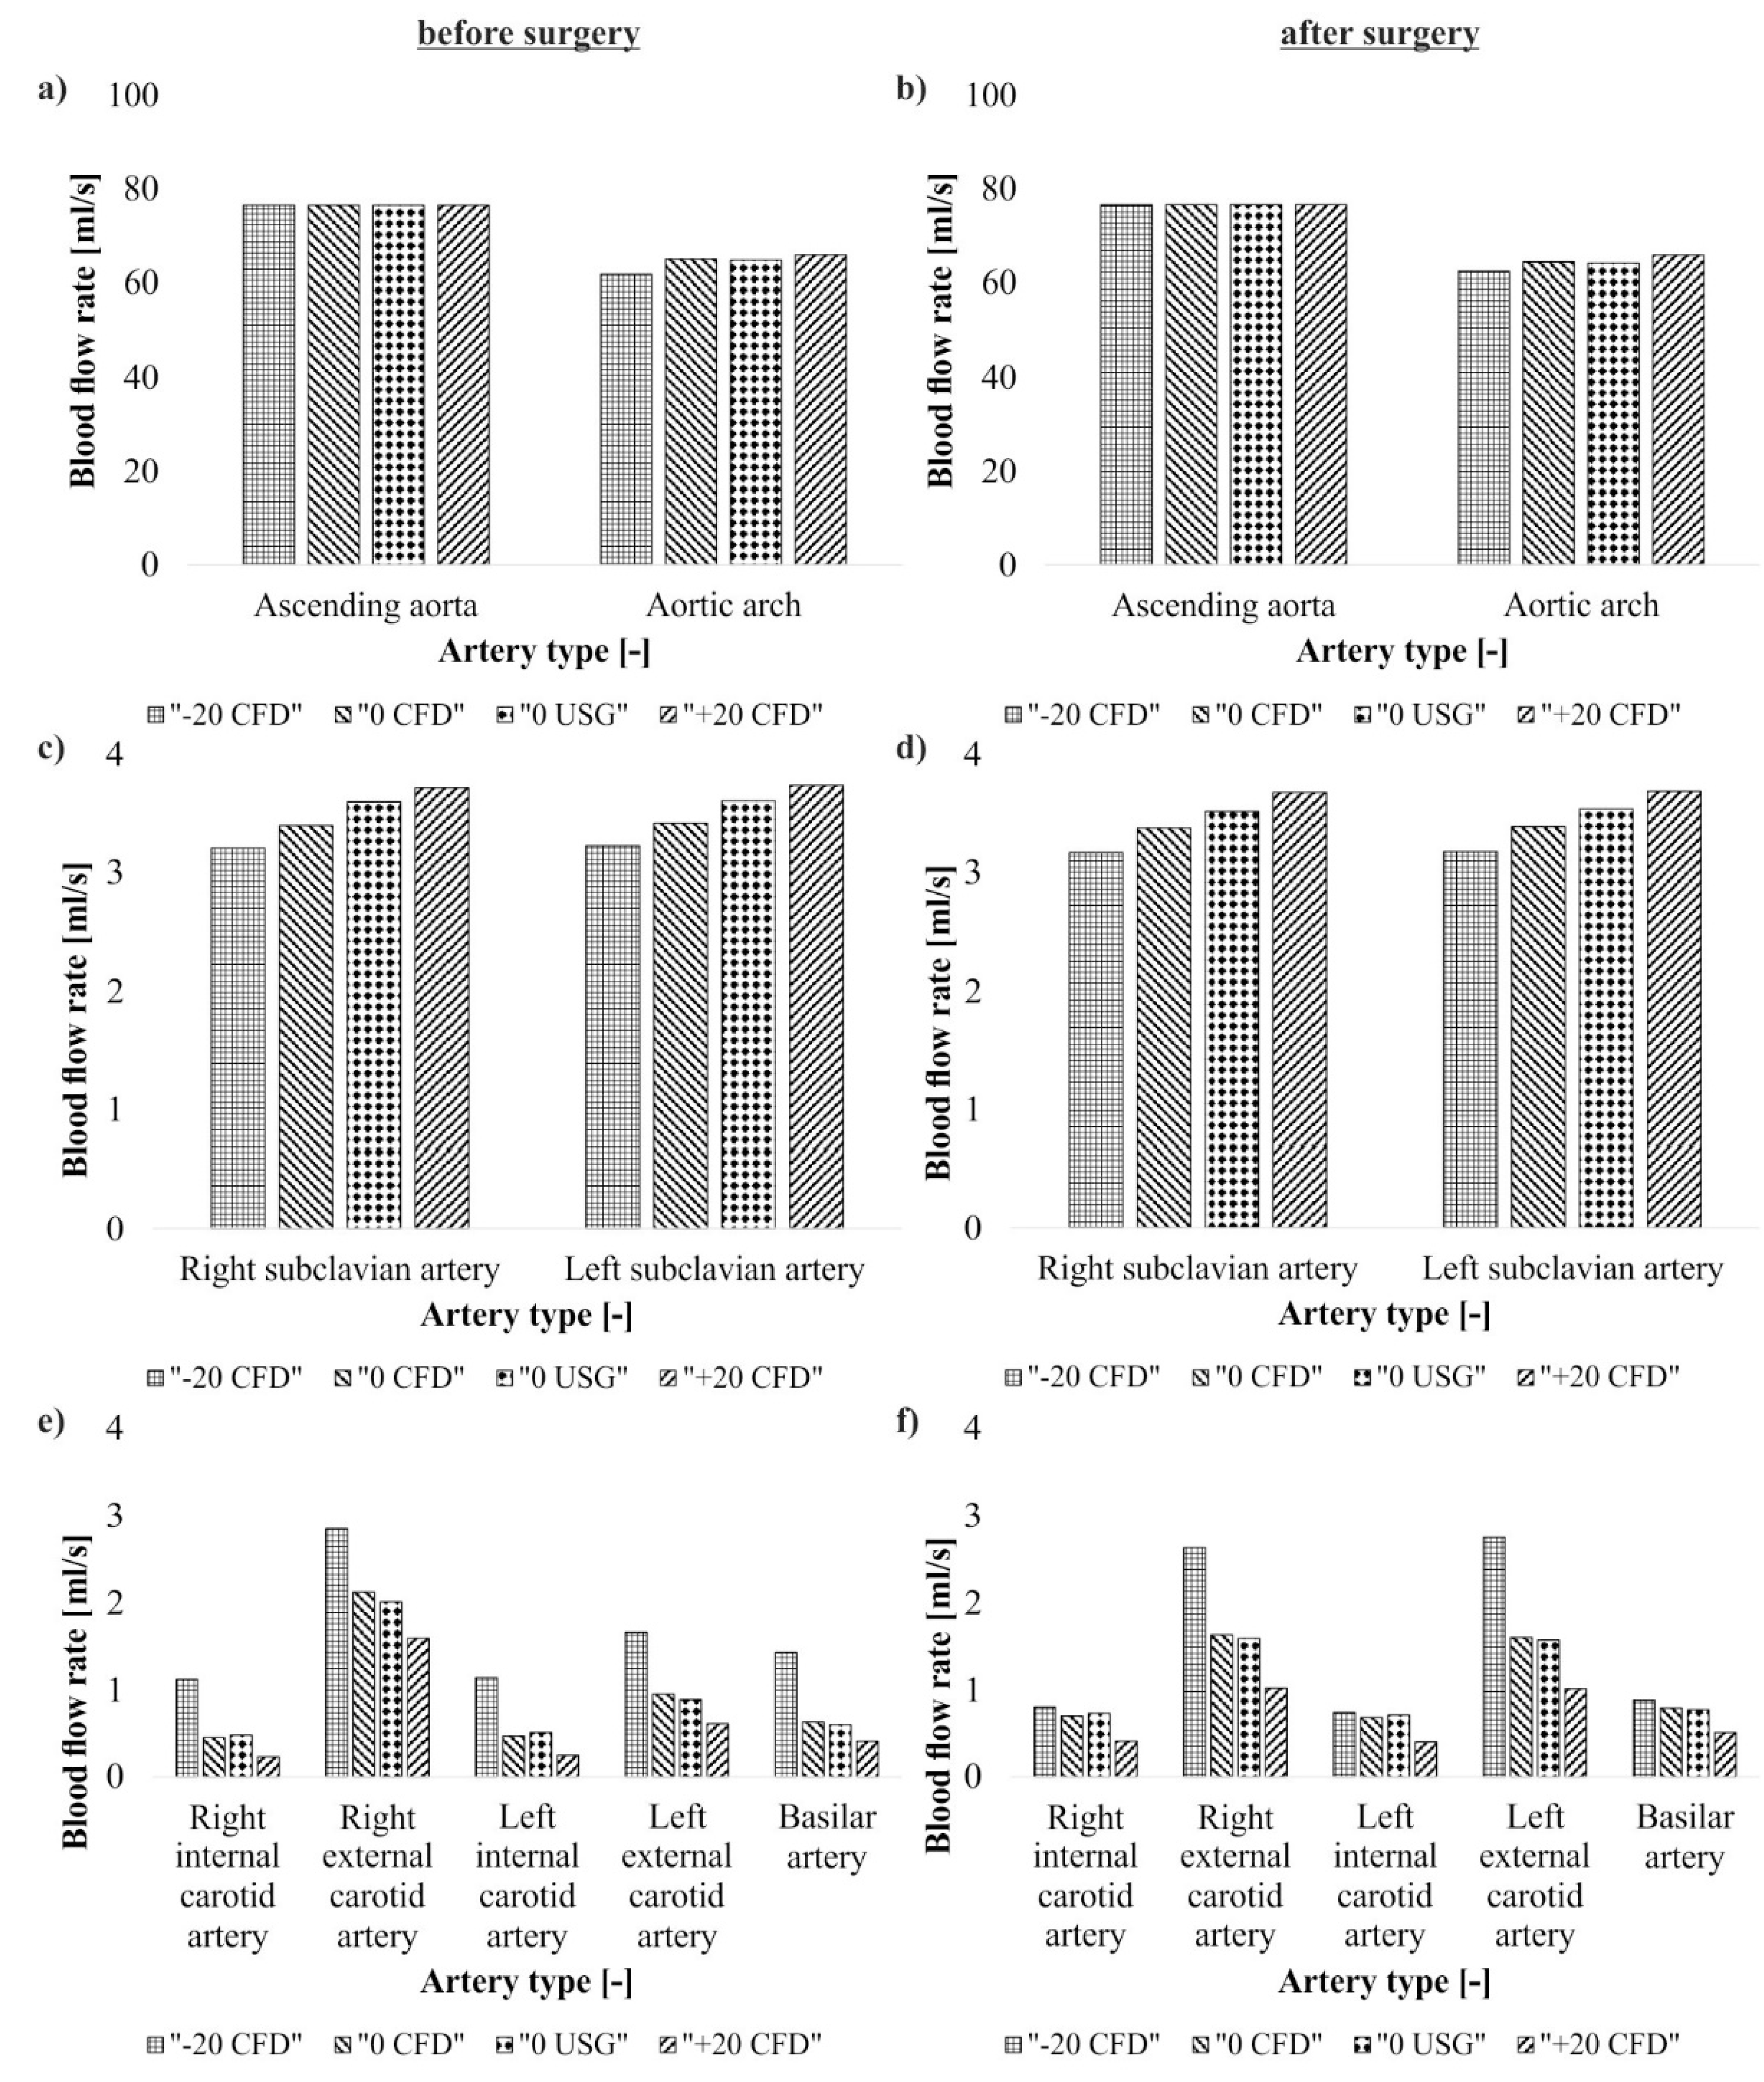
| Artery Type | Blood Flow (mL/s) | |||||||
|---|---|---|---|---|---|---|---|---|
| CFD—Before Surgical Intervention | CFD—After Surgical Intervention | US-Doppler | ||||||
| Before Surgical Intervention | After Surgical Intervention | |||||||
| −20% Pressure | 0% Pressure | +20% Pressure | −20% Pressure | 0% Pressure | +20% Pressure | 0% Pressure | 0% Pressure | |
| Ascending aorta | 76.56 | 76.56 | 76.56 | 76.69 | 76.69 | 76.69 | 76.56 | 76.69 |
| Aortic arch | 61.91 | 65.12 | 66.01 | 62.54 | 64.52 | 65.97 | 64.86 | 64.26 |
| Right subclavius artery | 3.21 | 3.40 | 3.72 | 3.17 | 3.38 | 3.68 | 3.60 | 3.52 |
| Left subclavius artery | 3.23 | 3.42 | 3.74 | 3.18 | 3.39 | 3.69 | 3.61 | 3.54 |
| Right internal carotid artery | 1.12 | 0.45 | 0.23 | 0.80 | 0.70 | 0.41 | 0.48 | 0.73 |
| Right external carotid artery | 2.85 | 2.12 | 1.59 | 2.63 | 1.63 | 1.02 | 2.01 | 1.59 |
| Left internal carotid artery | 1.14 | 0.47 | 0.25 | 0.74 | 0.68 | 0.40 | 0.51 | 0.71 |
| Lest external carotid artery | 1.66 | 0.95 | 0.61 | 2.75 | 1.60 | 1.01 | 0.89 | 1.57 |
| Basilar artery | 1.43 | 0.63 | 0.41 | 0.88 | 0.79 | 0.51 | 0.60 | 0.77 |
© 2018 by the authors. Licensee MDPI, Basel, Switzerland. This article is an open access article distributed under the terms and conditions of the Creative Commons Attribution (CC BY) license (http://creativecommons.org/licenses/by/4.0/).
Share and Cite
Polanczyk, A.; Podgorski, M.; Wozniak, T.; Stefanczyk, L.; Strzelecki, M. Computational Fluid Dynamics as an Engineering Tool for the Reconstruction of Hemodynamics after Carotid Artery Stenosis Operation: A Case Study. Medicina 2018, 54, 42. https://0-doi-org.brum.beds.ac.uk/10.3390/medicina54030042
Polanczyk A, Podgorski M, Wozniak T, Stefanczyk L, Strzelecki M. Computational Fluid Dynamics as an Engineering Tool for the Reconstruction of Hemodynamics after Carotid Artery Stenosis Operation: A Case Study. Medicina. 2018; 54(3):42. https://0-doi-org.brum.beds.ac.uk/10.3390/medicina54030042
Chicago/Turabian StylePolanczyk, Andrzej, Michal Podgorski, Tomasz Wozniak, Ludomir Stefanczyk, and Michal Strzelecki. 2018. "Computational Fluid Dynamics as an Engineering Tool for the Reconstruction of Hemodynamics after Carotid Artery Stenosis Operation: A Case Study" Medicina 54, no. 3: 42. https://0-doi-org.brum.beds.ac.uk/10.3390/medicina54030042