Discovering Biomarkers and Pathways Shared by Alzheimer’s Disease and Ischemic Stroke to Identify Novel Therapeutic Targets

 , , ,
, , ,
Abstract
:1. Introduction
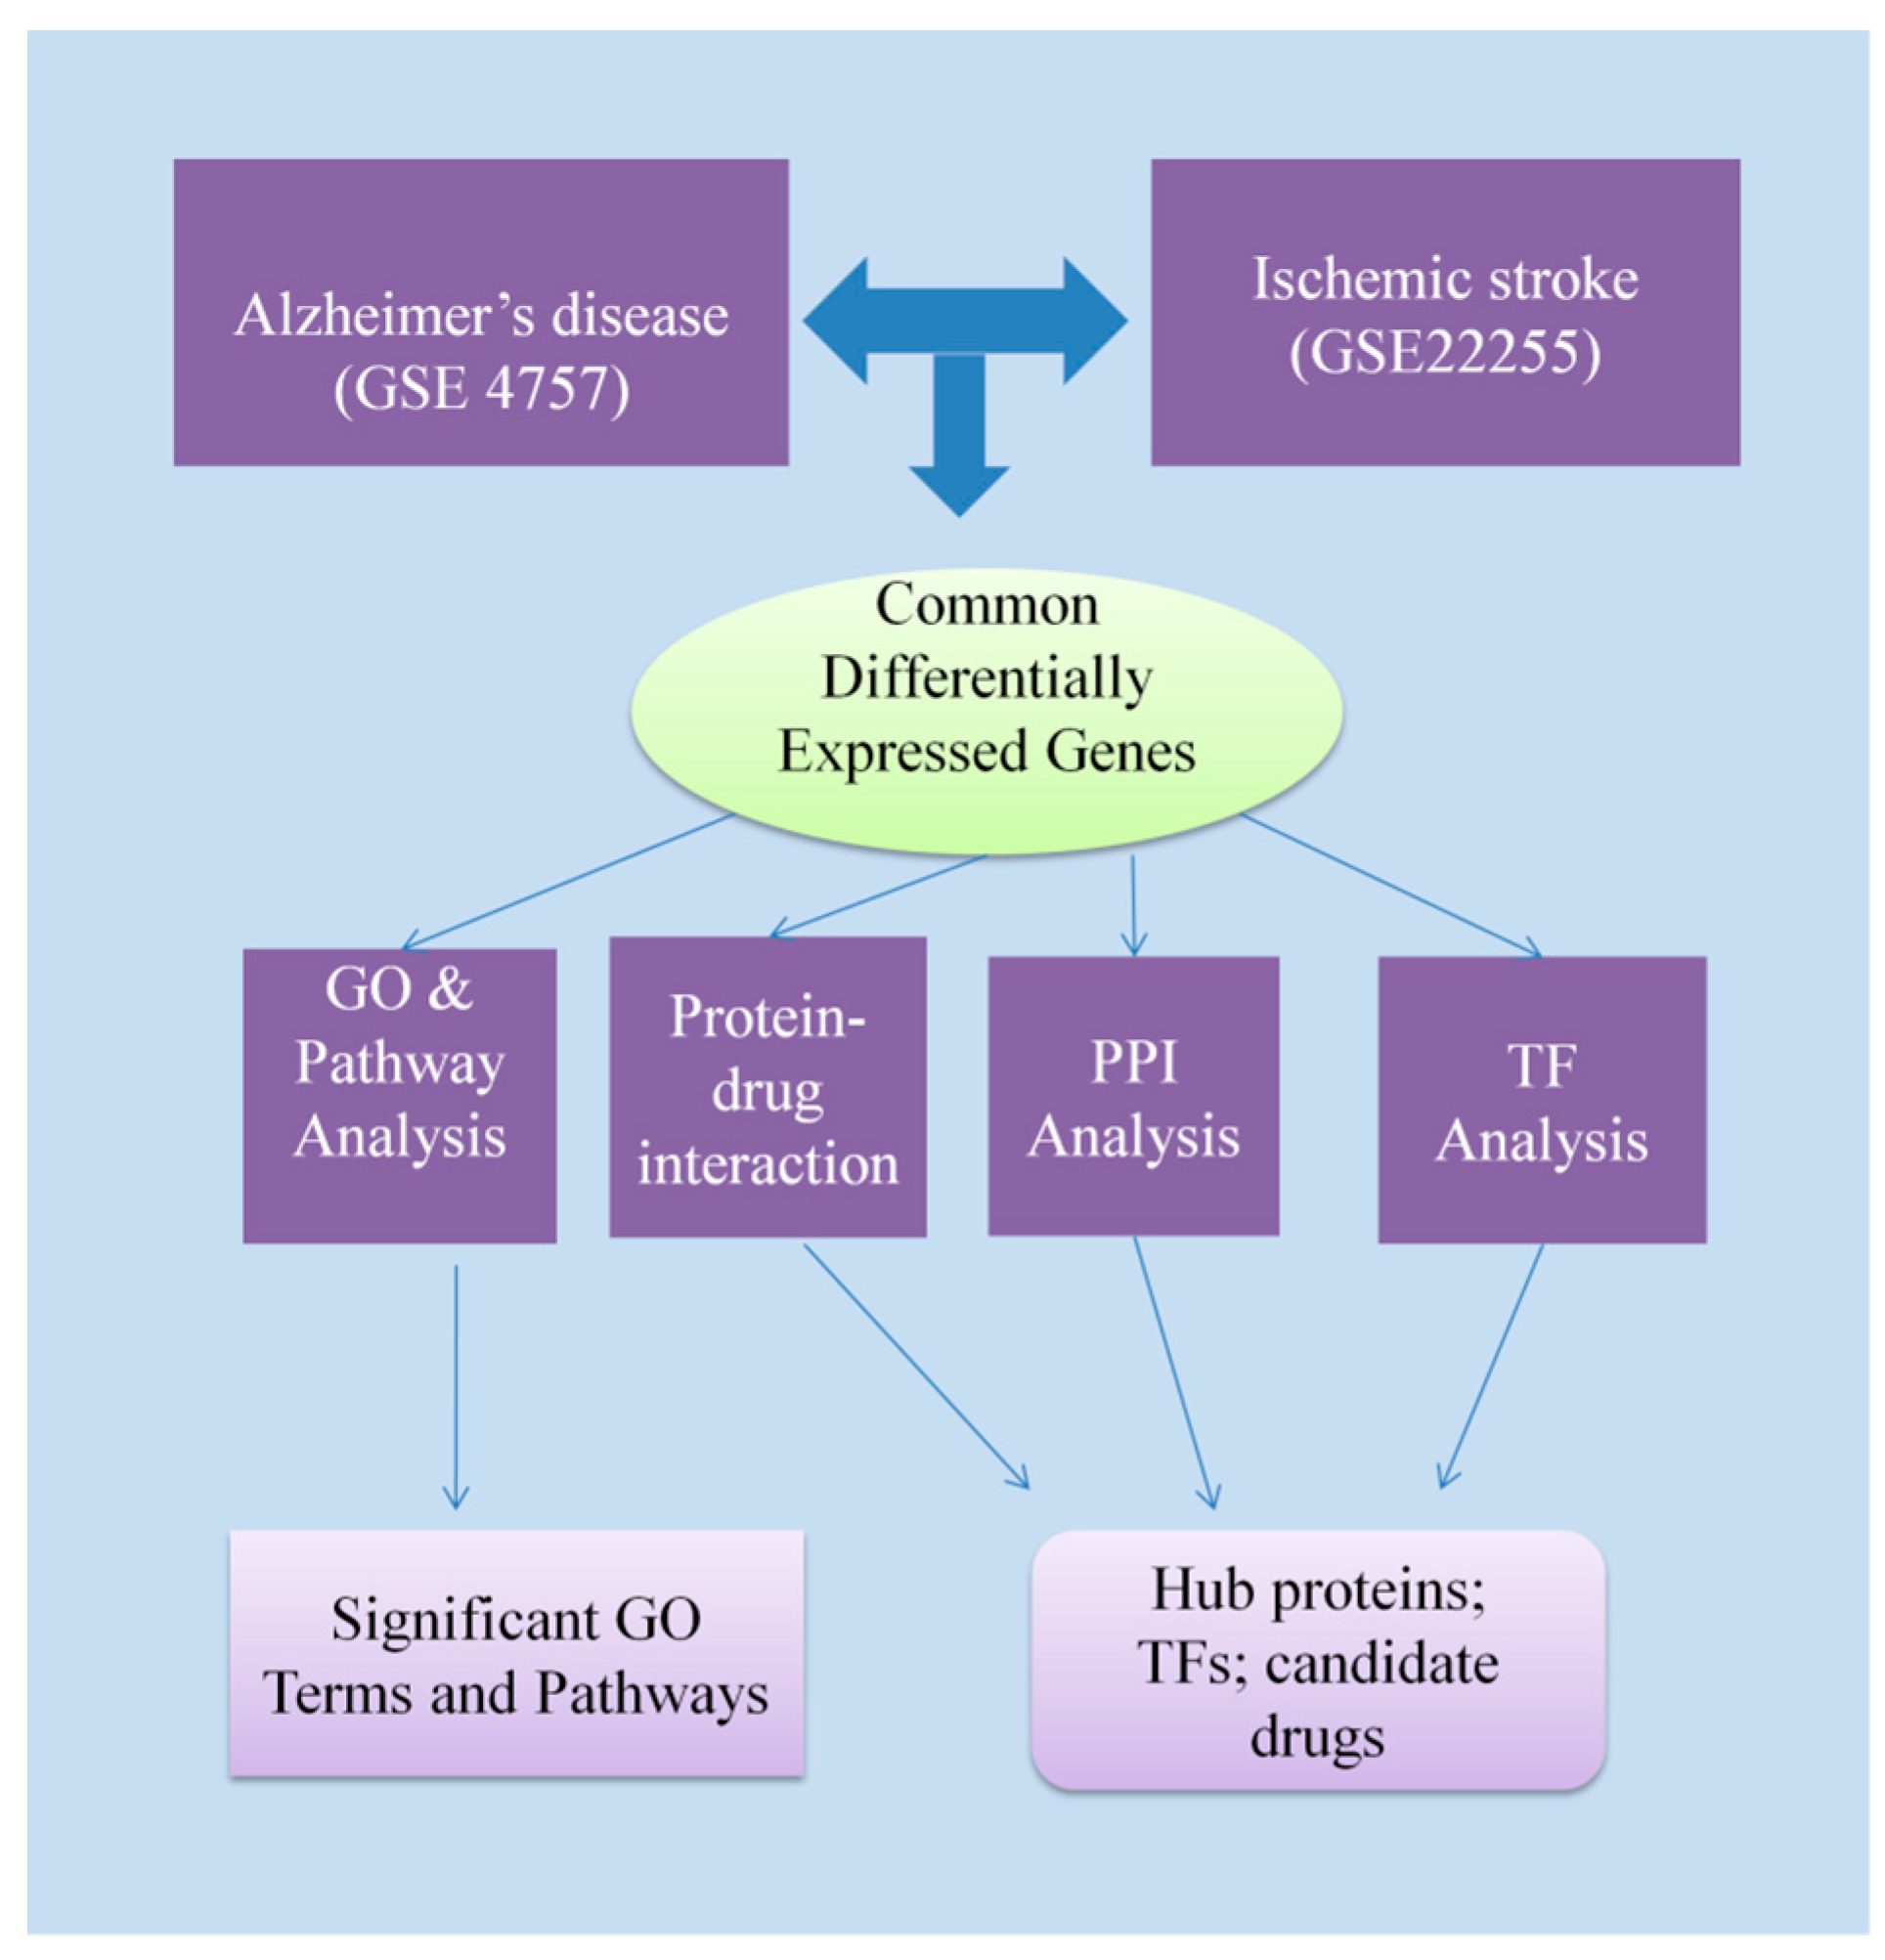
2. Materials and Methods
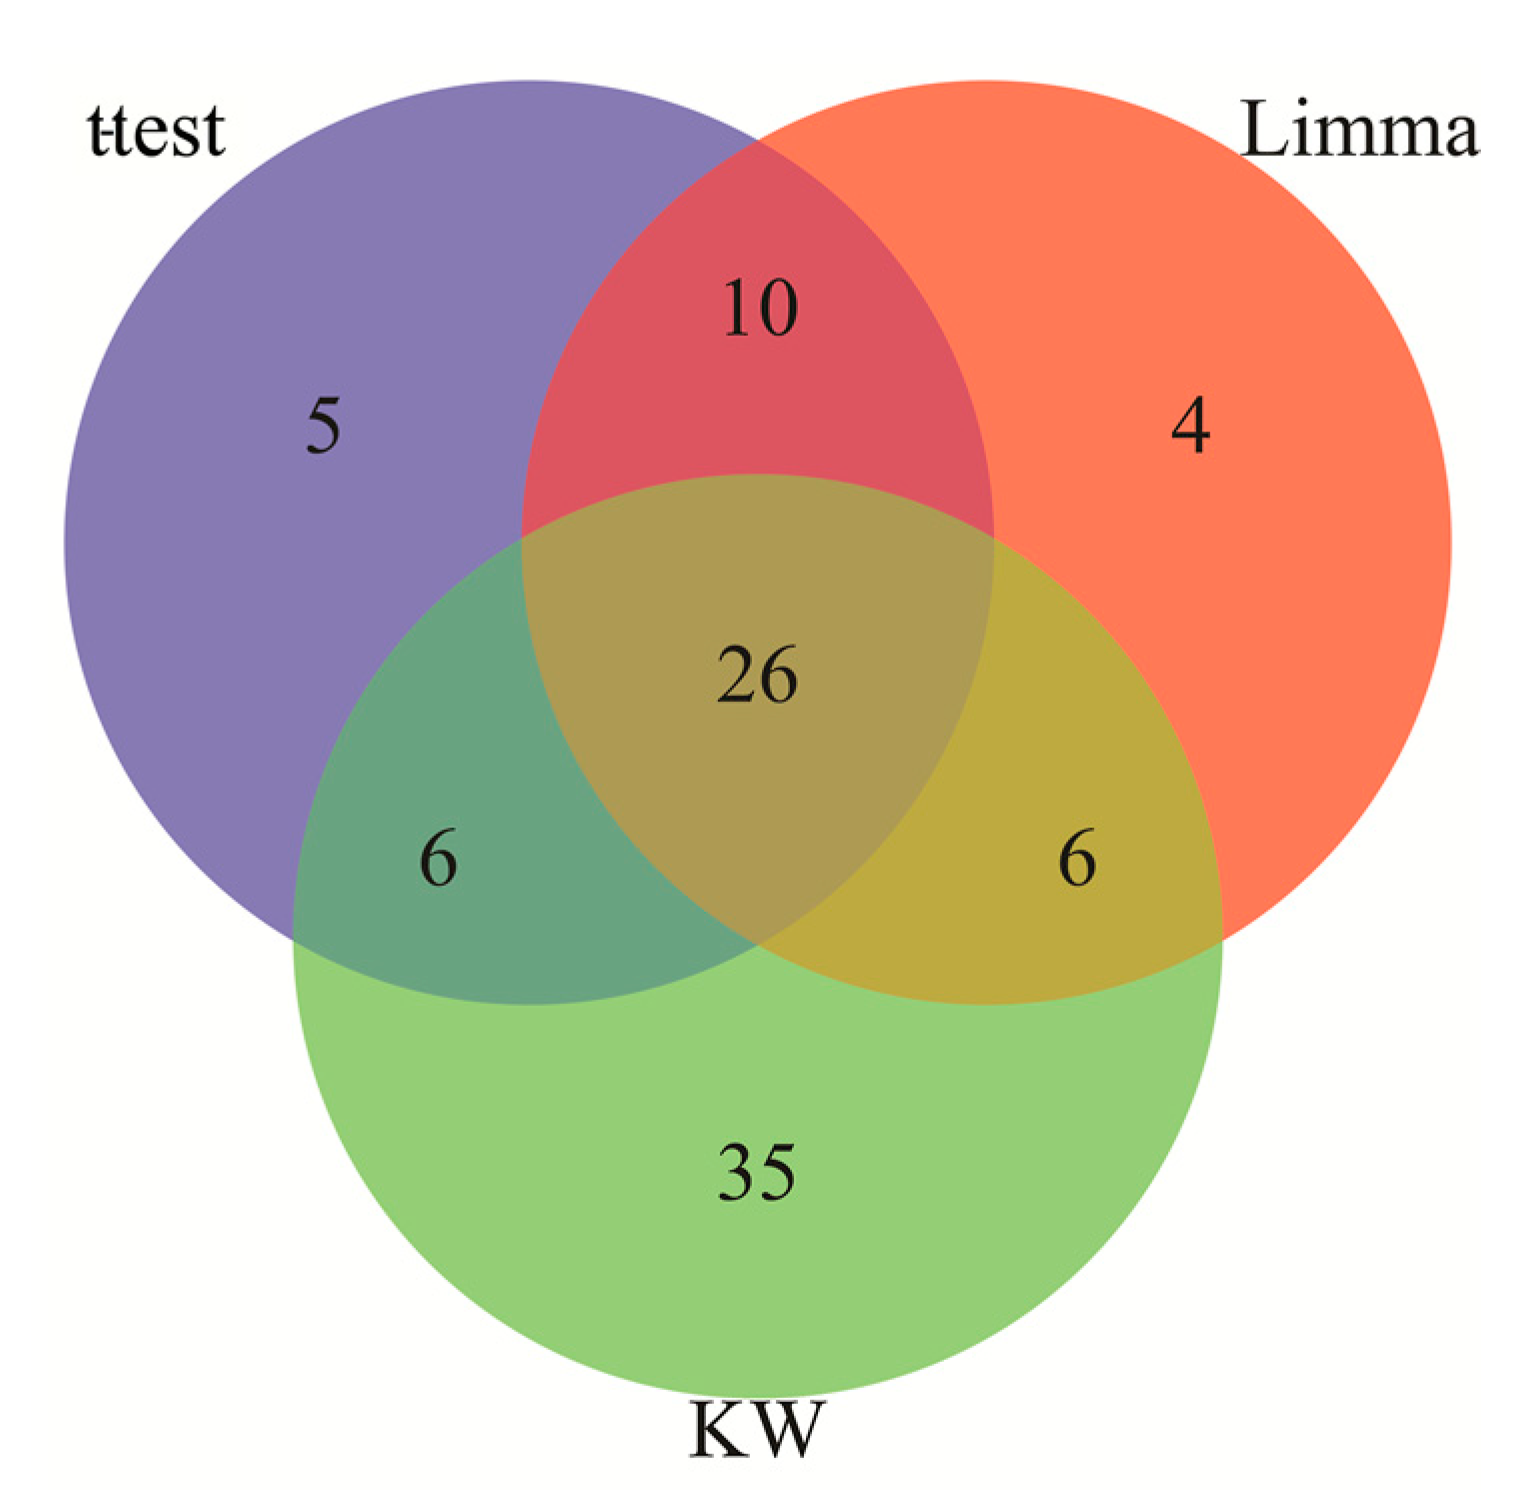
2.1. Identification of Differentially Expressed Genes in AD and IS
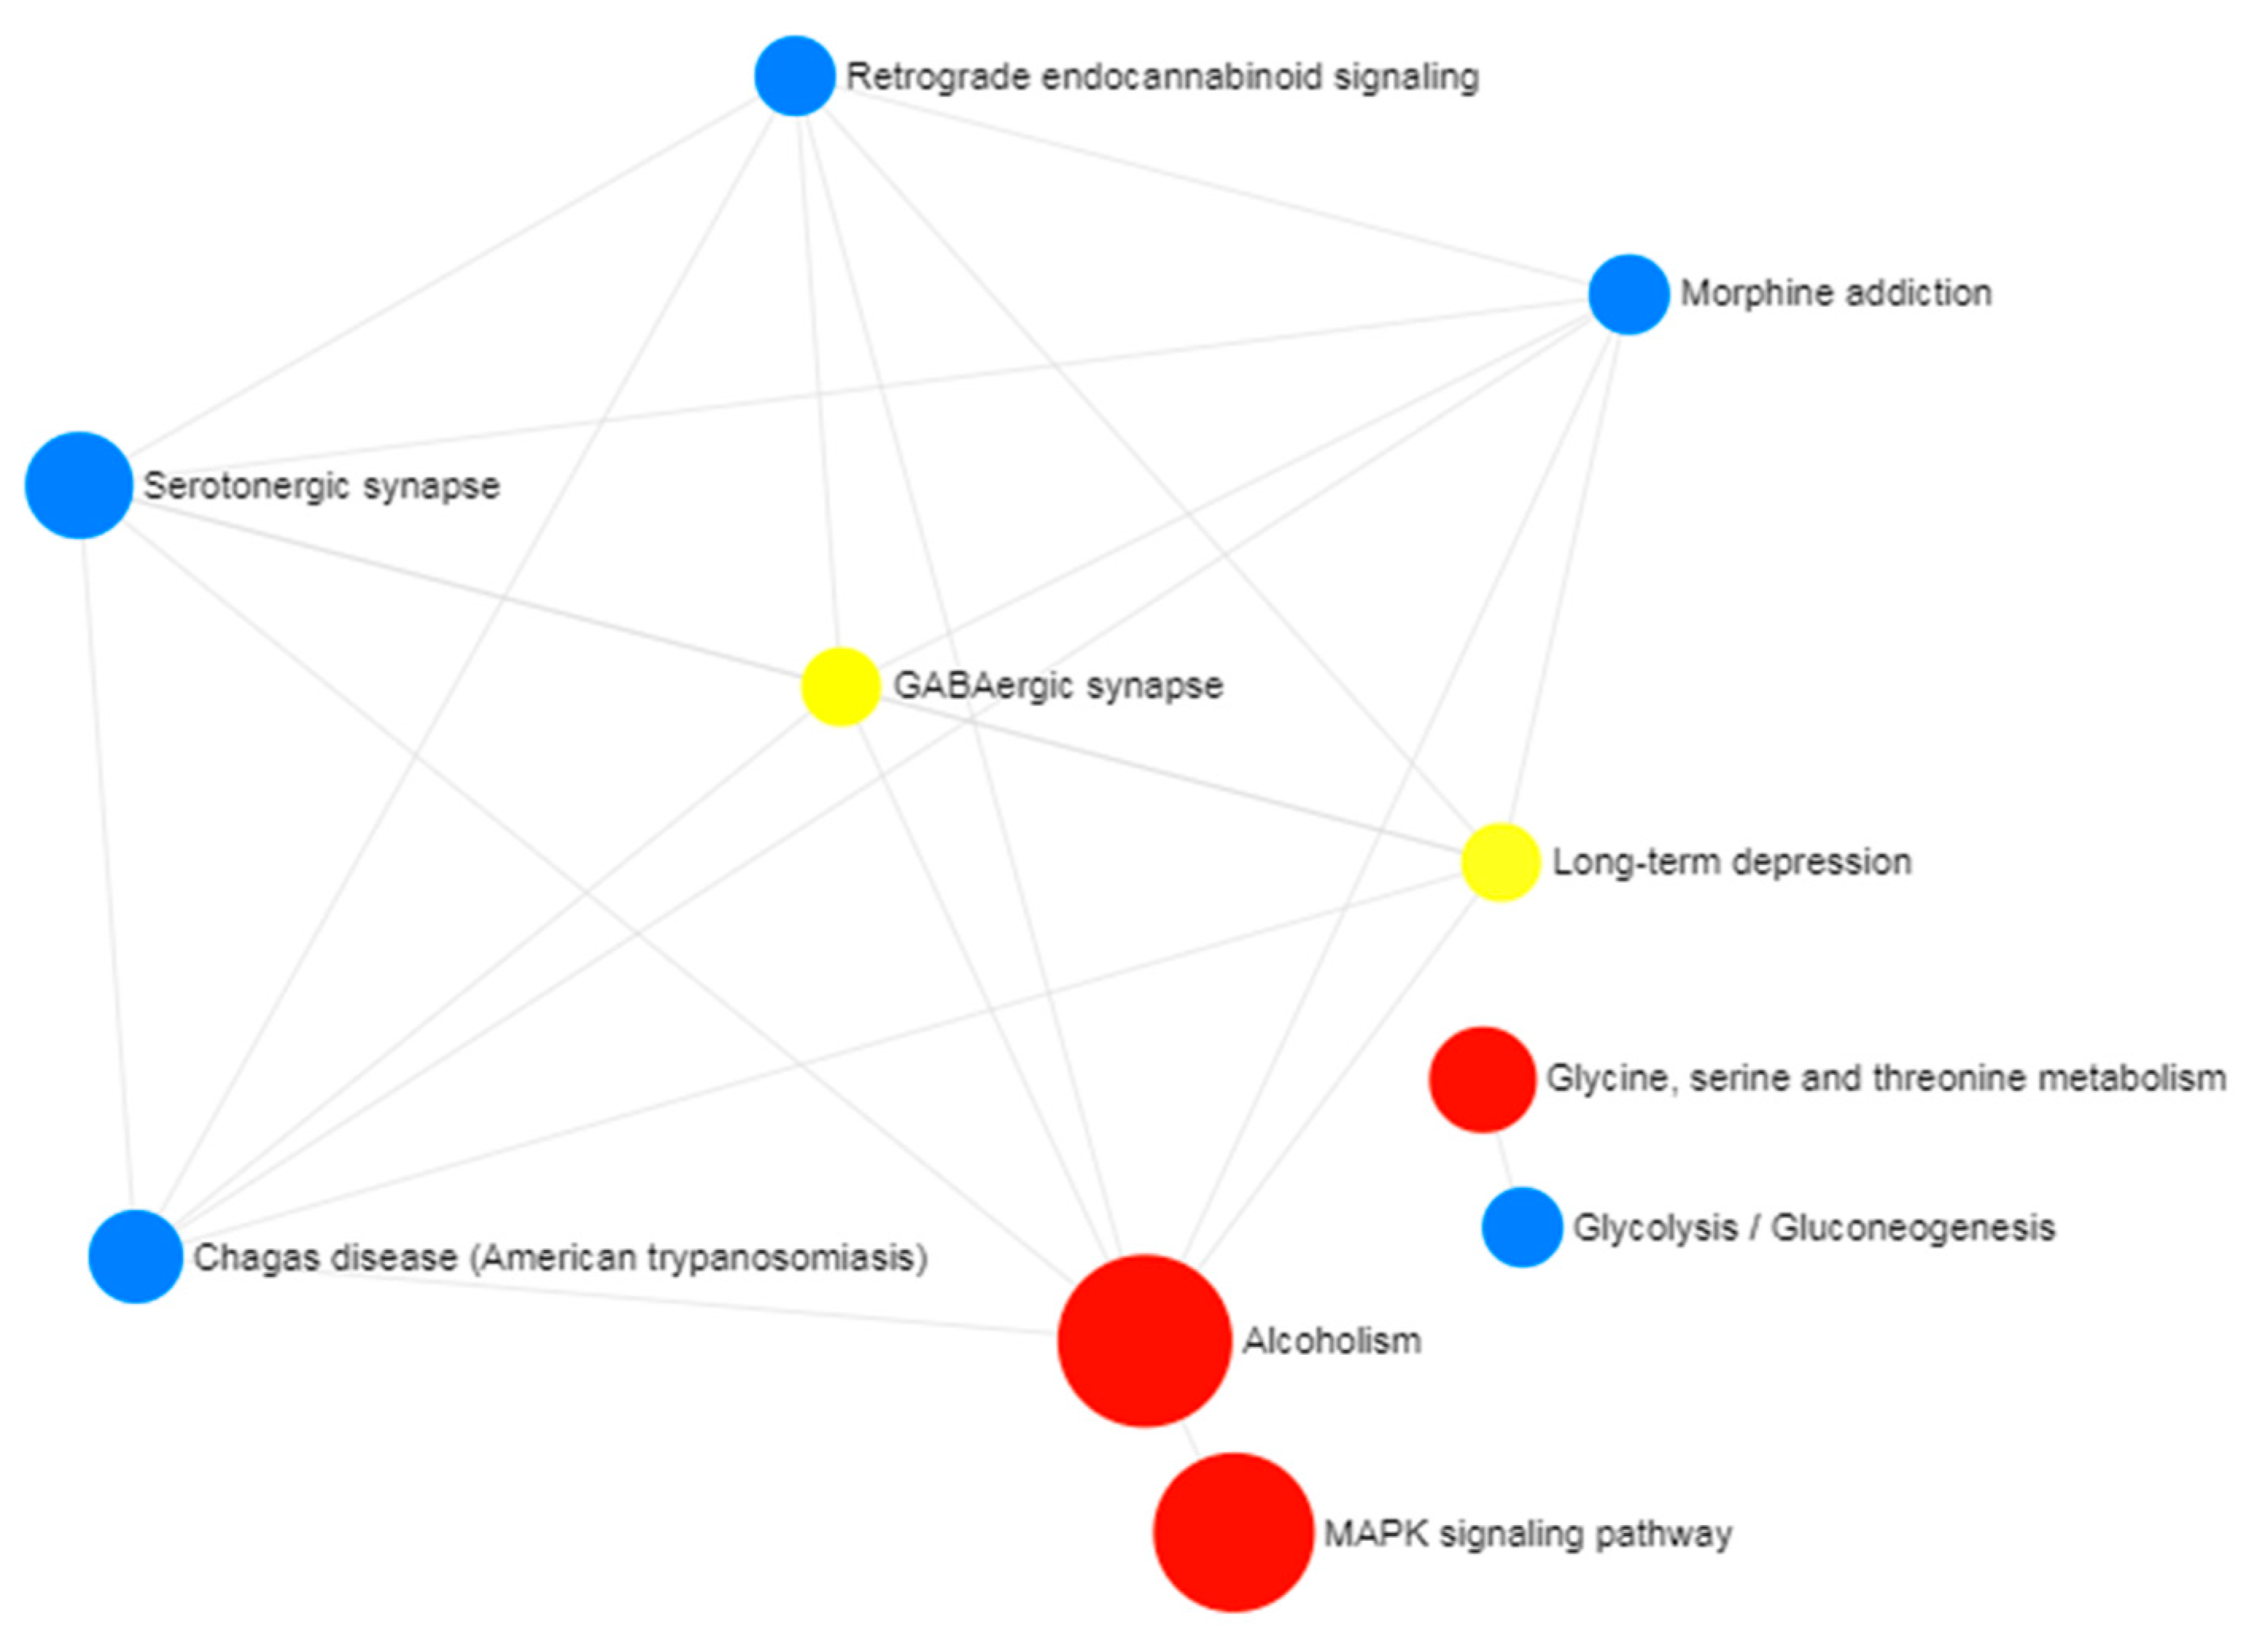
2.2. Gene Ontology and Pathway Enrichment Analysis
2.3. Protein–Protein Interaction Analysis
2.4. Identification of Transcriptional and Post-Transcriptional Regulator Components
2.5. Protein–Drug Interactions Analysis
3. Results
3.1. Identification of Differentially Expressed Genes Common to AD and IS
3.2. Identification of Hub Proteins
3.3. Identification of Transcriptional Regulators of AD and IS
3.4. Protein–Drug Interactions of Common DEGs of AD and IS
4. Discussion
5. Conclusions
Author Contributions
Funding
Acknowledgments
Conflicts of Interest
References
- Alzheimer’s Association. 2017 Alzheimer’s disease facts and figures. Alzheimer’s Dement 2017, 13, 325–373. [Google Scholar] [CrossRef]
- Dunckley, T.; Beach, T.G.; Ramsey, K.E.; Grover, A.; Mastroeni, D.; Walker, D.G.; LaFleur, B.J.; Coon, K.D.; Brown, K.M.; Caselli, R.J.; et al. Gene expression correlates of neurofibrillary tangles in Alzheimer’s disease. Neurobiol. Aging 2006, 27, 1359–1371. [Google Scholar] [CrossRef]
- Murray, C.J.L.; Vos, T.; Lozano, R.; Naghavi, M.; Flaxman, A.D.; Michaud, C.; Whiteford, H.; Sliwa, K.; Smith, E.; Smith, J.L.; et al. Disability-adjusted life years (DALYs) for 291 diseases and injuries in 21 regions, 1990–2010 systematic analysis for the Global Burden of Disease Study 2010. Lancet 2012, 380, 2197–2223. [Google Scholar] [CrossRef]
- Benjamin, E.J.; Virani, S.S.; Callaway, C.W.; Chamberlain, A.M.; Chang, A.R.; Cheng, S.; Chiuve, S.E.; Gillespie, C.; Sampson, U.K.A.; Satou, G.M.; et al. Heart Disease and Stroke Statistics-2018 Update: A Report From the American Heart Association. Circulation 2018, 137, e67–e492. [Google Scholar] [CrossRef]
- Chi, N.-F.; Chien, L.-N.; Ku, H.-L.; Hu, C.-J.; Chiou, H.-Y. Alzheimer disease and risk of stroke population-based cohort study. Neurology 2013, 80, 705–711. [Google Scholar] [CrossRef]
- Tolppanen, A.-M.; Lavikainen, P.; Solomon, A.; Kivipelto, M.; Soininen, H.; Hartikainen, S. Incidence of stroke in people with Alzheimer disease national register-based approach. Neurology 2013, 80, 353–358. [Google Scholar] [CrossRef]
- Gamaldo, A.; Moghekar, A.; Kilada, S.; Resnick, S.M.; Zonderman, A.B.; O’Brien, R. Effect of a clinical stroke on the risk of dementia in a prospective cohort. Neurology 2006, 67, 1363–1369. [Google Scholar] [CrossRef]
- Regan, C.; Katona, C.; Walker, Z.; Hooper, J.; Donovan, J.; Livingston, G. Relationship of vascular risk to the progression of Alzheimer disease. Neurology 2006, 67, 1357–1362. [Google Scholar] [CrossRef]
- Hollingworth, P.; Harold, D.; Sims, R.; Gerrish, A.; Lambert, J.-C.; Carrasquillo, M.M.; Holmes, C.; Mann, D.; Smith, A.D.; Beaumont, H.; et al. Common variants at ABCA7, MS4A6A/MS4A4E, EPHA1, CD33 and CD2AP are associated with Alzheimer’s disease. Nat. Genet. 2011, 43, 429–435. [Google Scholar] [CrossRef]
- Bettens, K.; Sleegers, K.; Van Broeckhoven, C. Genetic insights in Alzheimer’s disease. Lancet Neurol. 2013, 12, 92–104. [Google Scholar] [CrossRef]
- Lambert, J.C.; Ibrahim-Verbaas, C.A.; Harold, D.; Naj, A.C.; Sims, R.; Bellenguez, C.; Graff, C.; Psaty, B.M.; Jones, L.; Haines, J.L.; et al. Meta-analysis of 74,046 individuals identifies 11 new susceptibility loci for Alzheimer’s disease. Nat. Genet. 2013, 45, 1452–1458. [Google Scholar] [CrossRef]
- Traylor, M.; Adib-Samii, P.; Harold, D.; Dichgans, M.; Williams, J.; Lewis, C.M.; Markus, H.S.; IGAP; Investigators. METASTROKE Shared genetic contribution to Ischaemic Stroke and Alzheimer’s Disease. Ann. Neurol. 2016, 79, 739–747. [Google Scholar] [CrossRef]
- Vijayan, M.; Reddy, P.H. Stroke, Vascular Dementia, and Alzheimer’s Disease: Molecular Links. J. Alzheimers Dis. 2016, 54, 427–443. [Google Scholar] [CrossRef]
- Rahman, M.R.; Islam, T.; Turanli, B.; Zaman, T.; Faruquee, H.M.; Rahman, M.M.; Mollah, M.N.H.; Nanda, R.K.; Arga, K.Y.; Gov, E.; et al. Network-based approach to identify molecular signatures and therapeutic agents in Alzheimer’s disease. Comput. Biol. Chem. 2018, 78, 431–439. [Google Scholar] [CrossRef]
- Rahman, M.R.; Islam, T.; Shahjaman, M.; Quinn, J.M.W.; Holsinger, R.M.D.; Moni, M.A. Identification of common molecular biomarker signatures in blood and brain of Alzheimer’s disease. BioRxiv 2018. [Google Scholar] [CrossRef]
- Shang, J.; Yamashita, T.; Fukui, Y.; Song, D.; Li, X.; Zhai, Y.; Morihara, R.; Hishikawa, N.; Ohta, Y.; Abe, K.; et al. Different Associations of Plasma Biomarkers in Alzheimer’s Disease, Mild Cognitive Impairment, Vascular Dementia, and Ischemic Stroke. J. Clin. Neurol. 2018, 14, 29–34. [Google Scholar] [CrossRef]
- Morimoto, S.; Takao, M.; Hatsuta, H.; Nishina, Y.; Komiya, T.; Sengoku, R.; Nakano, R.; Uchino, A.; Sumikura, H.; Saito, Y.; et al. Homovanillic acid and 5-hydroxyindole acetic acid as biomarkers for dementia with Lewy bodies and coincident Alzheimer’s disease: An autopsy-confirmed study. PLoS ONE 2017, 12, e0171524. [Google Scholar] [CrossRef]
- Rahman, M.R.; Islam, T.; Zaman, T.; Shahjaman, M.; Karim, M.R.; Huq, F.; Quinn, J.M.W.; Holsinger, R.M.D.; Moni, M.A. Blood-based molecular biomarker signatures in Alzheimer’s disease: Insights from systems biomedicine analyses. BioRxiv 2018. [Google Scholar] [CrossRef]
- Barrett, T.; Wilhite, S.E.; Ledoux, P.; Evangelista, C.; Kim, I.F.; Tomashevsky, M.; Marshall, K.A.; Phillippy, K.H.; Sherman, P.M.; Holko, M.; et al. NCBI GEO: Archive for functional genomics data sets—Update. Nucleic Acids Res. 2013, 41, 991–995. [Google Scholar] [CrossRef]
- Xia, J.; Gill, E.E.; Hancock, R.E.W. NetworkAnalyst for statistical, visual and network-based meta-analysis of gene expression data. Nat. Protoc. 2015, 10, 823–844. [Google Scholar] [CrossRef]
- Szklarczyk, D.; Morris, J.H.; Cook, H.; Kuhn, M.; Wyder, S.; Simonovic, M.; Santos, A.; Doncheva, N.T.; Roth, A.; von Mering, C.; et al. The STRING database in 2017: Quality-controlled protein-protein association networks, made broadly accessible. Nucleic Acids Res. 2017, 45, D362–D368. [Google Scholar] [CrossRef]
- Kuleshov, M.V.; Jones, M.R.; Rouillard, A.D.; Fernandez, N.F.; Duan, Q.; Wang, Z.; Koplev, S.; Jenkins, S.L.; Jagodnik, K.M.; Lachmann, A.; et al. Enrichr comprehensive gene set enrichment analysis web server 2016 update. Nucleic Acids Res. 2016, 44, W90–W97. [Google Scholar] [CrossRef]
- Wingender, E.; Dietze, P.; Karas, H.; Knüppel, R. TRANSFAC: A database on transcription factors and their DNA binding sites. Nucleic Acids Res. 1996, 24, 238–241. [Google Scholar] [CrossRef]
- Wishart, D.S.; Feunang, Y.D.; Guo, A.C.; Lo, E.J.; Marcu, A.; Grant, J.R.; Sajed, T.; Johnson, D.; Li, C.; Sayeeda, Z.; et al. DrugBank 5.0 major update to the DrugBank database for 2018. Nucleic Acids Res. 2018, 46, D1074–D1082. [Google Scholar] [CrossRef]
- Rahman, M.R.; Islam, T.; Gov, E.; Turanli, B.; Gulfidan, G.; Shahjaman, M.; Banu, N.A.; Mollah, M.N.H.; Arga, K.Y.; Moni, M.A. Identification of Prognostic Biomarker Signatures and Candidate Drugs in Colorectal Cancer: Insights from Systems Biology Analysis. Medicina 2018, 55, 20. [Google Scholar] [CrossRef]
- Islam, T.; Rahman, M.R.; Gov, E.; Turanli, B.; Gulfidan, G.; Haque, M.A.; Arga, K.Y.; Mollah, M.N.H. Drug Targeting and Biomarkers in Head and Neck Cancers: Insights from Systems Biology Analyses. OMICS 2018, 22, 422–436. [Google Scholar] [CrossRef]
- Venkataraman, A.; Kalk, N.; Sewell, G.; W Ritchie, C.; Lingford-Hughes, A. Alcohol and Alzheimer’s Disease-Does Alcohol Dependence Contribute to Beta-Amyloid Deposition, Neuroinflammation and Neurodegeneration in Alzheimer’s Disease? Alcohol Alcohol. 2017, 52, 158. [Google Scholar] [CrossRef]
- Tyas, S.L. Alcohol use and the risk of developing Alzheimer’s disease. Alcohol Res. Health 2001, 25, 299–306. [Google Scholar]
- Oluwaseun Fadaka, A.; Adeleke Ojo, O.; Adetutu Osukoya, O.; Akuboh, O.; Ajiboye, B.O. Role of p38 MAPK Signaling in Neurodegenerative Diseases: A Mechanistic Perspective. Ann. Neurodegener. Disord. 2017, 2, 1026. [Google Scholar]
- Zhu, X.; Lee, H.; Raina, A.K.; Perry, G.; Smith, M.A. The role of mitogen-activated protein kinase pathways in Alzheimer’s disease. Neurosignals 2002, 11, 270–281. [Google Scholar] [CrossRef]
- Garcia-Osta, A.; Cuadrado-Tejedor, M.; Garcia-Barroso, C.; Oyarzabal, J.; Franco, R. Phosphodiesterases as therapeutic targets for Alzheimer’s disease. ACS Chem. Neurosci. 2012, 3, 832–844. [Google Scholar] [CrossRef]
- Feng, H.; Sjogren, B.; Karaj, B.; Shaw, V.; Gezer, A.; Neubig, R.R. Movement disorder in GNAO1 encephalopathy associated with gain-of-function mutations. Neurology 2017, 89, 762–770. [Google Scholar] [CrossRef]
- Maor-Nof, M.; Romi, E.; Sar Shalom, H.; Ulisse, V.; Raanan, C.; Nof, A.; Leshkowitz, D.; Lang, R.; Yaron, A. Axonal Degeneration Is Regulated by a Transcriptional Program that Coordinates Expression of Pro- and Anti-degenerative Factors. Neuron 2016, 92, 991–1006. [Google Scholar] [CrossRef] [Green Version]
- Chen, Z.; Simmons, M.S.; Perry, R.T.; Wiener, H.W.; Harrell, L.E.; Go, R.C.P. Genetic association of neurotrophic tyrosine kinase receptor type 2 (NTRK2) with Alzheimer’s disease. Am. J. Med. Genet. B Neuropsychiatr. Genet. 2008, 147, 363–369. [Google Scholar] [CrossRef]
- Caraci, F.; Battaglia, G.; Bruno, V.; Bosco, P.; Carbonaro, V.; Giuffrida, M.L.; Drago, F.; Sortino, M.A.; Nicoletti, F.; Copani, A. TGF-β1 pathway as a new target for neuroprotection in Alzheimer’s disease. CNS Neurosci. Ther. 2011, 17, 237–249. [Google Scholar] [CrossRef]
- Chalmers, K.A.; Love, S. Neurofibrillary tangles may interfere with Smad 2/3 signaling in neurons. J. Neuropathol. Exp. Neurol. 2007, 66, 158–167. [Google Scholar] [CrossRef]
- Ferri, A.L.M.; Cavallaro, M.; Braida, D.; Di Cristofano, A.; Canta, A.; Vezzani, A.; Ottolenghi, S.; Pandolfi, P.P.; Sala, M.; DeBiasi, S.; et al. Sox2 deficiency causes neurodegeneration and impaired neurogenesis in the adult mouse brain. Dev. Dis. 2004, 131, 3805–3819. [Google Scholar] [CrossRef]


| Category | Gene Ontology Term | p-Value |
|---|---|---|
| Biological process | Regulation of axonogenesis | 0.002 |
| Learning or memory | 0.006 | |
| Brain development | 0.007 | |
| Behavior | 0.009 | |
| Aging | 0.009 | |
| Carbohydrate biosynthetic process | 0.010 | |
| Cellular component | Neuron projection | 0.014 |
| Cell projection part | 0.014 | |
| Axon | 0.018 | |
| Cell projection | 0.019 | |
| Molecular function | Phosphoric ester hydrolase activity | 0.004 |
| 3′,5′-cyclic nucleotide phosphodiesterase activity | 0.023 | |
| 3′,5′-cyclic nucleotide phosphodiesterase activity | 0.023 | |
| Phosphatase activity | 0.026 | |
| Hydrolase activity, acting on ester bonds | 0.027 |
| Biomarker Candidate | Name | Biological Roles/Significance of the Biomolecules |
|---|---|---|
| Hub proteins | ||
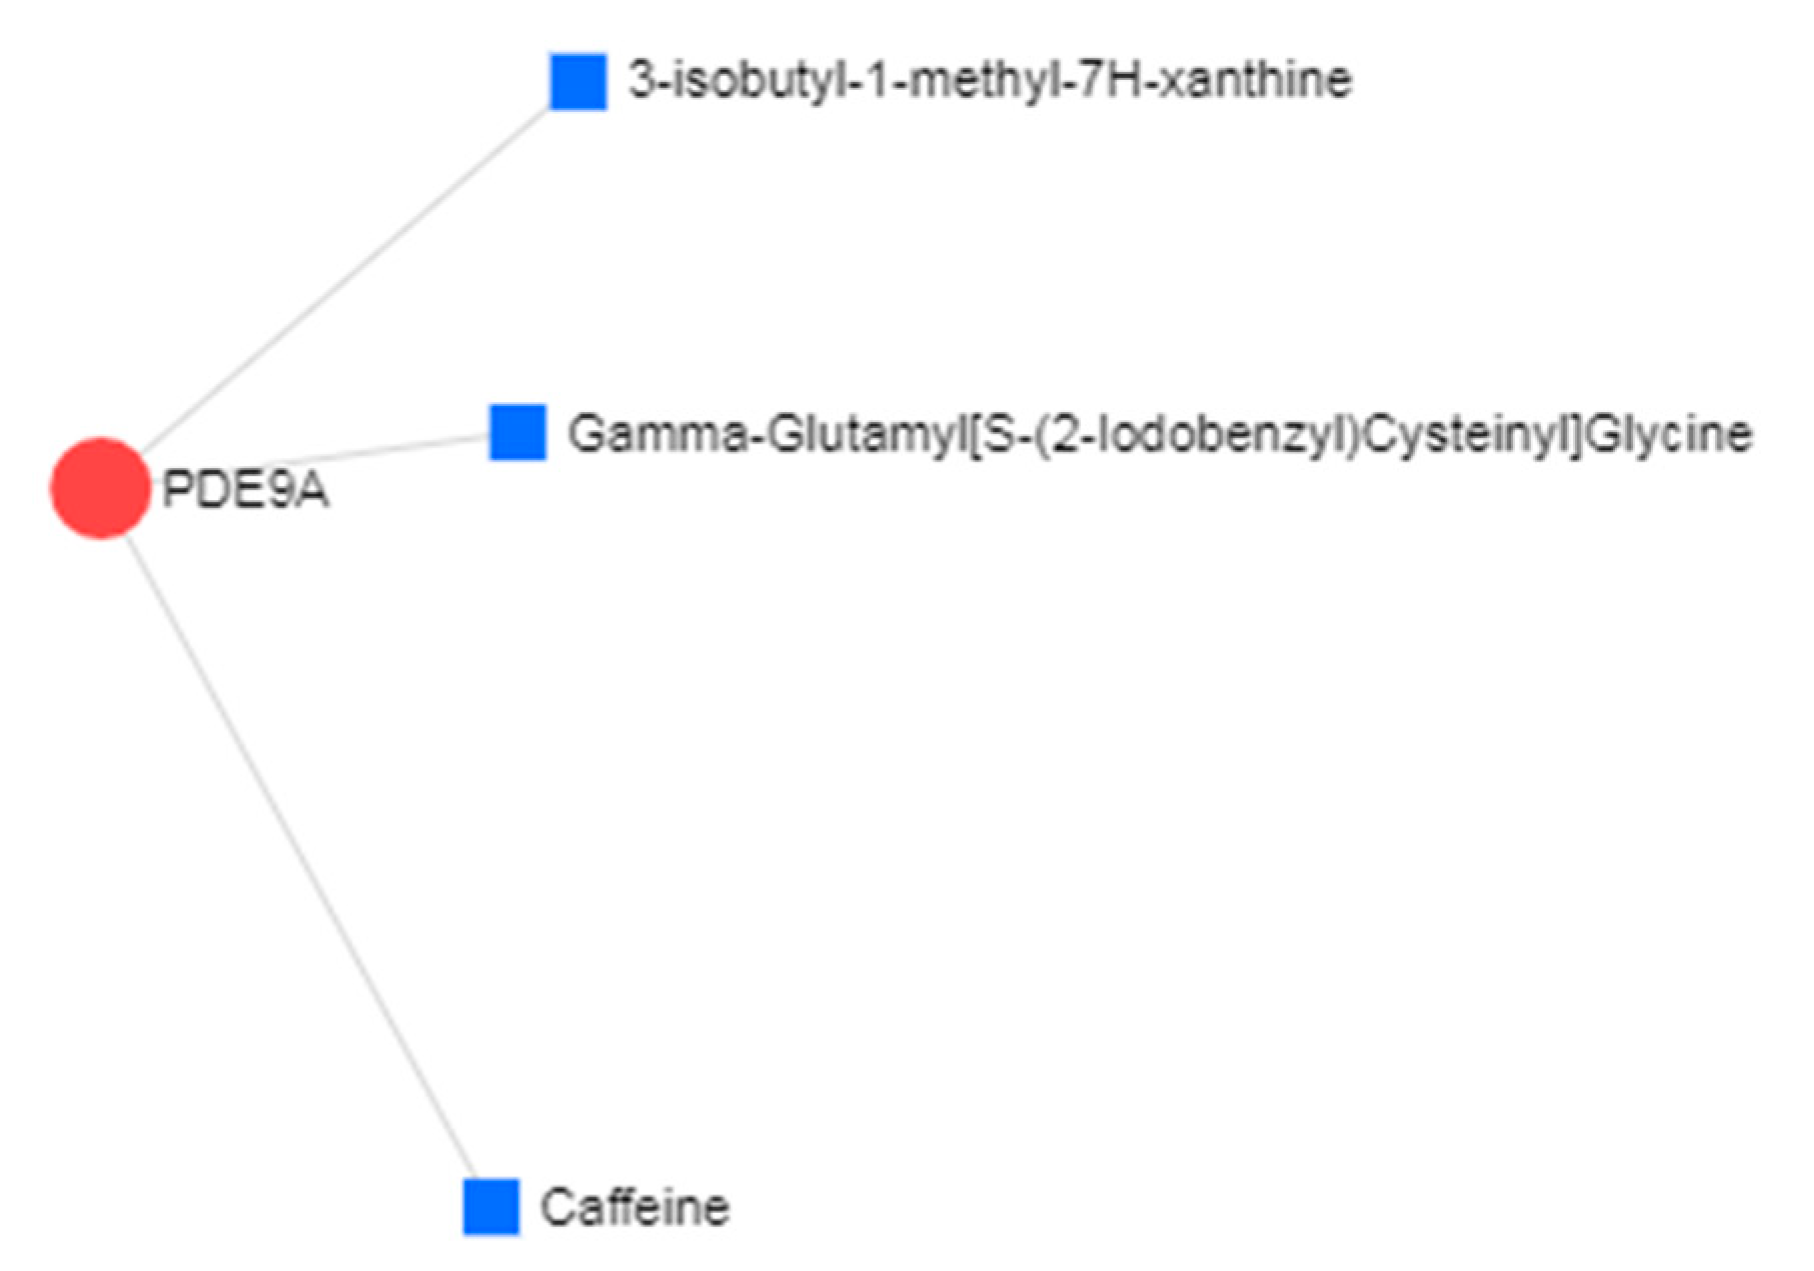
| PDE9A | Phosphodiesterase-9 | Already a potential target for treatment of the AD with phase II clinical trials underway for one PDE9 compound, BI409306 |
| GNAO1 | Guanine Nucleotide-Binding Protein, Alpha-Activating Activity Polypeptide O | Mutations in GNAO1 are already noted to be associated with neurologic pathophysiology |
| DUSP16 | Dual Specificity Phosphatase 16 | Associated with neurological functions in axonal degeneration |
| NTRK2 | Neurotrophic Receptor Tyrosine Kinase 2 | The genetic variants of NTRK2 are suggested to show a significant association between NTRK2 with AD |
| PGAM2 | Phosphoglycerate Mutase 2 | Diseases associated with PGAM2 include glycogen storage disease X and phosphoglycerate mutase deficiency |
| MAG | Myelin Associated Glycoprotein | Diseases associated with MAG include spastic paraplegia, autosomal recessive, and chronic polyneuropathy |
| TXLNA | Taxilin Alpha | Diseases associated with TXLNA include B-cell growth factor and inclusion conjunctivitis |
| Transcription Factor | ||
| SPIB | (Spi-B Transcription Factor) | Diseases associated with SPIB include primary biliary cholangitis and colorectal cancer |
| SMAD3 | SMAD Family Member 3 | NFT protein can sequester phosphorylated Smad3 in AD brain, thus preventing its translocation into the nucleus and the induction of gene transcription |
| SOX2 | SRY-Box2 | Sox2 deficiency causes neurodegeneration and impaired neurogenesis in the adult mouse brain |
© 2019 by the authors. Licensee MDPI, Basel, Switzerland. This article is an open access article distributed under the terms and conditions of the Creative Commons Attribution (CC BY) license (http://creativecommons.org/licenses/by/4.0/).
Share and Cite
Rahman, M.R.; Islam, T.; Shahjaman, M.; Zaman, T.; Faruquee, H.M.; Jamal, M.A.H.M.; Huq, F.; Quinn, J.M.W.; Moni, M.A. Discovering Biomarkers and Pathways Shared by Alzheimer’s Disease and Ischemic Stroke to Identify Novel Therapeutic Targets. Medicina 2019, 55, 191. https://0-doi-org.brum.beds.ac.uk/10.3390/medicina55050191
Rahman MR, Islam T, Shahjaman M, Zaman T, Faruquee HM, Jamal MAHM, Huq F, Quinn JMW, Moni MA. Discovering Biomarkers and Pathways Shared by Alzheimer’s Disease and Ischemic Stroke to Identify Novel Therapeutic Targets. Medicina. 2019; 55(5):191. https://0-doi-org.brum.beds.ac.uk/10.3390/medicina55050191
Chicago/Turabian StyleRahman, Md. Rezanur, Tania Islam, Md. Shahjaman, Toyfiquz Zaman, Hossain Md. Faruquee, Mohammad Abu Hena Mostofa Jamal, Fazlul Huq, Julian M. W. Quinn, and Mohammad Ali Moni. 2019. "Discovering Biomarkers and Pathways Shared by Alzheimer’s Disease and Ischemic Stroke to Identify Novel Therapeutic Targets" Medicina 55, no. 5: 191. https://0-doi-org.brum.beds.ac.uk/10.3390/medicina55050191