Cerebrospinal Fluid Analysis in Multiple Sclerosis Diagnosis: An Update


1
Institute of Clinical Biochemistry, Clinical Molecular Medicine and Laboratory Medicine, Department of Biomedicine, Neuroscience and Advanced Diagnostics, University of Palermo, 90100 Palermo, Italy
2
Department Laboratory Medicine, University-Hospital, 90100 Palermo, Italy
*
Author to whom correspondence should be addressed.
Medicina 2019, 55(6), 245; https://0-doi-org.brum.beds.ac.uk/10.3390/medicina55060245
Submission received: 25 March 2019
/
Revised: 10 April 2019
/
Accepted: 30 May 2019
/
Published: 4 June 2019
Abstract
:Multiple sclerosis (MS) is an immune-mediated demyelinating disease of the central nervous system (CNS) with brain neurodegeneration. MS patients present heterogeneous clinical manifestations in which both genetic and environmental factors are involved. The diagnosis is very complex due to the high heterogeneity of the pathophysiology of the disease. The diagnostic criteria have been modified several times over the years. Basically, they include clinical symptoms, presence of typical lesions detected by magnetic resonance imaging (MRI), and laboratory findings. The analysis of cerebrospinal fluid (CSF) allows an evaluation of inflammatory processes circumscribed to the CNS and reflects changes in the immunological pattern due to the progression of the pathology, being fundamental in the diagnosis and monitoring of MS. The detection of the oligoclonal bands (OCBs) in both CSF and serum is recognized as the “gold standard” for laboratory diagnosis of MS, though presents analytical limitations. Indeed, current protocols for OCBs assay are time-consuming and require an operator-dependent interpretation. In recent years, the quantification of free light chain (FLC) in CSF has emerged to assist clinicians in the diagnosis of MS. This article reviews the current knowledge on CSF biomarkers used in the diagnosis of MS, in particular on the validated assays and on the alternative biomarkers of intrathecal synthesis.
1. Introduction
Multiple sclerosis (MS) is a chronic inflammatory neurodegenerative disease of the central nervous system (CNS) that affects young adults. MS, as well as most immune-mediated diseases, is characterized by a sexual dimorphism influencing both incidence and severity of the disease. While women show a higher incidence of disease (ratio of 2:1–3:1), male sex is associated with a more rapidly progressive clinical course [1,2]. The symptoms depend on the localization of inflammatory foci that can affect all regions of CNS and include altered memory, view and attention, and difficulty in daily activities. Both genetic and environmental factors have been implicated in the pathogenesis of the disease, whose common mechanism seems to be an inflammatory process limited to the CNS with destruction of myelin and oligodendrocytes [2].
MS affects more than 2.5 million people in the world, with an incidence that increases with latitudes, being minimal at the equator and increasing at northern or southern latitudes, identifying Northern Europe as a high-risk area (prevalence 140–250 per 100,000) [1,3,4,5,6,7]. This unusual distribution suggests a connection between exposure to sun rays and onset of pathology with a focus on vitamin D status and its latitude-related synthesis. Several studies have showed an association among hypovitaminosis D, genetic polymorphisms in the vitamin D metabolism, and an increased incidence of MS [8,9,10,11,12,13].
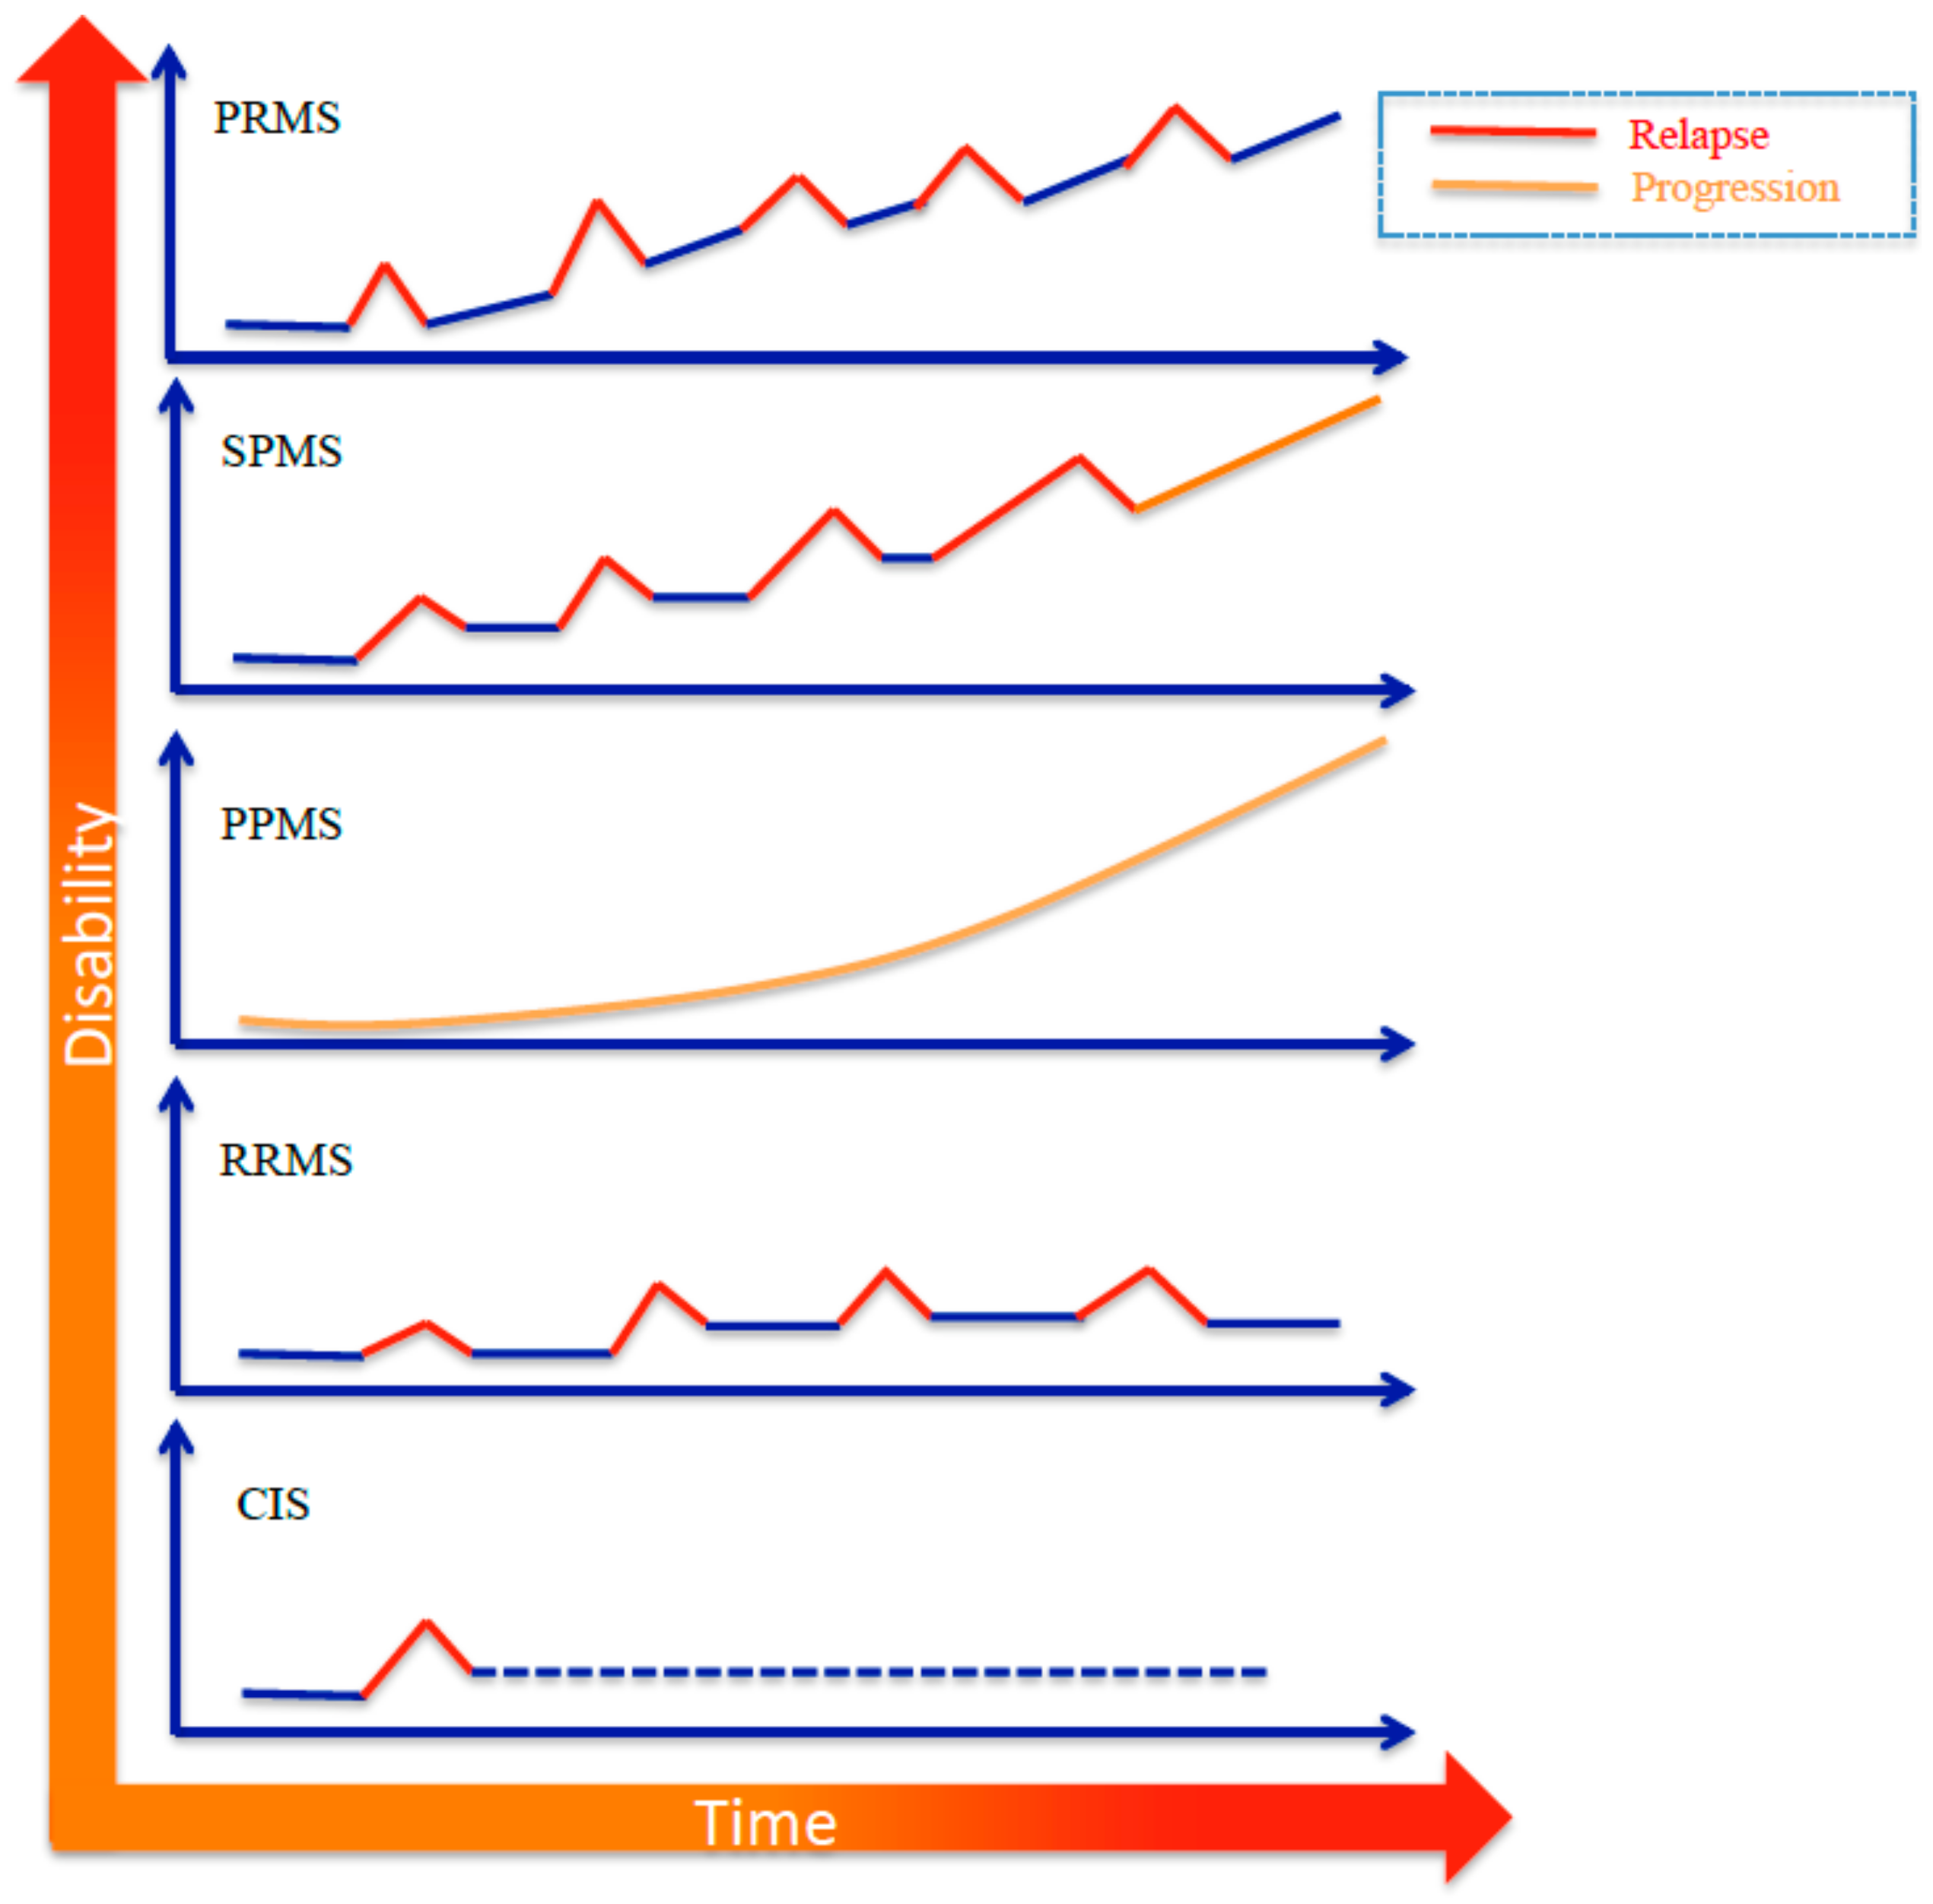
Clinical manifestations of MS are characterized by a high inter-individual variability with severity and duration of symptoms depending on the extension of the neurological damage. Indeed, periods of remission from the disease can be followed by relapses, defined as acute or subacute clinical episodes with neurological abnormality of at least 24 h. The Expanded Disability Status Scale (EDSS) score quantifies disability in MS, and it is commonly used to monitor disease progression. MS is categorized into four distinct subtypes, primarily based on its clinical course, which are characterized by increasing severity: (a) Relapsing remitting MS (RRMS), the most common form, affecting 85% of all MS patients, which involves relapses followed by remission; (b) secondary progressive MS (SPMS), which develops over time following diagnosis of RRMS; (c) primary progressive MS (PPMS), which is characterized by a gradual continuous neurologic deterioration; and (d) progressive relapsing MS (PRMS), which is similar to PPMS but with overlapping relapses (Figure 1) [2].
The first clinical presentation of MS is the clinically isolated syndrome (CIS). CIS refers to a neurologic episode that lasts at least 24 h, caused by inflammation or demyelination. If CIS is accompanied by MRI findings that show a past episode had occurred, an MS diagnosis can be made. However, not all patients convert from a CIS form to clinically definite MS. Validated biomarkers are therefore essential to predict the relapse and to identify the progression to different MS subtypes.
2. Etiopathogenesis
Etiology and pathogenesis of MS are still unclear. However, the immune system certainly plays an important role. It is well known that the intrathecal synthesis of immunoglobulins (Ig), expression of an altered immune response by T cells and plasma cells, causes CNS inflammation, loss of the myelin, and oligodendroglia cell death. B cells are protagonists of the adaptive humoral immune system and are responsible of the production of antigen-specific immunoglobulin. Immunoglobulins are assembled by the combination of five types of heavy chains (μ, δ, γ, α, and ε), and of two types of light chains (κ and λ). The five main classes of immunoglobulins are IgG, IgA, IgD, IgE, and IgM. IgG are the most abundant immunoglobulins in cerebrospinal fluid (CSF). Normally, the light chains are produced in excess of heavy chains [14,15]. Therefore, after the assembly of the complete immunoglobulin, the free light chains (FLCs) are released in the blood. The serum FLC concentration is low, as well as in urine (<15 mg/L), with the exception of lymphoproliferative disease and malignant disease in which Bence Jones proteinuria is usually present [16,17,18]. Several studies have documented the presence of B cells in white matter lesions of MS subjects, an increased CSF concentration of B cell-related cytokines (e.g., CXCL13 and BAFF), and myelin-specific antibodies. Moreover, such patients showed a good therapeutic response to the B cell depletion [19,20,21]. Myhr, K.M. et al. have recently highlighted that the depletion of B cells suppressed the inflammatory processes in RR-MS and slowed progression into more aggressive forms (PPMS) [22].
3. Diagnostic Criteria
The diagnosis of MS is very complex due to the heterogeneity of the disease. Diagnostic criteria rely mainly on the evaluation of clinical, imaging, and laboratory findings described in the “McDonald Criteria”. These criteria have been verified in clinical practice, validated, and progressively updated over the years (2005, 2010, and 2017) in consideration of the difficulties of an early identification of the disease that highlights the need of new technologies for an objective evaluation of patients with suspected MS [23,24,25].
Since the first definition of the McDonald criteria, the need to identify a “dissemination” of lesions in space and time has been emerged. The dissemination in space (DIS) is the development of lesions in distinct anatomical areas within the CNS. Dissemination in time (DIT) is represented by the development of new CNS lesions over time. The identification of DIS and DIT is important because the single lesion is not sufficient to diagnose MS, as well as a single episode of the disease over time. The update of McDonald criteria underlines the need to differentiate the first clinical episode (clinically isolated syndrome, CIS) from other neurological diseases, evaluating clinical signs, the objective finding of DIS and DIT by MRI, and laboratory findings (Table 1). In particular, the presence of CSF-specific IgG oligoclonal bands (OCBs) represents the gold standard for the diagnosis of MS [25].
4. CSF Diagnostics
The CSF analysis has a great potential as a source of emerging biomarkers for neurodegenerative diseases because it offers the opportunity to directly evaluate specific CNS inflammatory processes and to identify changes in the immunological pattern due to the progression of the disease [26,27]. The McDonald criteria emphasize that the CSF examination is a “valuable diagnostic test” especially when clinical evaluation and imaging (magnetic resonance imaging, MRI) don’t provide sufficient evidence to support the diagnosis of MS, or in presence of PP-MS, or in populations in which MS has a low prevalence (e.g., elderly, children, or non-Caucasian ethnic groups) [25].
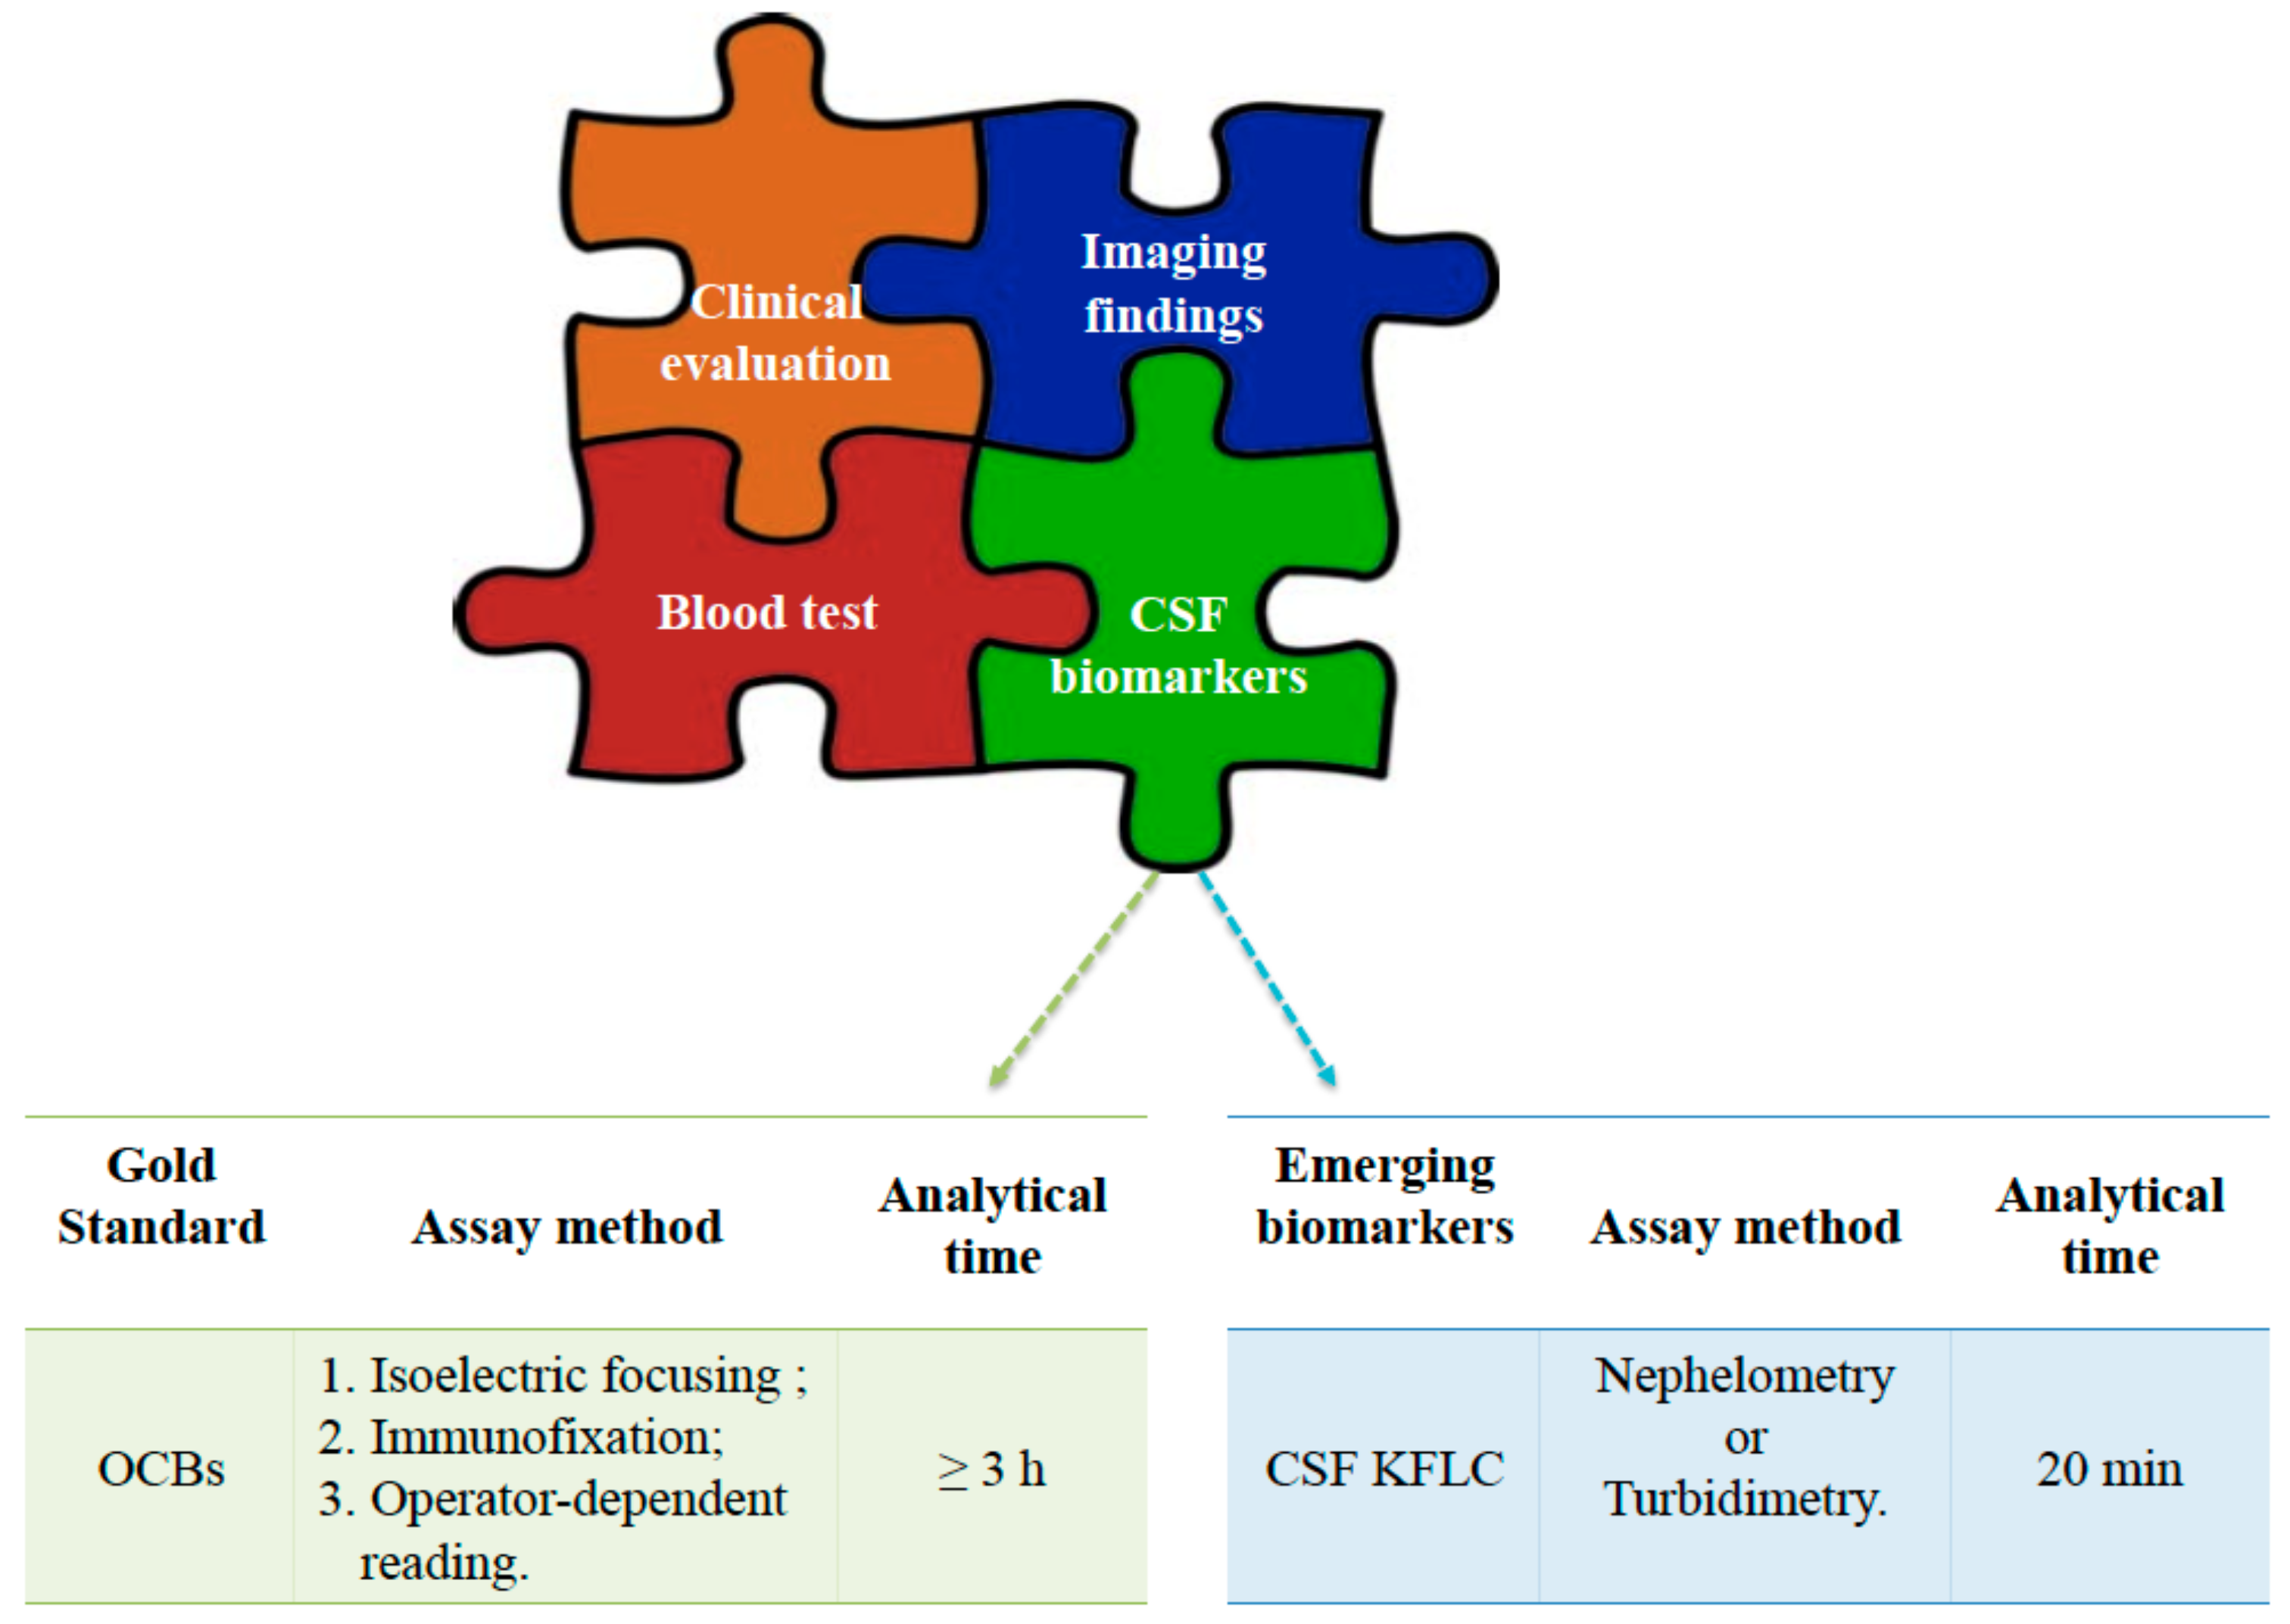
Intrathecal positivity of immunoglobulins can be observed in some diseases of the CNS and can be attributable to several mechanisms, such as an altered permeability of the blood–brain barrier, an intrathecal synthesis of immunoglobulins, or a combination of both [28,29]. From a pathophysiological point of view, it is of great interest to distinguish the intrathecal synthesis of Ig from those “poured” back into the CSF through the blood–brain barrier (BBB). During inflammatory processes, B cells can migrate into the CNS, producing Ig. The newly synthesized Ig contribute to the CSF pool of Ig, including the ones derived by BBB diffusion [30,31]. In this context, the examination of CSF includes the quantitative measurements of Ig and albumin and a qualitative analysis of CSF Ig in comparison with serum Ig. The latter is based on the detection of oligoclonal bands by isoelectric focusing (IEF) followed by IgG specific immunoblotting (Figure 2). The detection of a specific IgG oligoclonal profile in CSF, not detected in serum, remains the major biochemical diagnostic marker for MS because it specifically indicates intrathecal synthesis of IgG [32,33]. However, this approach has several limitations, such as the operator-dependent interpretation of results; the need of time-consuming protocols, with an average time for analytical processing of over 3 h; and high costs. Moreover, there is no consensus on the definition of cut-offs for positivity. It should also be noticed that OCBs can be observed in patients affected by other neurological diseases, and they can be detected in about 8% of individuals from the general population [33,34,35,36,37].
In this context, the quantification of the kappa free light chain (kFLC) and the λ free light chain (λFLC) in CSF seems to be a promising test [37,38,39] (Figure 2). Most authors have focused their interest on kFLC chains compared to λFLC. This choice is supported by the observation of a higher increase of kFLC in subjects with MS compared to λFLC in CSF, suggesting more suitability for clinical purposes [35,39].
Recently, the clinical use of the K Index [(CSFFLC/SerumFLC)/(CSFAlbumin/SerumAlbumin)] has been proposed instead of the CSF kappa chain determination alone because the K Index takes into account the BBB integrity and it showed a higher diagnostic accuracy with a lower rate of false positives results [37]. The recent interest in FLC has been mainly supported by the availability of feasible and automated assays. The most common assays used for the measurement of FLC are turbidimetry or nephelometric assays (Figure 2) [14,29,40,41]. In CNS infectious diseases, an increase of λFLC levels was observed, and in some cases it was greater than the one observed for kFLC. Thus, an increase in λFLC could be suggestive of infection in those cases in which the diagnosis of MS is not well defined [15]. Mass spectroscopy studies have shown that the kappa chains may be detected in CSF as monomers and dimers, while the λ chains are mainly in the form of dimers [42]. Ramsden et al. argued that the presence of multiple states of aggregation of the analyte could affect quantification when nephelometric assays, which are strongly influenced by the rate of antibody-antigen aggregation, are used. At present, this issue requires more investigations due to conflicting data from literature [37,38,41,43]. Recently, Nazarov, V. et al. showed an association between kFLC and the degree of irreversible disability in MS patients. In particular, the authors showed that MS patients with high levels of kFLC reached disability faster than patients who had low kFLC levels, suggesting that it can be a good prognostic marker in MS [44,45]. Goffette et al. studied 33 patients with clinically suspected MS and no detectable OCB and reported that 54% of them were positive for kFLC. The Authors concluded that the detection of CSF kFLC could replace the CSF-specific IgG OCB [46]. Valencia-Vera, E. et al. have recently evaluated the diagnostic accuracy of K Index in 123 consecutive subjects undergoing the CSF OCB test and calculated an algorithm including both K Index and OCB interpretation. The authors evaluated the kFLC assay as a screening tool for the selection of patients that require OCB test for diagnosis confirmation. Nevertheless, the authors failed to demonstrate a higher diagnostic sensitivity and specificity of kFLC in comparison to OCB test [32]. It should be emphasized that the published studies on this topic examined small populations and used different analytical methods, metrics, and cut-offs (Table 2) [20,32,46,47,48,49,50].
Therefore, the clinical use of kFLC requires further investigations in order to obtain a definitive validation.
The actual McDonald criteria recommend the analysis of oligoclonal IgG bands for the evaluation of patients with suspected MS but didn’t include the quantification of kFLC as a possible diagnostic biomarker [25]. Moreover, the updated criteria emphasize the lack of a single laboratory test with adequate diagnostic performance for the diagnosis of MS. Nevertheless, at present, differential diagnosis between suspected MS and other CNS demyelinating pathologies can be made using serological evaluation of the IgG autoantibodies anti-aquaporin-4 (AQP4) and the IgG autoantibodies directed against the oligodendrocytic myelin glycoprotein (MOG-IgG). Both these tests are useful when clinical presentation, imaging, or laboratory findings are atypical in MS suspected patients. In particular, the AQP4 autoantibody is a specific biomarker for neuromyelitis optica spectrum disorders (NMOSD) [51]. MOG-IgG antibody is a biomarker of MOG-associated encephalomyelitis (MOG-EM), a relatively rare demyelinating disease characterized by different clinical manifestations, including recurrent and bilateral optic neuritis, transverse myelitis, brain stem encephalitis, and acute disseminated encephalomyelitis (ADEM) [25,52,53].
5. Conclusions
The CSF FLCs analysis reflects the intrathecal synthesis of immunoglobulins. At present, their clinical utilization is limited by analytical factors, the absence of reference values and clinically-validated cut-offs [53]. On the other hand, the evaluation of OCB, considered the gold standard for the demonstration of Ig intrathecal synthesis by international guidelines, is a time-consuming and laborious assay affected by an operator-dependent interpretation. A misleading interpretation of CSF findings can occur, especially when ambiguous oligoclonal band patterns are detected. In these cases, the MS diagnosis should be considered with caution and the introduction of a more accurate biomarker is advocated [54]. The integration among physical examination, imaging, and an appropriately validated intrathecal FLC index, together with CSF OCBs represents a promising strategy to guide clinicians towards an early diagnosis of MS and adequate treatments in order to improve the quality of life of MS patients and limit their disability.
Funding
This research received no external funding.
Conflicts of Interest
The authors declare no conflict of interest.
References
- Baranzini, S.E.; Oksenberg, J.R. The genetics of multiple sclerosis: From 0 to 200 in 50 years. Trends Genet. 2017, 33, 960–970. [Google Scholar] [CrossRef] [PubMed]
- Mallucci, G.; Peruzzotti-Jametti, L.; Bernstock, J.D.; Pluchino, S. The role of immune cells, glia and neurons in white and gray matter pathology in multiple sclerosis. Prog Neurobiol. 2015, 127, 1–22. [Google Scholar] [CrossRef] [PubMed]
- Kingwell, E.; Marriott, J.J.; Jetté, N.; Pringsheim, T.; Makhani, N.; Morrow, SA.; Fisk, J.D.; Evans, C.; Béland, S.G.; Kulaga, S.; et al. Incidence and prevalence of multiple sclerosis in Europe: A systematic review. BMC Neurol. 2013, 13, 128. [Google Scholar] [CrossRef] [PubMed]
- Heydarpour, P.; Khoshkish, S.; Abtahi, S.; Moradi-Lakeh, M.; Sahraian, M.A. Multiple Sclerosis Epidemiology in Middle East and North Africa: A Systematic Review and Meta-Analysis. Neuroepidemiology 2015, 44, 232–244. [Google Scholar] [CrossRef]
- Ahlgren, C.; Odén, A.; Lycke, J. High nationwide incidence of multiple sclerosis in Sweden. PLoS ONE 2014, 9, e108599. [Google Scholar] [CrossRef] [PubMed]
- Jiang, X.; Olsson, T.; Alfredsson, L. Age at Menarche and Risk of Multiple Sclerosis: Current Progress from Epidemiological Investigations. Front. Immunol. 2018, 9, 2600. [Google Scholar] [CrossRef] [PubMed]
- Pirttisalo, A.L.; Soilu-Hänninen, M.; Sipilä, J.O.T. Multiple sclerosis epidemiology in Finland: Regional differences and high incidence. Acta Neurol. Scand. 2018, 139, 353–359. [Google Scholar] [CrossRef]
- Agnello, L.; Scazzone, C.; Lo Sasso, B.; Bellia, C.; Bivona, G.; Realmuto, S.; Brighina, F.; Schillaci, R.; Ragonese, P.; Salemi, G.; et al. VDBP, CYP27B1, and 25-Hydroxyvitamin D gene polymorphism analyses in a group of Sicilian multiple sclerosis patients. Biochem. Genet. 2017, 55, 183–192. [Google Scholar] [CrossRef]
- Bivona, G.; Agnello, L.; Ciaccio, M. Vitamin D and Immunomodulation: Is It Time to Change the Reference Values? Ann. Clin. Lab. Sci. 2017, 47, 508–510. [Google Scholar]
- Bivona, G.; Agnello, L.; Pivetti, A.; Milano, S.; Scazzone, C.; Lo Sasso, B.; Ciaccio, M. Association between hypovitaminosis D and systemic sclerosis: True or fake? Clin. Chim. Acta 2016, 458, 115–119. [Google Scholar] [CrossRef]
- Agnello, L.; Scazzone, C.; Ragonese, P.; Salemi, G.; Lo Sasso, B.; Schillaci, R.; Musso, G.; Bellia, C.; Ciaccio, M. Vitamin D receptor polymorphisms and 25-hydroxyvitamin D in a group of Sicilian multiple sclerosis patients. Neurol. Sci. 2016, 37, 261–267. [Google Scholar] [CrossRef]
- Agnello, L.; Scazzone, C.; Ragonese, P.; Salemi, G.; Lo Sasso, B.; Schillaci, R.; Musso, G.; Bellia, C.; Ciaccio, M. A new role of CYP2R1 in multiple sclerosis. Biochim. Clin. 2018, 42, 294–299. [Google Scholar] [CrossRef]
- Agnello, L.; Scazzone, C.; Lo Sasso, B.; Ragonese, P.; Milano, S.; Salemi, G.; Ciaccio, M. CYP27A1, CYP24A1, and RXR-α Polymorphisms, Vitamin D, and Multiple Sclerosis: A Pilot Study. J. Mol. Neurosci. 2018, 66, 77–84. [Google Scholar] [CrossRef] [PubMed]
- Presslauer, S.; Milosavljevic, D.; Brücke, T.; Bayer, P.; Hübl, W. Elevated levels of kappa free light chains in CSF support the diagnosis of multiple sclerosis. J. Neurol. 2008, 255, 1508–1514. [Google Scholar] [CrossRef] [PubMed]
- Bernardi, G.; Cataldo, I. Quantitation of immunoglobulin free light chains in cerebrospinal fluid. Biochim. Clin. 2013, 37, 389–394. [Google Scholar]
- Napodano, C.; Pocino, K.; Rigante, D.; Stefanile, A.; Gulli, F.; Marino, M.; Basile, V.; Rapaccini, G.L.; Basile, U. Free light chains and autoimmunity. Autoimmun. Rev. 2019. [Google Scholar] [CrossRef] [PubMed]
- Basnayake, K.; Stringer, S.J.; Hutchison, C.A.; Cockwell, P. The biology of immunoglobulin free light chains and kidney injury. Kidney Int. 2011, 79, 1289–1301. [Google Scholar] [CrossRef] [Green Version]
- Basile, U.; Gulli, F.; Gragnani, L.; Napodano, C.; Pocino, K.; Rapaccini, G.L.; Mussap, M.; Zignego, A.L. Free light chains: Eclectic multipurpose biomarker. J. Immunol. Methods 2017, 451, 11–19. [Google Scholar] [CrossRef]
- Dutta, R.; Trapp, B.D. Pathogenesis of axonal and neuronal damage in multiple sclerosis. Neurology 2007, 68 (Suppl. 3), S22–S31. [Google Scholar] [CrossRef]
- Puthenparampil, M.; Federle, L.; Miante, S.; Zito, A.; Toffanin, E.; Ruggero, S.; Ermani, M.; Pravato, S.; Poggiali, D.; Perini, P.; et al. BAFF Index and CXCL13 levels in the cerebrospinal fluid associate respectively with intrathecal IgG synthesis and cortical atrophy in multiple sclerosis at clinical onset. J. Neuroinflamm. 2017, 14, 11. [Google Scholar] [CrossRef]
- Lisak, R.P.; Benjamins, J.A.; Nedelkoska, L.; Barger, J.L.; Ragheb, S.; Fan, B.; Ouamara, N.; Johnson, T.A.; Rajasekharan, S.; Bar-Or, A. Secretory products of multiple sclerosis B cells are cytotoxic to oligodendroglia in vitro. J. Neuroimmunol. 2012, 246, 85–95. [Google Scholar] [CrossRef]
- Myhr, K.M.; Torkildsen, Ø.; Lossius, A.; Bø, L.; Holmøy, T. B cell depletion in the treatment of multiple sclerosis. Expert Opin Biol Ther. 2019, 19, 261–271. [Google Scholar] [CrossRef]
- Polman, C.H.; Reingold, S.C.; Edan, G.; Filippi, M.; Hartung, HP.; Kappos, L.; Lublin, F.D.; Metz, L.M.; McFarland, H.F.; O’Connor, P.W.; et al. Diagnostic Criteria for Multiple Sclerosis: 2005 Revisions to the “McDonald Criteria”. Ann. Neurol. 2005, 58, 840–846. [Google Scholar] [CrossRef]
- Polman, C.H.; Reingold, S.C.; Banwell, B.; Clanet, M.; Cohen, J.A.; Filippi, M.; Fujihara, K.; Havrdova, E.; Hutchinson, M.; Kappos, L.; et al. Diagnostic Criteria for Multiple Sclerosis: 2010 Revisions to the McDonald Criteria. Ann. Neurol. 2011, 69, 292–302. [Google Scholar] [CrossRef]
- Thompson, A.J.; Banwell, B.L.; Barkhof, F.; Carroll, W.M.; Coetzee, T.; Comi, G.; Correale, J.; Fazekas, F.; Filippi, M.; Freedman, M.S.; et al. Diagnosis of multiple sclerosis: 2017 revisions of the McDonald criteria. Lancet Neurol. 2018, 17, 162–173. [Google Scholar] [CrossRef]
- Olsson, B.; Lautner, R.; Andreasson, U.; Öhrfelt, A.; Portelius, E.; Bjerke, M.; Hölttä, M.; Rosén, C.; Olsson, C.; Strobel, G.; et al. CSF and blood biomarkers for the diagnosis of Alzheimer’s disease: A systematic review and meta-analysis. Lancet Neurol. 2016, 15, 673–684. [Google Scholar] [CrossRef]
- Agnello, L.; Bivona, G.; Novo, G.; Scazzone, C.; Muratore, M.; Levantino, P.; Bellia, C.; Lo Sasso, B.; Ciaccio, M. Heart-type fatty acid binding protein is a sensitive biomarker for early AMI detection in troponin negative patients: A pilot study. Scand. J. Clin. Lab. Investig. 2017, 77, 428–432. [Google Scholar] [CrossRef]
- Reiber, H.; Felgenhauer, K. Protein transfer at the blood cerebrospinal fluid barrier and the quantitation of the humoral immune response within the central nervous system. Clin. Chim. Acta 1987, 163, 319–328. [Google Scholar] [CrossRef]
- Fischer, C.; Arneth, B.; Koehler, J.; Lotz, J.; Lackner, K.J. Kappa free light chains in cerebrospinal fluid as markers of intrathecal immunoglobulin synthesis. Clin. Chem. 2004, 50, 1809–1813. [Google Scholar] [CrossRef]
- Reiber, H.; Peter, J.B. Cerebrospinal fluid analysis: Disease-related data patterns and evaluation programs. J. Neurol. Sci. 2001, 184, 101–122. [Google Scholar] [CrossRef]
- Reiber, H. Dynamics of brain-derived proteins in cerebrospinal fluid. Clin. Chim. Acta 2001, 310, 173–186. [Google Scholar] [CrossRef] [Green Version]
- Valencia-Vera, E.; Martinez-Escribano Garcia-Ripoll, A.; Abalos-Garcia, C.; Segovia-Cuevas, M.J. Application of κ free light chains in cerebrospinal fluid as a biomarker in multiple sclerosis diagnosis: Development of a diagnosis algorithm. Clin. Chem. Lab. Med. 2018, 56, 609–613. [Google Scholar] [CrossRef]
- Andersson, M.; Alvarez-Cermeño, J.; Bernardi, G.; Cogato, I.; Fredman, P.; Frederiksen, J.; Fredrikson, S.; Gallo, P.; Grimaldi, L.M.; Grønning, M. Cerebrospinal fluid in the diagnosis of multiple sclerosis: A consensus report. J. Neurol. Neurosurg. Psychiatry 1994, 57, 897–902. [Google Scholar] [CrossRef]
- Nylander, A.; Hafler, D.A. Multiple sclerosis. J. Clin. Investig. 2012, 122, 1180–1188. [Google Scholar] [CrossRef]
- Hassan-Smith, G.; Durant, L.; Tsentemeidou, A.; Assi, L.K.; Faint, J.M.; Kalra, S.; Douglas, M.R.; Curnow, S.J. High sensitivity and specificity of elevated cerebrospinal fluid kappa free light chains in suspected multiple sclerosis. J. Neuroimmunol. 2014, 276, 175–179. [Google Scholar] [CrossRef]
- Fortini, A.S.; Sanders, E.L.; Weinshenker, B.G.; Katzmann, J.A. Cerebrospinal fluid oligoclonal bands in the diagnosis of multiple sclerosis. Isoelectric focusing with IgG immunoblotting compared with high-resolution agarose gel electrophoresis and cerebrospinal fluid IgG index. Am. J. Clin. Pathol. 2003, 120, 672–675. [Google Scholar] [CrossRef]
- Ramsden, D.B. Multiple sclerosis: Assay of free immunoglobulin light chains. Ann. Clin. Biochem. 2017, 54, 5–13. [Google Scholar] [CrossRef]
- Pieri, M.; Storto, M.; Pignalosa, S.; Zenobi, R.; Buttari, F.; Bernardini, S.; Centonze, D.; Dessi, M. KFLC Index utility in multiple sclerosis diagnosis: Further confirmation. J. Neuroimmunol. 2017, 309, 31–33. [Google Scholar] [CrossRef]
- Duranti, F.; Pieri, M.; Centonze, D.; Buttari, F.; Bernardini, S.; Dessi, M. Determination of kFLC and k Index in cerebrospinal fluid: A valid alternative to assess intrathecal immunoglobulin synthesis. J. Neuroimmunol. 2013, 263, 116–120. [Google Scholar] [CrossRef]
- Senel, M.; Tumani, H.; Lauda, F.; Presslauer, S.; Mojib-Yezdani, R.; Otto, M.; Brettschneider, J. Cerebrospinal fluid immunoglobulin kappa light chain in clinically isolated syndrome and multiple sclerosis. PLoS ONE 2014, 9, e88680. [Google Scholar] [CrossRef]
- Makshakov, G.; Nazarov, V.; Kochetova, O.; Surkova, E.; Lapin, S.; Evdoshenko, E. Diagnostic and prognostic value of the cerebrospinal fluid concentration of immunoglobulin free light chains in clinically isolated syndrome with conversion to multiple sclerosis. PLoS ONE 2015, 10, e0143375. [Google Scholar] [CrossRef]
- Kaplan, B.; Golderman, S.; Yahalom, G.; Yeskaraev, R.; Ziv, T.; Aizenbud, B.M.; Sela, B.A.; Livneh, A. Free light chain monomer dimer patterns in the diagnosis of multiple sclerosis. J. Immunol. Methods 2013, 390, 74–80. [Google Scholar] [CrossRef]
- Voortman, M.M.; Stojakovic, T.; Pirpamer, L.; Jehna, M.; Langkammer, C.; Scharnagl, H.; Reindl, M.; Ropele, S.; Seifert-Held, T.; Archelos, J.J. Prognostic value of free light chains lambda and kappa in early multiple sclerosis. Mult. Scler. 2017, 23, 1496–1505. [Google Scholar] [CrossRef]
- Nazarov, V.; Makshakov, G.; Kalinin, I.; Lapin, S.; Surkova, E.; Mikhailova, L.; Gilburd, B.; Skoromets, A.; Evdoshenko, E. Concentrations of immunoglobulin free light chains in cerebrospinal fluid predict increased level of brain atrophy in multiple sclerosis. Immunol. Res. 2018, 66, 761–767. [Google Scholar] [CrossRef]
- Nazarov, V.D.; Makshakov, G.S.; Mazing, A.V.; Surkova, E.A.; Krasnov, V.S.; Shumilina, M.V.; Totolyan, N.A.; Evdoshenko, E.P.; Lapin, S.V.; Emanuel, V.L.; et al. Diagnostic value of immunoglobulin free light chains at the debut of multiple sclerosis. Zhurnal Nevrol. Psikhiatrii Im. SS Korsakova 2017, 117, 60–65. [Google Scholar] [CrossRef]
- Goffette, S.; Schluep, M.; Henry, H.; Duprez, T.; Sindic, C.J. Detection of oligoclonal free kappa chains in the absence of oligoclonal IgG in the CSF of patients with suspected multiple sclerosis. J. Neurol. Neurosurg. Psychiatry 2004, 75, 308–310. [Google Scholar] [CrossRef] [Green Version]
- Sáez, M.S.; Rojas, J.I.; Lorenzón, M.V.; Sánchez, F.; Patrucco, L.; Míguez, J.; Azcona, C.; Sorroche, P.; Cristiano, E. Validation of CSF free light chain in diagnosis and prognosis of multiple sclerosis and clinically isolated syndrome: Prospective cohort study in Buenos Aires. J. Neurol. 2019, 266, 112–118. [Google Scholar] [CrossRef]
- Christiansen, M.; Gjelstrup, M.C.; Stilund, M.; Christensen, T.; Petersen, T.; Jon Møller, H. Cerebrospinal fluid free kappa light chains and kappa index perform equal to oligoclonal bands in the diagnosis of multiple sclerosis. Clin. Chem. Lab. Med. 2018, 57, 210–220. [Google Scholar] [CrossRef]
- Gurtner, K.M.; Shosha, E.; Bryant, S.C.; Andreguetto, B.D.; Murray, D.L.; Pittock, S.J.; Willrich, M.A.V. CSF free light chain identification of demyelinating disease: Comparison with oligoclonal banding and other CSF indexes. Clin. Chem. Lab. Med. 2018, 56, 1071–1080. [Google Scholar] [CrossRef]
- Menéndez-Valladares, P.; García-Sánchez, M.I.; Adorna Martínez, M.; García De Veas Silva, J.L.; Bermudo Guitarte, C.; Izquierdo Ayuso, G. Validation and meta-analysis of kappa index biomarker in multiple sclerosis diagnosis. Autoimmun. Rev. 2019, 18, 43–49. [Google Scholar] [CrossRef]
- Mader, S.; Brimberg, L. Aquaporin-4 Water Channel in the Brain and Its Implication for Health and Disease. Cells 2019, 8, E90. [Google Scholar] [CrossRef] [PubMed]
- Sato, D.K.; Callegaro, D.; Lana-Peixoto, M.A.; Waters, P.J.; de Haidar Jorge, F.M.; Takahashi, T.; Nakashima, I.; Apostolos-Pereira, S.L.; Talim, N.; Simm, R.F.; et al. Distinction between MOG antibody-positive and AQP4 antibody-positive NMO spectrum disorders. Neurology 2014, 82, 474–481. [Google Scholar] [CrossRef] [PubMed]
- Waters, P.; Woodhall, M.; O’Connor, K.C.; Reindl, M.; Lang, B.; Sato, D.K.; Juryńczyk, M.; Tackley, G.; Rocha, J.; Takahashi, T.; et al. MOG cell-based assay detects non-MS patients with inflammatory neurologic disease. Neurol. Neuroimmunol. Neuroinflamm. 2015, 2, e89. [Google Scholar] [CrossRef] [PubMed]
- Lopergolo, D.; Scribano, D.; Dell’Abate, M.T.; Zuppi, C.; Urbani, A.; De Michele, T. La misura delle catene leggere libere nel liquor nella diagnosi della sclerosi. Bioch. Clin. 2018, 42, e22–e25. [Google Scholar] [CrossRef]
Figure 1.
Symptom patterns that define the subtypes of multiple sclerosis (MS). CIS, clinically isolated syndrome; RRMS, relapsing/remitting multiple sclerosis; PPMS, primary progressive multiple sclerosis; SPMS, secondary progressive multiple sclerosis; PRMS, progressive-relapsing multiple sclerosis.

Figure 2.
Diagnosis of multiple sclerosis with analytical differences between detection of CSF kappa free light chains (kFLC) versus oligoclonal bands (OCBs) assay.
Figure 2.
Diagnosis of multiple sclerosis with analytical differences between detection of CSF kappa free light chains (kFLC) versus oligoclonal bands (OCBs) assay.


Table 1.
2017 McDonald criteria (2017) for the diagnosis of MS.
| Clinical Presentation | Additional Data Needed for MS Diagnosis |
| In patient with a typical attack/CIS at onset | |
| ≥2 clinical attacks and evidence of ≥2 lesions | None * |
| ≥2 clinical attacks and evidence of 1 lesion with history of previous attack involving lesions in different location | None * |
| ≥2 clinical attacks and evidence of 1 lesion | Evidence for DIS established by an additional clinical attack implicating different CNS site OR by MRI |
| 1 clinical attack and evidence of ≥2 lesions | Evidence for DIT established by an additional clinical attack implicating different CNS site or by MRI OR positive CSF-specific (i.e., not in serum) oligoclonal bands ** |
| 1 clinical attack and evidence of 1 lesion | Evidence for DIS established by an additional clinical attack implicating different CNS site or by MRI ORevidence for DIT established by an additional clinical attack implicating different CNS site OR by MRI OR positive CSF-specific (i.e., not in serum) oligoclonal bands ** |
| Clinical presentation | Additional data needed for MS Diagnosis |
| In patient with a progression of disability from onset (PPMS) | |
| Progression from onset | 1 year of disability progression (retrospective or prospective) AND two of these criteria:
|
* No additional data are required to demonstrate DIS and DIT. ** Positive CSF-specific oligoclonal bands (OCBs) are defined by the presence of at least two CSF-specific bands. MS, multiple sclerosis; CIS, clinically isolated syndrome; DIS, dissemination in space; DIT, dissemination in time; CNS, central nervous system; MRI, magnetic resonance imaging; CSF, cerebrospinal fluid; PPMS, primary progressive multiple sclerosis.
Table 2.
Clinical sensitivity and specificity of metrics in multiple sclerosis. MS, multiple sclerosis; CIS, clinically isolated syndrome; OCB, oligoclonal bands; CSF kFLC, Cerebrospinal fluid K free light chain; CSF λFLC, Cerebrospinal fluid λ free light chain.
Table 2.
Clinical sensitivity and specificity of metrics in multiple sclerosis. MS, multiple sclerosis; CIS, clinically isolated syndrome; OCB, oligoclonal bands; CSF kFLC, Cerebrospinal fluid K free light chain; CSF λFLC, Cerebrospinal fluid λ free light chain.
| Authors [Ref.] | Number of Subjects | Assay Method | Metrics | Cut-Off | Sensitivity, % | Specificity, % |
|---|---|---|---|---|---|---|
| Menendez-Valladares, P. et al. [50] | 334 patients | Nephelometry | kFLC Index | 10.62 | 91% | 89% |
| Saez, M.S. et al. [47] | 77 patients | Turbidimetry | OCB | Positive | 93% | 90.4% |
| CSF kFLC | 7.1 mg/L | 95% | 97% | |||
| CSF λFLC | 0.7 mg/L | 71% | 81% | |||
| kFLC + λFLC | / | 95% | ||||
| Puthenparampil, M. et al. [20] | 70 patients | Nephelometry | IgG Index | / | / | / |
| CSF and serum kFLC | / | / | / | |||
| 37 controls | CSF and serum λFLC | / | / | / | ||
| kFLC Index | 4.25 | 93.8% | 100.0% | |||
| λFLC Index | / | / | / | |||
| Christiansen, M. et al. [48] | 230 patients | Turbidimetry | OCB | Positive | 82.3% (MS) 56.8% (CIS) | 93.8% |
| IgG Index | 0.64 | 72.9% (MS) 51.3% (CIS) | 95.9% | |||
| CSF kFLC | 0.42 mg/L | 93.8% (MS) 70.3% (CIS) | 85.6% | |||
| CSF λFLC | 0.14 mg/L | 93.8% (MS) 86.5% (CIS) | 35.1% | |||
| kFLC Index | 5.9 | 92.7% (MS) 70.3% (CIS) | 86.6% | |||
| λFLC Index | 2.8 | 93.8% (MS) 81,1% (CIS) | 46.4% | |||
| Gurtner, K.M. et al. [49] | 325 residual paired CSF and serum samples | Nephelometry | OCB | Positive (≥4 bands) | 86.6% | 89.6% |
| CSF kFLC | 0.0611 mg/dL | 92.5% | 86.1% | |||
| CSF λFLC | 0.0244 mg/dL | 75.8% | 84.4% | |||
| kFLC Index | ≥8.87 | 88.1% | 88.7% | |||
| Valencia-Vera, E. et al. [32] | 123 unselected consecutive patients with CSF OCB request | Nephelometry | OCB | Positive | 89.2% | 81.2% |
| ≥0.92 | 97.3% | 45.88% | ||||
| kFLC index | ≥2.91 | 83.8% | 85.8% | |||
| ≥8.33 | 70.2% | 95.6% | ||||
| Goffette et al. [46] | 33 patients with clinical suspicion of MS | Immunoaffinity-mediated capillary blot | Free K Bands | Presence of free kappa bands | / | / |
© 2019 by the authors. Licensee MDPI, Basel, Switzerland. This article is an open access article distributed under the terms and conditions of the Creative Commons Attribution (CC BY) license (http://creativecommons.org/licenses/by/4.0/).
Share and Cite
MDPI and ACS Style
Lo Sasso, B.; Agnello, L.; Bivona, G.; Bellia, C.; Ciaccio, M. Cerebrospinal Fluid Analysis in Multiple Sclerosis Diagnosis: An Update. Medicina 2019, 55, 245. https://0-doi-org.brum.beds.ac.uk/10.3390/medicina55060245
AMA Style
Lo Sasso B, Agnello L, Bivona G, Bellia C, Ciaccio M. Cerebrospinal Fluid Analysis in Multiple Sclerosis Diagnosis: An Update. Medicina. 2019; 55(6):245. https://0-doi-org.brum.beds.ac.uk/10.3390/medicina55060245
Chicago/Turabian StyleLo Sasso, Bruna, Luisa Agnello, Giulia Bivona, Chiara Bellia, and Marcello Ciaccio. 2019. "Cerebrospinal Fluid Analysis in Multiple Sclerosis Diagnosis: An Update" Medicina 55, no. 6: 245. https://0-doi-org.brum.beds.ac.uk/10.3390/medicina55060245