Article

Comparison between Fluorimetry (Qubit) and Spectrophotometry (NanoDrop) in the Quantification of DNA and RNA Extracted from Frozen and FFPE Tissues from Lung Cancer Patients: A Real-World Use of Genomic Tests

1
Department of Pathology and Molecular Diagnostics, Aichi Cancer Center, Nagoya 4648681, Japan
2
Department of Respiratory Medicine, Kobe Central Hospital, Kobe 651115, Japan
3
Department of Thoracic Surgery, Aichi Cancer Center, Nagoya 4648681, Japan
4
Division of Translational Oncoimmunology, Aichi Cancer Research Institute, Nagoya 4648681, Japan
*
Author to whom correspondence should be addressed.
Submission received: 12 November 2021 / Revised: 9 December 2021 / Accepted: 15 December 2021 / Published: 17 December 2021
(This article belongs to the Special Issue Clinical Therapeutics of Non-small Cell Lung Cancer)

Abstract

:
Background and Objectives: Panel-based next-generation sequencing (NGS) has been carried out in daily clinical settings for the diagnosis and treatment guidance of patients with non-small cell lung cancer (NSCLC). The success of genomic tests including NGS depends in large part on preparing better-quality DNA or RNA; however, there are no established operating methods for preparing genomic DNA and RNA samples. Materials and Methods: We compared the following two quantitative methods, the QubitTM and NanoDropTM, using 585 surgical specimens, 278 biopsy specimens, and 82 cell block specimens of lung cancer that were used for genetic tests, including NGS. We analyzed the success rate of the genomic tests, including NGS, which were performed with DNA and RNA with concentrations that were outliers for the Qubit Fluorometer. Results: The absolute value for DNA concentrations had a tendency to be higher when measured with NanoDropTM regardless of the type of specimen; however, this was not the case for RNA. The success rate of DNA-based genomic tests using specimens with a concentration below the lower limit of QubitTM detection was as high as approximately 96%. At less than 60%, the success rate of RNA-based genomic tests, including RT-PCR, was not as satisfactory. The success rates of the AmpliSeqTM DNA panel sequencing and RNA panel sequencing were 77.8% and 91.5%, respectively. If at least one PCR amplification product could be obtained, then all RNA-based sequencing was performed successfully. Conclusions: The concentration measurements with NanoDropTM are reliable. The success rate of NGS with samples at concentrations below the limit of detection of QubitTM was relatively higher than expected, and it is worth performing PCR-based panel sequencing, especially in cases where re-biopsy cannot be performed.

1. Introduction

Recently, somatic mutations of EGFR and BRAF and gene rearrangements of ALK and ROS1 have been recommended for testing before the initial treatment of patients with advanced non-small cell lung cancer (NSCLC) based on the guidelines from major professional organizations [1,2,3,4,5]. Furthermore, panel-based next-generation sequencing (NGS) has come into practice in daily clinical settings for diagnosis and treatment guidance. Preparing better quality DNA or RNA is more dependent on other pre-analytic procedures, such as what happens after the surgery, fixation period, fixation procedure in general (especially for the majority of the labs which work with formalin fixed paraffin embedded tissues), procedures in a pathology laboratory, and nucleic acid extraction protocols, which are included in the Standard PRE analytical Code (SPREC) [6]; thus, the accuracy of the measurement of DNA or RNA has also become more important. The preparation of a proper DNA or RNA extraction procedure and the establishment of an accurate quantification method of these samples play a key role in the success of these genomic tests; there are no established operating methods for preparing genomic DNA and RNA.
DNA and RNA have been quantified using spectrophotometry, historically [7,8,9]; however, three important clinical problems need to be clarified in this method. The first problem is that UV absorbance measurements are not selective for DNA, RNA, or protein. The second is that the absolute values vary widely with other contaminants and base composition. The third is that the accuracy of spectrophotometry tends to be inadequate at low concentrations of DNA and RNA. To overcome these drawbacks, fluorescence-based quantitation method, QubitTM, has come to be widely used [10,11,12,13]. Quantitative polymerase chain reaction (qPCR) with a template-specific probe has also come into practice as an alternative quantification method. Although these two methods are certainly reliable, they are more laborious and expensive.
There are several reports that evaluated which methods are suitable for measuring DNA used for NGS. NanoDropTM tends to overestimate the concentration in several studies [14,15]. On the other hands, Hedyt C. et al. reported that there was no uniform tendency in the quantification methods of DNA concentration, and no difference in mutation analysis according to the results of the quantification method found, which included NanoDropTM, QubitTM, and qPCR [16].
Thus, no definitive quantification methods have been established and evaluated, especially in clinical practice. Here, we compared two commonly used quantitation methods, the QubitTM and NanoDropTM, using clinical samples that were used for genetic tests, including NGS.

2. Materials and Methods

2.1. Samples

A total of 585 surgical specimens, 278 biopsy specimens, and 82 cell block specimens of lung cancer were selected from the registry of Aichi Cancer Center Hospital from January 2017 to December 2017. This study was approved by the Research Ethics Committee of Aichi Cancer Center (No.2020-2-34).

2.2. Extraction of DNA and RNA

Tumor samples were obtained at surgery and were rapidly frozen in liquid nitrogen. Frozen tumor tissues specimens were grossly dissected, and DNA and total RNA were isolated using a QIAamp DNA Mini KitTM and an RNeasy Mini KitTM (Qiagen, Valencia, CA, USA), respectively. Immediately after the biopsy, cytological specimens applied to an uncoated slide were immersed in 95% alcohol, and DNA and total RNA were isolated using a QIAamp DNA Mini KitTM and an RNeasy Mini KitTM (Qiagen, Valencia, CA, USA), respectively.
DNA extraction from FFPE cell block specimens was performed using proteinase K. Briefly, the tissues were dewaxed with xylene and digested overnight at 56 °C and for 3 min at 95 °C with a 45:5:1 solution of RNase-free water, TaqGOLDTM buffer, and proteinase K, respectively (50 µL > for surgery specimens and 30 µL > for biopsy specimens). After digestion, the DNA was eluted with RNase-free water (50 µL > for surgery specimens and 30 µL > for biopsy specimens).

2.3. Quantification of DNA and RNA

The concentrations of DNA were determined using a Qubit 4TM Fluorometer with dsDNA HS Assay KitTM for Qubit and a NanoDrop™ Lite Spectrophotometer (Thermo Fisher Scientific, Wilmington, DE, USA).

2.4. Routine Genomic Tests

Genomic tests for EGFR, KRAS, BRAF, HER2, and ALK were carried out as previously reported [17]. Briefly, EGFR gene, KRAS gene, and BRAF gene were analyzed by CycleaveTM PCR and direct sequencing method. HER2 gene was analyzed by fragment PCR. An immunohistochemical analysis of anaplastic lymphoma kinase (ALK) with a mouse monoclonal antibody to ALK (ALK1, Dako) was performed.

2.5. Panel Sequencing

DNA- and RNA-based panel sequencing was performed only if one PCR amplification product could be obtained in routine genomic tests. Sequencing was performed using Ion 540 chips on Ion Torrent S5 Sequencer™ using barcoded libraries prepared with AmpliSeq™ Library Preparation Kits (Thermo Fisher Scientific, Wilmington, DE, USA) according to the manufacturer’s protocols. We defined the success of NGS as more than 1000 mean depth.

2.6. Statistical Analysis

Statistical analysis was performed using the regression analysis between the concentration evaluated with Nonodrop™ and Qubit™. All statistical analyses were performed using the JMP 12 software (SAS Institute, Cary, NC, USA).

3. Results

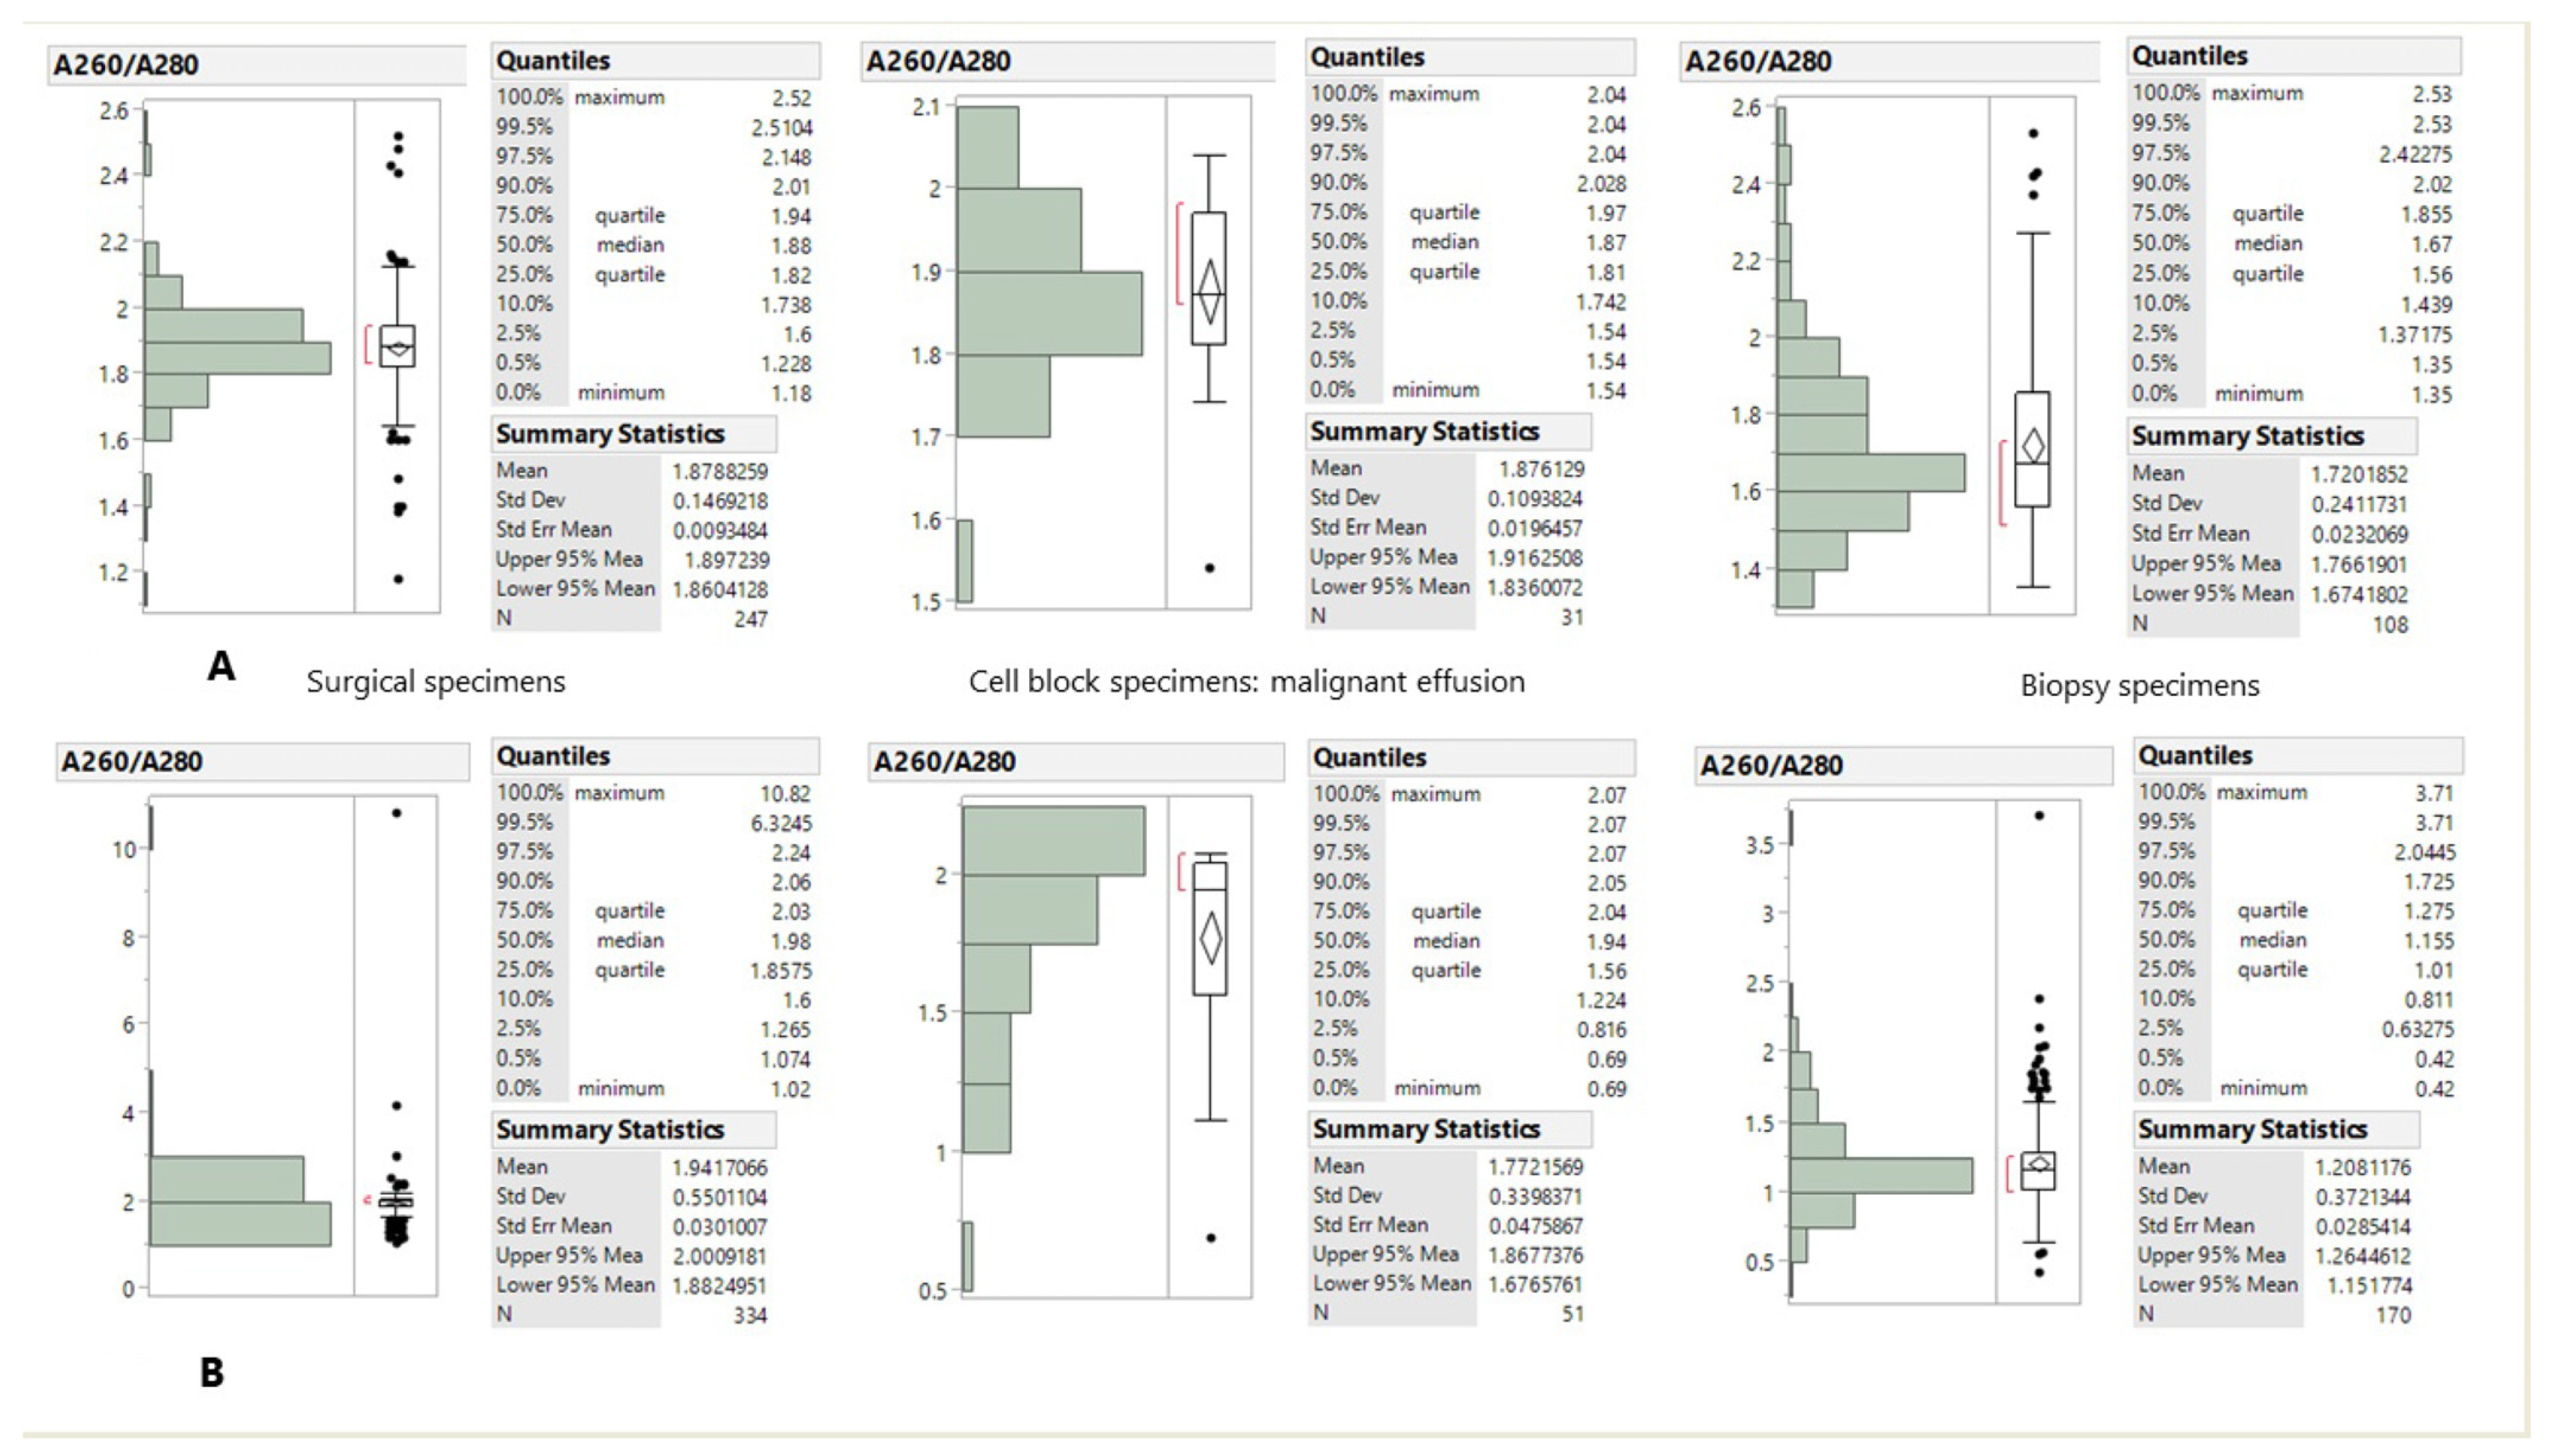
3.1. Quality of Frozen-DNA and RNA

The purity of DNA and RNA determined by the absorbance ratio at wavelength 260/280 nm (A260/A280) is shown in Figure 1. The median value of A260/A280 for DNA was 1.88 for the surgical specimens, 1.67 for the cell block specimens and 1.67 for the biopsy specimens (Figure 1A). The median value of A260/A280 for RNA was 1.98 for the surgical specimens, 1.94 for the cell block specimens, and 1.155 for the biopsy specimens (Figure 1B).

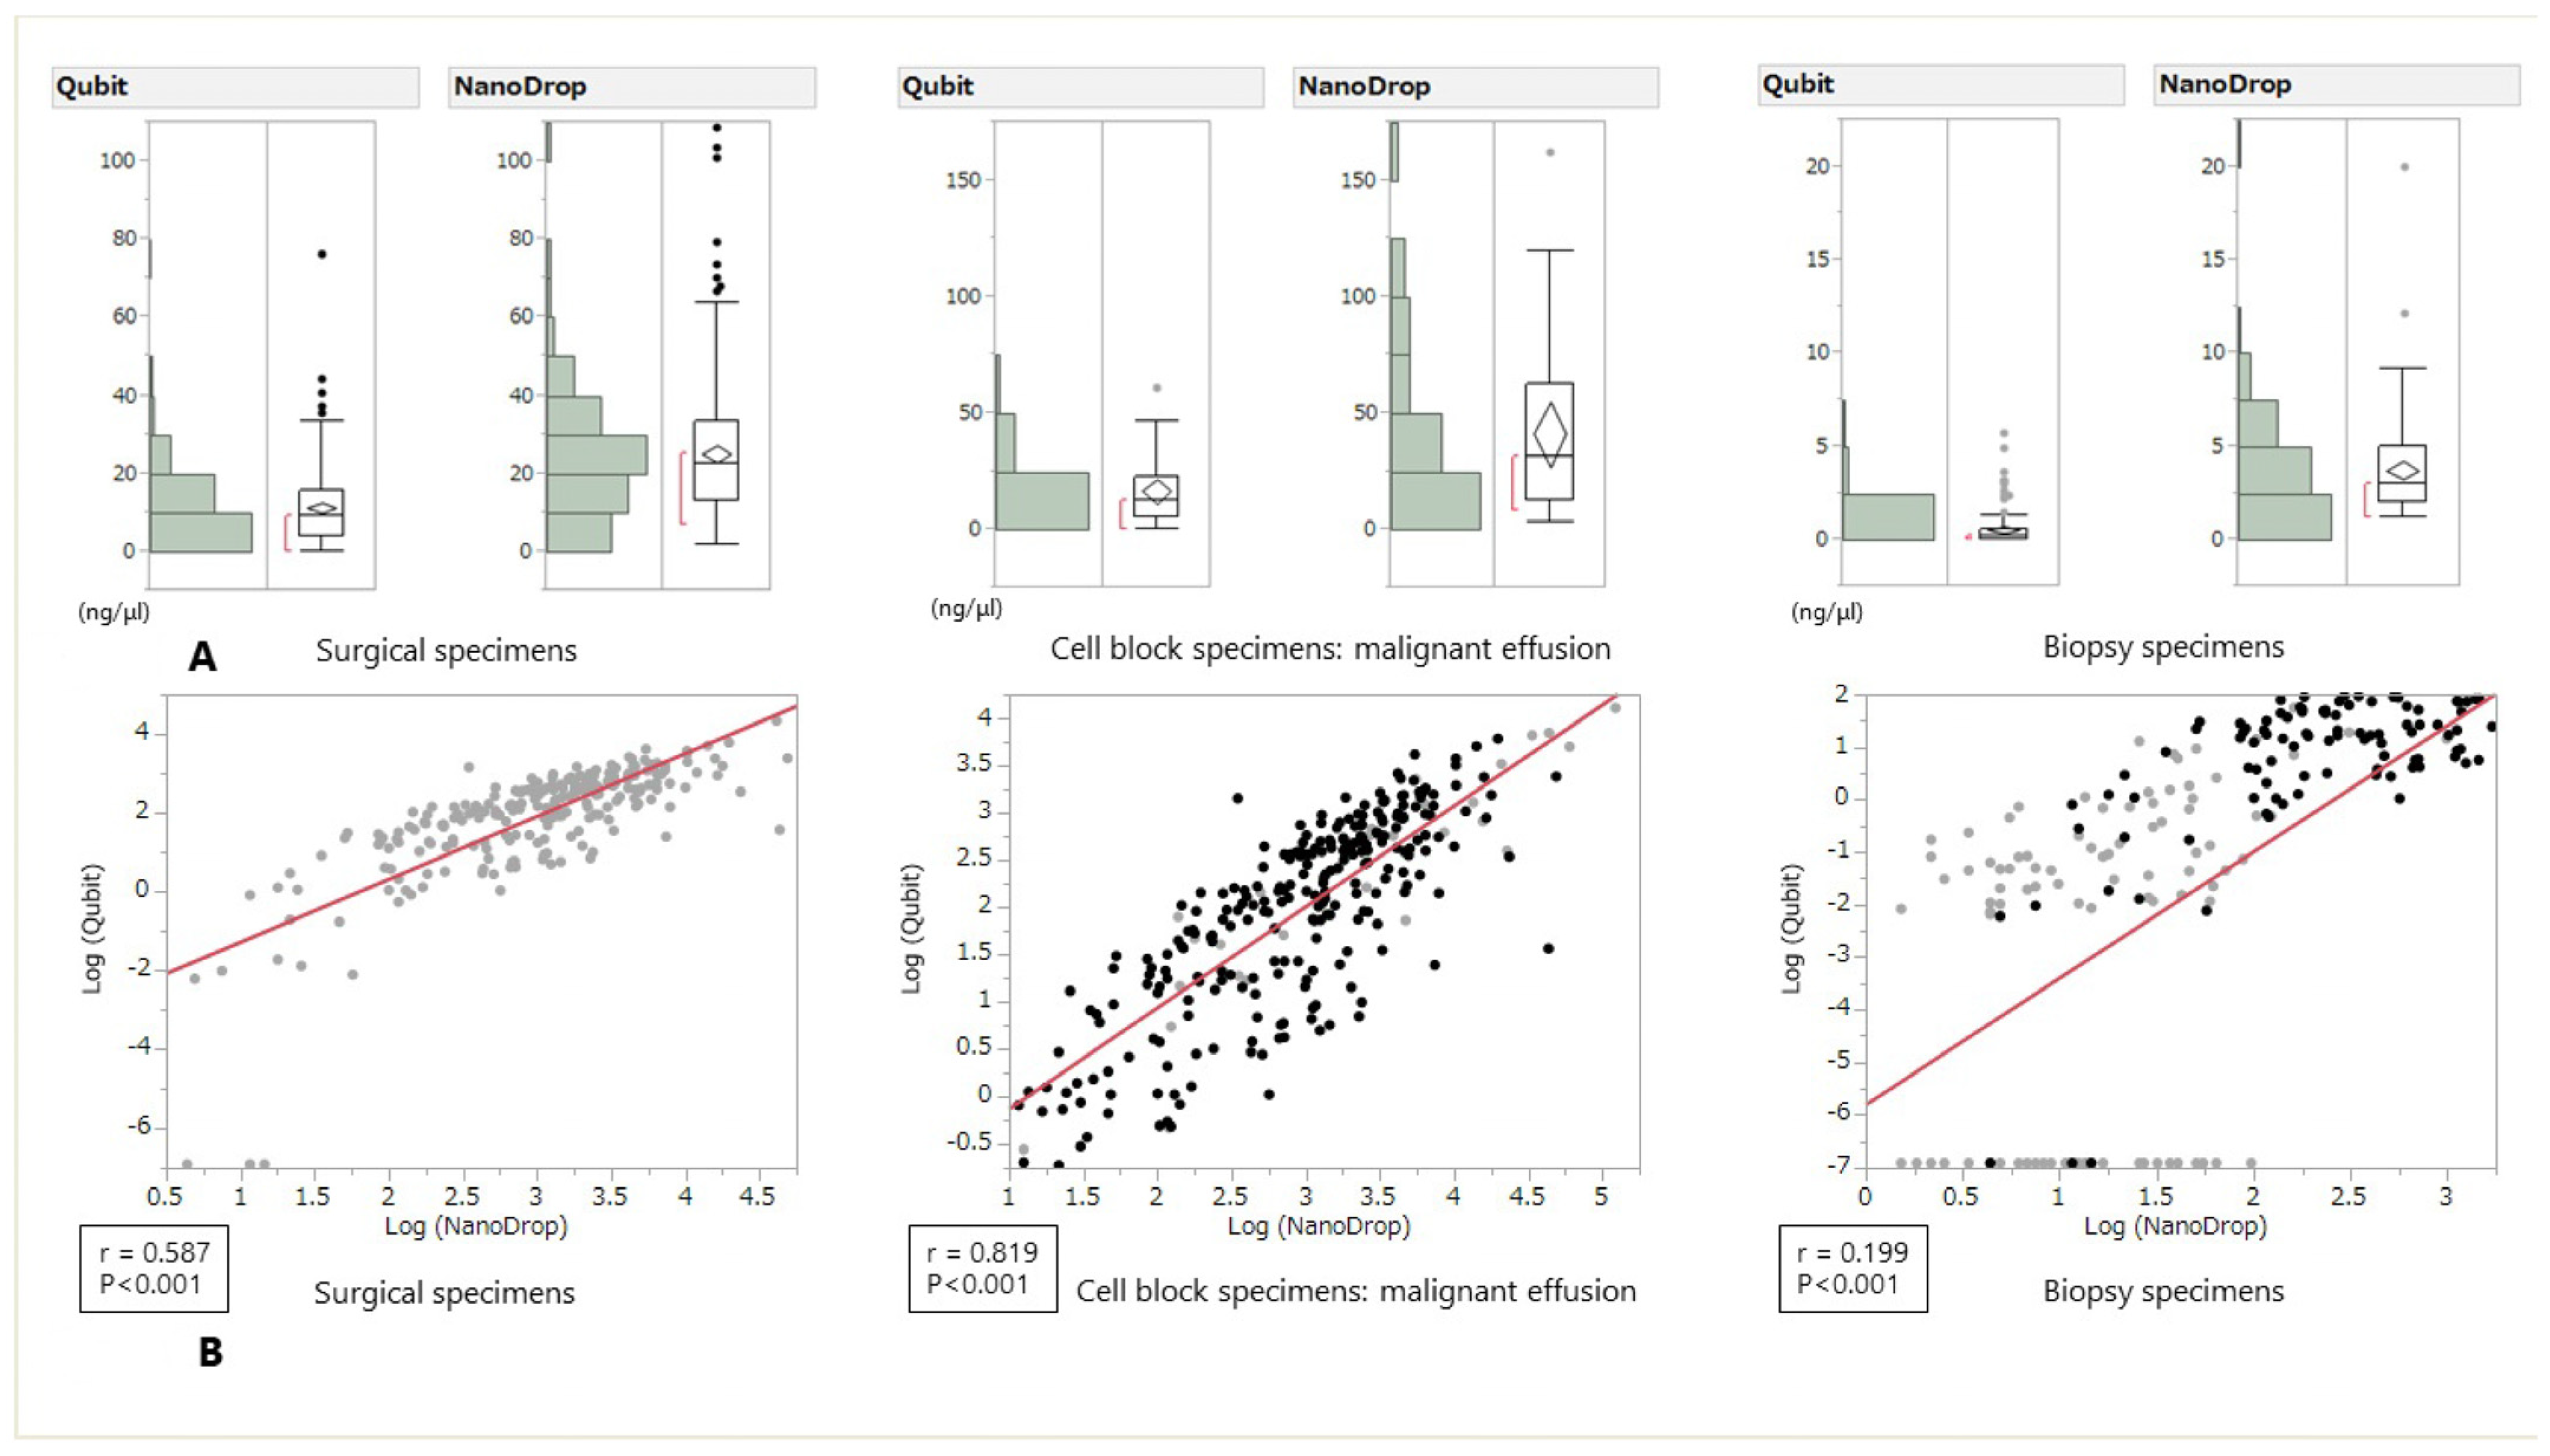
3.2. Quantification of Frozen DNA by NanoDrop and Qubit

The comparison of DNA concentrations quantified by NanoDrop and Qubit is shown in Figure 2. The absolute value of DNA concentration had a tendency to be higher when measured with NanoDrop regardless of the type of specimen. In the regression analysis, a positive correlation was found in this order: cell block specimens, surgical specimens, and biopsy specimens (Figure 2).

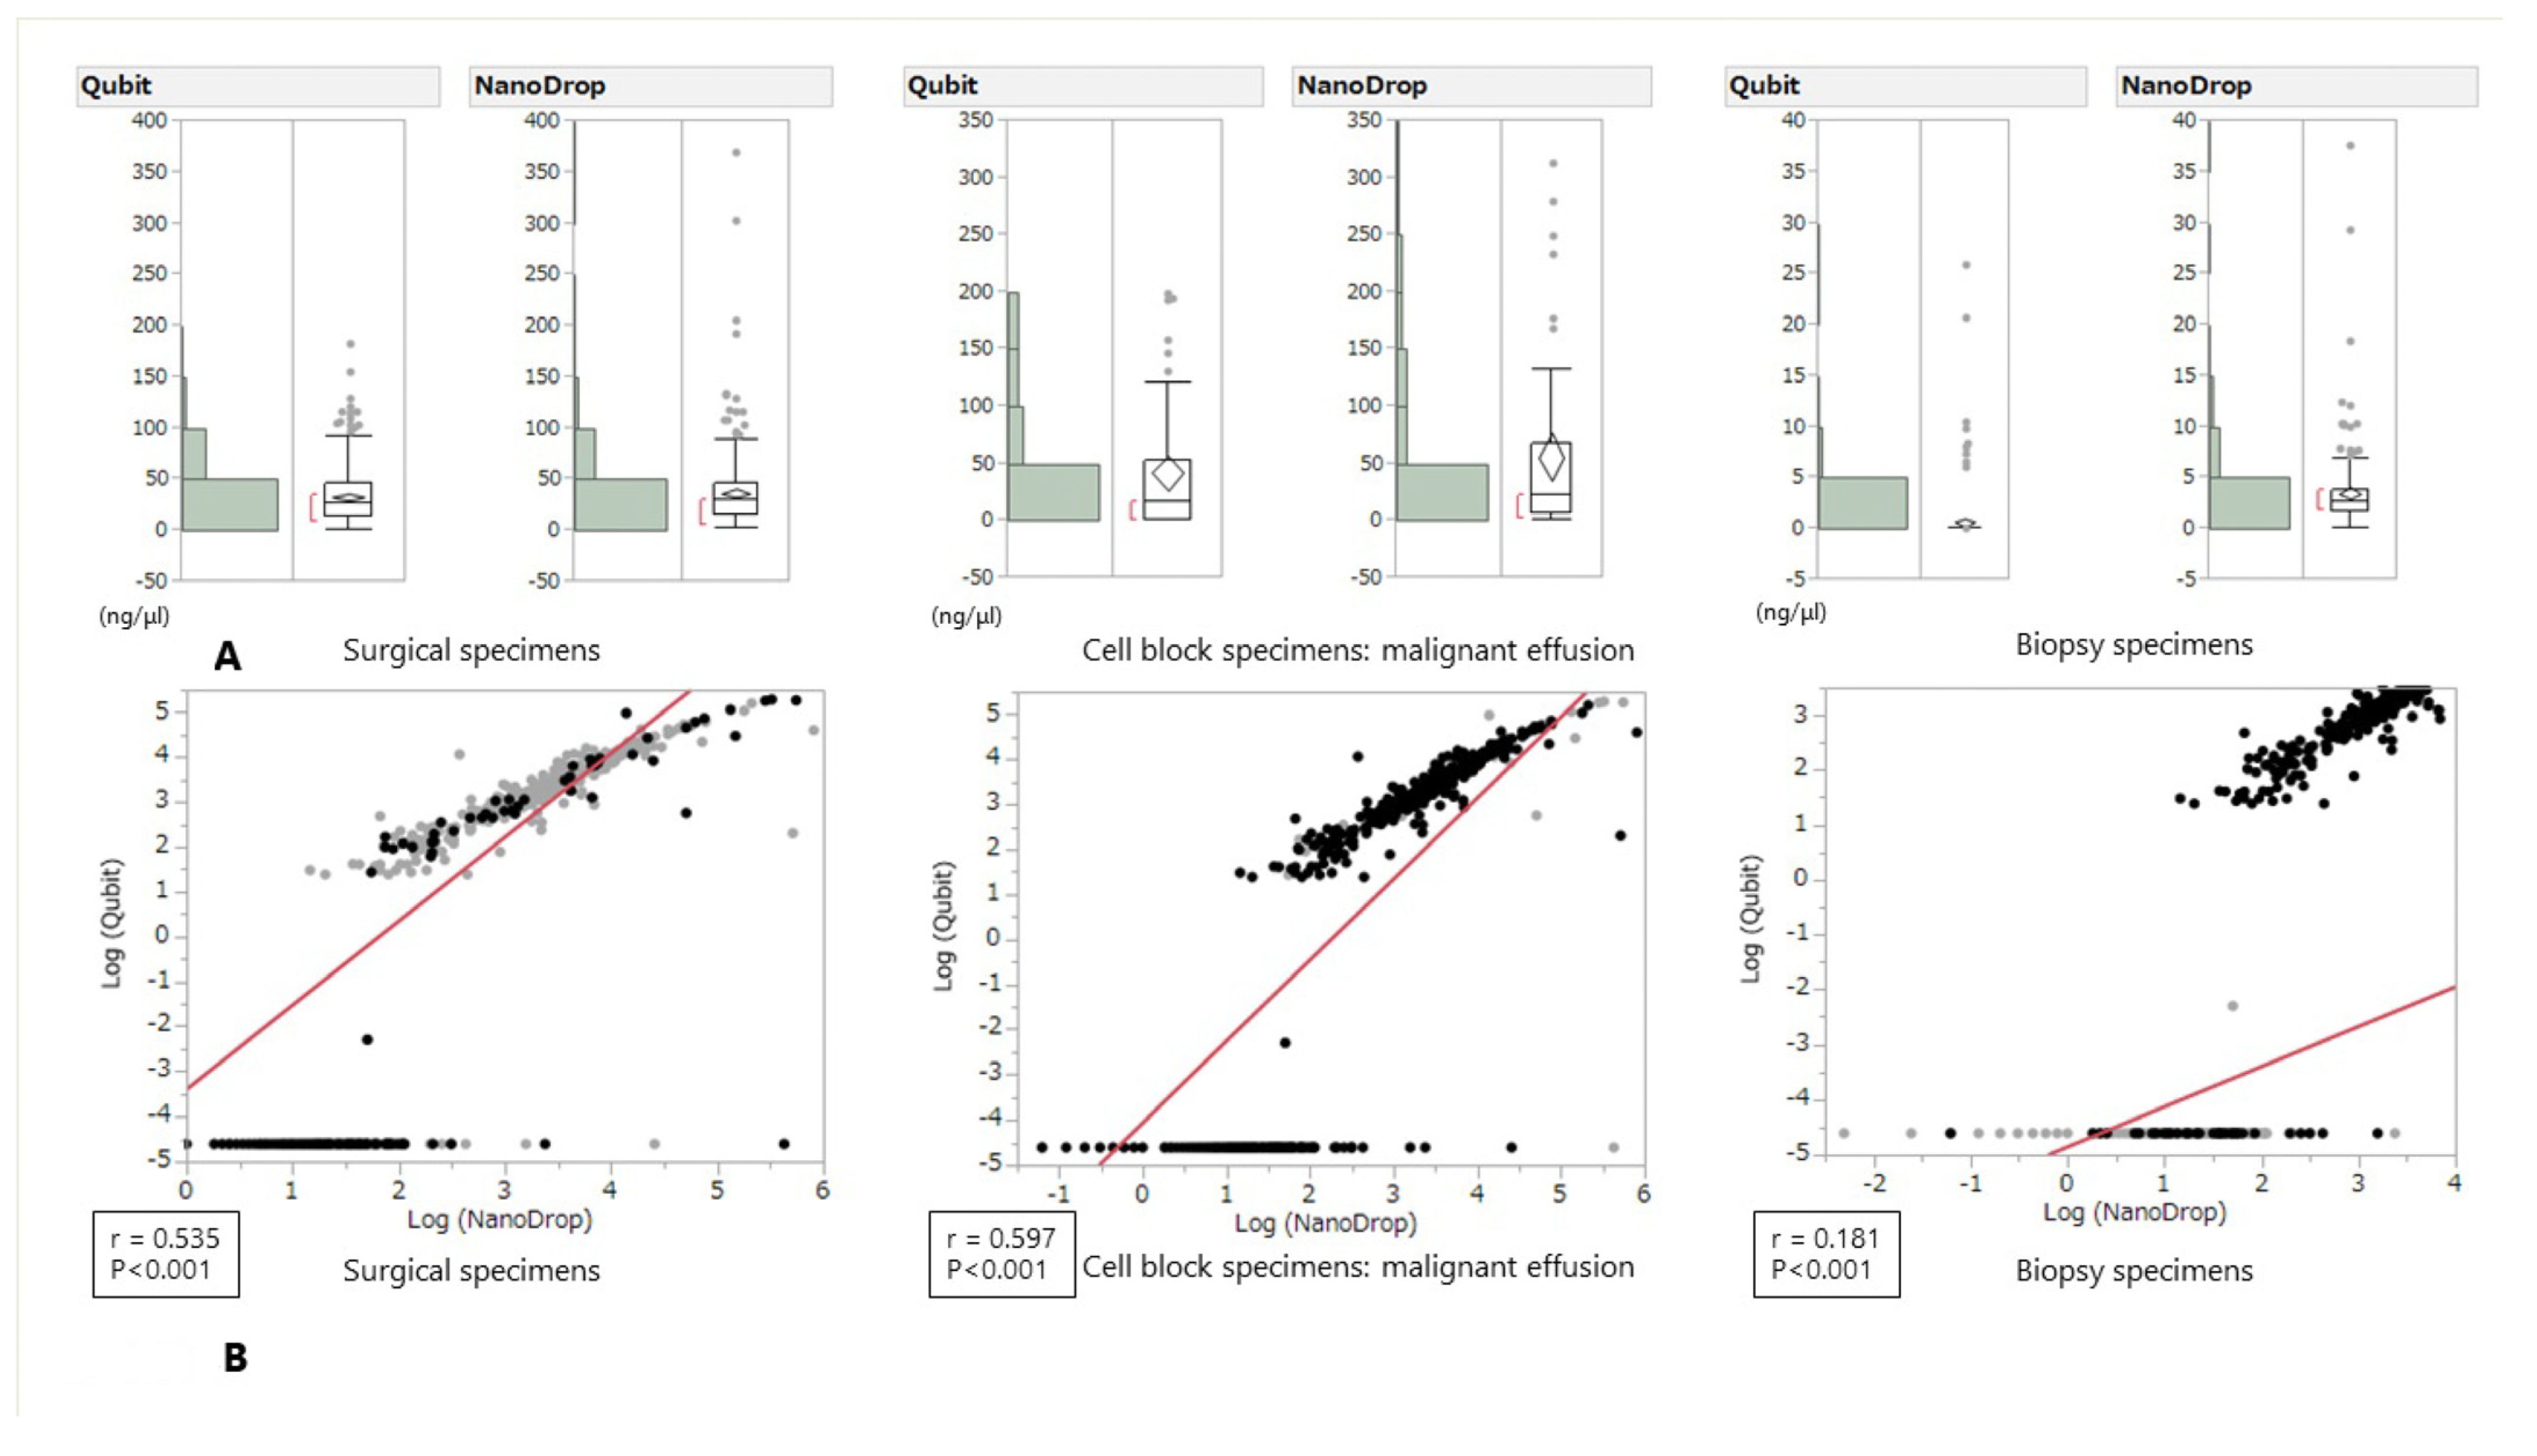
3.3. Quantification of Frozen RNA by NanoDrop and Qubit

The comparison of RNA concentrations quantified by NanoDrop and Qubit is shown in Figure 3A. Although the absolute value of RNA concentration had a tendency to be slightly higher when measured with NanoDrop regardless of the type of specimen, several opposite cases were also observed. In the regression analysis, a positive correlation was also found in the following order: cell block specimens, surgical specimens, and biopsy specimens; however, the correlation coefficient tended to be slightly weaker than that for DNA (Figure 3).

3.4. Results of Routine Genomic Tests with Suboptimal DNA and RNA Specimens

The characteristics of the tissue used for genomic tests are shown in Table 1. The success rates of routine genomic tests using DNA or RNA with concentrations that are outliers when measured with Qubit are shown in Table 2. The success rates of the DNA-based genomic tests, including CycleaveTM PCR and fragment PCR, were as high as approximately 96%. At less than 60%, the success rate of the RNA-based genomic test, including RT-PCR, was not as satisfactory.

3.5. Results of Routine NGS Panel Sequencing with Suboptimal DNA and RNA Specimens

Panel sequencing was performed in cases where at least one routine genomic test was successful. The success rate of NGS panel sequencing using DNA or RNA with outlier concentrations calculated with Qubit is as follows: the success rates of the AmpliSeqTM DNA panel sequencing and RNA panel sequencing were 77.8% (14/18) and 91.5% (43/47), respectively. The minimal requirement for the amount of DNA and RNA for panel sequencing is 10 ng; however, the success rate of both NGS sequencing runs was higher than expected.

4. Discussion

In this study, we showed that DNA concentration had a tendency to be higher when measured with NanoDropTM regardless of the type of specimen; however, even though slightly higher RNA concentrations were measured with NanoDrop, regardless of the type of specimen, several opposite cases were also observed. Twenty-eight biopsy specimen and one pleural effusion sample showed opposite results. It may be due to the equipment characteristics that the lower the concentration measured by Nanodrop TM, the more the measured value varies, and that the Qubit TM has a measurement limit value. The success rate of routine DNA-based genomic tests, including NGS, with samples with suboptimal conditions that had outlier concentrations as calculated with Qubit was approximately 80%. The success rate of the RNA-based method was approximately 50%. The minimal requirement of the amount of DNA and RNA for panel sequencing is 10 ng; however, the success rate of both NGS sequencing runs was higher than expected. The correlations of the two methods in different samples were hugely different (Figure 2 and Figure 3). These differences may be due to the small amount of RNA or the amounts of contaminants in the DNA extraction method. However, tumors harboring driver mutations may also increase RNA expression of the driver gene, which may lead to more successful rate of genomic tests than expected.
There are few studies comparing DNA and RNA quantification methods from FFPE samples, and the results do vary [15]. Hadd et al. [18] used NanoDropTM for DNA quantification for targeted NGS. On the other hand, QubitTM is reported to be commonly used as the easiest, most reliable, and cost-effective quantification method for NGS [19]. Simbolo M et al. have proposed that the recommended workflow for quantifying DNA extracted from FFPE tumor tissues suitable for NGS is, first, to evaluate the quality of the sample with a NanoDropTM, and subsequently, to quantify the concentrations of the sample with QubitTM [15]. Heydt C. et al. showed that QubitTM and qPCR can be used for downstream applications and even the NanoDropTM can be used for subsequent sample analysis with massively parallel sequencing [16]. Some studies have reported that qPCR is the most reliable method and spectrophotometric analysis is the least reliable; however, it is time-consuming, expensive, and not practical for routine laboratory tests with a high sample throughput, which has also been stated by other studies [14,20].
The most striking difference between using QubitTM and NanoDropTM is the accuracy of the QubitTM assays which provide much more reliable information than NanoDropTM. The measurement error when quantifying samples of 10 ng/µL of DNA with QubitTM is within 1% and 5% when using NanoDropTM [20,21,22,23]. In terms of accuracy, qPCR is the ideal quantifying method of DNA used for NGS [24]. However, qPCR takes much more time and is more expensive than spectrophotometric analysis. In terms of sample loss, for NanoDropTM and QubitTM analysis, only small sample volumes of 1–2 µL are required, which means fewer samples are used for quantitation and more samples are available for genomic analysis including NGS.
Considering the success rate, the DNA-based AmpliSeqTM NGS is worth performing, because its success rate is high even when the DNA concentration is outside the measurement range. On the other hand, in the case of RNA, if even one PCR amplification product can be obtained, it is worth performing panel sequencing, regardless of the RNA concentrations. In the case of commercial-based NGS panel sequencing, the minimum requirements for tissue volume and tumor contents were 25 mm3 and 20% in FoundationOne CDxTM [25], respectively, and the required minimum values for the Oncomine™ Dx Target Test are shown in Table 3 [25]. In these situations, it seems very important to show the success rate of a panel-based NGS test (Table 4).
Limitations of this study include that the DNA and RNA quality such as the DIN and RIN value and A260/230 ratio were not measured. For example, paraffin-embedded tissues are likely to cause sequence breaks, and long fragment samples are not easy to detect. These points may be solved by measuring the DIN and RIN value.

5. Conclusions

In conclusion, DNA concentration had a tendency to be higher when measured with NanoDropTM; however, this was not the case for RNA. Although DNA-based AmpliSeqTM NGS when the DNA is outside the measurement rate does not come from the FFPE tissue which is the main problem in most diagnostic labs, the success rate of NGS with low sample concentration measured with both methods was relatively higher than expected, and it is worth performing PCR-based panel sequencing, especially when rebiopsy is difficult to perform. This result may be due to the high expression of the mutation-derived gene used in tumor cells, suggesting the usefulness of using RNA for NGS.

Author Contributions

Conceptualization: K.M. and S.F.; Methodology: K.M. and E.S.; Software: K.M. and H.M.; Validation: H.K. and E.S.; Formal analysis: K.M. and Y.O.; Investigation: K.M.; Resources: K.M., Y.T. and H.K.; Data Curation: H.M. and S.F.; Writing—Original Draft: K.M.; Writing—Review & Editing: S.F., Y.O., Y.T. and E.S.; Visualization Supervision: H.M.; Project administration: H.K. All authors have read and agreed to the published version of the manuscript.

Funding

We have no funding in this study.

Institutional Review Board Statement

This study was conducted according to the guidelines of the Declaration of Helsinki, and approved by the Institutional Review Board of Aichi Cancer Center Hospital (No.2020-2-34).

Informed Consent Statement

We obtained the consent form for publication from the patients.

Data Availability Statement

Data are available upon reasonable request to the Corresponding author.

Acknowledgments

The authors declare that they have no competing financial interests.

Conflicts of Interest

The authors declare no conflict of interest.

References

  1. Lindeman, N.I.; Cagle, P.T.; Aisner, D.L.; Arcila, M.E.; Beasley, M.B.; Bernicker, E.H.; Colasacco, C.; Dacic, S.; Hirsch, F.R.; Kerr, K.; et al. Updated Molecular Testing Guideline for the Selection of Lung Cancer Patients for Treatment With Targeted Tyrosine Kinase Inhibitors: Guideline From the College of American Pathologists, the International Association for the Study of Lung Cancer, and the Association for Molecular Pathology. J. Mol. Diagn. JMD 2018, 20, 129–159. [Google Scholar]
  2. National Comprehensive Cancer Network. NCCN Clinical Practice Guidelines in Oncology. Non-Small Cell Lung Cancer. 2018. Available online: https://www.nccn.org/professionals/physician_gls/pdf/nscl.pdf (accessed on 11 February 2020).
  3. Novello, S.; Barlesi, F.; Califano, R.; Cufer, T.; Ekman, S.; Levra, M.G.; Kerr, K.; Popat, S.; Reck, M.; Senan, S.; et al. Metastatic non-small-cell lung cancer: ESMO Clinical Practice Guidelines for diagnosis, treatment and follow-up. Ann. Oncol. Off. J. Eur. Soc. Med Oncol. 2016, 27, v1–v27. [Google Scholar] [CrossRef]
  4. Hanna, N.; Johnson, D.; Temin, S.; Baker, S., Jr.; Brahmer, J.; Ellis, P.M.; Giaccone, G.; Hesketh, P.J.; Jaiyesimi, I.; Leighl, N.B.; et al. Systemic Therapy for Stage IV Non-Small-Cell Lung Cancer: American Society of Clinical Oncology Clinical Practice Guideline Update. J. Clin. Oncol. Off. J. Am. Soc. Clin. Oncol. 2017, 35, 3484–3515. [Google Scholar] [CrossRef] [PubMed]
  5. Kalemkerian, G.P.; Narula, N.; Kennedy, E.B. Molecular Testing Guideline for the Selection of Lung Cancer Patients for Treatment with Targeted Tyrosine Kinase Inhibitors: American Society of Clinical Oncology Endorsement Summary of the College of American Pathologists/International Association for the Study of Lung Cancer/Association for Molecular Pathology Clinical Practice Guideline Update. J. Oncol. Pract. 2018, 14, 323–327. [Google Scholar]
  6. Betsou, F.; Bilbao, R.; Case, J.; Chuaqui, R.; Clements, J.A.; De Souza, Y.; De Wilde, A.; Geiger, J.; Grizzle, W.; Guadaguni, F. Standard PREanalytical Code Version 3.0. Biopreservation Biobanking 2018, 16, 1. [Google Scholar] [CrossRef] [PubMed]
  7. Glasel, J.A. Validity of nucleic acid purities monitored by 260 nm/280 nm absorbance ratios. BioTechniques 1995, 18, 62–63. [Google Scholar]
  8. Huberman, J.A. Importance of measuring nucleic acid absorbance at 240 nm as well as at 260 and 280 nm. BioTechniques 1995, 18, 636. [Google Scholar] [PubMed]
  9. Manchester, K.L. Value of A260/A280 ratios for measurement of purity of nucleic acids. BioTechniques 1995, 19, 208–210. [Google Scholar] [PubMed]
  10. Singer, V.L.; Jones, L.J.; Yue, S.T.; Haugland, R.P. Characterization of PicoGreen reagent and development of a fluorescence-based solution assay for double-stranded DNA quantitation. Anal. Biochem. 1997, 249, 228–238. [Google Scholar] [CrossRef] [Green Version]
  11. Jones, L.J.; Yue, S.T.; Cheung, C.Y.; Singer, V.L. RNA quantitation by fluorescence-based solution assay: RiboGreen reagent characterization. Anal. Biochem. 1998, 265, 368–374. [Google Scholar] [CrossRef] [PubMed]
  12. Le Pecq, J.B.; Paoletti, C. A new fluorometric method for RNA and DNA determination. Anal. Biochem. 1966, 17, 100–107. [Google Scholar] [CrossRef]
  13. Kapuscinski, J. DAPI: A DNA-specific fluorescent probe. Biotech. Histochem. Off. Publ. Biol. Stain Comm. 1995, 70, 220–233. [Google Scholar] [CrossRef]
  14. Sedlackova, T.; Repiska, G.; Celec, P.; Szemes, T.; Minarik, G. Fragmentation of DNA affects the accuracy of the DNA quantitation by the commonly used methods. Biol. Proced. Online 2013, 15, 5. [Google Scholar] [CrossRef] [PubMed] [Green Version]
  15. Simbolo, M.; Gottardi, M.; Corbo, V.; Fassan, M.; Mafficini, A.; Malpeli, G.; Lawlor, R.T.; Scarpa, A. DNA qualification workflow for next generation sequencing of histopathological samples. PLoS ONE 2013, 8, e62692. [Google Scholar] [CrossRef] [PubMed] [Green Version]
  16. Heydt, C.; Fassunke, J.; Künstlinger, H.; Ihle, M.A.; König, K.; Heukamp, L.C.; Schildhaus, H.U.; Odenthal, M.; Büttner, R.; Merkelbach-Bruse, S. Comparison of pre-analytical FFPE sample preparation methods and their impact on massively parallel sequencing in routine diagnostics. PLoS ONE 2014, 9, e104566. [Google Scholar] [CrossRef] [PubMed]
  17. Tanaka, K.; Hida, T.; Oya, Y.; Yoshida, T.; Shimizu, J.; Mizuno, T.; Kuroda, H.; Sakakura, N.; Yoshimura, K.; Horio, Y.; et al. Unique prevalence of oncogenic genetic alterations in young patients with lung adenocarcinoma. Cancer 2017, 123, 1731–1740. [Google Scholar] [CrossRef] [PubMed] [Green Version]
  18. Hadd, A.G.; Houghton, J.; Choudhary, A.; Sah, S.; Chen, L.; Marko, A.C.; Sanford, T.; Buddavarapu, K.; Krosting, J.; Garmire, L.; et al. Targeted, high-depth, next-generation sequencing of cancer genes in formalin-fixed, paraffin-embedded and fine-needle aspiration tumor specimens. J. Mol. Diagn. JMD 2013, 15, 234–247. [Google Scholar] [CrossRef]
  19. Tuononen, K.; Mäki-Nevala, S.; Sarhadi, V.K.; Wirtanen, A.; Rönty, M.; Salmenkivi, K.; Andrews, J.M.; Telaranta-Keerie, A.I.; Hannula, S.; Lagström, S.; et al. Comparison of targeted next-generation sequencing (NGS) and real-time PCR in the detection of EGFR, KRAS, and BRAF mutations on formalin-fixed, paraffin-embedded tumor material of non-small cell lung carcinoma-superiority of NGS. Genes Chromosomes Cancer 2013, 52, 503–511. [Google Scholar] [CrossRef] [PubMed]
  20. Sah, S.; Chen, L.; Houghton, J.; Kemppainen, J.; Marko, A.C.; Zeigler, R.; Latham, G.J. Functional DNA quantification guides accurate next-generation sequencing mutation detection in formalin-fixed, paraffin-embedded tumor biopsies. Genome Med. 2013, 5, 77. [Google Scholar] [CrossRef] [Green Version]
  21. NTECHNICAL NOTE. Comparison of Fluorescence-Based Quantitation with UV Absorbance Measurements. Available online: https://tools.thermofisher.com/content/sfs/brochures/fluorescence-UV-quantitation-comparison-tech-note.pdf2016 (accessed on 11 February 2020).
  22. Bonin, S.; Hlubek, F.; Benhattar, J.; Denkert, C.; Dietel, M.; Fernandez, P.L.; Höfler, G.; Kothmaier, H.; Kruslin, B.; Mazzanti, C.M.; et al. Multicentre validation study of nucleic acids extraction from FFPE tissues. Virchows Arch. Int. J. Pathol. 2010, 457, 309–317. [Google Scholar] [CrossRef] [Green Version]
  23. Turashvili, G.; Yang, W.; McKinney, S.; Kalloger, S.; Gale, N.; Ng, Y.; Chow, K.; Bell, L.; Lorette, J.; Carrier, M.; et al. Nucleic acid quantity and quality from paraffin blocks: Defining optimal fixation, processing and DNA/RNA extraction techniques. Exp. Mol. Pathol. 2012, 92, 33–43. [Google Scholar] [CrossRef] [PubMed]
  24. Klein, D. Quantification using real-time PCR technology: Applications and limitations. Trends Mol. Med. 2002, 8, 257–260. [Google Scholar] [CrossRef]
  25. Oncomine™ Dx Target Test Part I: Sample Preparation and Quantification USER GUIDE. Available online: https://www.accessdata.fda.gov/cdrh_docs/pdf16/p160045c.pdf (accessed on 21 June 2017).
Figure 1. DNA (A) and RNA (B) quality measured by A260/A280 and grouped according to tissue type.
Medicina 57 01375 g001
Figure 2. DNA concentration measured by Qubit and NanoDrop and grouped according to tissue type (A): Surgical specimens, Cell block specimens, Biopsy specimens and Scatter plot for the correlation analysis between Qubit and NanoDrop measurements (B). The R coefficients were 0.587 for the surgical specimens, 0.819 for the cell block specimens, and 0.199 for the biopsy specimens.
Medicina 57 01375 g002
Figure 3. RNA concentration measured by Qubit and NanoDrop and grouped according to tissue type (A): Surgical specimens, cell block specimens, Biopsy specimens) and Scatter plot for the correlation analysis between Qubit and NanoDrop measurements (B). The R coefficients were 0.535 for the surgical specimens, 0.597 for the cell block specimens, and 0.1 for the biopsy specimens.
Medicina 57 01375 g003
Table 1. Characteristics of the tissues used for genomic tests.
Tissue TypeDNA (%)RNA (%)
Surgery specimen249 (64.3)336 (60.2)
Cell block specimen31 (8.1)51 (9.2)
Biopsy specimen107 (27.6)171 (30.6)
Total387 (100)558 (100)
Table 2. Success rate of routine genomic tests using DNA or RNA with concentrations that are outliers when calculated with Qubit.
DNA Based Genomic TestsSuccess Rate (%)
CycleaveTM EGFR L858R26/27 (96.3)
Fragment EGFR exon 19 deletions26/27 (96.3)
CycleaveTM EGFR exon 20 insertions25/27 (92.6)
CycleaveTM KRAS G12X26/27 (96.3)
Fragment HER2 exon 20 insertions26/27 (96.3)
RNA based genomic tests
MET exon 14 RT-PCR86/153 (56.2)
EGFR RT-PCR54/150 (36.0)
KRAS RT-PCR91/150 (60.7)
TP53 RT-PCR60/144 (41.7)
ALK fusion RT-PCR59/150 (39.3)
BRAF RT-PCR78/148 (52.7)
Table 3. Required sample concentrations and *R2 values.
Sample TypeRequired ConcentrationRequired *R2 Values
DNA≥0.83 ng/µL≥0.99
RNA≥1.43 ng/µL≥0.98
*R2 values should be evaluated only if the standard curve includes 3 or more points.
Table 4. Success rate of NGS panel sequence using DNA or RNA with concentrations that are outliers when calculated with Qubit.
MethodsSuccess Rate (%)
AmpliSeqTM DNA panel sequence14/18 (77.8)
AmpliSeqTM RNA panel sequence43/47 (91.5)
Publisher’s Note: MDPI stays neutral with regard to jurisdictional claims in published maps and institutional affiliations.

