
Right Ventricular Functionality Following Hemodialysis Initiation in End-Stage Kidney Disease—A Single-Center, Prospective, Cohort Study


Abstract
:1. Introduction
2. Materials and Methods
2.1. Study Population
2.2. Study Design
2.3. Transthoracic Echocardiography
2.4. Two-Dimensional Speckle Tracking Echocardiography
2.5. Statistical Analysis
3. Results
3.1. Baseline Characteristics
3.2. Echocardiographic Variables and Their Prospective Dynamics
- -
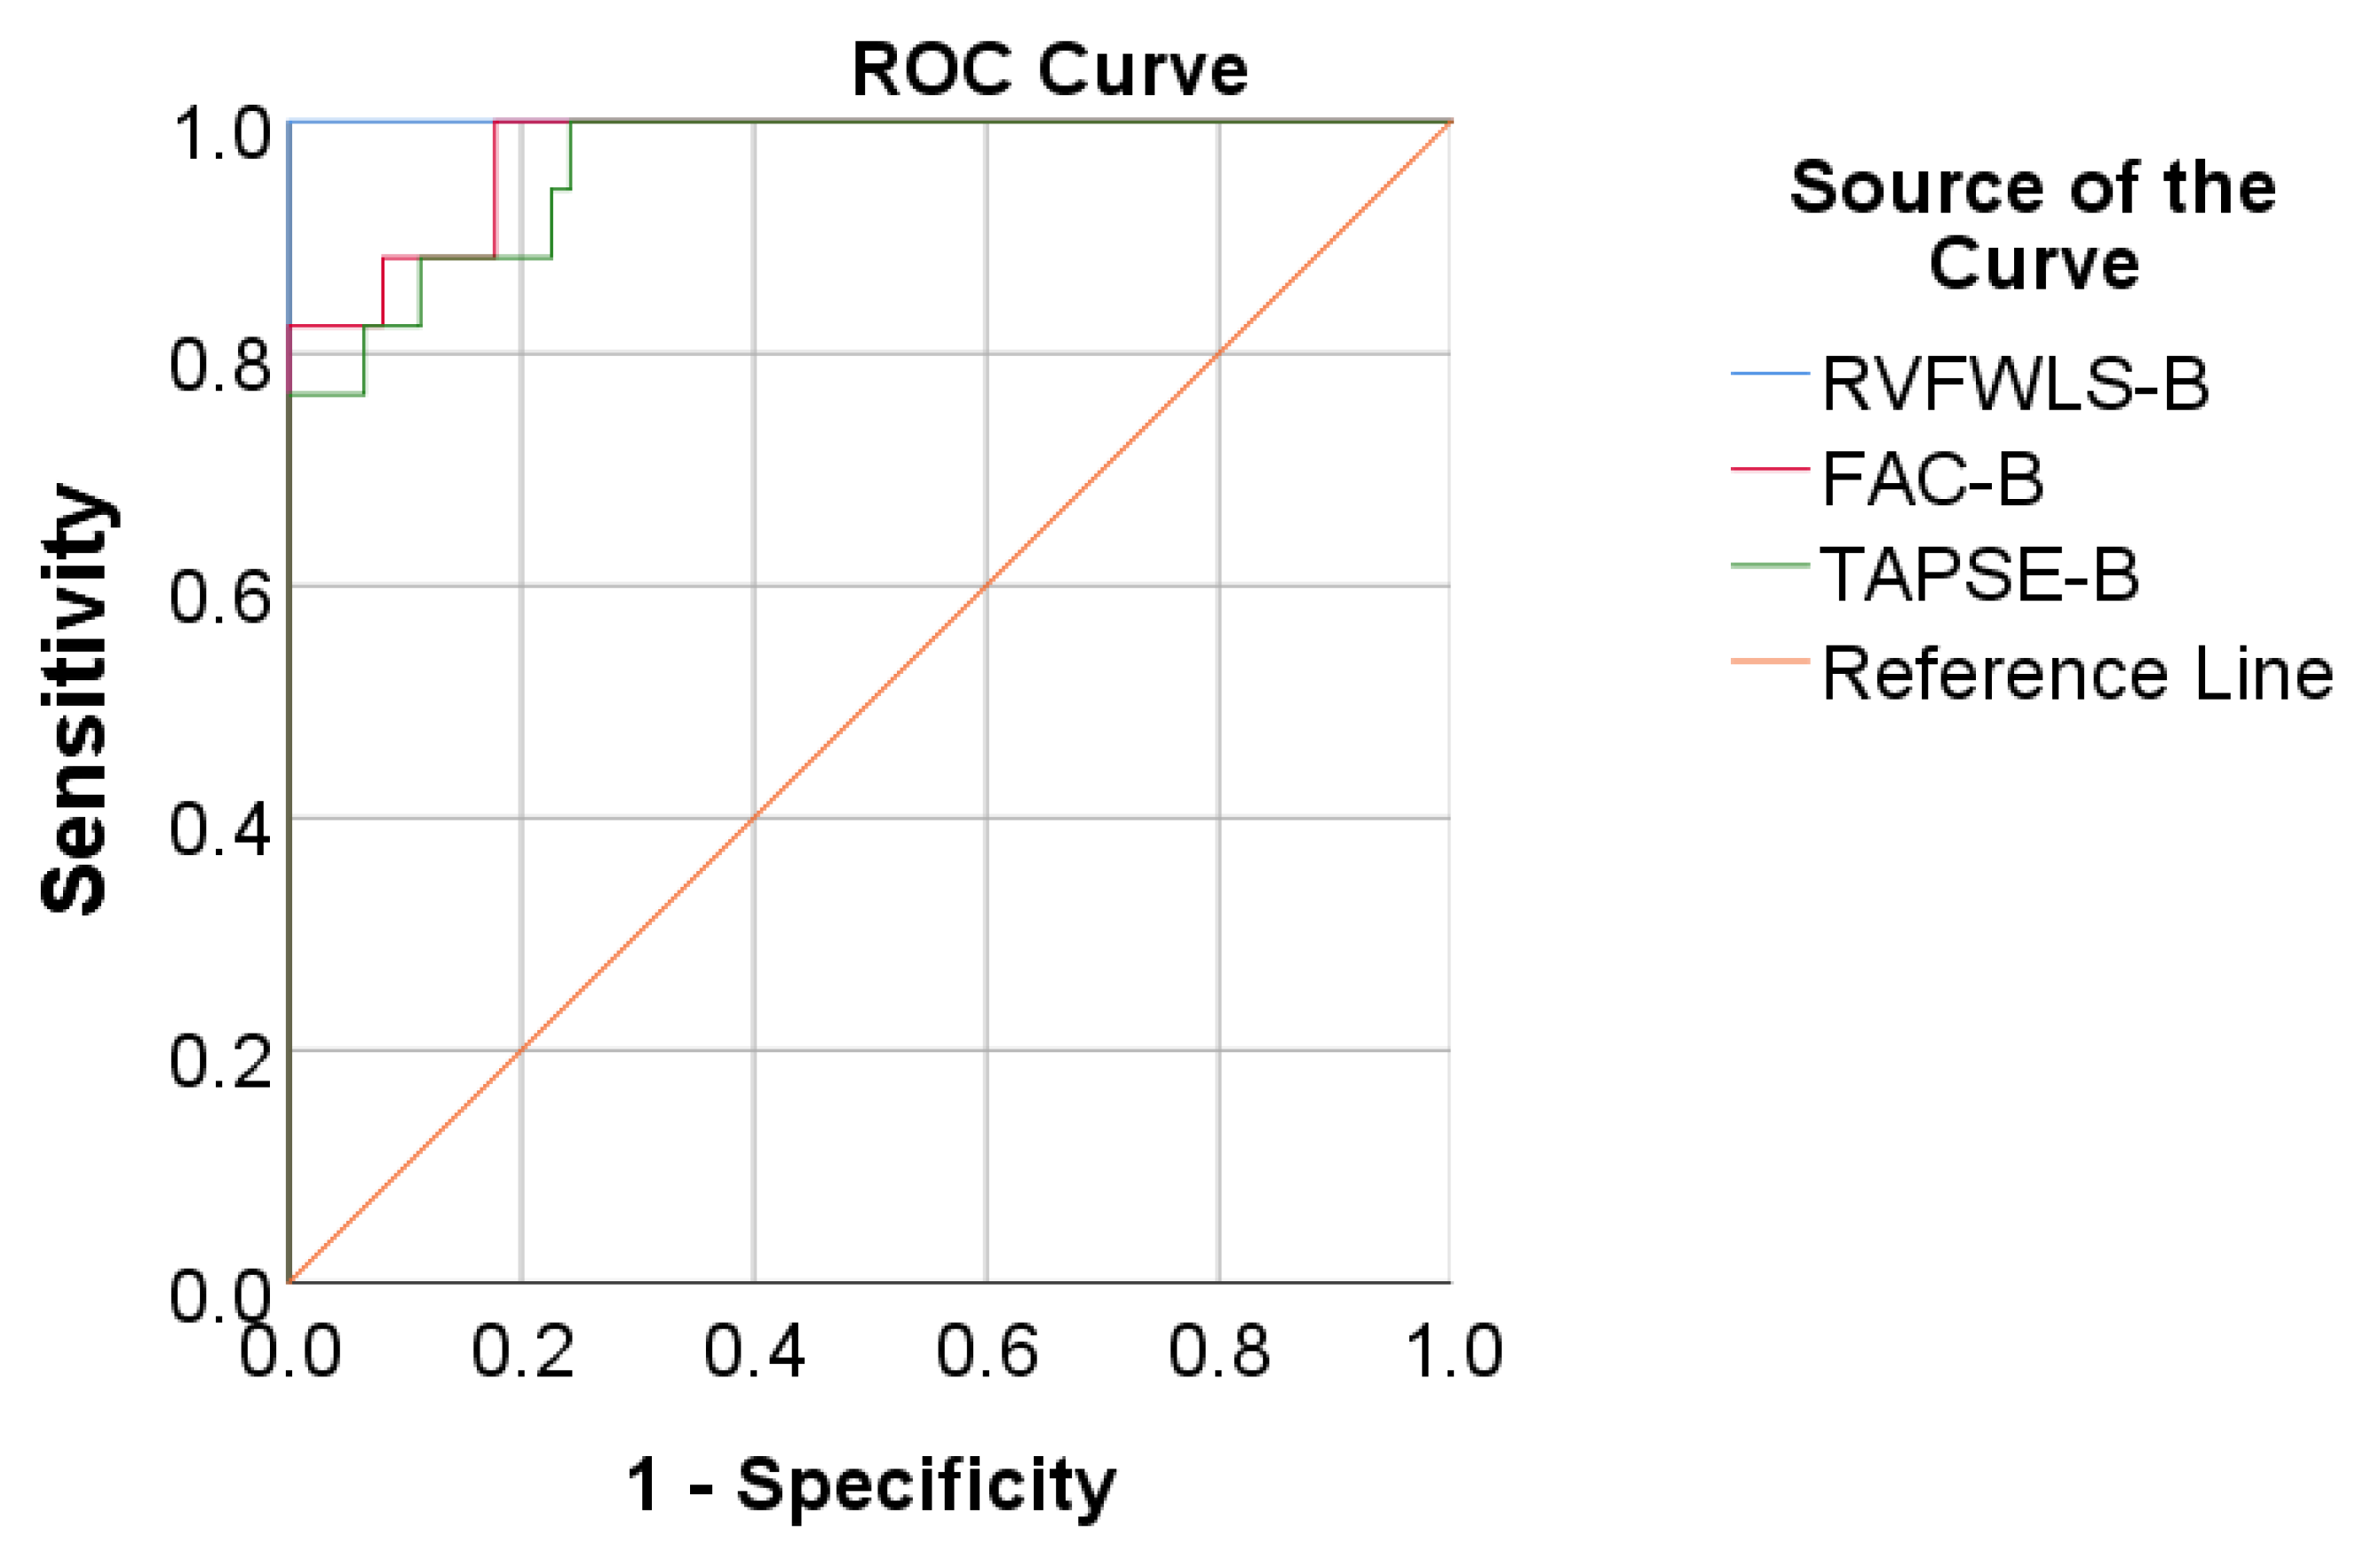
- A baseline value lower than 18.5 for RVFWLS has a sensitivity of 94.1% and specificity of 100% for mortality prediction;
- -
- a baseline value lower than 25.62 for FAC has a sensitivity of 88.2% and specificity of 90.1% for mortality prediction;
- -
- a baseline value lower than 18 for TAPSE has a sensitivity of 88.2% and specificity of 85.5% for mortality prediction.
4. Discussion
5. Conclusions
Author Contributions
Funding
Institutional Review Board Statement
Informed Consent Statement
Data Availability Statement
Conflicts of Interest
References
- Ehrich, J.H.; Rizzoni, G.; Brunner, F.P.; Brynger, H.; Geerlings, W.; Fassbinder, W.; Raine, A.E.; Selwood, N.H.; Tufveson, G. Combined report on regular dialysis and transplantation of children in Europe, 1989. Nephrol. Dial. Transplant. Off. Publ. Eur. Dial. Transpl. Assoc. Eur. Ren. Assoc. 1991, 6 (Suppl. 1), 37–47. [Google Scholar]
- Tonelli, M.; Karumanchi, S.A.; Thadhani, R. Epidemiology and Mechanisms of Uremia-Related Cardiovascular Disease. Circulation 2016, 133, 518–536. [Google Scholar] [CrossRef] [PubMed]
- McIntyre, C.W.; Rosansky, S.J. Starting dialysis is dangerous: How do we balance the risk? Kidney Int. 2012, 82, 382–387. [Google Scholar] [CrossRef] [PubMed] [Green Version]
- Edwards, N.C.; Hirth, A.; Ferro, C.J.; Townend, J.N.; Steeds, R.P. Subclinical abnormalities of left ventricular myocardial deformation in early-stage chronic kidney disease: The precursor of uremic cardiomyopathy? J. Am. Soc. Echocardiogr. Off. Publ. Am. Soc. Echocardiogr. 2008, 21, 1293–1298. [Google Scholar] [CrossRef] [PubMed] [Green Version]
- Chiu, D.Y.; Green, D.; Abidin, N.; Sinha, S.; Kalra, P.A. Cardiac imaging in patients with chronic kidney disease. Nat. Rev. Nephrol. 2015, 11, 207–220. [Google Scholar] [CrossRef] [PubMed]
- Liu, Y.W.; Su, C.T.; Song, E.J.; Tsai, W.C.; Li, Y.H.; Tsai, L.M.; Chen, J.H.; Sung, J.M. The role of echocardiographic study in patients with chronic kidney disease. J. Formos. Med. Assoc. Taiwan Yi Zhi 2015, 114, 797–805. [Google Scholar] [CrossRef] [Green Version]
- Unger, E.D.; Dubin, R.F.; Deo, R.; Daruwalla, V.; Friedman, J.L.; Medina, C.; Beussink, L.; Freed, B.H.; Shah, S.J. Association of chronic kidney disease with abnormal cardiac mechanics and adverse outcomes in patients with heart failure and preserved ejection fraction. Eur. J. Heart Fail. 2016, 18, 103–112. [Google Scholar] [CrossRef] [Green Version]
- Rudski, L.G.; Lai, W.W.; Afilalo, J.; Hua, L.; Handschumacher, M.D.; Chandrasekaran, K.; Solomon, S.D.; Louie, E.K.; Schiller, N.B. Guidelines for the echocardiographic assessment of the right heart in adults: A report from the American Society of Echocardiography endorsed by the European Association of Echocardiography, a registered branch of the European Society of Cardiology, and the Canadian Society of Echocardiography. J. Am. Soc. Echocardiogr. 2010, 23, 685–713, quiz 786-688. [Google Scholar] [CrossRef]
- Lang, R.M.; Badano, L.P.; Mor-Avi, V.; Afilalo, J.; Armstrong, A.; Ernande, L.; Flachskampf, F.A.; Foster, E.; Goldstein, S.A.; Kuznetsova, T.; et al. Recommendations for cardiac chamber quantification by echocardiography in adults: An update from the American Society of Echocardiography and the European Association of Cardiovascular Imaging. J. Am. Soc. Echocardiogr. Off. Publ. Am. Soc. Echocardiogr. 2015, 28, 1–39.e14. [Google Scholar] [CrossRef] [Green Version]
- Morris, D.A.; Krisper, M.; Nakatani, S.; Köhncke, C.; Otsuji, Y.; Belyavskiy, E.; Radha Krishnan, A.K.; Kropf, M.; Osmanoglou, E.; Boldt, L.H.; et al. Normal range and usefulness of right ventricular systolic strain to detect subtle right ventricular systolic abnormalities in patients with heart failure: A multicentre study. Eur. Heart J. Cardiovasc. Imaging 2017, 18, 212–223. [Google Scholar] [CrossRef] [Green Version]
- Eckardt, K.-U.; Gillespie, I.A.; Kronenberg, F.; Richards, S.; Stenvinkel, P.; Anker, S.D.; Wheeler, D.C.; de Francisco, A.L.; Marcelli, D.; Froissart, M.; et al. High cardiovascular event rates occur within the first weeks of starting hemodialysis. Kidney Int. 2015, 88, 1117–1125. [Google Scholar] [CrossRef] [Green Version]
- Robinson, B.M.; Zhang, J.; Morgenstern, H.; Bradbury, B.D.; Ng, L.J.; McCullough, K.P.; Gillespie, B.W.; Hakim, R.; Rayner, H.; Fort, J.; et al. Worldwide, mortality risk is high soon after initiation of hemodialysis. Kidney Int. 2014, 85, 158–165. [Google Scholar] [CrossRef] [PubMed] [Green Version]
- Paneni, F.; Gregori, M.; Ciavarella, G.M.; Sciarretta, S.; Palano, F.; Pignatelli, G.; Castello, L.; Domenici, A.; Punzo, G.; Tocci, G.; et al. Relation between right and left ventricular function in patients undergoing chronic dialysis. J. Cardiovasc. Med. (Hagerstown Md.) 2013, 14, 289–295. [Google Scholar] [CrossRef]
- Bansal, N.; Keane, M.; Delafontaine, P.; Dries, D.; Foster, E.; Gadegbeku, C.A.; Go, A.S.; Hamm, L.L.; Kusek, J.W.; Ojo, A.O.; et al. A longitudinal study of left ventricular function and structure from CKD to ESRD: The CRIC study. Clin. J. Am. Soc. Nephrol. CJASN 2013, 8, 355–362. [Google Scholar] [CrossRef] [Green Version]
- Cai, Q.-Z.; Lu, X.-Z.; Lu, Y.; Wang, A.Y.-M. Longitudinal changes of cardiac structure and function in CKD (CASCADE study). J. Am. Soc. Nephrol. JASN 2014, 25, 1599–1608. [Google Scholar] [CrossRef] [Green Version]
- Whalley, G.A.; Marwick, T.H.; Doughty, R.N.; Cooper, B.A.; Johnson, D.W.; Pilmore, A.; Harris, D.C.; Pollock, C.A.; Collins, J.F. Effect of early initiation of dialysis on cardiac structure and function: Results from the echo substudy of the IDEAL trial. Am. J. Kidney Dis. Off. J. Natl. Kidney Found. 2013, 61, 262–270. [Google Scholar] [CrossRef] [PubMed]
- Ganda, A.; Weiner, S.D.; Chudasama, N.L.; Valeri, A.M.; Jadoon, A.; Shimbo, D.; Radhakrishnan, J. Echocardiographic changes following hemodialysis initiation in patients with advanced chronic kidney disease and symptomatic heart failure with reduced ejection fraction. Clin. Nephrol. 2012, 77, 366–375. [Google Scholar] [CrossRef] [PubMed]
- Eckardt, K.U.; Bansal, N.; Coresh, J.; Evans, M.; Grams, M.E.; Herzog, C.A.; James, M.T.; Heerspink, H.J.L.; Pollock, C.A.; Stevens, P.E.; et al. Improving the prognosis of patients with severely decreased glomerular filtration rate (CKD G4+): Conclusions from a Kidney Disease: Improving Global Outcomes (KDIGO) Controversies Conference. Kidney Int. 2018, 93, 1281–1292. [Google Scholar] [CrossRef] [PubMed] [Green Version]
- Pelà, G.; Regolisti, G.; Coghi, P.; Cabassi, A.; Basile, A.; Cavatorta, A.; Manca, C.; Borghetti, A. Effects of the reduction of preload on left and right ventricular myocardial velocities analyzed by Doppler tissue echocardiography in healthy subjects. Eur. J. Echocardiogr. J. Work. Group Echocardiogr. Eur. Soc. Cardiol. 2004, 5, 262–271. [Google Scholar] [CrossRef] [PubMed]
- Kjaergaard, J.; Snyder, E.M.; Hassager, C.; Oh, J.K.; Johnson, B.D. Impact of preload and afterload on global and regional right ventricular function and pressure: A quantitative echocardiography study. J. Am. Soc. Echocardiogr. Off. Publ. Am. Soc. Echocardiogr. 2006, 19, 515–521. [Google Scholar] [CrossRef] [PubMed]
- Akyüz, A.; Yıldız, A.; Akıl, M.A.; Bilik, M.Z.; İnci, Ü.; Kayan, F.; Yıldız, İ.; Yılmaz, Z.; Yıldırım, Y.; Ülgen, M.S. Assessment of right ventricular systolic function in patients with chronic renal failure before and after hemodialysis by means of various echocardiographic modalities. Turk Kardiyol. Dern. Ars. Turk Kardiyol. Dern. Yayin Organidir 2014, 42, 717–725. [Google Scholar] [CrossRef] [Green Version]
- Akkaya, M.; Erdoğan, E.; Sağ, S.; Arı, H.; Türker, Y.; Yılmaz, M. The effect of hemodialysis on right ventricular functions in patients with end-stage renal failure. Anadolu Kardiyol. Derg. AKD Anatol. J. Cardiol. 2012, 12, 5–10. [Google Scholar] [CrossRef] [Green Version]
- Ünlü, S.; Şahinarslan, A.; Gökalp, G.; Seçkin, Ö.; Arınsoy, S.T.; Boyacı, N.B.; Çengel, A. The impact of volume overload on right heart function in end-stage renal disease patients on hemodialysis. Echocardiography 2018, 35, 314–321. [Google Scholar] [CrossRef]
- Georgianos, P.I.; Sarafidis, P.A.; Haidich, A.B.; Karpetas, A.; Stamatiadis, D.; Nikolaidis, P.; Lasaridis, A.N. Diverse effects of interdialytic intervals on central wave augmentation in haemodialysis patients. Nephrol. Dial. Transplant. Off. Publ. Eur. Dial. Transpl. Assoc. Eur. Ren. Assoc. 2013, 28, 2160–2169. [Google Scholar] [CrossRef] [PubMed] [Green Version]
- De Blasio, A.; Sirico, M.; Di Micco, L.; Di Iorio, B. Hemodialysis improves the subendocardial viability ratio. G. Ital. Di Nefrol. Organo Uff. Della Soc. Ital. Di Nefrol. 2013, 30. [Google Scholar] [PubMed]
- Loutradis, C.; Sarafidis, P.A.; Papadopoulos, C.E.; Papagianni, A.; Zoccali, C. The Ebb and Flow of Echocardiographic Cardiac Function Parameters in Relationship to Hemodialysis Treatment in Patients with ESRD. J. Am. Soc. Nephrol. JASN 2018, 29, 1372–1381. [Google Scholar] [CrossRef] [PubMed] [Green Version]
- Giusca, S.; Dambrauskaite, V.; Scheurwegs, C.; D’Hooge, J.; Claus, P.; Herbots, L.; Magro, M.; Rademakers, F.; Meyns, B.; Delcroix, M.; et al. Deformation imaging describes right ventricular function better than longitudinal displacement of the tricuspid ring. Heart (Br. Card. Soc. ) 2010, 96, 281–288. [Google Scholar] [CrossRef] [PubMed]
- Haeck, M.L.; Scherptong, R.W.; Marsan, N.A.; Holman, E.R.; Schalij, M.J.; Bax, J.J.; Vliegen, H.W.; Delgado, V. Prognostic value of right ventricular longitudinal peak systolic strain in patients with pulmonary hypertension. Circ. Cardiovasc. Imaging 2012, 5, 628–636. [Google Scholar] [CrossRef] [Green Version]
- Fine, N.M.; Chen, L.; Bastiansen, P.M.; Frantz, R.P.; Pellikka, P.A.; Oh, J.K.; Kane, G.C. Outcome prediction by quantitative right ventricular function assessment in 575 subjects evaluated for pulmonary hypertension. Circ. Cardiovasc. Imaging 2013, 6, 711–721. [Google Scholar] [CrossRef] [Green Version]


| Parameter (N = 79) | Value |
|---|---|
| Age (Average ± SD, Median (IQR), Min–Max) | 59.13 ± 15.41, 61 (52–71), 19–83 |
| Gender (Nr., %) | 35 (44.3%) F, 44 (55.7%) M |
| BMI (Average ± SD, Median (IQR), Min–Max) | 26.71 ± 5.37, 26.67 (21.96–30.1), 16.44–42.5 |
| Obesity (Nr., %) | 59 (74.7%) −, 20 (25.3%) + |
| Smoking (Nr., %) | 68 (86.1%) −, 11 (13.9%) + |
| HT (Nr., %) (Grades) | 3 (3.8%) −, 2 (2.5%) I, 2 (2.5%) II, 72 (91.1%) + |
| Heart failure—NYHA Classification (Nr., %) | 42 (53.2%) I, 34 (43%) II, 3 (3.8%) III |
| Diabetes mellitus (Nr., %) | 53 (67.1%) −, 26 (32.9%) + |
| History of MI (Nr., %) | 71 (89.9%) −, 8 (10.1%) + |
| CABG/PTCA (Nr., %) | 76 (96.2%) −, 3 (3.8%) + |
| Hb (Average ± SD, Median (IQR), Min–Max) (g/dL) | 9.75 ± 1.77, 9.7 (8.5–10.9), 5.7–14.6 |
| Anemia (Nr., %) | 50 (63.3%) −, 29 (36.7%) + |
| Uric acid (Average ± SD, Median (IQR), Min–Max) (mg/dL) (N = 70) | 7.46 ± 1.92, 7.25 (6.1–9.025), 3.9–12.3 |
| Hyperuricemia (Nr., %) (N = 70) | 42 (60%) −, 28 (40%) + |
| EF% (Average ± SD, Median (IQR), Min–Max) | 54.35 ± 9.74, 55(50–61), 23–70 |
| EF% <40% (Nr., %) | 74 (93.7%) −, 5 (6.3%) + |
| Mortality (Nr., %) | 17 (21.5%) |
| Parameter/Value (N = 62) | Baseline | 3 Months | 6 Months | 12 Months | p * | |
|---|---|---|---|---|---|---|
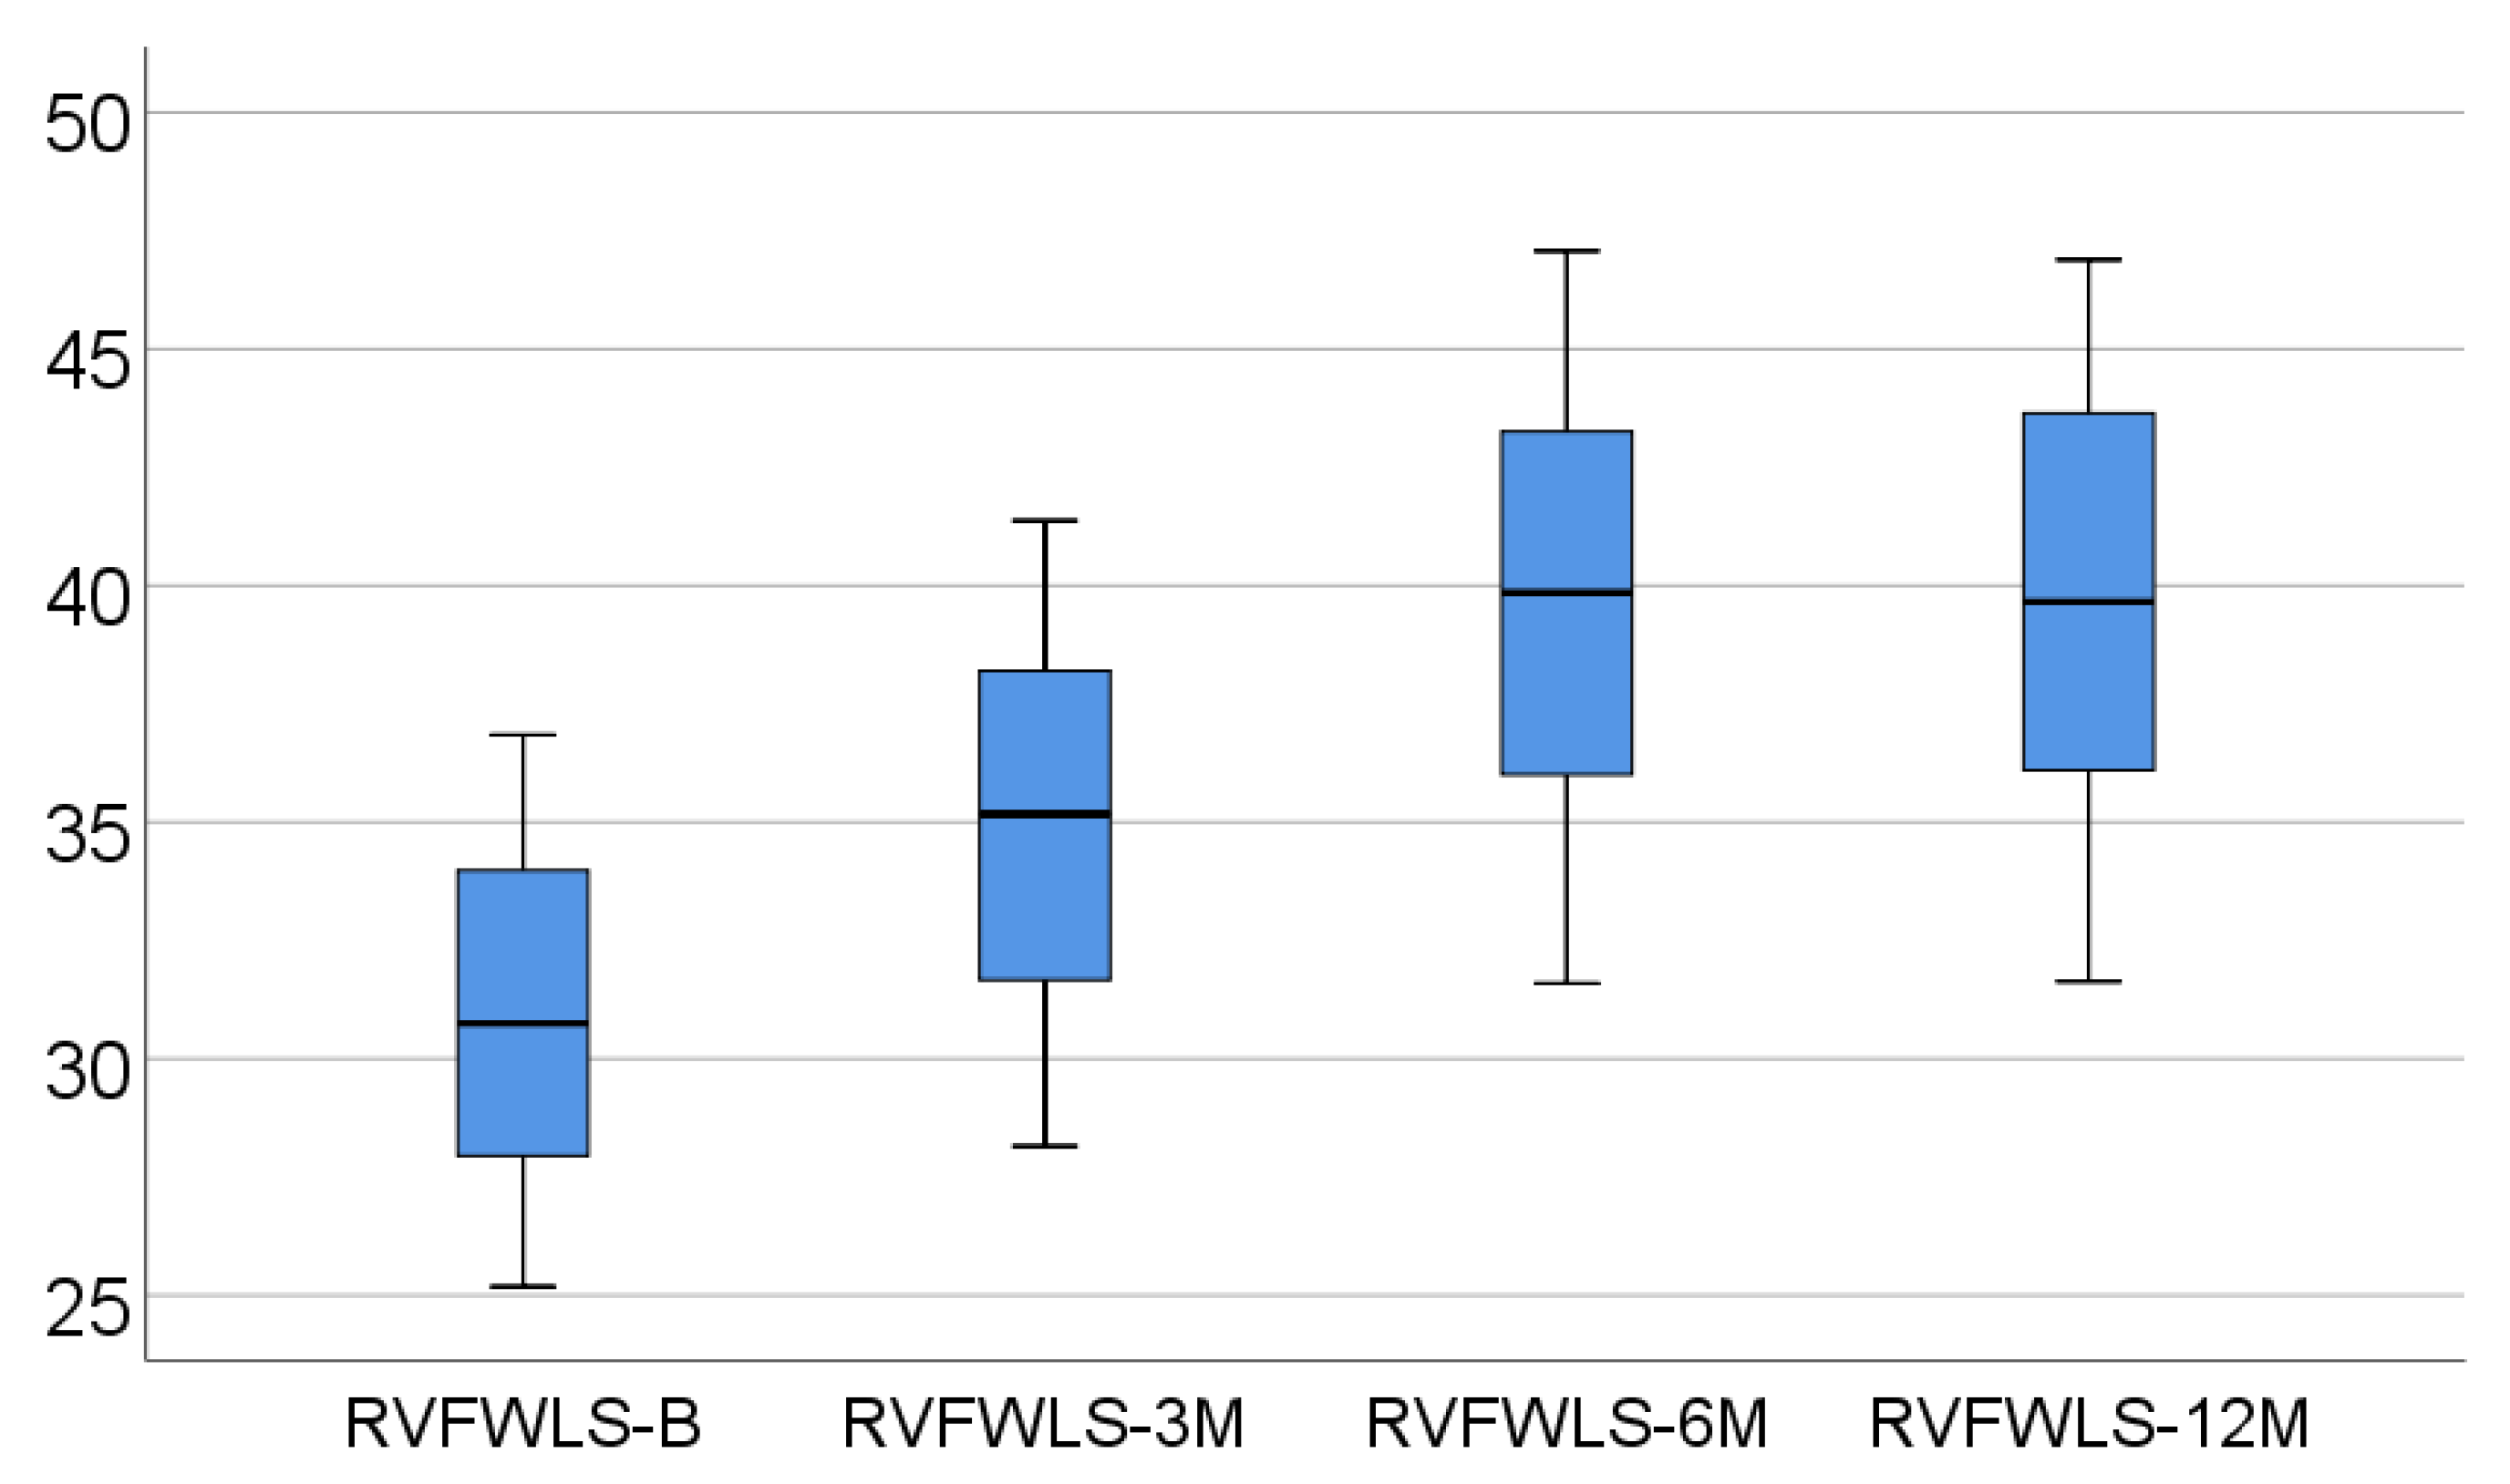
| RVFWLS | Average ± SD | 31.06 ± 3.5 | 35.17 ± 4.03 | 39.72 ± 4.53 | 39.72 ± 4.58 | <0.001 |
| Median (IQR) | 30.7 (27.9–34) | 35.1 (31.6–38.4) † | 39.8 (35.8–43.4) †,** | 39.6 (36–43.6) †,‡ | ||
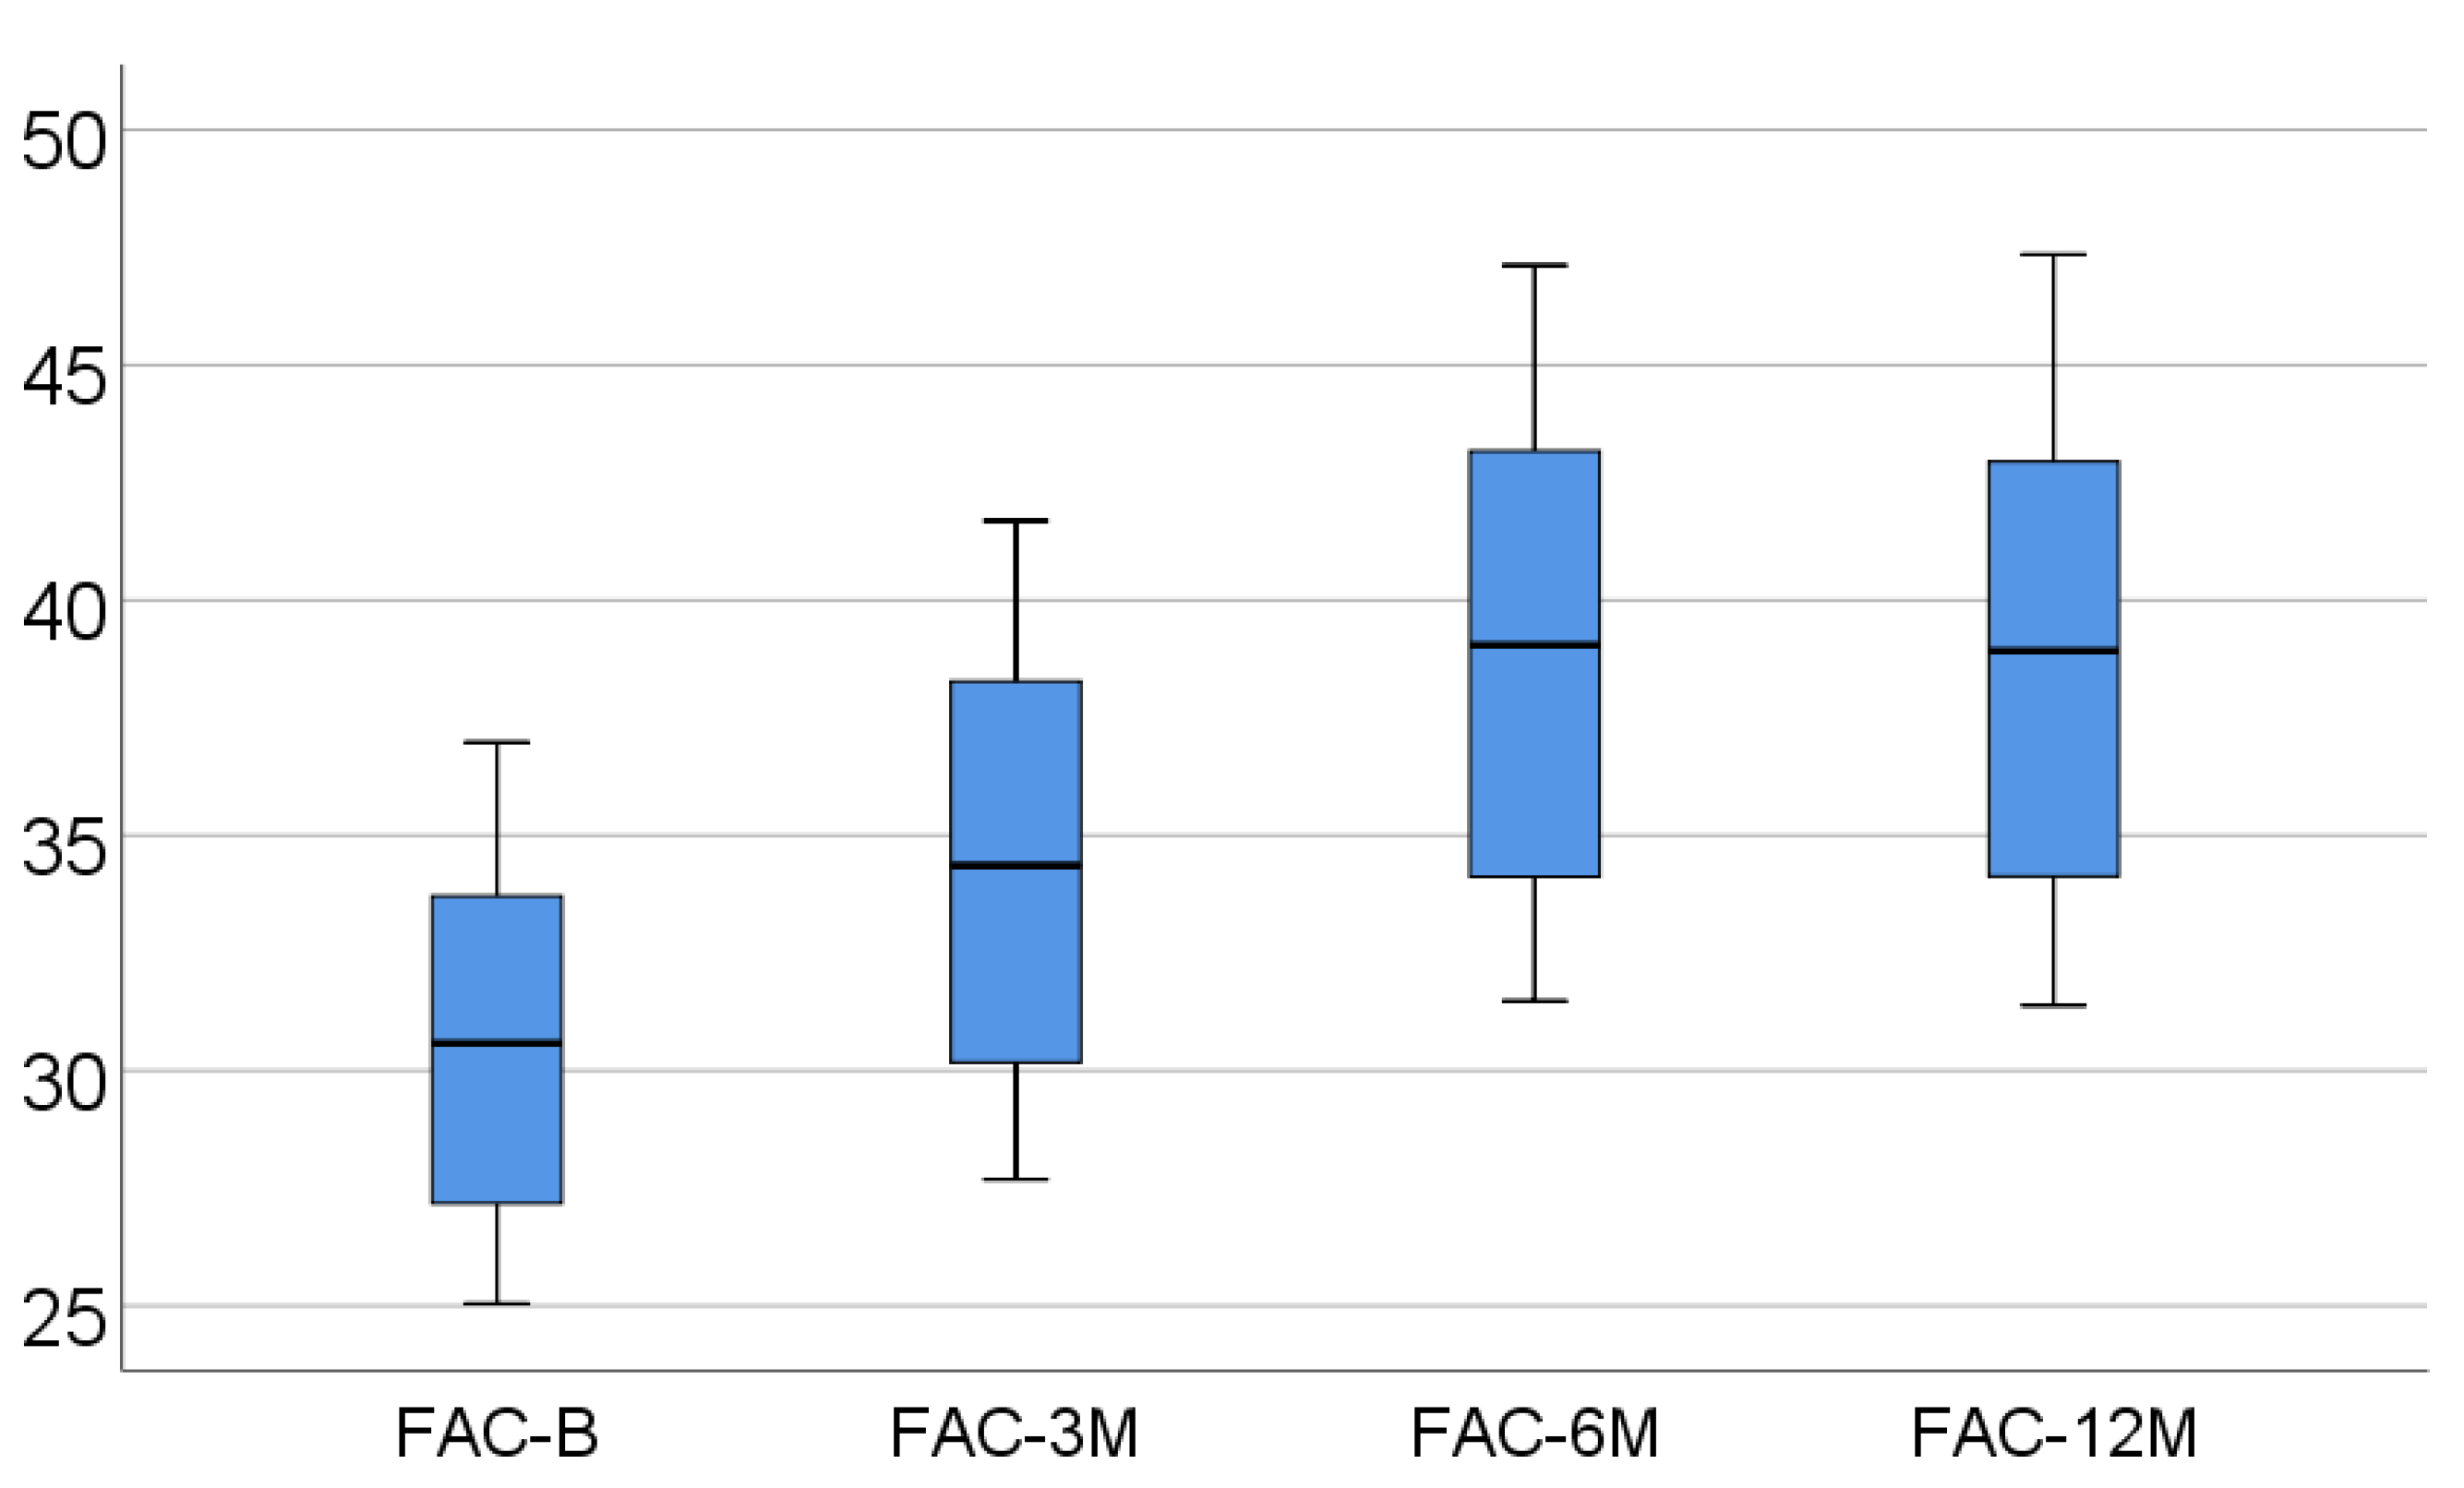
| FAC | Average ± SD | 30.7 ± 3.8 | 34.7 ± 4.38 | 39.2 ± 4.96 | 39.13 ± 4.96 | <0.001 |
| Median (IQR) | 30.5 (27.1–33.7) | 34.3 (30.1–38.4) † | 39 (34–43.4) †,** | 38.9 (34.1–43.1) †,‡ | ||
| TAPSE | Average ± SD | 20.8 ± 2.34 | 23.57 ± 2.71 | 26.63 ± 3 | 26.62 ± 3 | <0.001 |
| Median (IQR) | 20.5 (18.7–22.9) | 23.3 (21.1–26) † | 26.3 (23.9–29.5) †,** | 26.3 (23.9–29.3) †,‡ | ||
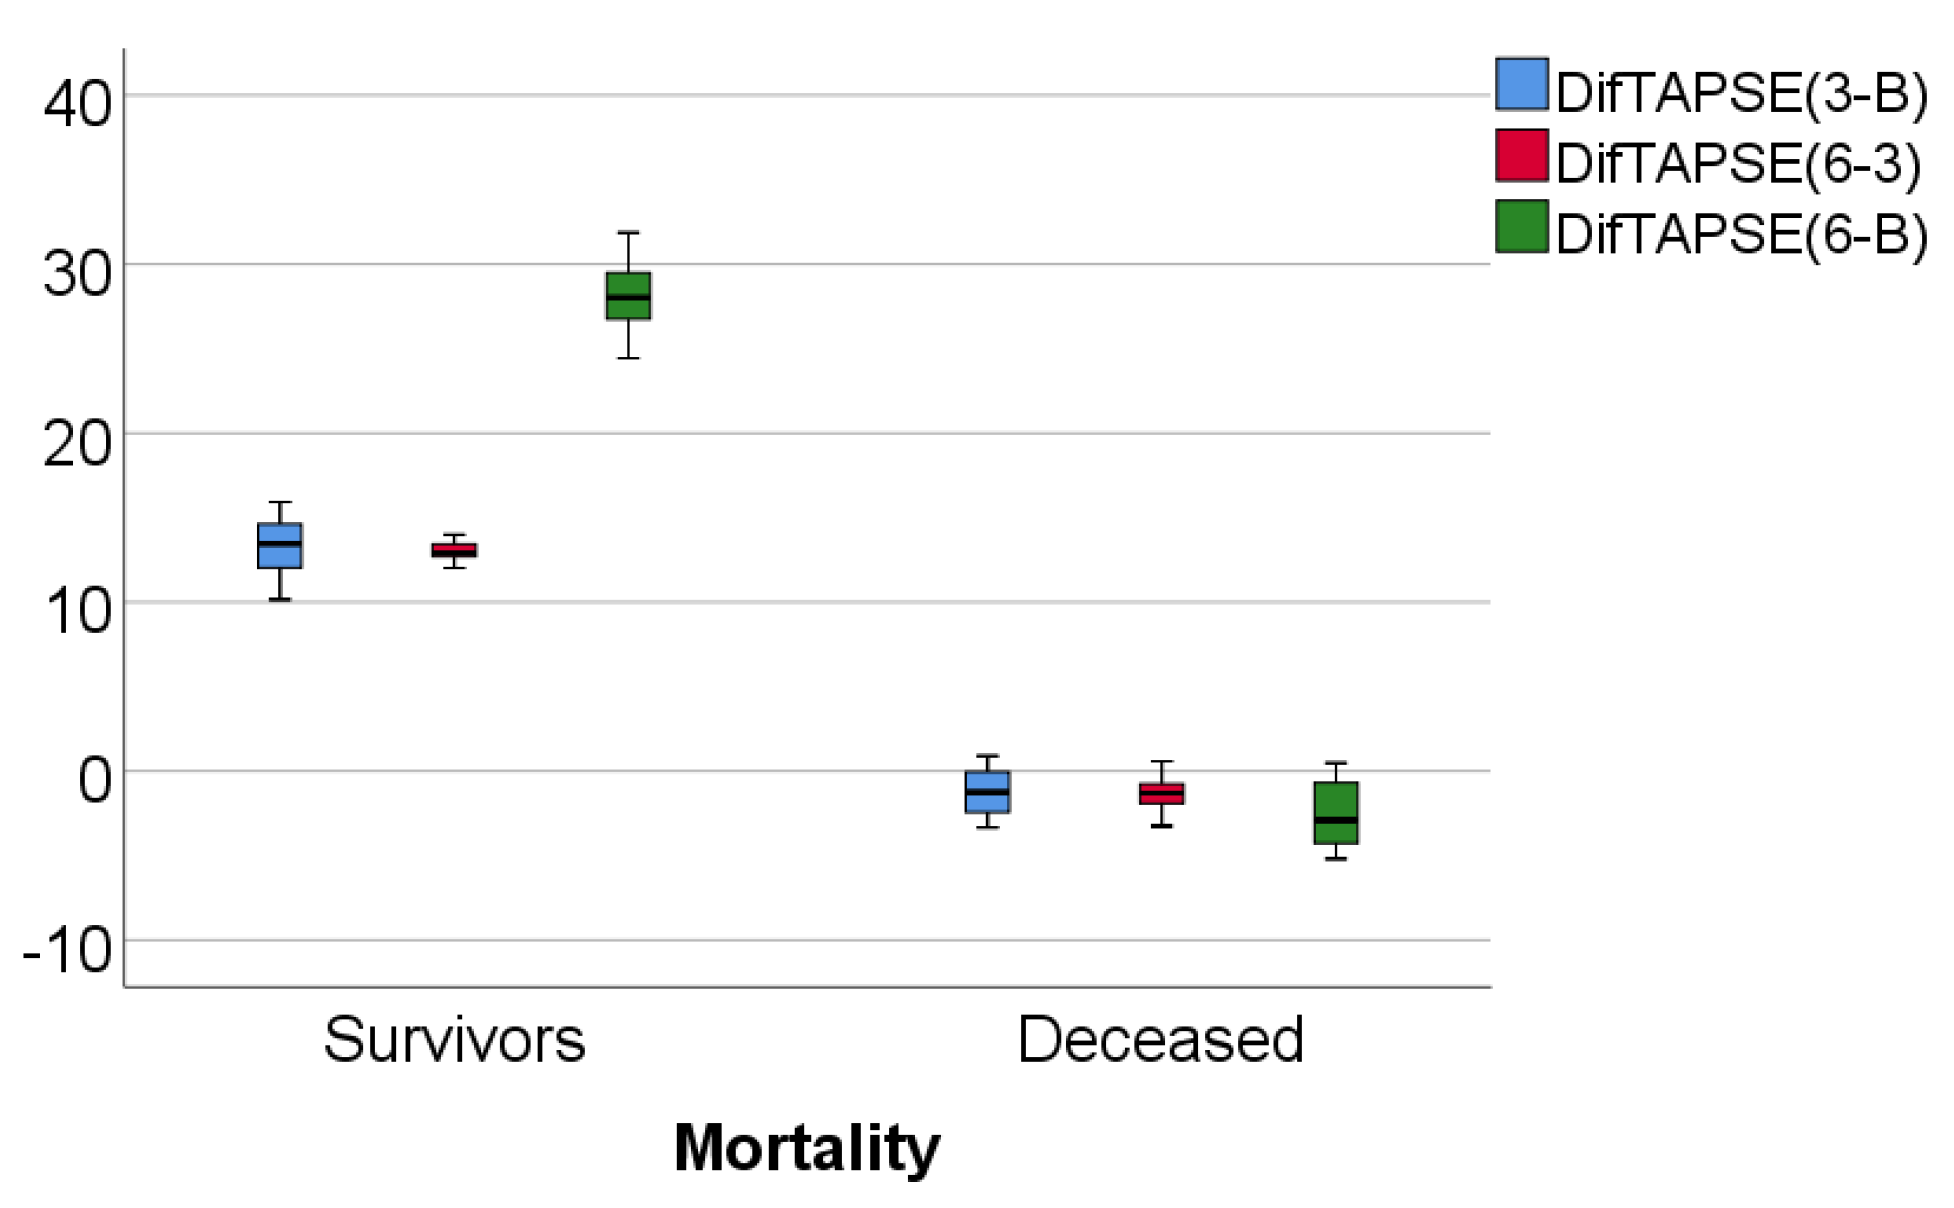
| Parameter/Value/Mortality (N = 71) | 3 Months–Baseline | 6 Months–3 Months | 6 Months–Baseline | ||
|---|---|---|---|---|---|
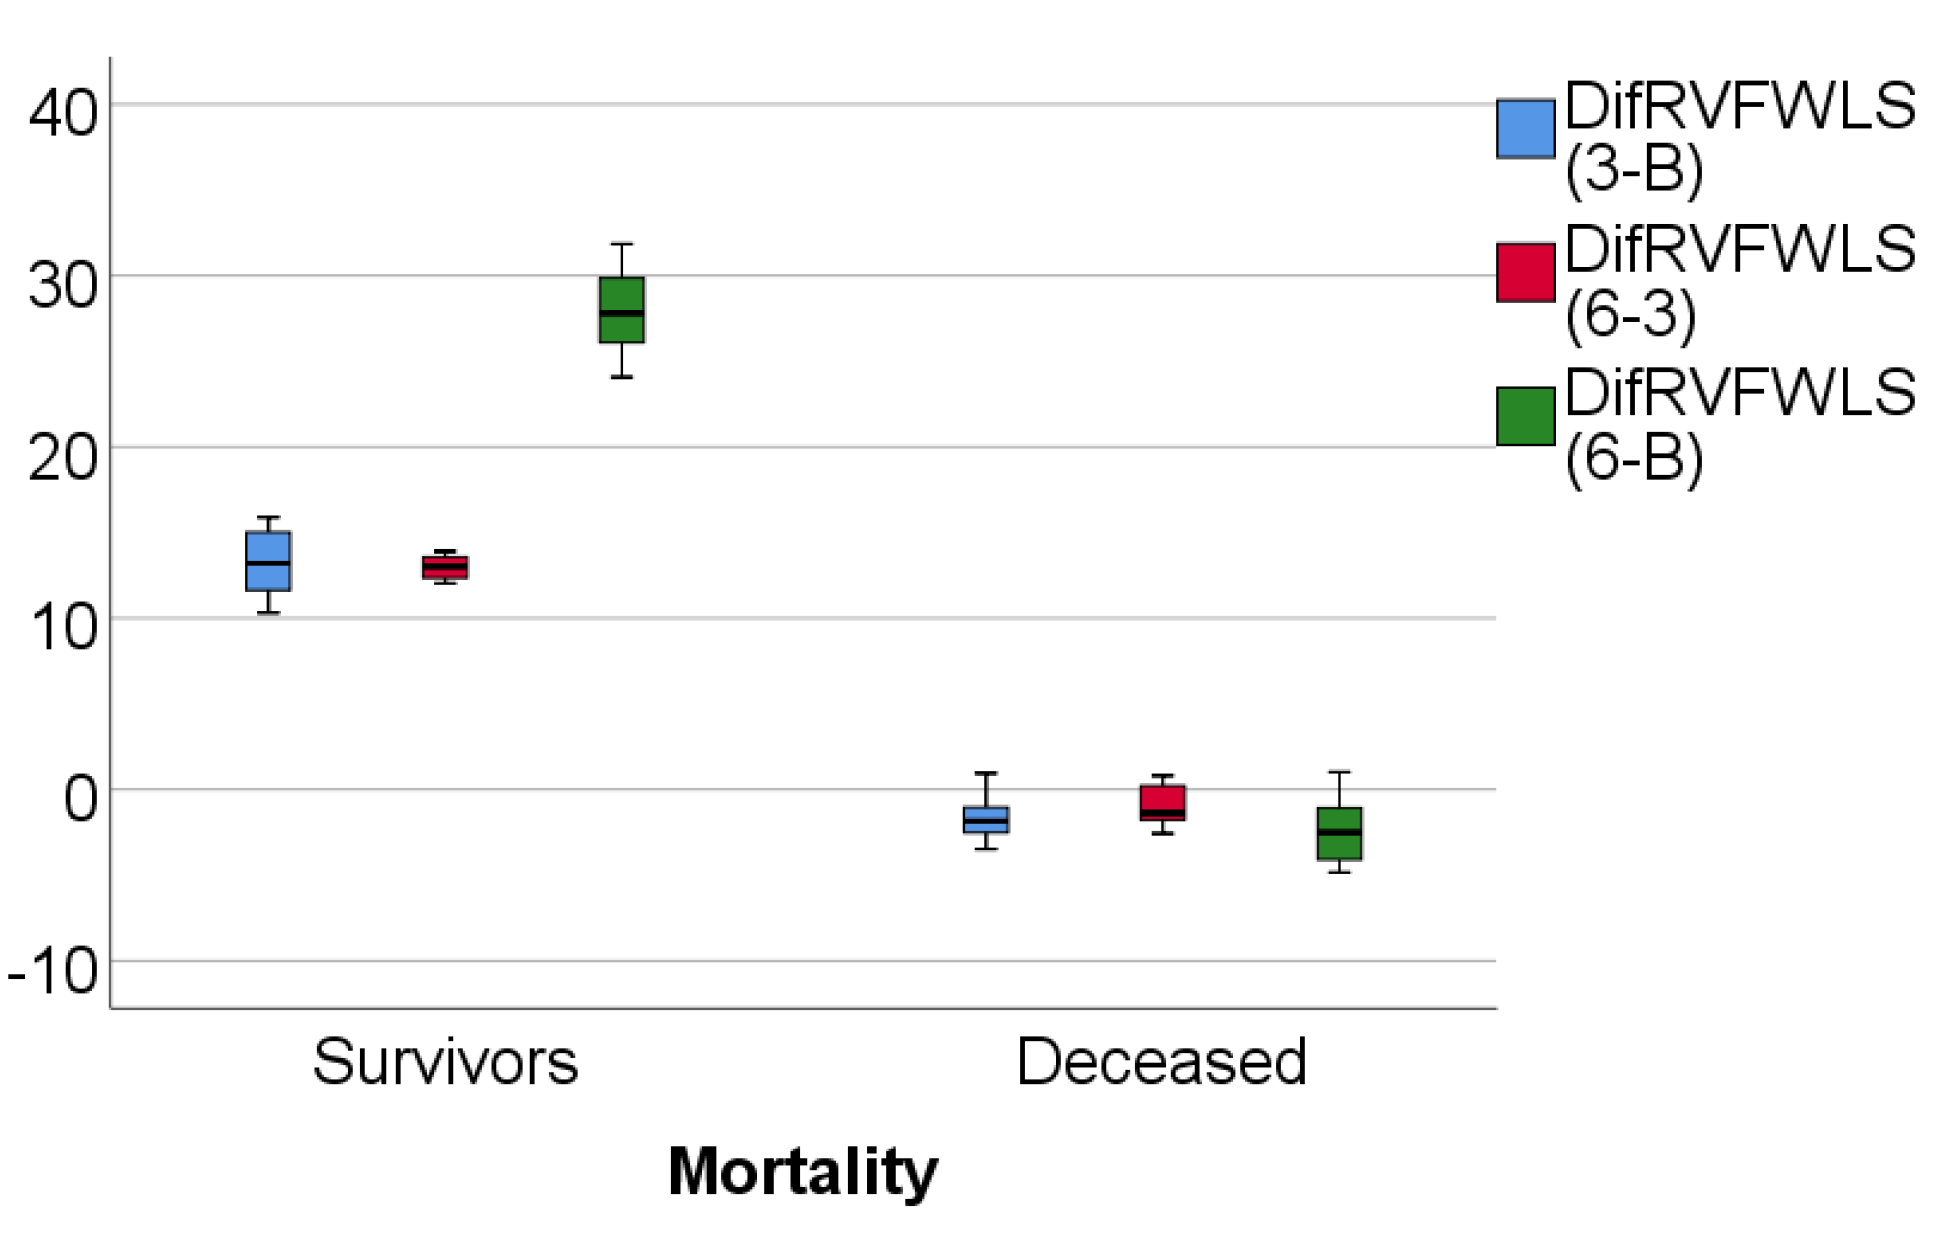
| RVFWLS (%) | Average ± SD | − | 13.21 ± 1.8 | 12.96 ± 0.61 | 27.89 ± 2.11 |
| Median (IQR) | − | 13.2 (11.6–15.01) | 13 (12.34–13.58) | 27.8 (26.08–29.84) | |
| Average ± SD | + | −1.53 ± 1.56 | −0.93 ± 1.24 | −2.45 ± 2.1 | |
| Median (IQR) | + | −1.84 (−2.82–−0.11) | −1.36 (−1.92–0.5) | −2.5 (−4.45–−0.65) | |
| p * | <0.001 | <0.001 | <0.001 | ||
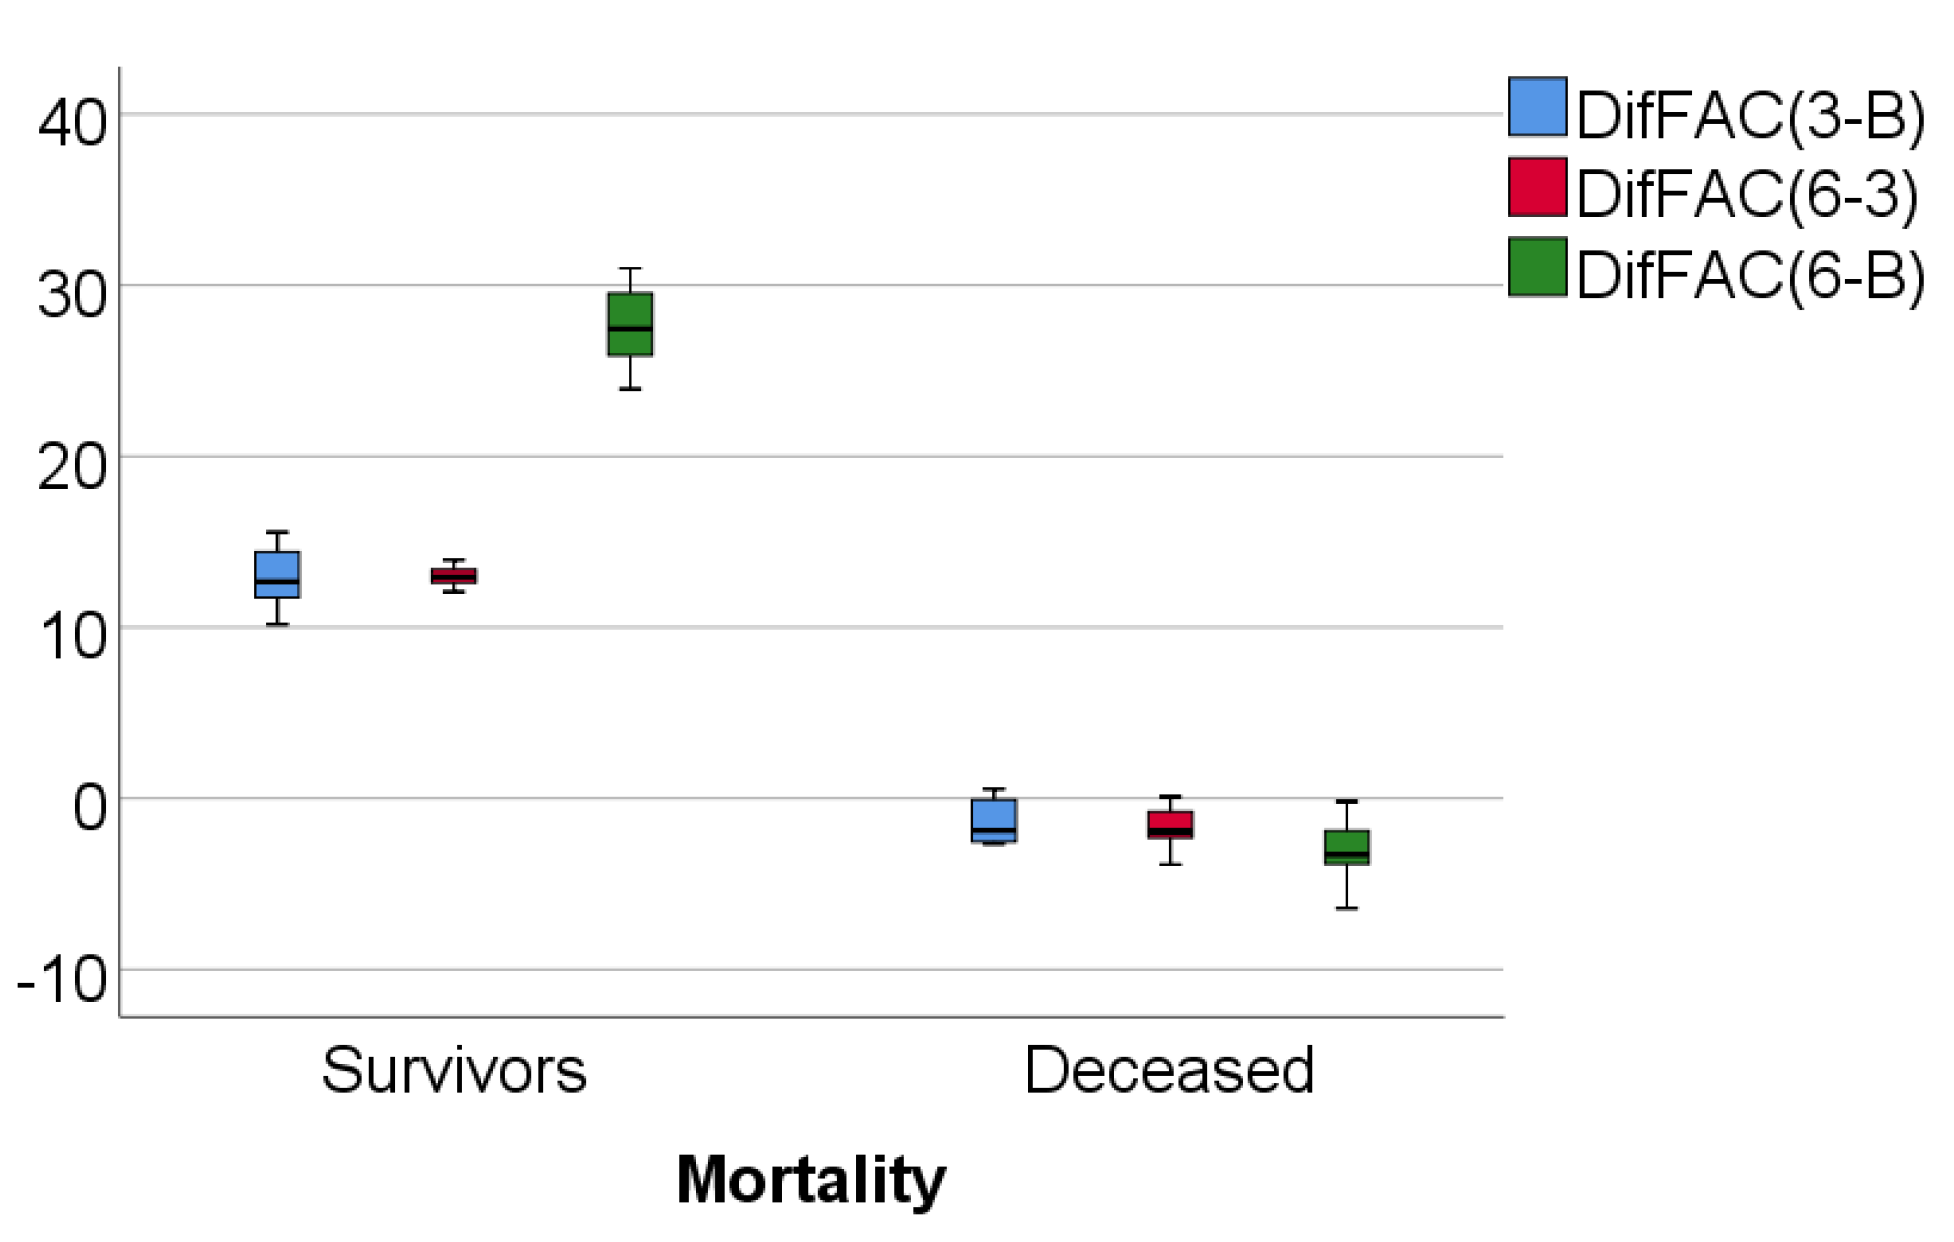
| FAC (%) | Average ± SD | − | 12.93 ± 1.62 | 12.98 ± 0.5 | 27.6 ± 1.93 |
| Median (IQR) | - | 12.65 (11.72–14.41) | 12.94 (12.61–13.38) | 27.45 (25.88–29.52) | |
| Average ± SD | + | −1.44 ± 1.26 | −1.66 ± 1.24 | −3.08 ± 2 | |
| Median (IQR) | + | −1.87 (−2.6–−0.02) | −1.93 (−2.42–−0.5) | −3.29 (−4.48–−1.35) | |
| p * | <0.001 | <0.001 | <0.001 | ||
| TAPSE (%) | Average ± SD | - | 13.33 ± 1.52 | 13 ± 0.52 | 28.05 ± 1.82 |
| Median (IQR) | - | 13.45 (12.02–14.66) | 12.91 (12.7–13.42) | 28.02 (26.75–29.5) | |
| Average ± SD | + | −1.22 ± 1.61 | −1.4 ± 1.1 | −2.6 ± 2.11 | |
| Median (IQR) | + | −1.25 (−2.74–0.28) | −1.3 (−2.16–−0.7) | −2.91 (−4.37–−0.28) | |
| p * | <0.001 | <0.001 | <0.001 | ||
| Parameter | Std. Error | p | Area (95% C.I.) |
|---|---|---|---|
| Baseline RVFWLS | 0.000 | <0.001 | 1.000 (1.000–1.000) |
| Baseline FAC | 0.016 | <0.001 | 0.974(0.942–1.000) |
| Baseline TAPSE | 0.021 | <0.001 | 0.962(0.920–1.000) |
Publisher’s Note: MDPI stays neutral with regard to jurisdictional claims in published maps and institutional affiliations. |
© 2021 by the authors. Licensee MDPI, Basel, Switzerland. This article is an open access article distributed under the terms and conditions of the Creative Commons Attribution (CC BY) license (https://creativecommons.org/licenses/by/4.0/).
Share and Cite
Tanasa, A.; Burlacu, A.; Popa, I.V.; Covic, A. Right Ventricular Functionality Following Hemodialysis Initiation in End-Stage Kidney Disease—A Single-Center, Prospective, Cohort Study. Medicina 2021, 57, 704. https://0-doi-org.brum.beds.ac.uk/10.3390/medicina57070704
Tanasa A, Burlacu A, Popa IV, Covic A. Right Ventricular Functionality Following Hemodialysis Initiation in End-Stage Kidney Disease—A Single-Center, Prospective, Cohort Study. Medicina. 2021; 57(7):704. https://0-doi-org.brum.beds.ac.uk/10.3390/medicina57070704
Chicago/Turabian StyleTanasa, Ana, Alexandru Burlacu, Iolanda Valentina Popa, and Adrian Covic. 2021. "Right Ventricular Functionality Following Hemodialysis Initiation in End-Stage Kidney Disease—A Single-Center, Prospective, Cohort Study" Medicina 57, no. 7: 704. https://0-doi-org.brum.beds.ac.uk/10.3390/medicina57070704