Article

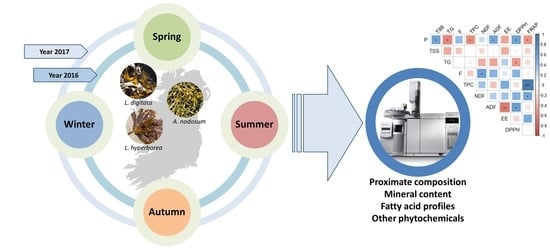
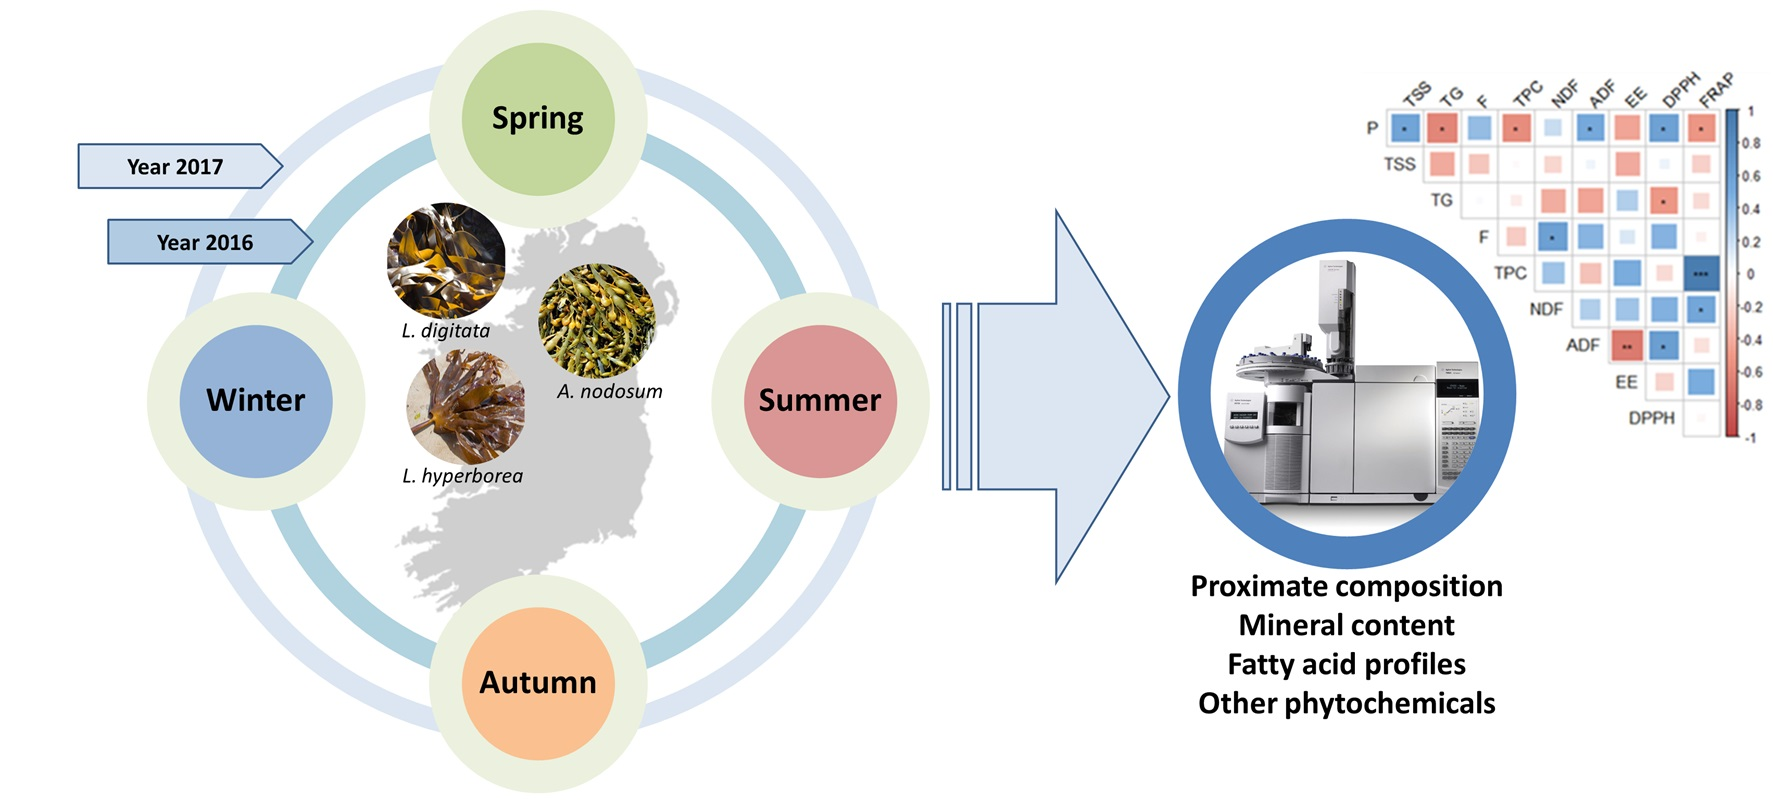
Seasonal Variation of the Proximate Composition, Mineral Content, Fatty Acid Profiles and Other Phytochemical Constituents of Selected Brown Macroalgae

1
School of Agriculture and Food Science, University College Dublin, Belfield, Dublin 4, Ireland
2
Department of Anatomy, Animal Production and Clinical Veterinary Sciences, Faculty of Veterinary, Universidade de Santiago de Compostela, Campus Terra, 27002 Lugo, Spain
3
School of Veterinary Medicine, Veterinary Science Centre, University College Dublin, Belfield, Dublin 4, Ireland
4
Department of Animal Pathology, Faculty of Veterinary, Universidade de Santiago de Compostela, Campus Terra, 27002 Lugo, Spain
*
Author to whom correspondence should be addressed.
Submission received: 9 March 2021 / Revised: 30 March 2021 / Accepted: 2 April 2021 / Published: 4 April 2021
(This article belongs to the Special Issue Advanced Methods in the Marine Natural Product Science)

Abstract

:
The main objective was to determine the chemical, phytochemical, fatty acid and mineral profiles of three commercially relevant brown macroalgae (Laminaria digitata, Laminaria hyperborea and Ascophyllum nodosum) collected each season for two years off the west coast of Ireland. All the chemical, phytochemical, fatty acid and minerals analysed varied significantly depending on the macroalgal species, season and year of collection. Overall, the protein contents of macroalgae were negatively correlated with carbohydrate content. Protein (2–11%) was at its highest during winter and/or spring, decreasing to a minimum during summer and/or autumn. The three macroalgal species analysed in this study had clearly differentiated fatty acid profiles. The concentration of fatty acids was higher in A. nodosum compared with both Laminaria species. The mineral profile of the three macroalgal species was rich in essential metals, particularly Ca, Mg and P, while the levels of I were approximately 9- to 10-fold higher in both Laminaria spp. compared with A. nodosum. The levels of toxic metals (Cd, Hg and Pb) in all the macroalgal species studied were low in the current study; while the levels of total As were high (49–64 mg/kg DW macroalgae) compared with previous reports.

Graphical Abstract

1. Introduction

Over 10,000 species of macroalgae have been identified worldwide; however, only 5% of these are currently exploited for food or animal feed applications [1]. Overall, the scientific literature describes the macroalgal biomass as rich in carbohydrates (up to 60%), with medium or high amounts of proteins (10–47%), low in lipids (1–3%) and variable contents of minerals (7–38%) [2]. Macroalgae are able to adapt to the rapid changes of the marine environmental conditions, such as changes in temperature and solar radiation by producing unique secondary metabolites, including polysaccharides, proteins, lipids and phenolic compounds [3]. Prolonged exposure of macroalgae to environmental stressors, such as fluctuations in water level, solar radiation and temperature, can lead to the formation of reactive oxygen species and other free radicals in the biomass. As a defence mechanism, the stressed macroalgal biomass produces high amounts of antioxidant compounds, such as phenolic compounds and sulphated polysaccharides amongst others, trying to maintain the integrity of the cellular structures [4]. Thus, the macroalgal biomass is rich in a wide variety of antioxidant compounds which can be incorporated in human nutrition as food or supplements. They can also provide additional health benefits to those of basic nutrition—namely, nutraceuticals or functional foods [5] that could help in the prevention of chronic diseases, such as cancer, cardiovascular diseases, obesity and diabetes [6,7].
Macroalgal carbohydrates and lipids include molecules of diverse chemical nature and biological roles in the biomass. Macroalgal polysaccharides are a diverse group encompassing dietary fibres and other soluble carbohydrates, such as glucans and fucoidan, with promising health benefits, including anti-inflammatory, antioxidant and antitumor properties in vitro and in vivo [8]. Amongst lipids, macroalgae are considered a rich source of polyunsaturated fatty acids (PUFA), such as omega-3 and 6 fatty acids, which have been linked with promising health benefits, including improvement of maternal and offspring health, growth and development, cognitive function and psychological status [9,10]. Macroalgae have also been reported to accumulate a high amount of metals, including essential metals (calcium (Ca), cobalt (Co), chromium (Cr), copper (Cu), iron (Fe), iodine (I), magnesium (Mg), manganese (Mn), molybdenum (Mo), nickel (Ni), phosphorus (P), selenium (Se) and zinc (Zn)), with relevant properties in maintaining human health when included at appropriate levels in the diet. However, macroalgae are also known to accumulate toxic metals, such as arsenic (As), cadmium (Cd), lead (Pb) and mercury (Hg), which are highly toxic even at trace levels and rank among the priority metals with public health significance [11,12,13,14,15,16].
The composition of macroalgae is extremely variable depending on the macroalgal class (i.e., green, red, or brown macroalgae) [17,18], species [19,20], stage of development of the biomass (i.e., sterile versus fertile tissue) [21] and environmental stressors, such as the season of collection [4], which will influence the biology, and thus the composition of macroalgae. The elucidation of these changes in composition could be especially relevant for studies targeting the extraction of high-value compounds from this biomass for nutraceutical applications.
The main objective of the present study was to determine the chemical, phytochemical, fatty acid and mineral profiles of three commercially relevant brown macroalgae (Laminaria digitata, Laminaria hyperborea and Ascophyllum nodosum) collected each season off the west coast of Ireland, aiming to gain an insight into the key environmental factors affecting the macroalgal wild biomass in Ireland.

2. Results and Discussion

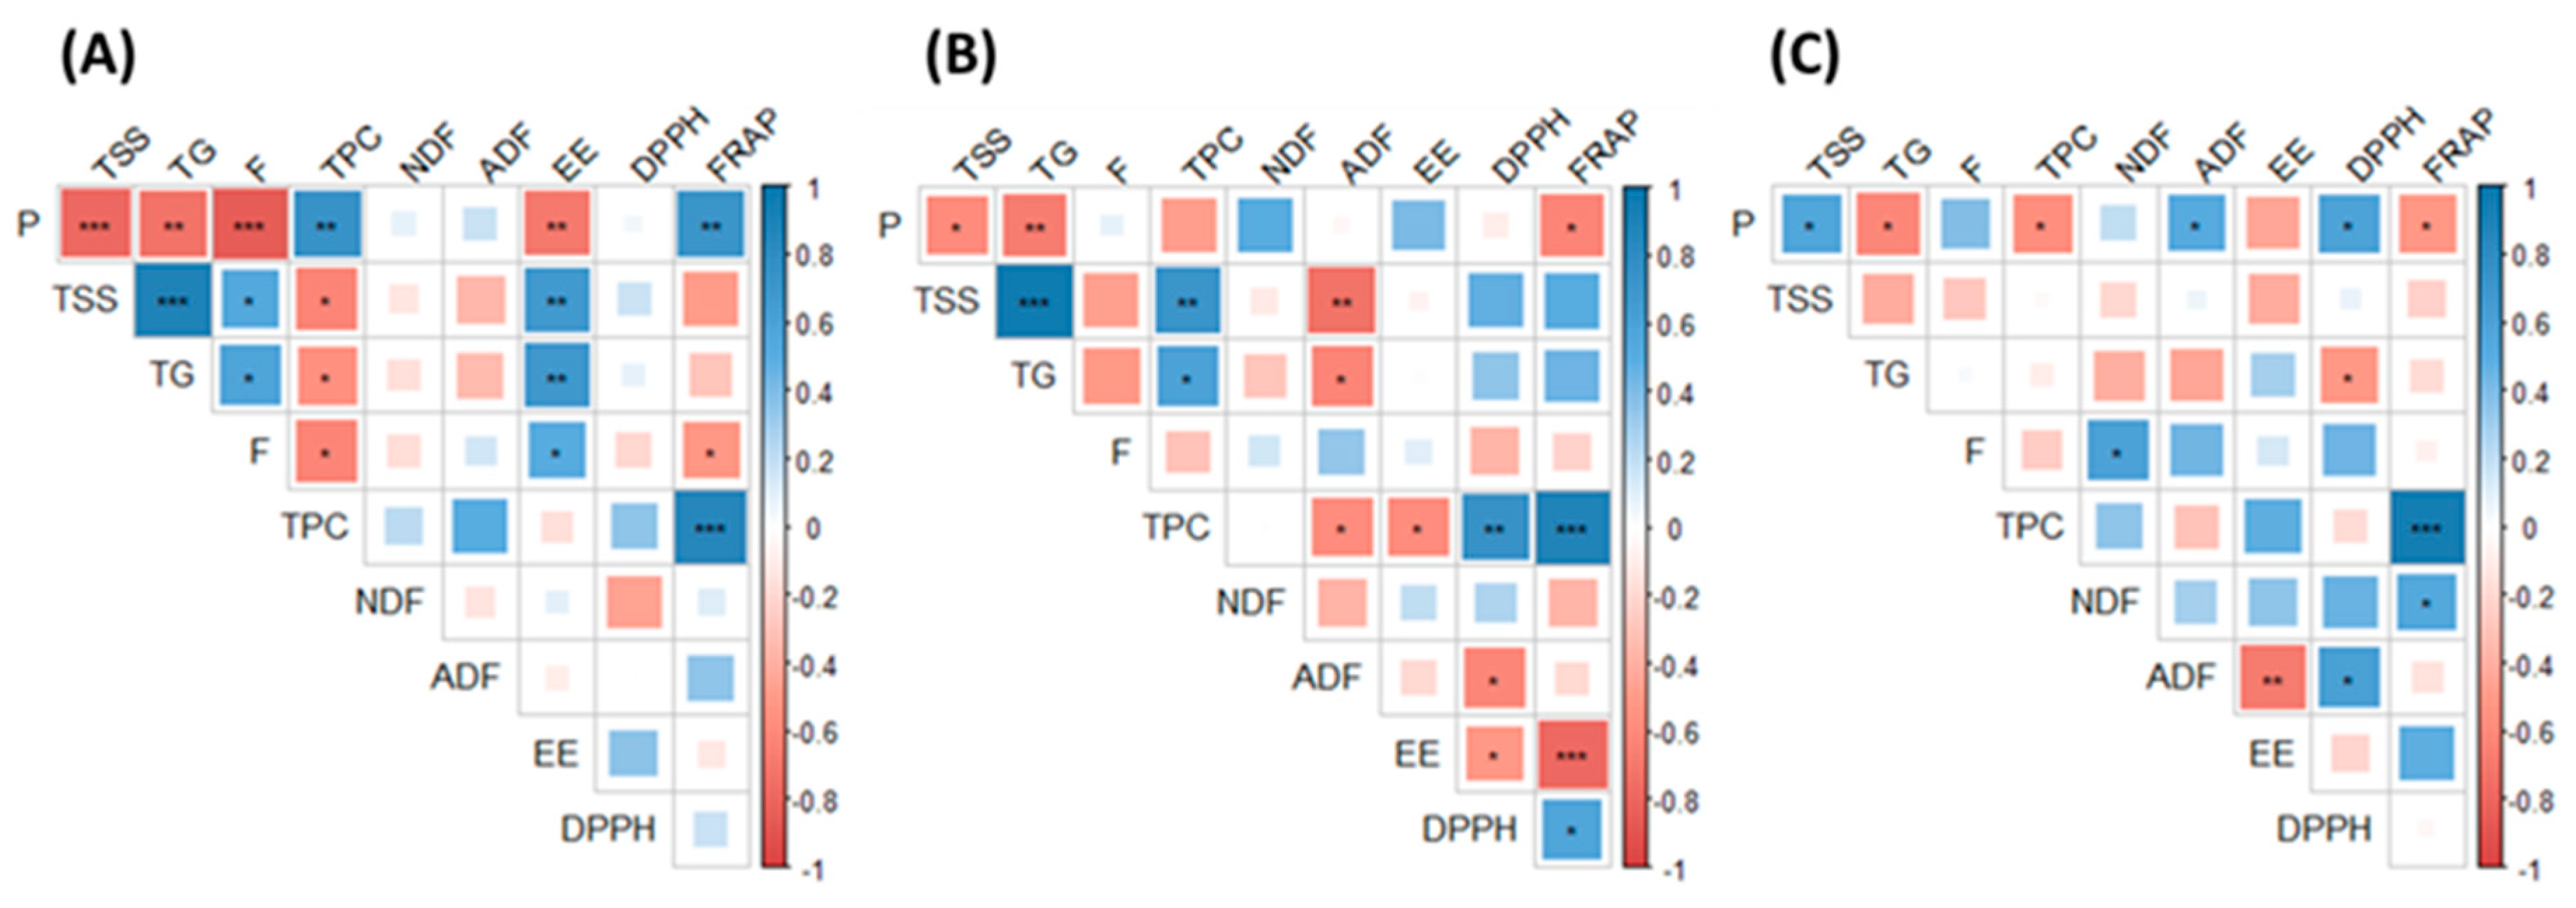
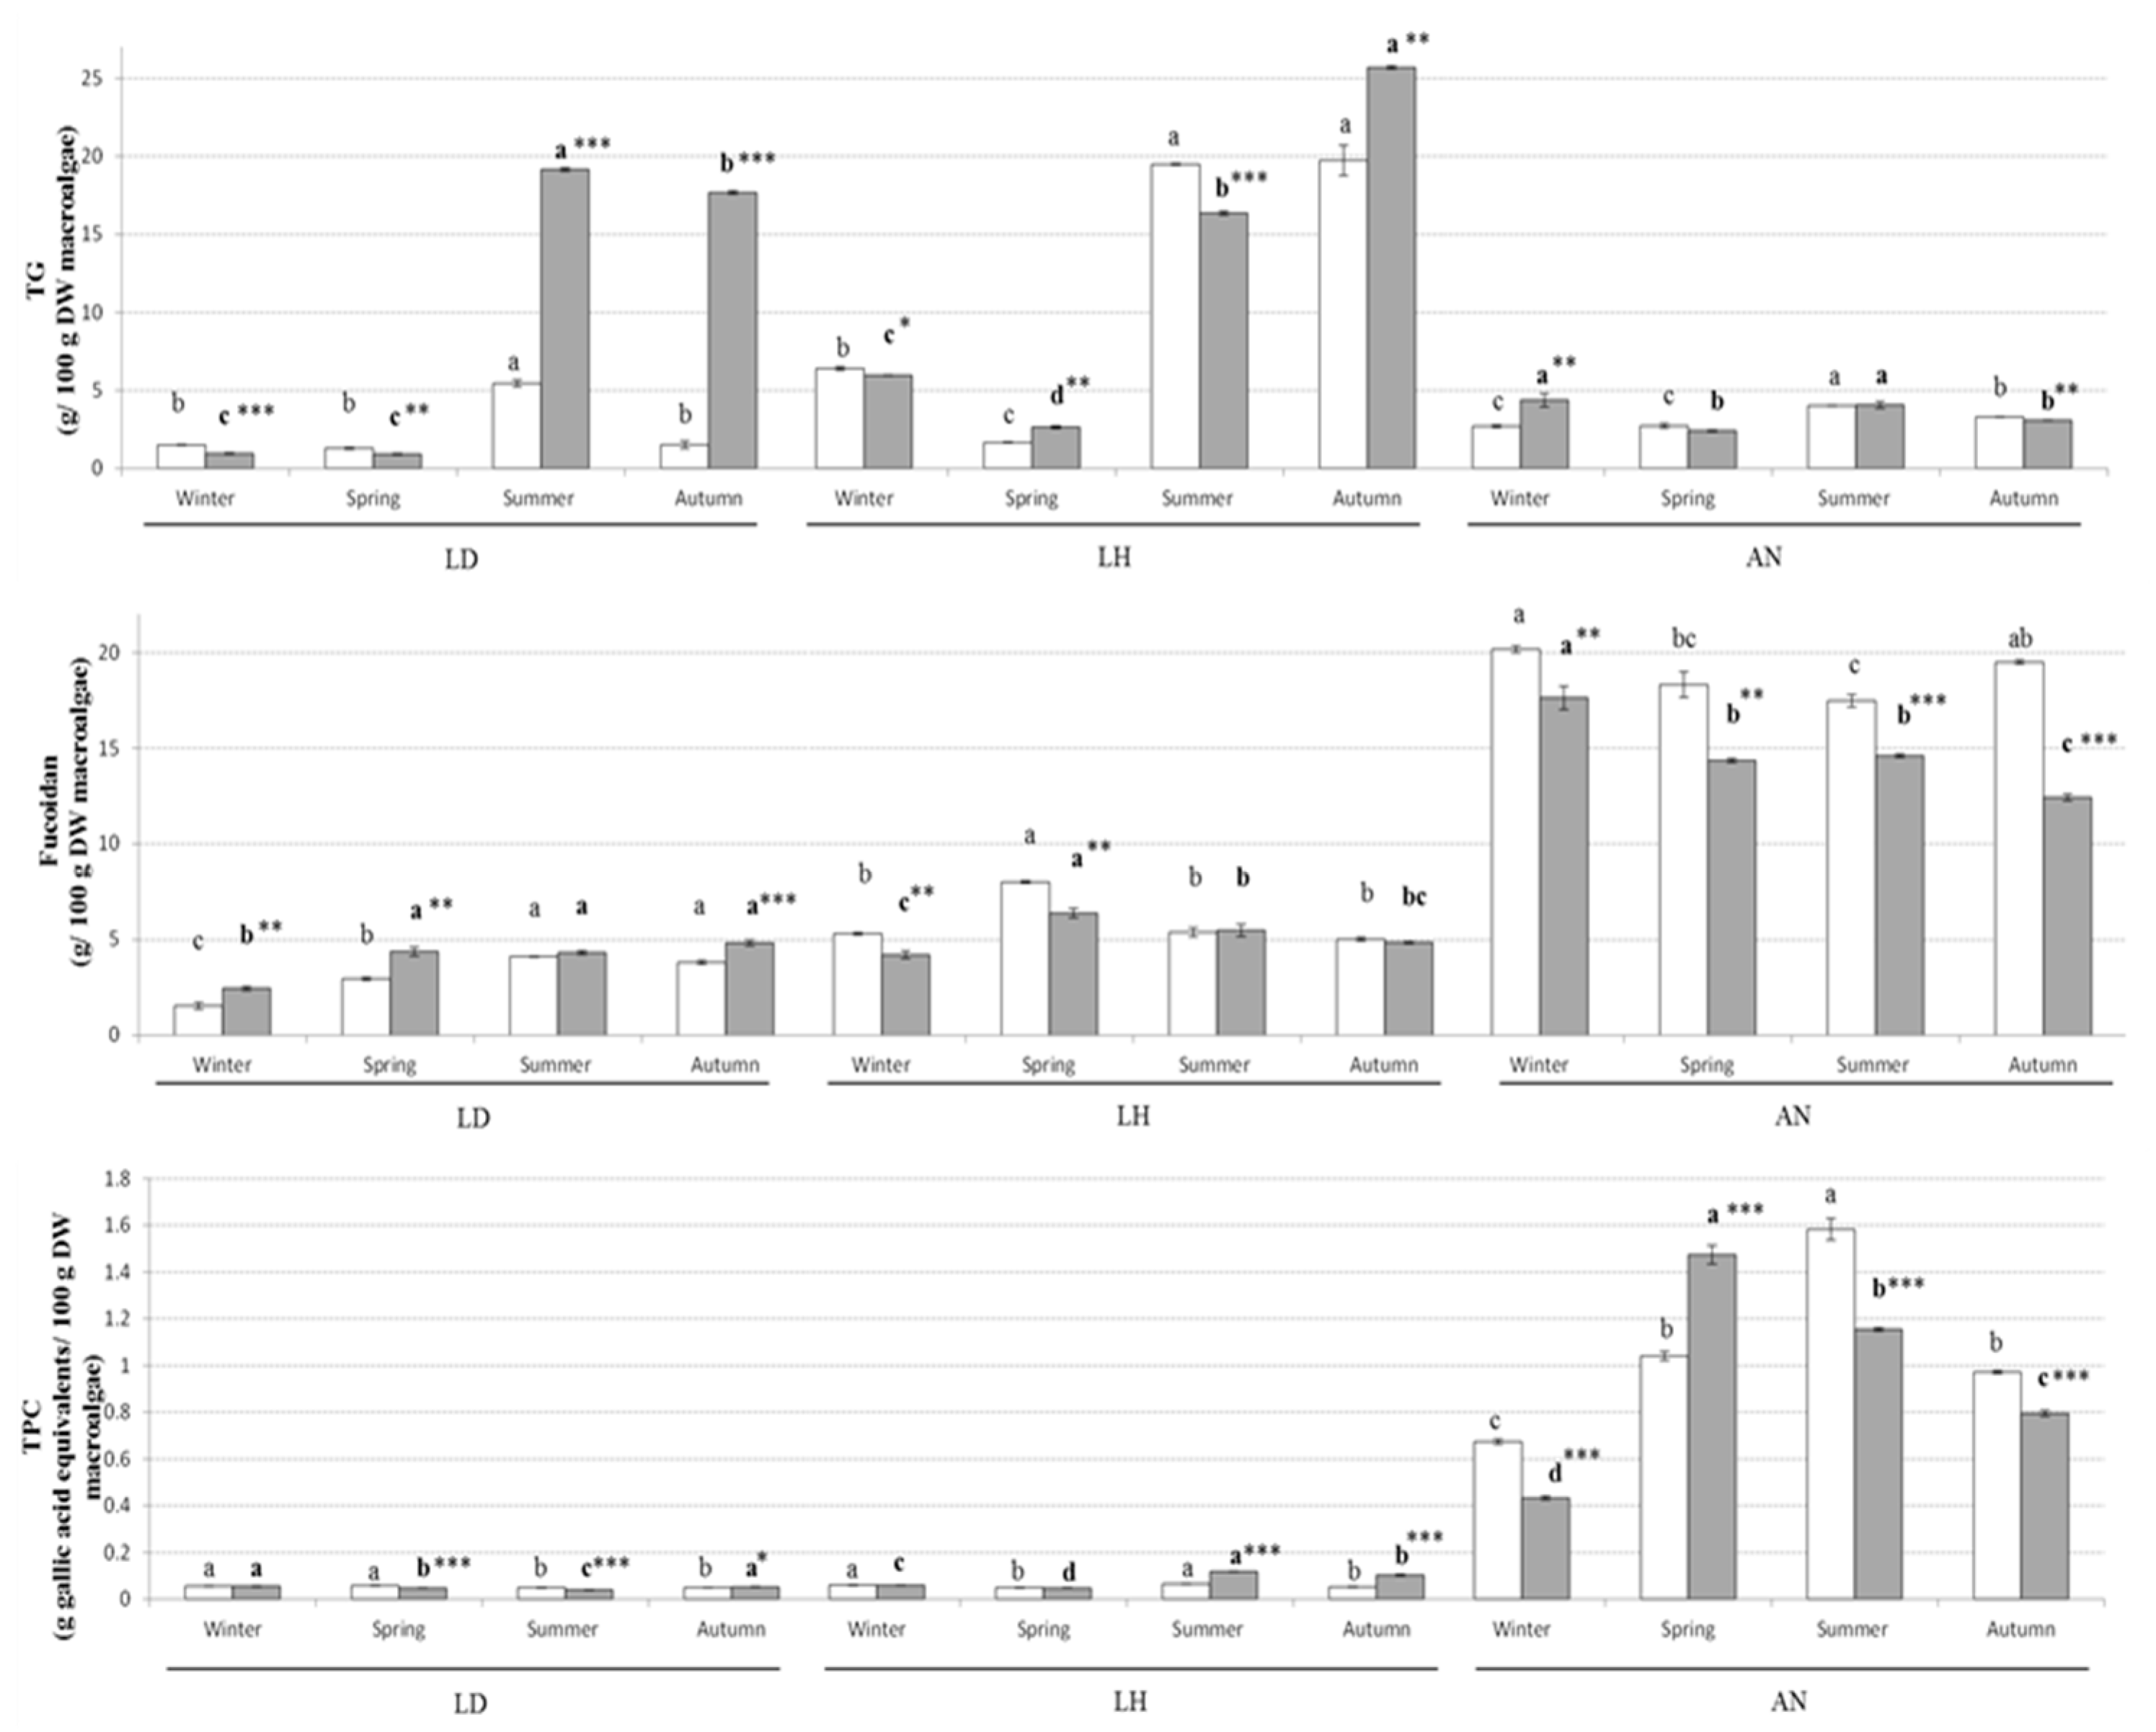
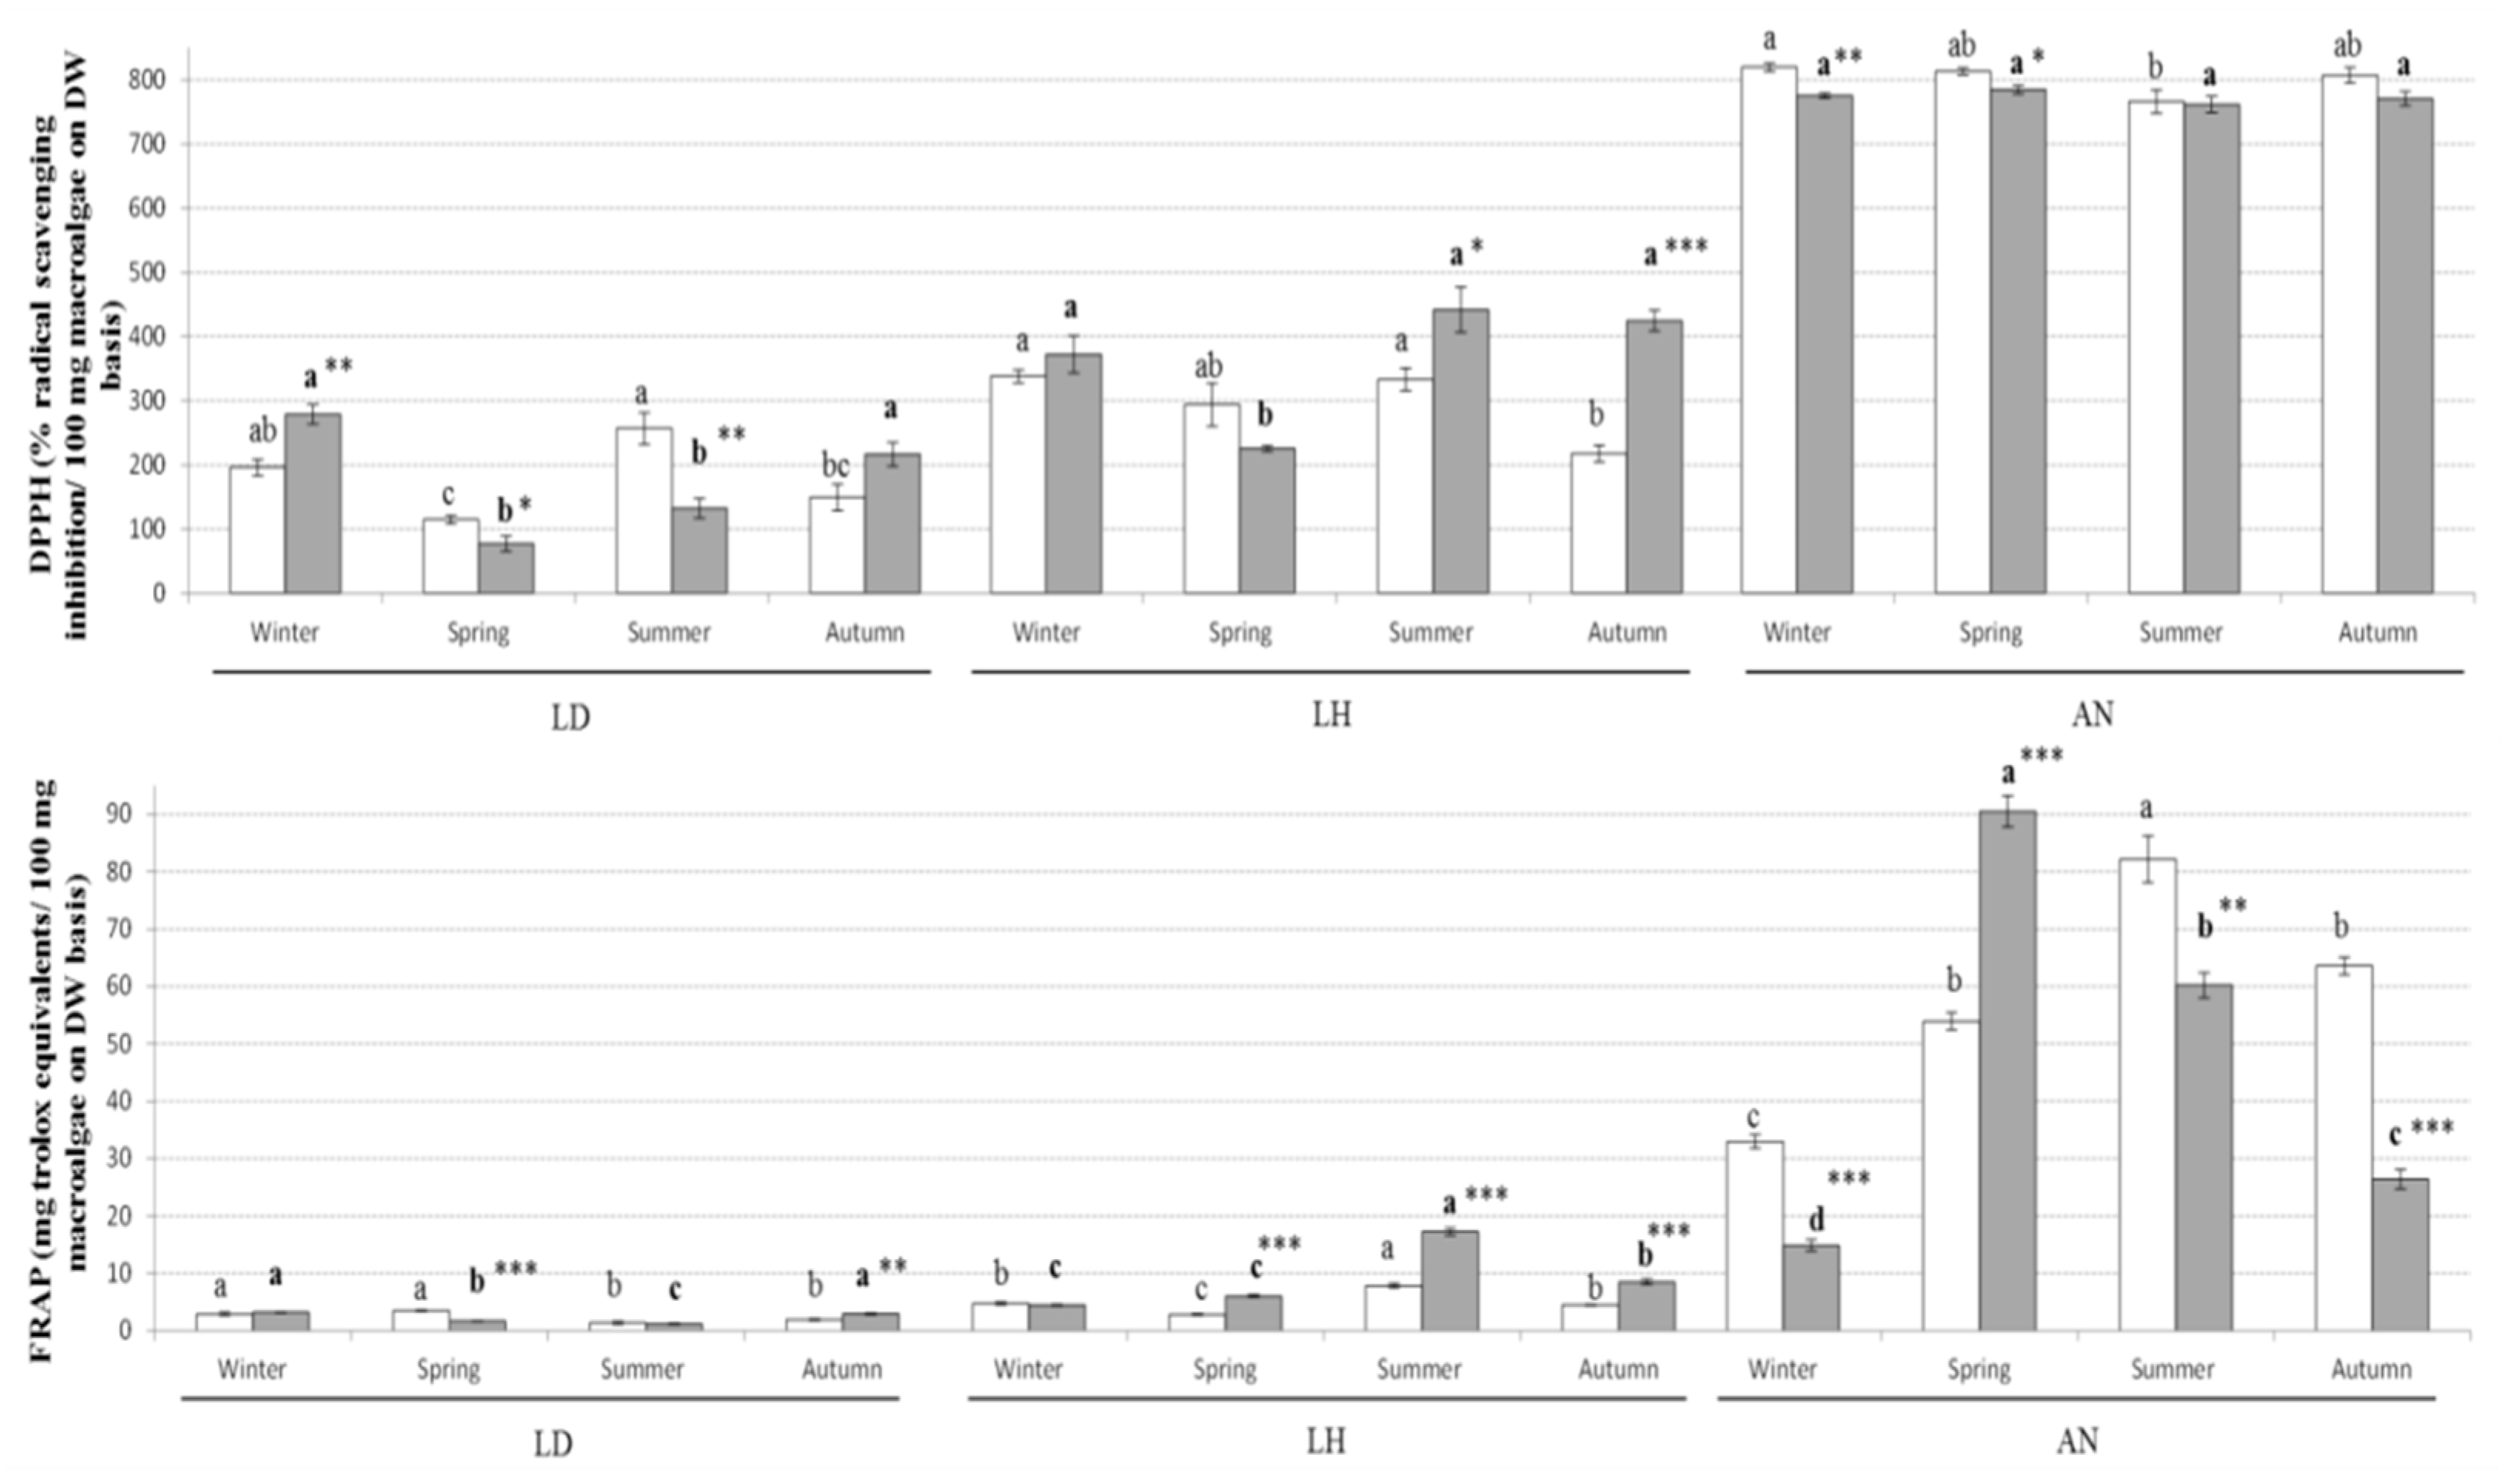
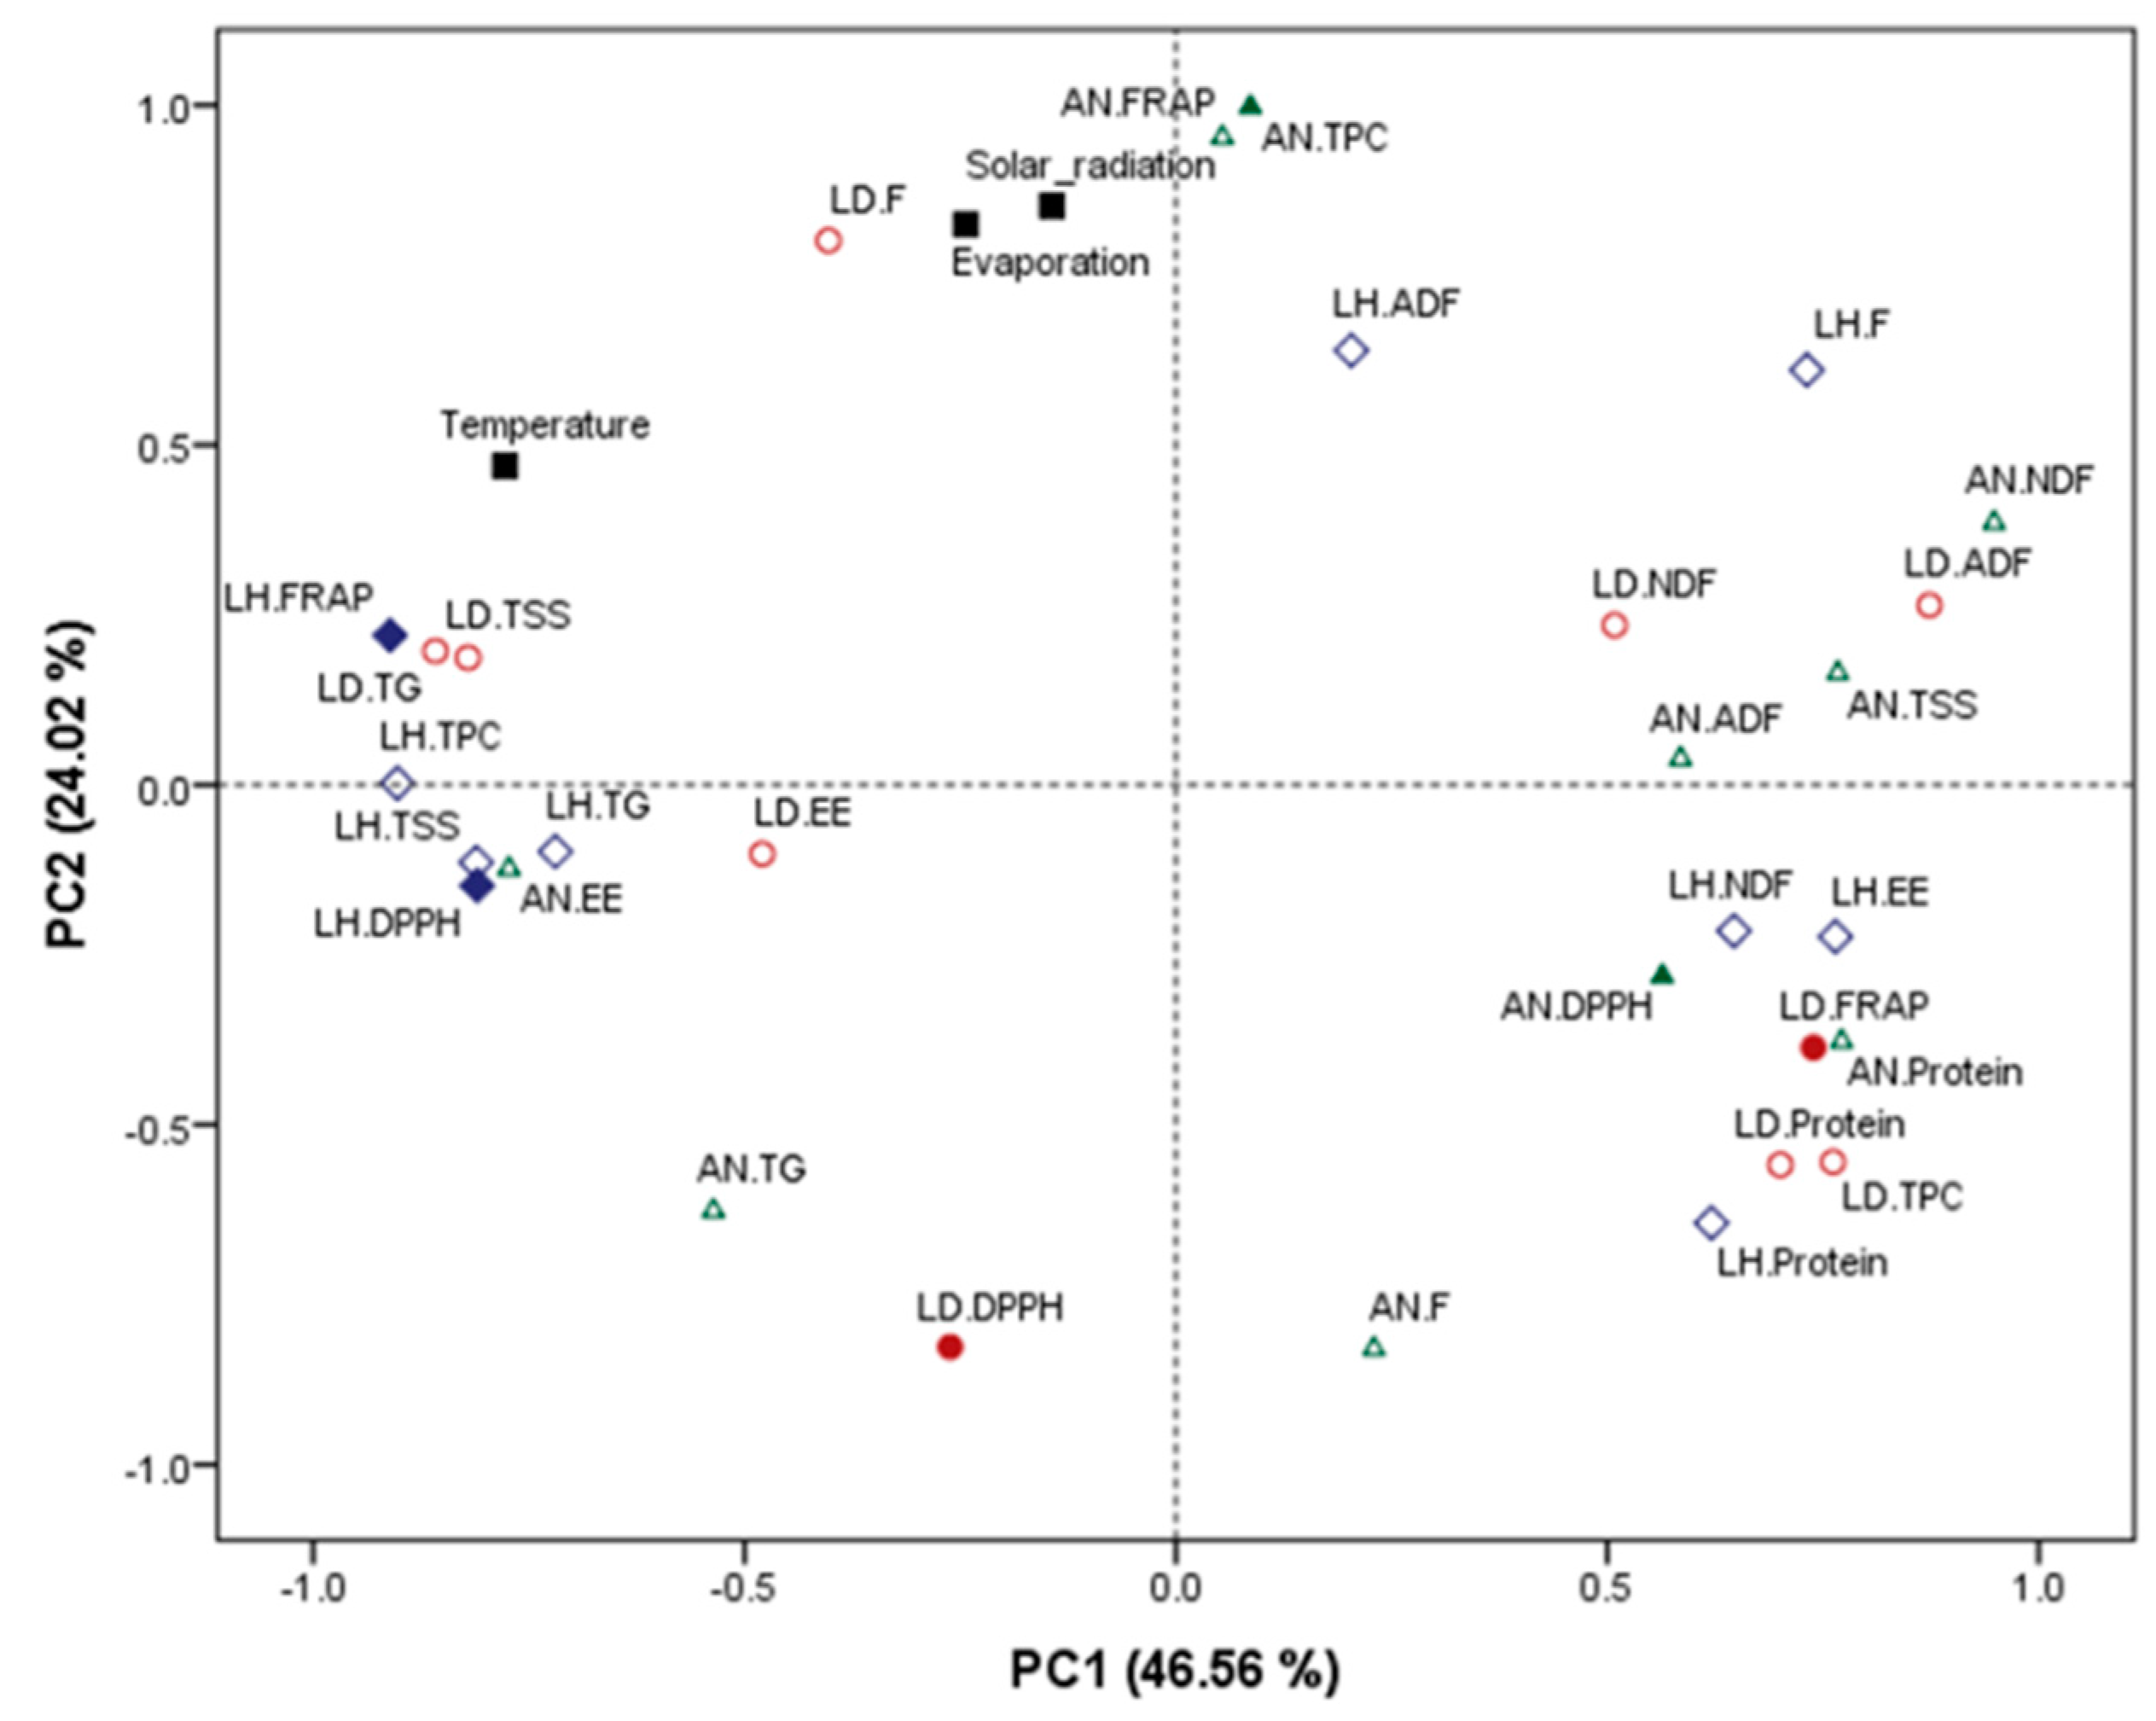
2.1. Proximate Composition, Phytochemical Concentration and Antioxidant Capacity

The proximate composition (dry matter (DM), ash, gross energy (GE), protein, total soluble sugars (TSS), neutral detergent fibre (NDF), acid detergent fibre (ADF) and ether extract (EE)) of dried and milled L. digitata, L. hyperborea and A. nodosum collected each season during the years 2016 and 2017 is presented in Table 1. All of the parameters analysed varied widely depending on the seaweed species, season and year of collection. Overall, the ash contents of the samples ranged from 17.9% to 36%, being in general more consistent through the seasons in A. nodosum compared with the other two Laminaria species. In general, the macroalgae of this study had the highest levels of ash during spring, except in the case of L. digitata collected in 2016, and all the A. nodosum samples had the highest levels of ash during winter. Previous literature reviews also described levels of ash in brown macroalgae varying between 15% and 45% [22]. Moreover, Bikker et al. [23] reported ash contents ranging from 18.9% to 37.4% in samples of L. digitata and A. nodosum collected in Ireland and France. The high ash contents in macroalgae will hamper the inclusion of intact seaweed in human and animal diets at high inclusion levels and may indicate the need to extract polysaccharides, protein and other relevant nutrients to decrease the levels of minerals added to the diet [23]. A complete mineral profile of the seaweed samples is described later in Section 2.3. The high levels of ash together with low level of lipids underpin the low energy value (GE 10.78 to 15.99 MJ/kg DW macroalgae) of the biomass analysed in this study. This is similar to previous reports in macroalgae [24]. The EE of the macroalgal samples in this study ranged from <0.1% to 3.82%, being maximum always in A. nodosum, with lipid contents of about 10-fold and 4-fold to those described in L. digitata and L. hyperborea, respectively. Further fatty acid analyses were performed, and nutritionally relevant fatty acids and lipid fractions from macroalgae are presented in Section 2.2.
Fibre is an important constituent of a number of food ingredients, and it was measured in this study by determining NDF and ADF contents. However, the detergent methods do not fully recover soluble fibres, and thus the actual fibre content is therefore underestimated [25]. The levels of fibre in the macroalgal samples of this study ranged from 27% to 67% for NDF and 11% to 35% for ADF with variable levels depending on the macroalgal species, season and year of collection and no clear pattern to allow us to draw conclusions on fibre content. Overall, the levels of both NDF and ADF were similar to those described in other brown macroalgae [24]. The levels of NDF were in all cases higher than ADF, similar to terrestrial plants.
The protein contents (ranging from approximately 2% to 11%) and TSS (≈11% to 27%) of the macroalgal samples of this study were also in agreement with previous reports [22]. In general, the protein levels of the macroalgal species in this study were lower than those described in other protein rich crops (i.e., pulses 21–25%) [26], and thus the use of the macroalgae collected in this study as a protein rich ingredient to enrich food formulations with this macronutrient may be limited. The accumulation of both protein and TSS varied depending on the macroalgal species; however, overall, the protein content in all macroalgae species in this study was at its highest during winter and/or spring, decreasing to a minimum during summer and/or autumn, while the accumulation of TSS followed an opposite accumulation pattern to that described for proteins. Moreover, the concentration of protein was negatively correlated with TSS and/or total glucans (TG) in the three macroalgal species studied (see Figure 1). A similar accumulation pattern of carbohydrates and proteins was previously described by Schiener et al. [27] when exploring the accumulation of multiple soluble carbohydrates and protein in L. digitata and L. hyperborea.
Similar to the proximate composition parameters, there was significant variation in the accumulation of TG, fucoidan, total phenolic content (TPC) and antioxidant activities (DPPH and ferric reducing antioxidant power (FRAP)) depending on the macroalgal species, season and year of collection (Figure 2 and Figure 3). In general, the amount of total glucans was higher in L. digitata and L. hyperborea compared with A. nodosum, with high levels during the summer and autumn and low levels in winter and spring. This is similar to the previous seasonal changes described in multiple soluble carbohydrates in macroalgae by Schiener et al. [27]. The authors described a high accumulation of laminarin during the summer and autumn months (reaching a maximum of 25% in L. hyperborea) that dropped to its lowest levels (1–3%) during the winter, while the accumulation of protein had an opposite behaviour in both L. digitata and L. hyperborea [27].
In the case of fucoidan, TPC and antioxidant activities, A. nodosum had in general higher levels, up to 4-fold more, compared with the two Laminaria species. The levels of fucoidan in A. nodosum were in general high during winter, with variable concentrations appreciated depending on the year of collection. Previous studies investigating the seasonal variation of fucoidan in Fucus serratus, Fucus vesiculosus and A. nodosum reported high levels of fucoidan during autumn, with low concentration of this compound during spring [28]. A high proportion of sulphate in fucoidan molecules that may influence the biological properties of these molecules has also been reported when extracting these compounds during the winter season compared with the summer [28]. Moreover, the molecular weight of fucoidan as determined by Fletcher et al. [28] were fairly constant over the year in brown macroalgae (F. serratus, Fucus vesiculosus and A. nodosum). Thus, when harvesting and exploiting brown macroalgae as a source of fucoidan, important consideration should be paid to the season of collection. The levels of TPC and FRAP antioxidant activity in A. nodosum in the current study were in general low during the winter, increasing during spring and summer and declining during autumn, while no particular trend was appreciated in the case of DPPH. A prolonged exposure of macroalgae to environmental stressors can lead to the formation of reactive oxygen species and other free radicals in the biomass [4]. Thus, the high levels of TPC and antioxidant activities produced by the macroalgal biomass during spring and summer can be related to a defence mechanism of macroalgae against oxidative damage, helping to maintain the integrity of the cellular structures. Moreover, the concentration of TPC and the antioxidant properties (FRAP and/or DPPH) in this study were strongly and positively correlated in the three macroalgal species studied (see Figure 1). These results were in agreement with the seasonal variation appreciated in A. nodosum collected monthly during 2005 on the coast of Scotland [29]. The authors attributed the variation in TPC to the different phases of growth and reproductive stage of A. nodosum, with high levels produced during April and June as the biomass reaches the fertility stage [29].
A principal component analysis (PCA) was performed to obtain an overview of the similarities and differences in the proximate, phytochemical and antioxidant composition of the three brown macroalgal species and the climatological data monitored in the region during those years (see Figure 4). Principal component 1 (PC1) explained 46.56% of the variation of the data set and PC2 explained 24.02%. The PC1 seems to separate multiple parameters between both Laminaria species, although no clear pattern or association can be made from the data set. The PC2 further separates the variation of the data set by clustering the climatological parameters, solar radiation and evaporation with the levels of TPC and FRAP antioxidant activity in A. nodosum. An increased solar irradiance and exposure to UV during the summer have also been linked to an increased production of antioxidant compounds in other intertidal macroalgal species [30,31]. Moreover, Pavia and Toth [32] concluded that exposure to sunlight had a positive effect on the content of phenolic compounds, such as phlorotannins, in natural and cultivated A. nodosum and F. vesiculosus.

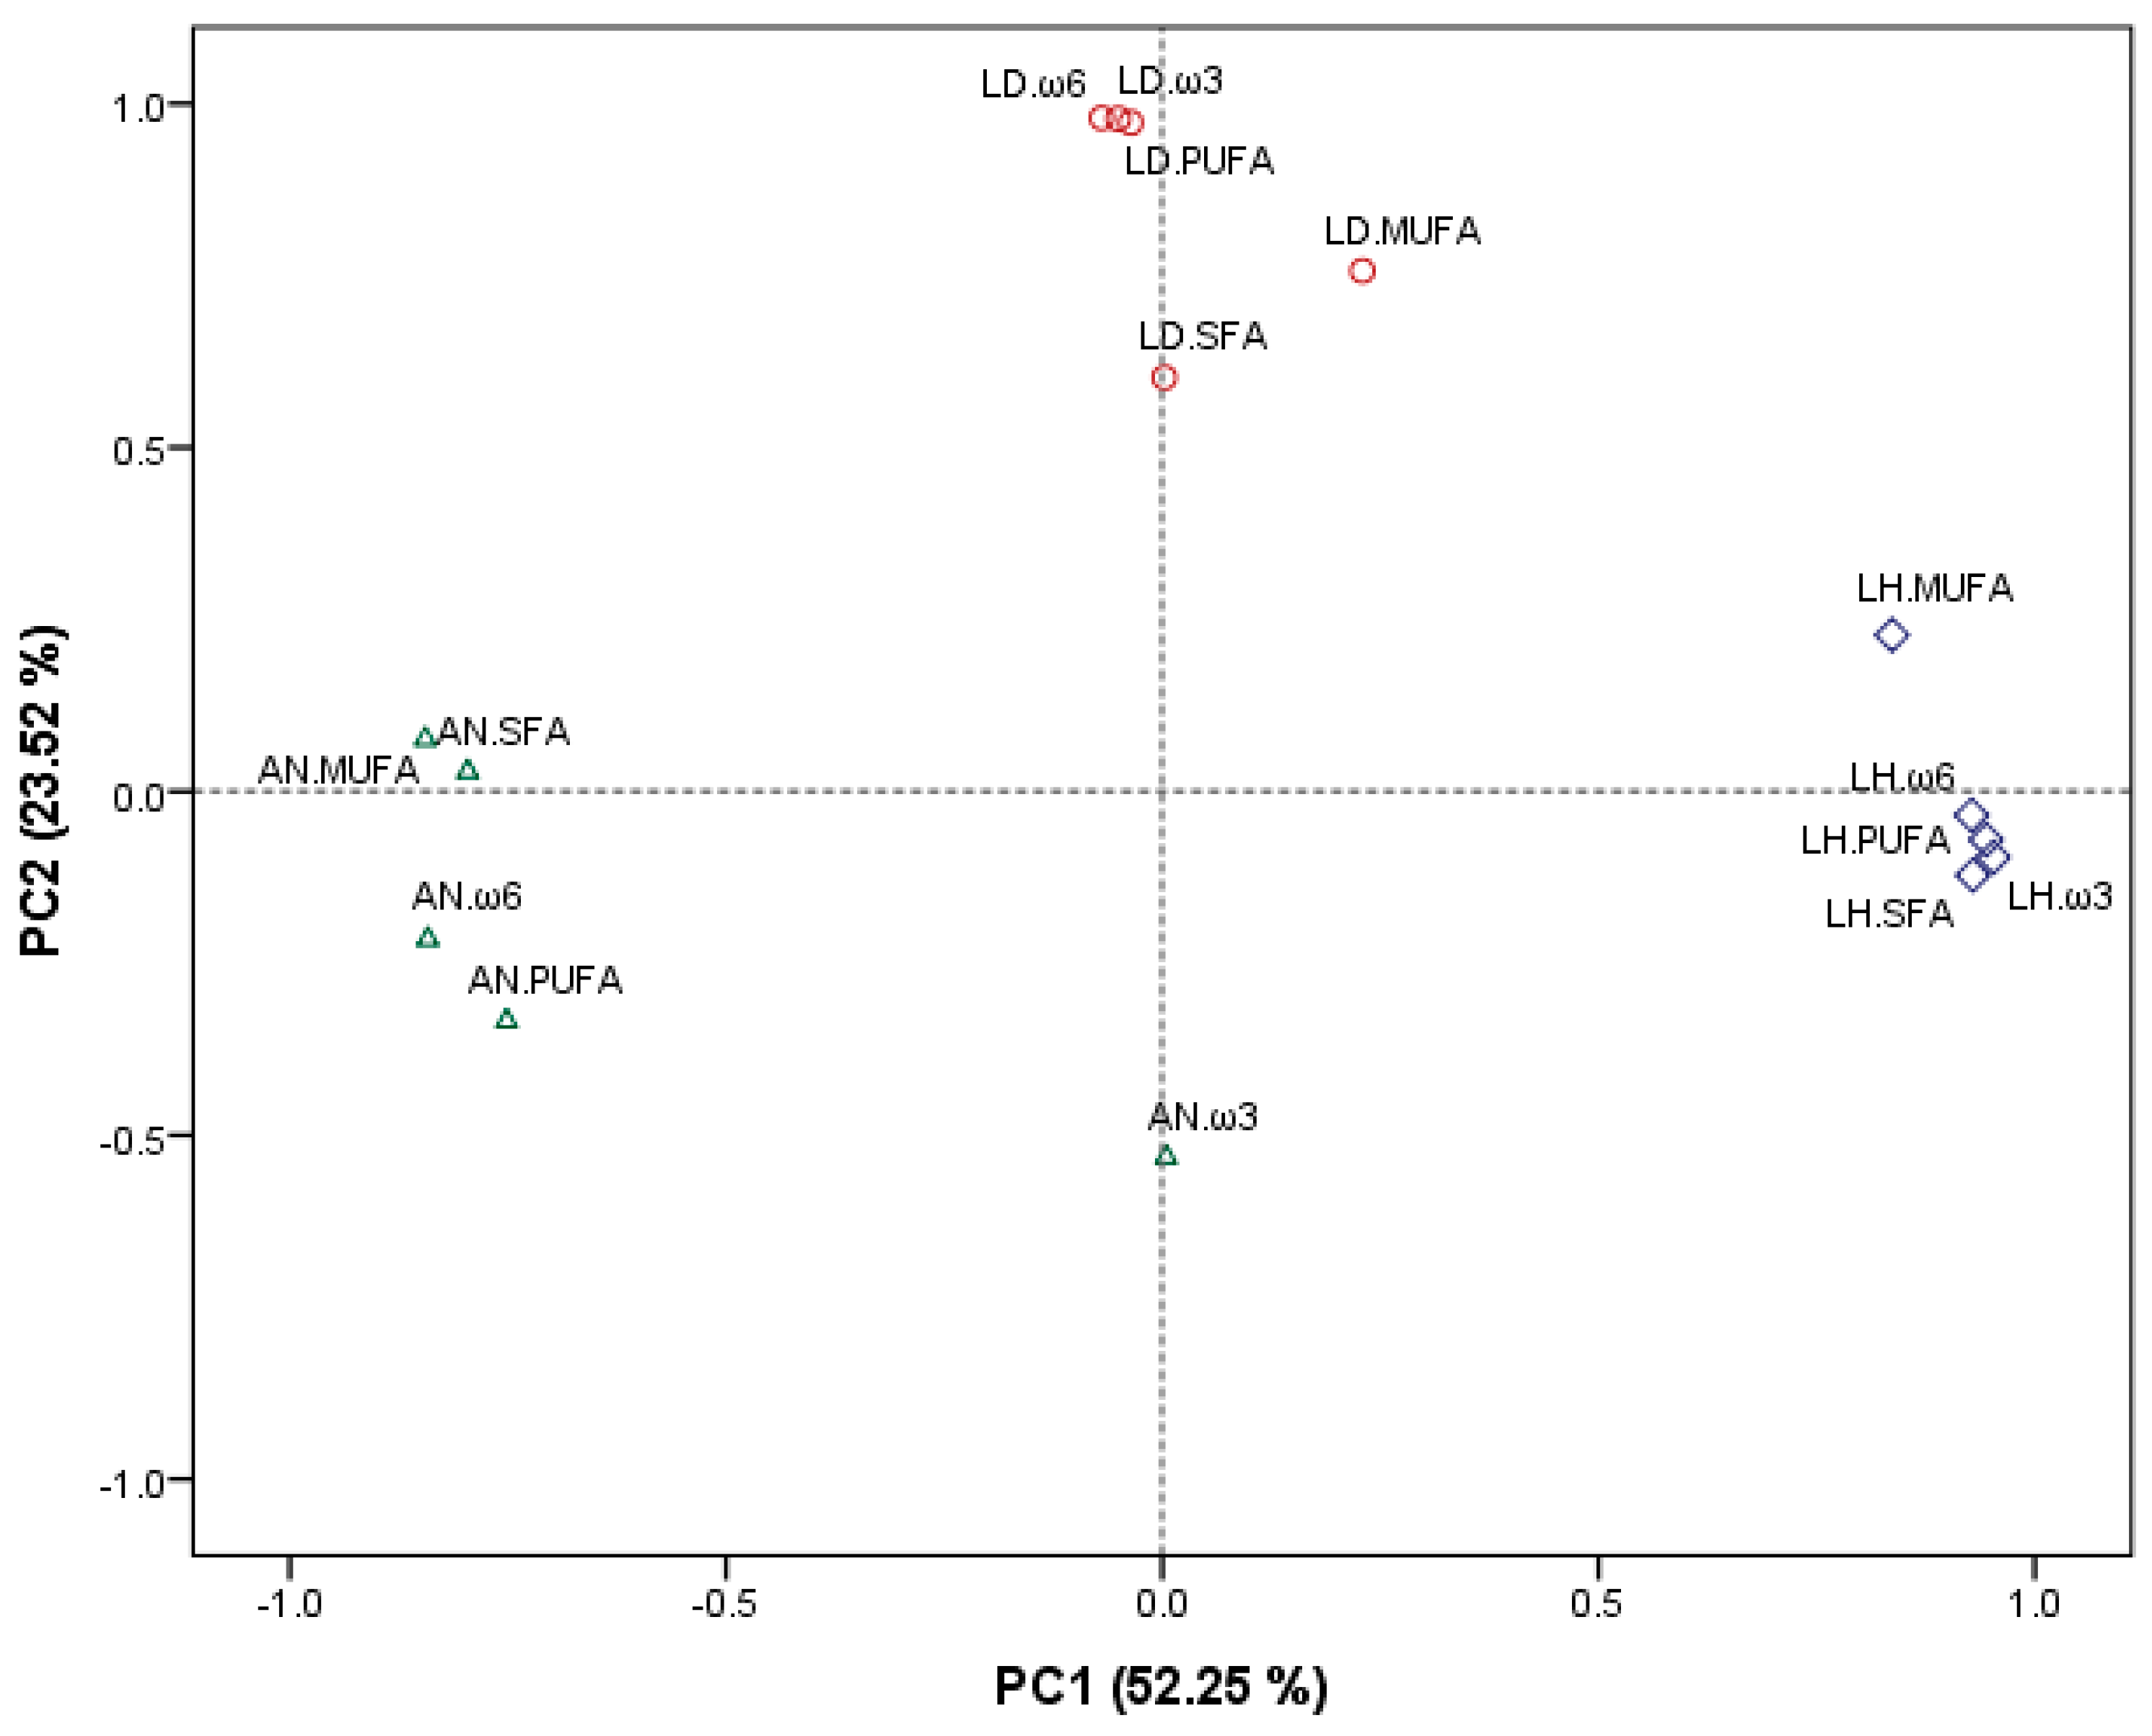
2.2. Fatty Acid Profiling

Thirty-four fatty acids were identified and quantified in L. digitata (Supplementary Table S1 online), L. hyperborea (Supplementary Table S2 online) and A. nodosum (Supplementary Table S3 online) samples. There was significant variation in the individual concentration of fatty acids and in the overall accumulation of saturated fatty acids (SFA), monounsaturated fatty acids (MUFA) and polyunsaturated fatty acid (PUFA) in the samples depending on the macroalgal species, season and year of collection. In general, the concentration of SFA, MUFA and PUFA were higher in A. nodosum compared with the other 2 macroalgal species. A. nodosum had high levels of SFA ranging from 43.91 to 58.47 mg per kg DW macroalgae during the years 2016–2017, while the levels of SFA were low in L. digitata (23.98–32.28 mg/kg DW macroalgae) and L. hyperborea (19.54–30.49 mg/kg DW macroalgae) collected within the same timeframe. Similarly, the concentration ranges of MUFA (72.43–123.55 mg/kg DW macroalgae) and PUFA (40.79–56.34 mg/kg DW macroalgae) were higher in A. nodosum compared with the other two Laminaria species, with MUFA and PUFA levels ranging from 12.13 to 21.64 and 6.46 to 31.04 mg/kg DW macroalgae, respectively. These results are in agreement with previous literature reporting a wide variability in the accumulation of fatty acids in macroalgae depending on the macroalgal species and parts of the macroalgae sampled, together with variations reported due to environmental factors related to the season, collection site and nutrient availability [33,34,35,36].
Amongst the SFAs, the levels of C16:0 were high followed by C14:0 and C17:0 compared with the other SFA identified in L. digitata and L. hyperborea, while A. nodosum accumulated high levels of both C16:0 and C14:0, followed by C17:0. The most abundant MUFAs described in all the macroalgal samples collected in this study were oleic acid (C18:1, cis9; ω9), followed by palmitoleic acid (C16:1, cis9; ω7) with variable levels depending on the year and season of collection. These results were similar to previous reports on brown macroalgae [35,37].
Overall, the main fatty acids described amongst all the PUFAs quantified in this study included the omega-3 (ω3) fatty acids, α-linolenic acid (ALA; C18:3) and eicosapentaenoic acid (EPA; C20:5 cis5,8,11,14,17) and the ω6 linoleic acid (LA; C18:2, cis9,12) and arachidonic acid (ARA; C20:4). The PUFA profile varied significantly depending on the macroalgal species. In the case of L. digitata, the levels of these four fatty acids were all higher when compared with the remaining identified PUFA. While in L. hyperborea, ARA and EPA were higher than LA and ALA, followed by the remaining PUFA. In the case of A. nodosum, the amounts of ARA and LA were comparable through the seasons and higher than EPA and ALA. Dawczynski, Schubert and Jahreis [37] reported high accumulation of PUFA representing between 31.8% and 74.7% of the total fatty acids when analysing 34 species of red and brown macroalgae. The authors also emphasised the high levels of ω3 in macroalgae, with high levels of EPA in the brown macroalgae Hizikia fusiforme and other red macroalgal species [37]. Previous reports also suggest that macroalgae grown in cold climate countries could have better lipid composition compared with those grown in warm waters due to an increased accumulation of PUFA [36,38]. The relative abundance of PUFA in the macroalgae analysed in this study is relevant for human nutrition due to the promising health benefits of these compounds when included in the diet. Even if it remains questionable whether the incorporation of macroalgae in the diet could represent a significant contribution towards fulfilling the dietary requirements of ω3 [39], their inclusion into the diet can make a significant contribution towards achieving the recommended ω6/ω3 ratios. European nutritional societies recognize a ratio of 5:1 (ω6/ω3) in the diet as health-promoting, with most Western diets deficient in ω3 with ratios of about 15–17:1 [37,40,41]. Therefore, the ω6/ω3 ratios of L. digitata (0.77–1.28:1), L. hyperborea (0.67–0.86:1) and A. nodosum (2.35–3.75:1) analysed in the current study could be useful for improving PUFA dietary ratios and potentially reducing or preventing numerous chronic diseases [42,43,44].
Principal component analysis (PCA) was performed to obtain an overview of the similarities and differences in the fatty acid profiles of SFAs, MUFAs and PUFAs, including the total ω3 and ω6 of the macroalgal species studied. The two PCs obtained from the data explained 75.77% of the cumulative variation of the data set, being 52.25% and 23.52% explained by PC1 and PC2, respectively (see Figure 5). PC1 separates clearly the fatty acid profile of L. hyperborea from the other two macroalgal species, with all the values of L. hyperborea clustered on the right side of PC1, while the fatty acids of A. nodosum are grouped on the opposite side of PC1. The second component explained further the variability of the data set and separated further the fatty acid contents of L. digitata from those of the other two macroalgal species. Overall, the PCA results of this study indicate a clear differential distribution pattern of fatty acids depending on the macroalgal species. Previous studies identified differential accumulation patterns of ω3 and ω6 at phylum, order and family taxonomic levels in macroalgae [17]. The results of the current study could indicate the potential of the fatty acids profiles of macroalgae, particularly the ω3 and ω6 that cannot be synthesised by animals [45,46], to be used as biomarkers of macroalgal consumption.

2.3. Essential and Toxic Trace Metals

The levels of essential (Ca, Co, Cr, Cu, Fe, I, Mg, Mn, Mo, Ni, P, Se and Zn) and toxic (As, Cd, Hg, Pb and Sr) trace metals monitored in L. digitata (Supplementary Table S4 online), L. hyperborea (Supplementary Table S5 online) and A. nodosum (Supplementary Table S6 online) collected in this study varied significantly depending on the macroalgal species, season and year of collection. Similar findings and variable levels depending on the season were also reported by Khaled et al. [47] and Roleda et al. [4].
Amongst the essential metals, the levels of Ca, Mg and P were high and comparable in all macroalgae, while the levels of I were approximately 9- to 10-fold higher in the two Laminaria spp. compared with A. nodosum. Similar findings with the high content of I in Laminaria spp. were previously reported [19,48]. Biancarosa et al. [19] reported levels of I ranging from <200 mg/kg DW in most red algal species to >3000 mg/kg DW in some brown algal species, with the levels of L. digitata being the highest within brown macroalgae, reaching 10,000 mg/kg DW, similar to those reported in the current study. The levels of I in both Laminaria spp. in the current study showed high accumulation of this metal in the winter with decreased levels in the summer–autumn, a similar pattern to that described in previous studies [49,50]. Moreover, previous reports also established a correlation between the decrease of the antioxidant defences of macroalgae provided by iodine during the summer, with the need of macroalgae to synthesize and accumulate a high amount of other antioxidant molecules, such as TPC, to protect the biomass from the increased sun irradiation and oxidative species [29,30,31].
The contents of other essential metals were in agreement with previous reports analysing the mineral contents of macroalgae [19]. The levels of Fe ranging from 46 to 238 mg/kg DW macroalgae and Zn from 22 to 78 mg/kg DW macroalgae were comparable between the three macroalgal species. Other essential trace elements analysed (Co, Cr, Cu, Mn, Mo, Ni and Se) were low, and in the case of Mo, approximately 37% of the readings were below the detection limits of the method.
The macroalgae of this study accumulated low levels of toxic metals, Cd (0.07–1.63 mg/kg DW macroalgae), Hg (0.01–0.06 mg/kg DW macroalgae) and Pb (0.01–1.11 mg/kg DW macroalgae), with no clear differences amongst the three macroalgal species studied. All the samples analysed in this study were below the maximum admissible levels for Cd established by the European Commission for food supplements, consisting mainly of dried macroalgae or products derived from this biomass of 3 mg/kg [14]. In the case of Hg and Pb, no specific limits have been set for macroalgae in food. The levels of Hg analysed in this study were all below the maximum admissible levels established for fishery products (0.5 mg/kg), while the levels of Pb were above those established for vegetables (0.1 mg/kg) and other marine products, such as molluscs (1.5 mg/kg) [15].
The levels of total As in the samples of this study were within the higher accumulation ranges when compared with previous scientific literature [19,51]. The accumulation of As was higher in the two Laminaria species, ranging from 75 to 615 mg/kg DW macroalgae, compared with A. nodosum (49–64 mg/kg DW macroalgae). Previous reports emphasized the role of fish, seafood and macroalgae as the major worldwide food sources of total arsenic [12]. Currently, no maximum levels have been set for the levels of As in foodstuff in Europe [15]. However, in the case of macroalgae being used as a feed material, the maximum levels of total arsenic allowed are 40 mg As per kg of feedstuff with a moisture content of 12%, demonstrating upon request by the authorities that the content of inorganic arsenic is lower than 2 mg/kg in feed, particularly when using the brown macroalga Hizikia fusiforme [52]. Thus, the levels of As may indicate the need to perform future As speciation studies to quantify the amount of inorganic As in macroalgae in Ireland, especially when designing feeds with high inclusion rates of macroalgae, to ensure that the established legal limits of As in the final feed are not reached. Despite the high As concentration in macroalgae, washing and soaking the biomass before cooking can reduce the amount of total As by 60% [53]. Moreover, after the digestion of washed and cooked H. fusiforme, only 5% of the total As content was accumulated by mice [54].

3. Materials and Methods

3.1. Macroalgal Biomass, Collection and Preparation

L. hyperborea, L. digitata and A. nodosum were harvested during the winter, summer, spring and autumn of 2016 and 2017 by Quality Sea Veg Ltd. (Co. Donegal, Ireland). Samples were cleaned from epitopes, oven-dried (50 °C, 9 days), milled and sieved to 1 mm particle size using a hammer mill (Christy and Norris, Chelmsford, UK). All the seaweed samples were then vacuum-packed and stored at room temperature for further analyses.

3.2. Chemical Analyses

The DM of the dried and milled macroalgae was determined by oven-drying the samples (105 °C, 16 h) and the ash contents by igniting the samples in a muffle furnace (550 °C, 6 h), following the official methods of analysis described by the AOAC.942.05 [55]. The GE of the samples was determined using an adiabatic Parr 1201 bomb calorimeter (Parr Instruments, Moline, IL, USA). The N content of the macroalgae was determined by the Dumas combustion method using a LECO FP 528 instrument (LECO Instruments UKLTD., Cheshire, UK), estimating the protein content of the samples by using the conversion factor of 4.17 as described for brown macroalgae by Biancarosa et al. [56]. The TSS were determined following the phenol-sulphuric acid assay, following the protocol described by Brummer and Cui [57]. The NDF and ADF were determined following the method described by Van Soest et al. [58] using the fibre analyser Ankom 220 (Ankom ™ Technology, Macedon, NY, USA). The EE was determined using a Soxtec apparatus (Tecator, Sweden), following the AOAC.920.39 [55]. The TG were determined enzymatically by using the kit K-YBGL (Megazyme, Bray, Ireland), following the manufacturer’s recommendations. The fucoidan content of the samples were analysed following the protocol as described by Garcia-Vaquero et al. [59] using the method modified from Usov, Smirnova and Klochkova [20]. Briefly, 1 mL of fucose standards (ranging from 0.005 to 0.1 mg/mL) and samples were added to 4.5 mL of a mixture 1:6 of water:sulfuric acid and hydrolysed for 10 min at 100 °C. The samples and standards were cooled at room temperature; 0.1 mL of 3% (w/v) cysteine hydrochloride solutions were added, and the mixtures incubated during 60 min at room temperature. The fucose content of the samples was determined against the fucose standard at effective absorbance of A396–A430 in a microplate reader (Epoch, BioTek, Winooski, VT, USA).
To determine the TPC and antioxidant activity of macroalgae, the macroalgal samples were pre-treated in 80% methanol (1:10, w/v) and placed in an orbital shaker (Heildolph instruments, Schwabach, Germany) at 170 rpm at room temperature overnight. The methanolic extracts were filtrated, evaporated, freeze-dried and stored at −20 °C before further antioxidant analyses. The TPC of macroalgae was determined using the Folin–Ciocalteu phenol reagent following the method described by Ganesan et al. [60], with slight modifications as described by Ainsworth and Gillespie [61]. Briefly, 100 μL of gallic acid standards (0.05–0.5 mg/mL) and macroalgal samples, at appropriate dilutions to fit within the calibration line, were mixed with 2 mL of a sodium carbonate solution in water (2%, w/v), followed by the addition of 100 μL 1 M Folin–Ciocalteu solution. The mixtures were incubated at room temperature for 30 min, and the absorbance of the reactions was read at 720 nm in a spectrophotometer (Epoch, BioTek, Winooski, VT, USA). The ferric reducing antioxidant power (FRAP) assay was performed following the methodology described by Bolanos de la Torre et al. [62]. Briefly, 280 µL of a FRAP working solution containing a mixture (10:1:1:1.4; v/v/v/v) of 300 mM acetate buffer, 20 mM ferric chloride, 10 mM 2,4,6-Tripyridyl-s-Triazine (TPTZ) in 40 mM HCl and Milli Q water, was added to 20 µL of macroalgal extracts (1 mg/mL) and trolox standards (15–420 µM). The mixtures were incubated (37 °C, 30 min) and the final absorbance of the reaction was read at 593 nm in a microplate reader (Epoch, BioTek, Winooski, VT, USA). The FRAP antioxidant activity of each extract is expressed as mg trolox equivalents per 100 mg of freeze-dried extract. The 2,2-diphenyl-1-picrylhydrazyl (DPPH) radical scavenging activity was performed according to Nicklisch and Waite [63] with the modifications as describe by Garcia-Vaquero et al. [64]. Briefly, macroalgal extracts and positive control (ascorbic acid) were assayed at 1 mg per mL of sample buffer (0.1 M citrate phosphate buffer with 0.3% of Triton X-100). The reaction started by adding 10 µL of 2 mM DPPH solution in methanol to each well, followed by an incubation of 30 min at room temperature in dark conditions. The percentage of DPPH inhibitory activity was calculated by subtracting the absorbance readings of the wells at 515 nm before and after the addition of the DPPH solution. All the chemical analyses were performed in triplicate.

3.3. Fatty Acid Profiling

The preparation of fatty acid methyl esters (FAME) for the analysis of fatty acid (FA) profiles of macroalgae were performed in a microwave system MARS 6 Express 40 (CEM Corporation, Matthews, NC, USA) following the method as described by Brunton et al. [65]. Briefly, 1.5 g of macroalgal sample, 100 μL of internal standard (IS) solution (C17:0 methyl ester at 2 mg per mL in pentane) and 10 mL of potassium hydroxide in methanol (2.5%, w/v) were saponified in microwave reaction vessels by heating the system to 130 °C for 4 min and holding the temperature for 4 min. After cooling the samples to room temperature, the methyl esterification of the fatty acids was performed by adding 15 mL of an acetyl chloride solution in methanol (5%, v/v) and heating the microwave system to 120 °C for 4 min, holding this final temperature for 2 min. After cooling the vessels to room temperature, the FAME were extracted by adding 10 mL pentane and 20 mL of saturated salt solution and shaking the mixtures. Following separation of the layers, 1.5 mL of the top pentane layer containing the FAME was aliquoted in vials containing sodium sulphate for gas chromatography (GC) analyses.
FAME were separated and quantified using a Clarus 580 Gas Chromatograph fitted with a flame ionisation detector and a capillary column CP-Sil 88 with 100 m × 0.25 mm ID in length and 0.2 µm of film thickness (Agilent, Santa Clara, California, USA). Hydrogen at a flow rate of 1.25 mL/min was used as a carrier gas using an injection volume of 0.5 µL and a split ratio of 10:1. The injector and detector temperatures were 250 °C and 270 °C, respectively. The oven temperature was set initially at 80 °C and increased to 220 °C at a rate of 6.2 °C/min, holding this temperature for 3.2 min, followed by later increases to 240 °C at 6.3 °C/min, holding this temperature for 6.5 min (runtime 35 min). The identification of fatty acids (FAs) was performed by comparison of their retention times with those of a certified reference material (SupelcoTM FAME mix; Sigma Aldrich, Arklow, Co. Wicklow, Ireland). The integration of the peaks was performed using the software TotalChrom 6.3.2 (PerkinElmer, Waltham, MA, USA), and their quantification was done on the basis of the IS. The FA content of the samples is expressed as mg per kg macroalgae on dry weight (DW) basis.

3.4. Essential and Toxic Metal Profiling

For the determination of essential and toxic metals, 1 g of macroalgal samples were digested with nitric acid and hydrogen peroxide in a microwave digestion system (Millestone Ethos Plus, Sorisole, Italy) by increasing the temperature of the mixtures from 25 °C to 200 °C during 10 min and maintaining the temperature for a further 10 min. After the digestion process, the samples were cooled down at room temperature and diluted to 15 mL with ultrapure water (18 MΩ cm−1) following the protocol previously described by López-Alonso et al. [66]. Additional processing was required for the determination of iodine (I) by treating the samples following the high temperature alkaline extraction procedure as described in EN [67].
The concentrations of essential (Ca, Co, Cr, Cu, Fe, I, Mg, Mn, Mo, Ni, P, Se and Zn) and toxic (As, Cd, Pb and Hg) metals were determined by inductively coupled plasma mass spectrometry (ICP-MS, VGElemental PlasmaQuad SOption, equipped with a micromist low-flow nebulizer) at a plasma flow rate of 14 mL/min, auxiliary gas flow rate 1 mL/min and nebulizer gas flow 0.8 mL/min, following the previously established operational conditions [66]. All the samples were analysed in triplicate, and the concentration of essential and toxic metals in the samples is expressed as mg/kg DW macroalgae.
An analytical quality control program was applied throughout the study by including blank samples and certified reference material (CRM) alongside the samples. The values of the blanks were subtracted from the sample readings, and the limits of detection of the method were calculated as 3 times the standard deviation of the reagent blanks. The limits of quantification, expressed as a concentration in the macroalgae, were calculated on the basis of the mean sample volume and total volume analysed. Analytical recoveries were determined from the CRMs SRM 1515 (Apple leaves, NIST) and BCR 279 (Ulva Lactuca, IRMM) with acceptable results (Supplementary Table S7 online).

3.5. Climatological Data

The climatological data of the region of collection of macroalgae was collected in the atmospheric research station at Mace Head by Met Éireann [68]. The temperature (°C), evaporation (mm) and solar radiation (J/cm2) encompassing both visible and near-visible (ultraviolet and near-infrared) were compiled monthly during the years 2016 and 2017.

3.6. Statistical Analyses

The influence of the macroalgae species, season and year of collection on the composition of macroalgae were analysed by multivariate general linear model in SPSS version 24.0. The differences were further analysed by either Tukey’s HSD post hoc tests or Student’s t-test. The variance in the data was analysed by principal component analysis (PCA) using direct Oblimin rotation with Kaiser normalisation to obtain the expected weight for each component with eigenvalues higher than 1 in SPSS version 24.0. The correlations in the data were explored using R ([69]; Version 4.0.2) with the packages “ggplot2” and “corrplot” used to generate a graphical display of the Pearson’s correlation matrix [70]. The function “cor.mtest” produced the p-values for each pair of input features included in the correlation matrix.

4. Conclusions

Overall, the composition of macroalgae was extremely variable depending on the species, season and year of collection. There was a strong negative correlation between the accumulation of protein and carbohydrates (total soluble sugars, total glucans and/or fucoidan) in the macroalgae in this study. In general, the levels of protein were high during winter and/or spring and decreased to a minimum during summer and/or autumn, while the levels of carbohydrates followed an opposite accumulation trend to that described for proteins. Positive correlations were also identified in all macroalgae between their phenolic contents and antioxidant properties (DPPH and/or FRAP). Moreover, solar radiation and evaporation seem to explain the levels of TPC and FRAP antioxidant activity in the intertidal macroalga A. nodosum. The levels of TPC and FRAP antioxidant activity in A. nodosum in the current study were in general low during the winter, increasing during spring and summer and declining during autumn. These results suggest an increased production of antioxidant compounds by the macroalgal cells in periods of increased oxidative stress damage in macroalgal species located in the upper-middle shore compared with species growing in the low-shore or sub-tidal regions.
When analysing the fatty acid profiles of macroalgae, the concentration of fatty acids was higher in A. nodosum compared with the other two Laminaria species. Overall, the main PUFA quantified in this study included the ω3 ALA and EPA and the ω6 LA and ARA, being the profile and relative accumulation of fatty acids in macroalgae (SFA, MUFA, ω3 and ω6) clearly differentiated between the three macroalgal species studied. The results of the current study could indicate the potential of the fatty acids profiles of macroalgae, particularly the ω3 and ω6 that cannot be synthesised by animals, to be used as biomarkers of macroalgal consumption. The mineral profiles of the three brown macroalgae of this study were rich in essential metals, particularly Ca, Mg and P. The levels of I were high in the case of the two Laminaria spp. The levels of toxic metals (Cd, Hg and Pb) in all the macroalgal species studied were low, while the levels of total As were relatively high and may need further research to ensure that the current legal limits of arsenic in feed are not met when designing diets containing a high percentage of macroalgae.

Supplementary Materials

The following are available online at https://0-www-mdpi-com.brum.beds.ac.uk/article/10.3390/md19040204/s1. Table S1: Fatty acid (mg/kg DW macroalgae) profile of L. digitata collected all seasons during the years 2016 and 2017; Table S2: Fatty acid (mg/kg DW macroalgae) profile of L. hyperborea collected all seasons during the years 2016 and 2017; Table S3: Fatty acid (mg/kg DW macroalgae) profile of A. nodosum collected all seasons during the years 2016 and 2017; Table S4: Concentration of essential and toxic trace elements (mg/kg DW macroalgae) in L. digitata collected all seasons during the years 2016 and 2017; Table S5: Seasonal variation of the concentration of essential and toxic trace elements (mg/kg DW macroalgae) in L. hyperborea collected during the years 2016 and 2017; Table S6: Seasonal variation of the concentration of essential and toxic trace elements (mg/kg DW macroalgae) in A. nodosum collected during the years 2016 and 2017; Table S7: Analytical quality control programme for the determination of essential and toxic metal concentrations (μg/L).

Author Contributions

M.G.-V. designed the work, performed the experiments, statistical analysis, writing and revision of the manuscript. G.R. contributed to the design of the work and revision of the manuscript. M.L.-A. and M.M. performed the mineral analyses. J.O. and T.S. collaborated in the revision of the manuscript and provided funds for the work. All authors have read and agreed to the published version of the manuscript.

Funding

This work was supported by Science Foundation Ireland (SFI) (grant number: 14/IA/2548).

Institutional Review Board Statement

Not applicable.

Data Availability Statement

Not applicable.

Conflicts of Interest

The authors declare no conflict of interest.

References

  1. Chojnacka, K.; Saeid, A.; Witkowska, Z.; Tuhy, L. Biologically Active Compounds in Seaweed Extracts—The Prospects for the Application; The Open Conference Proceedings Journal; Bentham Open: Bussum, The Netherlands, 2012. [Google Scholar]
  2. Dominguez, H.; Loret, E.P. Ulva lactuca, a source of troubles and potential riches. Mar. Drugs 2019, 17, 357. [Google Scholar] [CrossRef] [PubMed] [Green Version]
  3. Collins, K.G.; Fitzgerald, G.F.; Stanton, C.; Ross, R.P. Looking beyond the terrestrial: The potential of seaweed derived bioactives to treat non-communicable diseases. Mar. Drugs 2016, 14, 60. [Google Scholar] [CrossRef] [PubMed] [Green Version]
  4. Roleda, M.Y.; Marfaing, H.; Desnica, N.; Jónsdóttir, R.; Skjermo, J.; Rebours, C.; Nitschke, U. Variations in polyphenol and heavy metal contents of wild-harvested and cultivated seaweed bulk biomass: Health risk assessment and implication for food applications. Food Control 2019, 95, 121–134. [Google Scholar] [CrossRef]
  5. Garcia-Vaquero, M.; Hayes, M. Red and green macroalgae for fish and animal feed and human functional food development. Food Rev. Int. 2016, 32, 15–45. [Google Scholar] [CrossRef]
  6. Déléris, P.; Nazih, H.; Bard, J.-M. Seaweeds in human health. In Seaweed in Health and Disease Prevention; Elsevier: Amsterdam, The Netherlands, 2016; pp. 319–367. [Google Scholar]
  7. Lordan, S.; Ross, R.P.; Stanton, C. Marine bioactives as functional food ingredients: Potential to reduce the incidence of chronic diseases. Mar Drugs 2011, 9, 1056–1100. [Google Scholar] [CrossRef] [PubMed] [Green Version]
  8. Garcia-Vaquero, M.; Rajauria, G.; O’Doherty, J.; Sweeney, T. Polysaccharides from macroalgae: Recent advances, innovative technologies and challenges in extraction and purification. Food Res. Int. 2017, 99, 1011–1020. [Google Scholar] [CrossRef] [PubMed] [Green Version]
  9. Mapiye, C.; Vahmani, P.; Mlambo, V.; Muchenje, V.; Dzama, K.; Hoffman, L.; Dugan, M. The trans-octadecenoic fatty acid profile of beef: Implications for global food and nutrition security. Food Res. Int. 2015, 76, 992–1000. [Google Scholar] [CrossRef]
  10. Pelliccia, F.; Marazzi, G.; Greco, C.; Franzoni, F.; Speziale, G.; Gaudio, C. Current evidence and future perspectives on n−3 pufas. Int. J. Cardiol. 2013, 170, S3–S7. [Google Scholar] [CrossRef]
  11. Committee, E.S. Statement on the benefits of fish/seafood consumption compared to the risks of methylmercury in fish/seafood. Efsa J. 2015, 13, 3982. [Google Scholar] [CrossRef] [Green Version]
  12. CONTAM Panel. Scientific opinion on arsenic in food. Efsa J. 2009, 7, 1351. [Google Scholar] [CrossRef]
  13. CONTAM Panel. Scientific opinion on lead in food. Efsa J. 2010, 8, 1570. [Google Scholar]
  14. EC 488/2014. Commission Regulation (EU) no 488/2014 of 12 May 2014 Amending Regulation (EC) no 1881/2006 as Regards Maximum Levels of Cadmium in Foodstuffs; European Union: Brussels, Belgium, 2014. [Google Scholar]
  15. EC 1881/2006. Commission Regulation (EC) no 1881/2006 of 19 December 2006 Setting Maximum Levels for Certain Contaminants in Foodstuffs; European Union: Brussels, Belgium, 2006. [Google Scholar]
  16. Shaltout, N.; Shams El Din, N. Investigation of the fatty acid profile in some macroalgae in relation to the environmental conditions for biodiesel production. Am. J. Environ. Sci. 2015, 11, 402–419. [Google Scholar] [CrossRef]
  17. Galloway, A.W.E.; Britton-Simmons, K.H.; Duggins, D.O.; Gabrielson, P.W.; Brett, M.T. Fatty acid signatures differentiate marine macrophytes at ordinal and family ranks1. J. Phycol. 2012, 48, 956–965. [Google Scholar] [CrossRef] [PubMed]
  18. Rodrigues, D.; Freitas, A.C.; Pereira, L.; Rocha-Santos, T.A.P.; Vasconcelos, M.W.; Roriz, M.; Rodríguez-Alcalá, L.M.; Gomes, A.M.P.; Duarte, A.C. Chemical composition of red, brown and green macroalgae from buarcos bay in central west coast of portugal. Food Chem. 2015, 183, 197–207. [Google Scholar] [CrossRef] [PubMed]
  19. Biancarosa, I.; Belghit, I.; Bruckner, C.; Liland, N.; Waagbø, R.; Amlund, H.; Heesch, S.; Lock, E. Chemical characterization of 21 species of marine macroalgae common in norwegian waters: Benefits of and limitations to their potential use in food and feed. J. Sci. Food Agric. 2018, 98, 2035–2042. [Google Scholar] [CrossRef] [Green Version]
  20. Usov, A.; Smirnova, G.; Klochkova, N. Algae polysaccharides. 55. Polysaccharide composition of some brown Kamchatka algae. Bioorganicheskaia Khimiia 2001, 27, 444–448. [Google Scholar] [PubMed]
  21. Skriptsova, A.; Shevchenko, N.; Tarbeeva, D.; Zvyagintseva, T. Comparative study of polysaccharides from reproductive and sterile tissues of five brown seaweeds. Mar. Biotechnol. 2011, 14, 304–311. [Google Scholar] [CrossRef] [PubMed]
  22. Øverland, M.; Mydland, L.T.; Skrede, A. Marine macroalgae as sources of protein and bioactive compounds in feed for monogastric animals. J. Sci. Food Agric. 2019, 99, 13–24. [Google Scholar] [CrossRef] [PubMed] [Green Version]
  23. Bikker, P.; Stokvis, L.; van Krimpen, M.M.; van Wikselaar, P.G.; Cone, J.W. Evaluation of seaweeds from marine waters in northwestern europe for application in animal nutrition. Anim. Feed Sci. Technol. 2020, 263, 114460. [Google Scholar] [CrossRef]
  24. Makkar, H.P.S.; Tran, G.; Heuzé, V.; Giger-Reverdin, S.; Lessire, M.; Lebas, F.; Ankers, P. Seaweeds for livestock diets: A review. Anim. Feed Sci. Technol. 2016, 212, 1–17. [Google Scholar] [CrossRef]
  25. Jensen, R.B.; Brøkner, C.; Bach Knudsen, K.E.; Tauson, A.-H. A comparative study of the apparent total tract digestibility of carbohydrates in icelandic and danish warmblood horses fed two different haylages and a concentrate consisting of sugar beet pulp and black oats. Arch. Anim. Nutr. 2010, 64, 343–356. [Google Scholar] [CrossRef] [PubMed]
  26. Henchion, M.; Hayes, M.; Mullen, A.M.; Fenelon, M.; Tiwari, B. Future protein supply and demand: Strategies and factors influencing a sustainable equilibrium. Foods 2017, 6, 53. [Google Scholar] [CrossRef] [Green Version]
  27. Schiener, P.; Black, K.D.; Stanley, M.S.; Green, D.H. The seasonal variation in the chemical composition of the kelp species Laminaria digitata, Laminaria hyperborea, Saccharina latissima and Alaria esculenta. J. Appl. Phycol. 2015, 27, 363–373. [Google Scholar] [CrossRef]
  28. Fletcher, H.R.; Biller, P.; Ross, A.B.; Adams, J.M.M. The seasonal variation of fucoidan within three species of brown macroalgae. Algal Res. 2017, 22, 79–86. [Google Scholar] [CrossRef] [Green Version]
  29. Parys, S.; Kehraus, S.; Pete, R.; Küpper, F.C.; Glombitza, K.-W.; König, G.M. Seasonal variation of polyphenolics in Ascophyllum nodosum (phaeophyceae). Eur. J. Phycol. 2009, 44, 331–338. [Google Scholar] [CrossRef]
  30. Häder, D.-P.; Kumar, H.; Smith, R.; Worrest, R. Effects on aquatic ecosystems. J. Photochem. Photobiol. B Biol. 1998, 46, 53–68. [Google Scholar] [CrossRef] [Green Version]
  31. Henry, B.E.; Van Alstyne, K.L. Effects of uv radiation on growth and phlorotannins in Fucus gardneri (phaeophyceae) juveniles and embryos 1. J. Phycol. 2004, 40, 527–533. [Google Scholar] [CrossRef]
  32. Pavia, H.; Toth, G.B. Influence of light and nitrogen on the phlorotannin content of the brown seaweeds Ascophyllum nodosum and Fucus vesiculosus. Hydrobiologia 2000, 440, 299–305. [Google Scholar] [CrossRef]
  33. Barbosa, M.; Fernandes, F.; Pereira, D.M.; Azevedo, I.C.; Sousa-Pinto, I.; Andrade, P.B.; Valentão, P. Fatty acid patterns of the kelps Saccharina latissima, Saccorhiza polyschides and Laminaria ochroleuca: Influence of changing environmental conditions. Arab. J. Chem. 2020, 13, 45–58. [Google Scholar] [CrossRef]
  34. da Costa, E.; Domingues, P.; Melo, T.; Coelho, E.; Pereira, R.; Calado, R.; Abreu, M.H.; Domingues, M.R. Lipidomic signatures reveal seasonal shifts on the relative abundance of high-valued lipids from the brown algae Fucus vesiculosus. Mar. Drugs 2019, 17, 335. [Google Scholar] [CrossRef] [Green Version]
  35. Schmid, M.; Guihéneuf, F.; Stengel, D.B. Fatty acid contents and profiles of 16 macroalgae collected from the irish coast at two seasons. J. Appl. Phycol. 2014, 26, 451–463. [Google Scholar] [CrossRef]
  36. Susanto, E.; Fahmi, A.S.; Abe, M.; Hosokawa, M.; Miyashita, K. Lipids, fatty acids, and fucoxanthin content from temperate and tropical brown seaweeds. Aquat. Procedia 2016, 7, 66–75. [Google Scholar] [CrossRef]
  37. Dawczynski, C.; Schubert, R.; Jahreis, G. Amino acids, fatty acids, and dietary fibre in edible seaweed products. Food Chem. 2007, 103, 891–899. [Google Scholar] [CrossRef]
  38. Colombo, M.L.; Rise, P.; Giavarini, F.; De Angelis, L.; Galli, C.; Bolis, C. Marine macroalgae as sources of polyunsaturated fatty acids. Plant Foods Hum. Nutr. 2006, 61, 64–69. [Google Scholar] [CrossRef] [PubMed]
  39. Blouin, N.; Calder, B.L.; Perkins, B.; Brawley, S.H. Sensory and fatty acid analyses of two Atlantic species of porphyra (rhodophyta). J. Appl. Phycol. 2006, 18, 79. [Google Scholar] [CrossRef]
  40. Drenjančević, I.; Kralik, G.; Kralik, Z.; Mihalj, M.; Stupin, A.; Novak, S.; Grčević, M. The effect of dietary intake of omega-3 polyunsaturated fatty acids on cardiovascular health: Revealing potentials of functional food. In Superfood and Functional Food-The Development of Superfoods and Their Roles as Medicine; Intech: Long Beach, CA, USA, 2017; pp. 207–232. [Google Scholar]
  41. für die Nährstoffzufuhr, A.R. Referenzwerte für Die Nährstoffzufuhr; Spektrum Akademischer: Heidelberg, Germany, 2000. [Google Scholar]
  42. Erkkilä, A.T.; Lehto, S.; Pyörälä, K.; Uusitupa, M.I. N−3 fatty acids and 5-y risks of death and cardiovascular disease events in patients with coronary artery disease. Am. J. Clin. Nutr. 2003, 78, 65–71. [Google Scholar] [CrossRef] [Green Version]
  43. Hu, F.B.; Willett, W.C. Optimal diets for prevention of coronary heart disease. JAMA 2002, 288, 2569–2578. [Google Scholar] [CrossRef]
  44. Nestel, P.; Shige, H.; Pomeroy, S.; Cehun, M.; Abbey, M.; Raederstorff, D. The n−3 fatty acids eicosapentaenoic acid and docosahexaenoic acid increase systemic arterial compliance in humans. Am. J. Clin. Nutr. 2002, 76, 326–330. [Google Scholar] [CrossRef] [Green Version]
  45. Bell, M.V.; Tocher, D.R. Biosynthesis of polyunsaturated fatty acids in aquatic ecosystems: General pathways and new directions. In Lipids in Aquatic Ecosystems; Springer: New York City, NY, USA, 2009; pp. 211–236. [Google Scholar]
  46. Gladyshev, M.; Arts, M.; Sushchik, N.i. Preliminary estimates of the export of omega-3 highly unsaturated fatty acids (epa+ dha) from aquatic to terrestrial ecosystems. In Lipids in Aquatic Ecosystems; Springer: New York City, NY, USA, 2009; pp. 179–210. [Google Scholar]
  47. Khaled, A.; Hessein, A.; Abdel-Halim, A.M.; Morsy, F.M. Distribution of heavy metals in seaweeds collected along marsa-matrouh beaches, egyptian mediterranean sea. Egypt. J. Aquat. Res. 2014, 40, 363–371. [Google Scholar] [CrossRef] [Green Version]
  48. Mæhre, H.K.; Malde, M.K.; Eilertsen, K.-E.; Elvevoll, E.O. Characterization of protein, lipid and mineral contents in common norwegian seaweeds and evaluation of their potential as food and feed. J. Sci. Food Agric. 2014, 94, 3281–3290. [Google Scholar] [CrossRef]
  49. Gall, E.A.; Küpper, F.C.; Kloareg, B. A survey of iodine content in laminaria digitata. Bot. Mar. 2004, 47, 30–37. [Google Scholar] [CrossRef]
  50. Küpper, F.C.; Carpenter, L.J.; McFiggans, G.B.; Palmer, C.J.; Waite, T.J.; Boneberg, E.-M.; Woitsch, S.; Weiller, M.; Abela, R.; Grolimund, D. Iodide accumulation provides kelp with an inorganic antioxidant impacting atmospheric chemistry. Proc. Natl. Acad. Sci. USA 2008, 105, 6954–6958. [Google Scholar] [CrossRef] [PubMed] [Green Version]
  51. Almela, C.; Algora, S.; Benito, V.; Clemente, M.J.; Devesa, V.; Suner, M.A.; Velez, D.; Montoro, R. Heavy metal, total arsenic, and inorganic arsenic contents of algae food products. J. Agric. Food Chem. 2002, 50, 918–923. [Google Scholar] [CrossRef] [PubMed]
  52. Directive 2002/32/EC of the European Parliament and of the Council of 7 May 2002 on Undesirable Substances in Animal Feed—Council Statement; European Union: Brussels, Belgium, 2002.
  53. Hanaoka, K.i.; Yosida, K.; Tamano, M.; Kuroiwa, T.; Kaise, T.; Maeda, S. Arsenic in the prepared edible brown alga hijiki, Hizikia fusiforme. Appl. Organomet. Chem. 2001, 15, 561–565. [Google Scholar] [CrossRef]
  54. Ichikawa, S.; Nozawa, S.; Hanaoka, K.i.; Kaise, T. Ingestion and excretion of arsenic compounds present in edible brown algae, Hijikia fusiforme, by mice. Food Chem. Toxicol. 2010, 48, 465–469. [Google Scholar] [CrossRef] [PubMed]
  55. Horwitz, W. Official Methods of Analysis of AOAC International. Volume I, Agricultural Chemicals, Contaminants, Drugs/Edited by William Horwitz; AOAC International: Gaithersburg, MD, USA, 2010. [Google Scholar]
  56. Biancarosa, I.; Espe, M.; Bruckner, C.; Heesch, S.; Liland, N.; Waagbø, R.; Torstensen, B.; Lock, E. Amino acid composition, protein content, and nitrogen-to-protein conversion factors of 21 seaweed species from norwegian waters. J. Appl. Phycol. 2017, 29, 1001–1009. [Google Scholar] [CrossRef]
  57. Brummer, Y.; Cui, S.W. Understanding carbohydrate analysis. Food Carbohydr. Chem. Phys. Prop. Appl. 2005, 1–38. [Google Scholar] [CrossRef]
  58. Van Soest, P.v.; Robertson, J.; Lewis, B. Methods for dietary fiber, neutral detergent fiber, and nonstarch polysaccharides in relation to animal nutrition. J. Dairy Sci. 1991, 74, 3583–3597. [Google Scholar] [CrossRef]
  59. Garcia-Vaquero, M.; O’Doherty, J.V.; Tiwari, B.K.; Sweeney, T.; Rajauria, G. Enhancing the extraction of polysaccharides and antioxidants from macroalgae using sequential hydrothermal-assisted extraction followed by ultrasound and thermal technologies. Mar. Drugs 2019, 17, 457. [Google Scholar] [CrossRef] [Green Version]
  60. Ganesan, P.; Kumar, C.S.; Bhaskar, N. Antioxidant properties of methanol extract and its solvent fractions obtained from selected indian red seaweeds. Bioresour. Technol. 2008, 99, 2717–2723. [Google Scholar] [CrossRef]
  61. Ainsworth, E.A.; Gillespie, K.M. Estimation of total phenolic content and other oxidation substrates in plant tissues using folin–ciocalteu reagent. Nat. Protoc. 2007, 2, 875–877. [Google Scholar] [CrossRef] [PubMed]
  62. Bolanos de la Torre, A.A.S.; Henderson, T.; Nigam, P.S.; Owusu-Apenten, R.K. A universally calibrated microplate ferric reducing antioxidant power (frap) assay for foods and applications to manuka honey. Food Chem. 2015, 174, 119–123. [Google Scholar] [CrossRef] [PubMed]
  63. Nicklisch, S.C.; Waite, J.H. Optimized dpph assay in a detergent-based buffer system for measuring antioxidant activity of proteins. MethodsX 2014, 1, 233–238. [Google Scholar] [CrossRef] [PubMed]
  64. Garcia-Vaquero, M.; Rajauria, G.; Tiwari, B.; Sweeney, T.; O’Doherty, J. Extraction and yield optimisation of fucose, glucans and associated antioxidant activities from laminaria digitata by applying response surface methodology to high intensity ultrasound-assisted extraction. Mar. Drugs 2018, 16, 257. [Google Scholar] [CrossRef] [PubMed] [Green Version]
  65. Brunton, N.P.; Mason, C.; Collins, M.J. Rapid microwave assisted preparation of fatty acid methyl esters for the analysis of fatty acid profiles in foods. J. Anal. Chem. 2015, 70, 1218–1224. [Google Scholar] [CrossRef]
  66. López-Alonso, M.; Miranda, M.; Benedito, J.L.; Pereira, V.; García-Vaquero, M. Essential and toxic trace element concentrations in different commercial veal cuts in spain. Meat Sci. 2016, 121, 47–52. [Google Scholar] [CrossRef] [PubMed] [Green Version]
  67. EN. EN 15111:2007. Foodstuffs–Determination of Trace Elements–Determination of Iodine by icp-ms (Inductively Coupled Plasma Mass Spectrometry). 2007, pp. 1–12. Available online: https://0-doi-org.brum.beds.ac.uk/10.3403/30153589 (accessed on 9 March 2021).
  68. Available online: https://www.met.ie/climate/available-data/monthly-data (accessed on 13 February 2018).
  69. Available online: http://www.r-project.org (accessed on 11 February 2021).
  70. Friendly, M. Corrgrams: Exploratory displays for correlation matrices. Am. Stat. 2002, 56, 316–324. [Google Scholar] [CrossRef]
Figure 1. Correlation matrices of the main composition and antioxidant parameters analysed in (A) L. digitata, (B) L. hyperborea and (C) A. nodosum. The positive correlations are indicated in blue, while the negative correlations are indicated in red. The size of each square and depth of each colour indicate the strength of the correlations (0–1). Abbreviations in the figure are as follows: NDF (neutral detergent fibre), ADF (acid detergent fibre), P (protein), EE (ether extract), F (fucoidan), TSS (total soluble sugars), TG (total glucans), TPC (total phenolic content) and antioxidant properties (DPPH and ferric reducing antioxidant power (FRAP)). The statistical significance of the correlations is indicated in the figure as * p < 0.05, ** p < 0.01, *** p < 0.001.
Marinedrugs 19 00204 g001
Figure 2. Phytochemical composition (TG, fucoidan and TPC) of L. digitata (LD), L. hyperborea (LH) and A. nodosum (AN) collected each season during the years 2016 (white bars) and 2017 (grey bars). Results are expressed as average ± standard deviation of the mean. Different letters indicate statistical differences (p < 0.05) in the phytochemical contents of each macroalgae between different seasons within the same year 2016 (regular letters) or 2017 (bold letters). The differences in phytochemical composition within the same season between the years 2016 and 2017 are indicated as follows: * p < 0.05, ** p < 0.01 and *** p < 0.001.
Marinedrugs 19 00204 g002
Figure 3. Antioxidant properties (DPPH and FRAP) of L. digitata (LD), L. hyperborea (LH) and A. nodosum (AN) collected each season during the years 2016 (white bars) and 2017 (grey bars). Results are expressed as average ± standard deviation of the mean. Different letters indicate statistical differences (p < 0.05) in the antioxidant activities of each macroalgae between different seasons within the same year 2016 (regular letters) or 2017 (bold letters). The differences in antioxidant activity within the same season between the years 2016 and 2017 are indicated as follows: * p < 0.05, ** p < 0.01 and *** p < 0.001.
Marinedrugs 19 00204 g003
Figure 4. Principal component analysis scatter plot representing the scores for the climatological data (temperature, solar radiation and evaporation) in macroalgae (LD (L. digitata, red colour), LH (L. hyperborea, purple colour) and AN (A. nodosum, green colour)) and their proximate composition, phytochemical and antioxidant properties. Abbreviations in the figure are as follows: TSS (total soluble sugars), NDF (neutral detergent fibre), ADF (acid detergent fibre), F (fucoidan), TG (total glucans) and TPC (total phenolic content).
Marinedrugs 19 00204 g004
Figure 5. Principal component analysis scatter plot representing the scores for the fatty acid composition of macroalgae LD (L. digitata, red colour), LH (L. hyperborea, purple colour) and AN (A. nodosum, green colour). Abbreviations in the figure are as follows: SFA (saturated fatty acids), MUFA (monounsaturated fatty acids), PUFA (polyunsaturated fatty acids), ω3 (omega 3 fatty acids) and ω6 (omega 6 fatty acids).
Marinedrugs 19 00204 g005
Table 1. Proximate composition of Laminaria digitata, Laminaria hyperborea and Ascophyllum nodosum collected each season during the years 2016 and 2017.
Proximate Composition *Macroalgae sp.Year 2016Year 2017
WinterSpringSummer AutumnWinterSpringSummer Autumn
DML. digitata91.39 ± 0.01 Bc90.42 ± 0.01 Bd91.88 ± 0.04 Bb94.44 ± 0.05 Ba93.98 ± 0.00 Ac92.83 ± 0.04 Ad94.13 ± 0.01 Ab95.93 ± 0.01 Aa
Ash34.84 ± 0.08 Aa32.55 ± 0.05 Bc19.92 ± 0.02 Ad34.28 ± 0.01 Ab32.42 ± 0.03 Bb36.00 ± 0.03 Aa18.96 ± 0.01 Bd21.82 ± 0.00 Bc
GE11.03 ± 0.03 Bc11.13 ± 0.00 Ab13.82 ± 0.01 Aa11.11 ± 0.01 Bbc11.52 ± 0.01 Ac10.78 ± 0.03 Bd13.78 ± 0.01 Aa13.56 ± 0.00 Ab
EE0.26 ± 0.05 Ab0.51 ± 0.00 Aab0.87 ± 0.02 Aa0.66 ± 0.19 Aab0.38 ± 0.03 Ac0.03 ± 0.00 Bd0.74 ± 0.01 Bb1.12 ± 0.05 Aa
NDF54.41 ± 0.40 Ab64.01 ± 0.55 Aa46.35 ± 0.55 Ac55.57 ± 0.87 Ab27.01 ± 1.37 Bc39.23 ± 0.32 Bb44.98 ± 0.55 Aa42.15 ± 0.01 Bab
ADF16.06 ± 0.02 Bc23.79 ± 0.14 Aa22.28 ± 0.28 Ab15.57 ± 0.12 Bc20.65 ± 0.26 Ab24.69 ± 0.58 Aa10.75 ± 0.04 Bc23.25 ± 0.93 Aab
Protein11.12 ± 0.76 Aa9.15 ± 0.00 Aa3.63 ± 0.04 Ab5.54 ± 0.03 Ab9.98 ± 0.09 Aa6.92 ± 0.02 Bb2.88 ± 0.06 Bd4.01 ± 0.04 Bc
TSS11.88 ± 0.13 Ac12.41 ± 0.00 Ab21.03 ± 0.11 Ba10.88 ± 0.06 Bd11.75 ± 0.07 Ac11.19 ± 0.01 Bc26.94 ± 0.05 Aa20.39 ± 0.56 Ab
DML. hyperborea90.83 ± 0.00 Bd 92.84 ± 0.03 Bc94.28 ± 0.02 Ab95.17 ± 0.02 Ba95.81 ± 0.04 Aa95.01 ± 0.00 Ab94.19 ± 0.00 Ac95.75 ± 0.02 Aa
Ash30.01 ± 0.03 Ab35.64 ± 0.04 Aa18.36 ± 0.02 Bd22.34 ± 0.32 Ac30.33 ± 0.34 Ab32.79 ± 0.04 Ba20.82 ± 0.02 Ac18.91 ± 0.16 Bd
GE12.77 ± 0.04 Ac12.00 ± 0.01 Ad14.60 ± 0.02 Aa13.91 ± 0.05 Bb11.25 ± 0.11 Bc12.28 ± 0.12 Ab14.44 ± 0.01 Aa14.68 ± 0.01 Aa
EE0.76 ± 0.07 Aa0.75 ± 0.10 Aa0.65 ± 0.12 Aa0.80 ± 0.01 Aa0.60 ± 0.01 Aab0.56 ± 0.02 Aab0.34 ± 0.07 Ab0.69 ± 0.06 Aa
NDF51.56 ± 0.77 Bb67.17 ± 0.66 Aa40.29 ± 0.95 Ac40.21 ± 0.05 Bc64.17 ± 0.71 Aa48.90 ± 0.21 Bb44.68 ± 0.24 Ac66.09 ± 1.20 Aa
ADF19.81 ± 1.04 Aa21.49 ± 0.42 Ba22.48 ± 0.15 Aa21.65 ± 0.08 Aa21.30 ± 0.46 Ab35.12 ± 0.53 Aa20.06 ± 0.67 Ab10.84 ± 0.00 Bc
Protein9.98 ± 0.01 Aa7.22 ± 0.01 Ab2.15 ± 0.13 Ad3.93 ± 0.06 Ac8.02 ± 0.04 Ba4.16 ± 0.04 Bb2.22 ± 0.27 Ac3.57 ± 0.00 Ab
TSS14.49 ± 0.11 Ac11.85 ± 0.03 Ad19.21 ± 0.09 Bb20.15 ± 0.21 Ba13.73 ± 0.07 Bc11.23 ± 0.03 Bd20.42 ± 0.06 Ab26.69 ± 0.05 Aa
DMA. nodosum90.38 ± 0.01 Bd92.73 ± 0.08 Ab91.02 ± 0.02 Bc93.94 ± 0.04 Ba95.30 ± 0.08 Aa91.89 ± 0.01 Ad92.88 ± 0.01 Ac94.69 ± 0.00 Ab
Ash23.31 ± 0.30 Aa20.04 ± 0.08 Ac17.91 ± 0.06 Bd21.87 ± 0.09 Ab23.98 ± 0.05 Aa19.97 ± 0.12 Ac19.76 ± 0.14 Ac21.28 ± 0.22 Ab
GE14.36 ± 0.02 Bc15.30 ± 0.06 Ab15.99 ± 0.05 Aa14.56 ± 0.02 Ac14.53 ± 0.03 Ab14.96 ± 0.02 Aa14.81 ± 0.04 Ba14.44 ± 0.13 Ab
EE3.33 ± 0.00 Ab2.54 ± 0.04 Ac3.82 ± 0.10 Aa2.73 ± 0.03 Ac3.17 ± 0.02 Aa3.49 ± 0.28 Aa3.50 ± 0.10 Aa2.20 ± 0.01 Bb
NDF53.47 ± 0.58 Aa56.10 ± 0.55 Aa52.67 ± 1.23 Aa53.44 ± 0.80 Aa49.50 ± 0.75 Ab56.43 ± 0.36 Aa46.64 ± 0.18 Ac41.11 ± 0.41 Bd
ADF21.95 ± 0.37 Ab30.35 ± 0.34 Aa12.15 ± 0.39 Bc29.76 ± 0.00 Aa16.37 ± 0.16 Bb16.05 ± 0.56 Bb16.26 ± 0.21 Ab20.04 ± 0.30 Ba
Protein6.14 ± 0.01 Aa5.22 ± 0.09 Ab2.68 ± 0.00 Ad3.52 ± 0.01 Ac4.03 ± 0.05 Bb3.60 ± 0.02 Bc2.25 ± 0.06 Ad4.44 ± 0.11 Aa
TSS13.66 ± 0.08 Ab14.27 ± 0.07 Aa13.34 ± 0.03 Ab11.63 ± 0.06 Bc12.43 ± 0.02 Bc13.02 ± 0.15 Bb12.33 ± 0.11 Ac14.63 ± 0.01 Aa
* Dry matter (DM, %), ash (%), gross energy (GE, mJ/kg DW macroalgae), ether extract (EE, g/100 g DW macroalgae), neutral detergent fibre (NDF, g/100 g DW macroalgae), acid detergent fibre (ADF, g/100 g DW macroalgae), protein (g/100 g DW macroalgae) and total soluble sugars (TSS, g/100 g DW macroalgae). Results are expressed as average ± standard deviation of the mean. Different letters indicate statistical differences (p < 0.05) in the proximate composition of each macroalgae between different seasons within the same year (lower case letters) or differences within the same season between the years 2016 and 2017 (upper case letters).
Publisher’s Note: MDPI stays neutral with regard to jurisdictional claims in published maps and institutional affiliations.

