Article

Seasonal Dynamics of Microcystis spp. and Their Toxigenicity as Assessed by qPCR in a Temperate Reservoir

1
CIIMAR/CIMAR, Marine and Environmental Research Centre, Porto University, Rua dos Bragas, 289, Porto 4050-123, Portugal
2
Department of Biology, Faculty of Sciences, Porto University, Rua do Campo Alegre, Porto 4069-007, Portugal
3
CISA/Research Centre in Environment and Health, School Health Technology of Oporto, Polytechnic Institute of Porto, Rua de Valente Perfeito, 322, Gaia 440-330, Portugal
*
Author to whom correspondence should be addressed.
Mar. Drugs 2011, 9(10), 1715-1730; https://0-doi-org.brum.beds.ac.uk/10.3390/md9101715
Submission received: 26 August 2011 / Revised: 15 September 2011 / Accepted: 26 September 2011 / Published: 29 September 2011
(This article belongs to the Special Issue Algal Toxins)

Abstract

:
Blooms of toxic cyanobacteria are becoming increasingly frequent, mainly due to water quality degradation. This work applied qPCR as a tool for early warning of microcystin(MC)-producer cyanobacteria and risk assessment of water supplies. Specific marker genes for cyanobacteria, Microcystis and MC-producing Microcystis, were quantified to determine the genotypic composition of the natural Microcystis population. Correlations between limnological parameters, pH, water temperature, dissolved oxygen and conductivity and MC concentrations as well as Microcystis abundance were assessed. A negative significant correlation was observed between toxic (with mcy genes) to non-toxic (without mcy genes) genotypes ratio and the overall Microcystis density. The highest proportions of toxic Microcystis genotypes were found 4–6 weeks before and 8–10 weeks after the peak of the bloom, with the lowest being observed at its peak. These results suggest positive selection of non-toxic genotypes under favorable environmental growth conditions. Significant positive correlations could be found between quantity of toxic genotypes and MC concentration, suggesting that the method applied can be useful to predict potential MC toxicity risk. No significant correlation was found between the limnological parameters measured and MC concentrations or toxic genotypes proportions indicating that other abiotic and biotic factors should be governing MC production and toxic genotypes dynamics. The qPCR method here applied is useful to rapidly estimate the potential toxicity of environmental samples and so, it may contribute to the more efficient management of water use in eutrophic systems.

1. Introduction

Blooms of toxic cyanobacteria are a growing problem in freshwater ecosystems due to water quality degradation caused by eutrophication [1,2]. Toxic blooms pose significant health risks to water users and may prevent its recreational use [3]. Previous research has shown that more than 50% of freshwater blooms produce toxins, with hepatotoxic blooms being more common than neurotoxic ones [4]. Microcystins (MCs) are the most prevalent cyanobacterial hepatotoxins in freshwaters and are produced mainly by strains of Anabaena, Microcystis and Planktothrix [46]. In Portugal, the occurrence of cyanotoxins is well documented, with MCs being the most prevalent [7,8], and MC-LR, MC-RR, and MC-YR as the dominant variants. Microcystis aeruginosa, M. wesenbergii, Anabaena flos-aquae, A. scheremetievi and Aphanizomenon flos-aquae, are the dominant toxic cyanobacteria species in most of the water bodies [79].
MCs are a chemically diverse group of cyanotoxins and their toxicity is due to inhibition of serine-threonine protein phosphatases 1 and 2A [10], causing both acute and chronic effects in mammals [3,4]. MC acute intoxications lead to hepatocyte necrosis and liver hemorrhage, with severe cases resulting in death [11]. Some evidence of tumor-promoting activity of MC due to long term exposure was also reported [1214]. MCs are produced non-ribosomally via an integrated multifunctional enzyme complex, consisting of both peptide synthetase and polyketide synthase modules coded by the MC synthetase (mcy) gene cluster [1518].
The most common methods used for monitoring MC are high-performance liquid chromatography with photodiode array detector and enzyme-linked immunosorbent assays (ELISA) [19]. More recently, other high throughput analysis methods such as protein phosphatase inhibition assay (PPIA) and liquid chromatography–mass spectrometry (LC/MS) have become available for MC monitoring [20]. Microscopy is still a valuable first-line monitoring strategy; however, it does not differentiate toxic from nontoxic cyanobacteria, is subject to considerable counting error, and may result in misidentification when there are limited morphological differences [4]. Cyanobacteria known as potential MC-producers comprise both toxic (with the mcy genes) and nontoxic strains (without the mcy genes). The presence or absence of the mcy gene cluster has been used to distinguish the two types of strains [21,22]. In the recent years, quantitative molecular methods have been developed to study the succession of MC-producing genera and monitor toxic blooms formation. Detection and quantification by quantitative real-time PCR (qPCR) of MC-producing cyanobacteria is sensitive and rapid. Furthermore, quantification of MC-producing Microcystis genotypes has been proposed as a surrogate for MC-producing cells in natural populations [2327]. qPCR quantification of specific toxin-producer cyanobacteria can also be a valuable tool in developing genus-targeted restoration strategies [28].
MC concentration in water is mostly dependent on the density of the hepatotoxic cells [4]. Some strains may produce higher concentrations of MCs than others under the same laboratory conditions, while others can be more or less toxic depending on cultivating conditions [29]. In addition, the succession of cyanobacteria species and biomass is influenced by seasonal changes of several factors including nutrients, grazing, light and temperature, which affect the concentration of MC in the field [4,3032]. The effects of environmental factors on the abundance of MC-producing and non-toxic Microcystis genotypes have, however, been studied on a limited scale [24,3336].
In this work, qPCR was used to evaluate the seasonal dynamics of cyanobacteria populations, particularly Microcystis populations, in an aquatic ecosystem from North Portugal, known for the periodic dominance of toxin-producing cyanobacteria, including Microcystis aeruginosa [37]. We sampled in a single site where a water treatment plant is located and the results are valid only for this location. We applied a tool that may enable the early warning for MC-producing cyanobacteria presence and thus of potential toxic risk. This methodology will be valuable for water treatment plants management providing information on emerging toxic blooms so that adequate water treatments can be prepared ahead of time. qPCR was applied to quantify specific marker genes for cyanobacteria, Microcystis and MC-producing Microcystis, and to quantitatively determine the genotypic composition of the natural Microcystis population.

2. Results and Discussion

pH values ranged from 6.1 (October 1) to 8.8 (July 1), DO from 4.0 mg/L (October 28) to 10.5 mg/L (July 30), water temperature from 20.5 °C (October 28) to 27.0 °C (August 12) and conductivity from 60 μS/Cm (July 1) to 155 μS/Cm (October 28) (Table 1). pH and temperature followed approximately the same pattern both presenting a peak at August 12, and then declining in the following sampling dates. Conductivity presented approximately the same values until the end of August, increasing sharply in the last two sampling dates. This sharp increase refer to the two last samplings that were performed monthly, instead of the bimonthly periodicity of the rest, however, the values were always low. Dissolved oxygen values did not have a clear pattern throughout the sampling period.

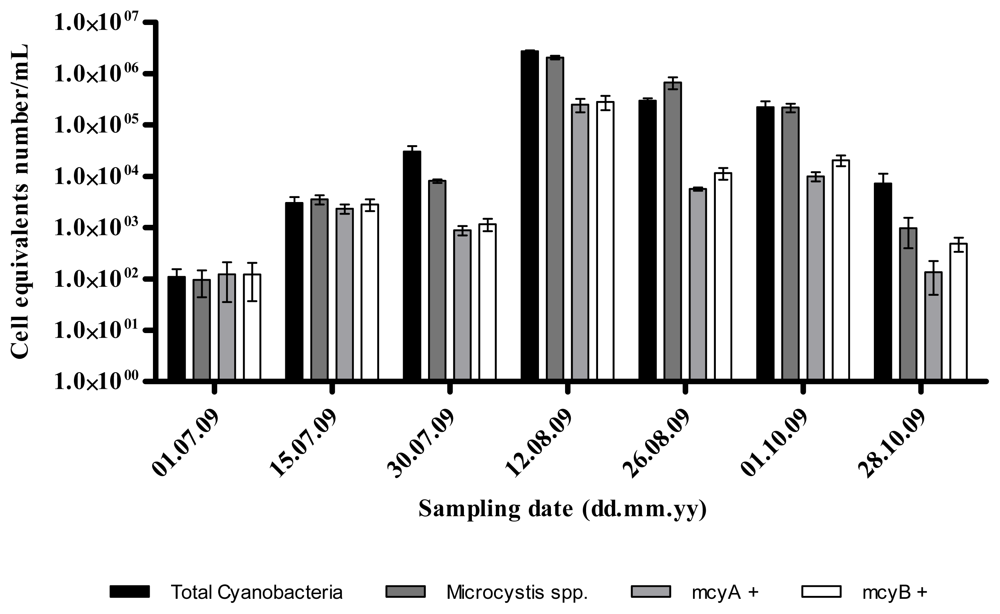
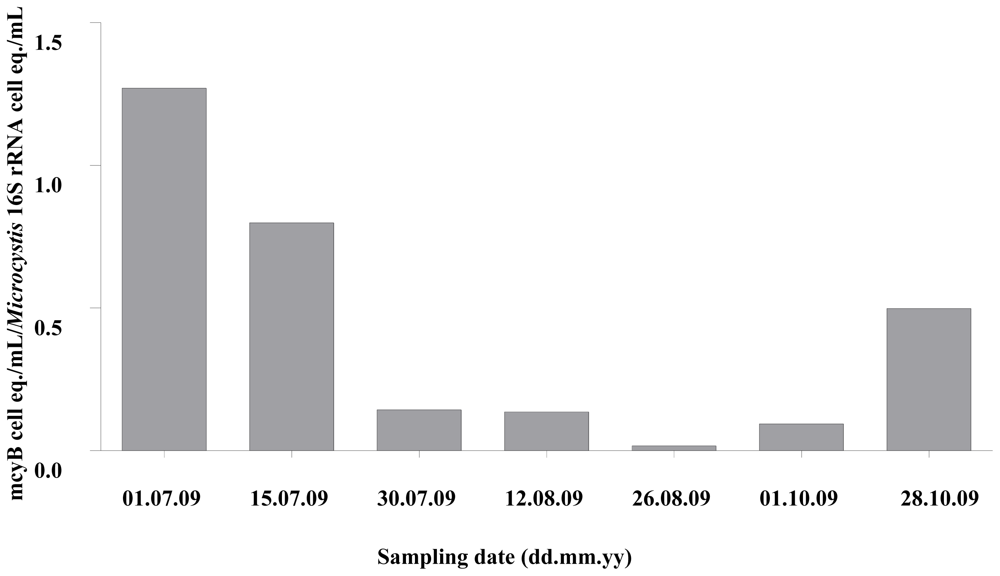
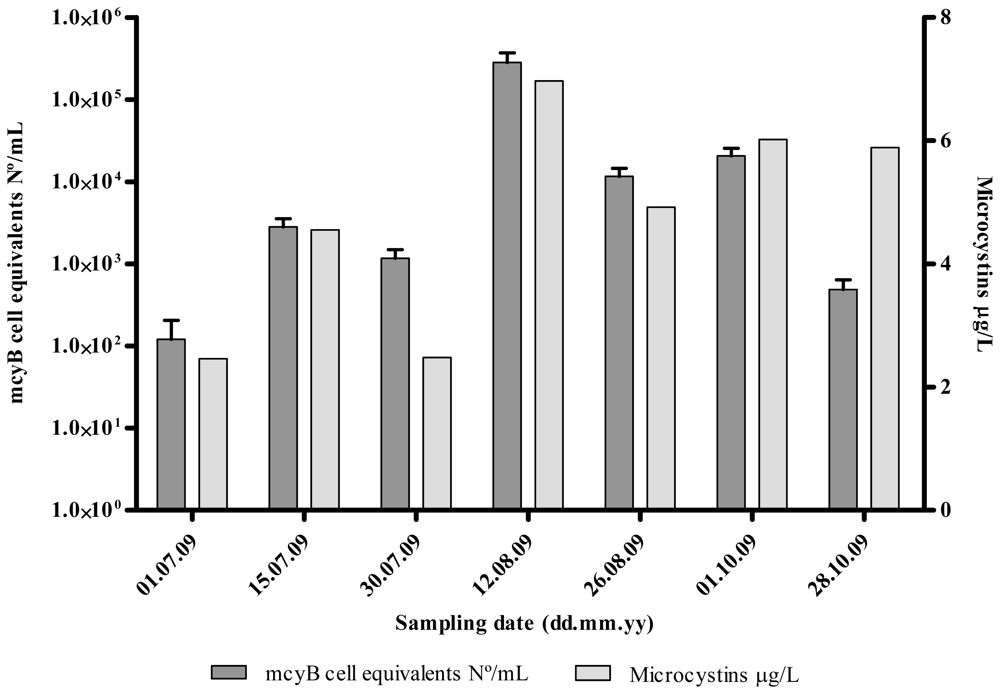
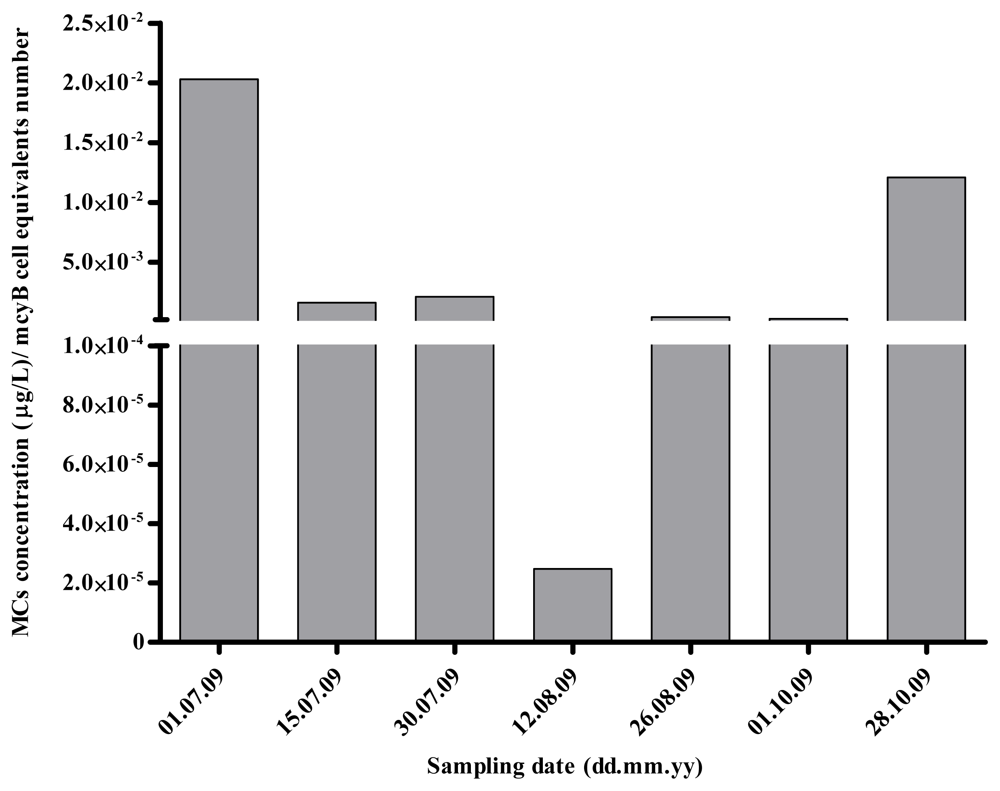
2.1. Quantitative Analysis of Microcystis spp. Community Composition by qPCR

Standard curves were established by conducting serial dilutions (1.2–1.2 × 10⁶), of cyanobacterial 16S rRNA, Microcystis 16S rRNA, mcyA and mcyB gene cell equivalents/mL of genomic DNA extracted from the M. aeruginosa M6 culture. For cyanobacterial 16S, Microcystis 16S, mcyA and mcyB, highly significant linear curves between the amount of starting DNA (in cell equivalent numbers) and the threshold cycle values (Ct) were obtained. The efficiencies and curve parameters obtained for the different standard curves are summarized in Table 2.
The melting temperature of the different qPCR products of the samples were similar to those obtained with the standard strain (Table 2), thus demonstrating the reliability of the real-time PCR amplification. The variation of the number of both cyanobacteria and Microcystis spp. followed the same pattern throughout the sampling period progressively increasing after the first sampling date (9.5 ± 5.2 × 101 and 1.1 ± 0.5 × 10² cell equivalents/mL, respectively), reaching the maximum values at August 12 (2.7 ± 0.1 × 10⁶ and 2.1 ± 0.2 × 10⁶ cell equivalents/mL, respectively), and then progressively declining until the last sampling date (7.2 ± 4.0 × 10³ and 9.7 ± 5.8 × 10² cell equivalents/mL, respectively) (Figure 1). Both the number of potentially MC-producing cyanobacteria and MC-producing Microcystis varied in a similar way throughout the entire sampling period, presenting its maximum value at August 12 (2.5 ± 0.7 × 10⁵ and 2.8 ± 0.9 × 10⁵ cell equivalents/mL, respectively), and the minimum at July 1 (1.2 ± 0.8 × 10² and 1.2 ± 0.8 × 10² cell equivalents/mL, respectively).
The data obtained by qPCR, were also used to evaluate the dynamics of the proportion of toxic genotypes inside the Microcystis spp. population (expressed by the ratio between the number of mcyB genes in cell equivalents/mL and the number of Microcystis 16S rRNA genes in cell equivalents/mL) throughout the sampling period (Figure 2).
Within the Microcystis spp. population, the percentage of potentially MC-producing genotypes varied from around 2% to higher than 100% of the cells. The percentage of toxic genotype progressively and markedly decreased from the first sampling date, at which all the cells of Microcystis seem to present the mcyB gene, and reaching a minimum of around 2% at August 26. Then, the proportion of toxic genotype increased again, constituting around 50% of the entire population in the last sampling date. This dynamics matched the one observed for the mcyA cell equivalents number (data not shown).
MC quantified by ELISA varied between 2.46 (July 1) and 6.97 μg MC-LR eq/L (August 12). MC values followed approximately the same pattern of the variation as toxic Microcystis genotypes (mcyB) densities, except in the last sampling date (Figure 3). The highest value of MC was determined for the same date as the highest number of mcyB cell equivalents (August 12). Curiously, at this date, we can also observe the lowest MC quota per toxic genotype (mcyB) (Figure 4). The MC concentrations were always above the WHO guideline values for drinking water (1 μg MC-LR/L) for all the sampling dates.
MC concentration had a significant positive correlation (r = 0.79; P < 0.05) with the abundance of Microcystis mcyB and of cyanobacterial mcyA cell equivalents (Table 3).
Furthermore, strong positive correlations were found between the abundance of Microcystis mcyB cell equivalents and the abundance of cyanobacterial mcyA cell equivalents (r = 1.00; P < 0.001), and between the abundances of Microcystis 16S rRNA cell equivalents and cyanobacterial 16S rRNA cell equivalents (r = 0.96; P < 0.05). The proportion of toxic genotypes in the Microcystis population correlates negatively, but not significantly, with MC concentration (r = −0.61). Moreover, the proportion of toxic genotypes showed a negative significant correlation with both Microcystis and cyanobacteria abundances (r = −0.89 and −0.86, respectively; P < 0.05). Concerning the influence of limnological parameters on the overall MC level, no significant correlations between MC concentrations and pH, DO, water temperature or conductivity were detected (Table 3).

2.2. Discussion

The qPCR technique is currently the only quantitative tool available to determine the proportion of potential toxin-producing genotypes in environmental water samples. Although some previous reports have showed a close relationship between the occurrence of certain toxic genotypes (containing toxin genes) and MC net production [38], and that it is possible to infer MC concentrations from Microcystis cell numbers [39], correlations between MC levels and toxic genotypes numbers are often difficult to obtain [26,40]. The work presented here aimed to help clarify these contradictory observations. In this work, the proportion of toxic Microcystis genotypes varied between approximately 2% and around 100% of the entire Microcystis population. These values are above others previously reported between toxic and non-toxic Microcystis strains, such as 10% in Lake Kasumigaura (Japan) [41], 34% in Lake Kasumigaura [42], 16% in Lake Grand-Lieu (France) [43], 45% in Lake Wannsee and Lake Pehlitzsee (Germany) [44], ranging from 1 to 38% [39]. More recently, proportions of mcyB genotypes ranging from 6% to 93% of the M. aeruginosa population were reported in Grangent reservoir, France, with the highest proportions appearing at the beginning and after the decline of the bloom [45]. Our results also revealed an inverse relationship between density and frequency of toxic genotype and the highest Microcystis cell densities, with the former being detected 4–6 weeks before and 8–10 weeks after the latter (Figures 1 and 2). Indeed, significant negative correlations were obtained between mcyB genotype proportions and cyanobacteria and Microcystis cell densities (Table 4). Nevertheless, the highest toxic genotypes numbers and MC concentration values were, in fact, found when the highest Microcystis cell densities were observed. McyB is specific to Microcystis producing MC and mcyA is present in all cyanobacteria genera that produce MC. By using these two markers it can be determined whether the MC is mainly produced by Microcystis, which was the case, or whether other cyanobacteria are responsible for the toxin production.
Detection of MC-producing genotypes during non-bloom season (winter), has also been previously reported [26], however, no MC production could be detected. This raised the possibility that toxic cyanobacteria do not produce MC during times of low growth or low metabolism (during the winter), although mcy genotypes may be present [26,39]. In the present work, MCs were always detected, with the highest MC cell quotas being observed simultaneously with the lowest Microcystis numbers and vice versa (Figures 2 and 4). This may suggest that MC production may play an important role when conditions do not favor Microcystis growth. Previous data also showed a negative relationship between cyanobacterial biomass and average MC cell content during the development of cyanobacterial blooms [45].
On the other hand, the observed decrease in toxic genotypes proportion as the bloom developed suggests that favorable environmental conditions for Microcystis growth lead to the selection of non-toxic genotypes. In fact, it was previously shown that, under environmental conditions favorable for cyanobacterial growth, the fitness of non-MC-producing strains is greater than that of MC-producing ones [34,47]. Similarly, a negative correlation between cell abundance and the proportion of potentially MC-producing genotypes was observed during a P. agardhii bloom [48].
Considering the influence of environmental factors on MC levels and on Microcystis population dynamics, in the present work, no significant correlations were found between MC concentration and any of the limnological parameters measured. The regulation of the internal dynamics of MC-producers populations is predictable to be affected by a large array of environment conditions [49]. For instance, the influence of nitrate concentrations on the relative dynamics of mcy genotypes was shown within the M. aeruginosa communities of Lake Mikata [24]. Furthermore, it was already suggested that grazers play an important role on this dynamics. Due to selective grazing, depending on whether the cell is producing toxin or not, grazers may affect the total biomass of cyanobacteria and Microcystis, as well as the relative abundance of Microcystis genotypes [26,32]. Other authors suggested that cyanophages may be involved in the interaction between microcystin-producing and non-microcystin-producing M. aeruginosa populations [49].
The results now obtained confirm that one of the most known problems of qPCR methodologies is the difficulty in converting the gene quantities to quantities of cells that carry these target genes. This can distort the enumeration of cyanobacterial cells in natural samples by qPCR. In fact, as described previously in other studies [26], some samples showed an abundance of potentially toxic Microcystis higher than the total Microcystis abundance and in other cases, the abundance of Microcystis cells appeared >100% of the total abundance of cyanobacteria. These results may be due to the use of the 16S rRNA gene as a target for quantification of both cyanobacteria and Microcystis due to the variable copy number of 16S rDNA operons or their sequence heterogeneity in cyanobacterial cells in natural populations [26,47]. Moreover, some bias can be introduced by many mechanical factors, such as sample handling, DNA extraction, qPCR standards preparation and PCR conditions [50].
The present work showed, nevertheless, that qPCR can be used to easily and quickly estimate the toxicity of environmental samples. In fact, toxic genotypes densities correlate well with MC concentrations, suggesting that they could be used to predict MC toxicity risk. This work also showed that as blooms develop, the proportion of toxic genotypes decreases, and that at low densities most of the Microcystis genotypes are toxic. These observations indicate that conditions favoring Microcystis growth lead to the selection of non-toxic genotypes and, on the other hand, that even at low cell densities there is high potential MC threat. This raises greater concern on the presence of potential MC-producing cyanobacteria in temperate water reservoirs, particularly considering long term exposure effects, making it imperative to develop more efficient monitoring methods.

3. Experimental Section

3.1. Sample Collection and Analysis of Limnological Parameters

Torrão reservoir is located on the Tâmega River, in the north of Portugal, being used for water consumption and recreational purposes. This reservoir presents periodic dominance of toxin-producing cyanobacteria, including Microcystis aeruginosa and Aphanizomenon flos-aquae [37]. Surface water samples (0–0.3 m depth) were collected from Marco station (Torrão reservoir), where a water treatment plant is located, every two weeks between July 2009 and September 2009 and then monthly until the end of October. The collected samples were immediately transported cooled to the laboratory. For DNA extraction, volumes of 40 to 2000 mL of well mixed water samples were filtered through GFC filters (Whatman, Kent, UK) in triplicate, and the filters stored at −80 °C. For ELISA analysis, 15 mL of water samples were collected and stored at −20 °C. Limnological parameters were measured in situ namely, dissolved oxygen (DO), measured with the oxygen meter Oxi 320 (WTW, Weilheim, Germany), temperature, conductivity and pH, measured with the MultiLine P3 pH/LF (WTW, Weilheim, Germany) instrument.

3.2. DNA Extraction and qPCR Reactions

DNA was extracted from the biomass retained in the frozen GFC filters, using a commercially available Kit, PureLink Genomic DNA Mini Kit (Invitrogen, Carlsbad, CA), following the manufacturer’s instructions for gram negative bacteria. The extracted DNA was suspended in 100 μL of elution buffer (pH 8.0) (Invitrogen, Carlsbad, CA) and stored at −20 °C. The reproducibility of the extraction method was evaluated by spectrophotometric quantification of the DNA obtained from the filter replicates. The qPCR reactions were performed using Bio-Rad cycler IQ5 (Bio-Rad, Hercules, CA) with 5 μL of DNA from the standard or sample, 0.4 μM of each primer (0.2 μM for MCYA-CD1F/CD1R and MCYB-2959F/3278R primer pairs) and 1X IQ SYBR Green Supermix (Bio-Rad, Hercules, CA), in a final reaction volume of 25 μL. The CYA 359F/781R primer pair [51] was used to amplify a 422-bp fragment of the 16S rRNA gene common to all cyanobacteria. The Micr 184F/431R [52] was used to amplify a 248-bp fragment of the 16S rRNA gene, specifically from Microcystis cells (Table 4).
The mcyA CD1F/mcyA CD1R primer pair [22] was designed to amplify a 297-bp fragment of the mcyA gene from MC-synthesizing Microcystis and Planktothrix strains and was previously proved suitable to detect MC-producing cells from different genera, including Anabaena, Microcystis and Planktothrix (Table 1). The mcyB 2959F/mcyB 3278R primer pair [46] was used to amplify a 320-bp fragment of the mcyB gene, which is present in MC-producing strains of Microcystis. The thermal cycle conditions are summarized in Table 5. The generation of products was monitored after each extension step by measuring the fluorescence intensity of the double-stranded DNA-binding SYBR Green I dye. All the samples were amplified at least in triplicate. Cycle threshold (Ct) was determined by the fit point method using Bio-Rad IQ5 software (ver. 2.0.148.60623) (Bio-Rad, Hercules, CA). The number of cyanobacterial cells was determined from the Ct obtained according to the regression equations of the external standards. To determine the melting temperatures of the amplification products of the standards and samples, fluorescent melting curve analysis was performed after the PCR by gradually increasing the temperature from 55 °C to 95 °C at a rate of 0.5 °C/cycle. Fluorescence intensity data was collected continuously, and converted to melting peaks using Bio-Rad software. The presence or absence of the amplified product was determined by a melting curve analysis and by subjecting the reaction products to 1.5% (w/v) agarose gel electrophoresis. Ethidium bromide stained bands were visualized on a UV transilluminator (Cleaver Scientific, Warwickshire, UK) and digitally recorded using MicroDOC gel documentation system (Cleaver Scientific, Warwickshire, UK).

3.3. Standard Curves Development

A cyanobacterial strain of M. aeruginosa (M6) (reference strain) was used for the production of a standard curve. This was based on predetermined cell densities and was established by relating the known DNA concentrations (in cell equivalents) to the Ct values of the diluted samples. 1.5 mL of a suspension containing 2.37 × 10⁷ cells of M. aeruginosa (M6) suspension (determined by a direct microscopic count) were collected by centrifugation, and seven dilutions of template DNA ranging from 1:10 to 1:106 (equivalent to 1.2 × 10⁶ cells and 1.2 cells, respectively) were prepared from the DNA extract to serve as external standards of the real-time PCR.

3.4. Quantification of MCs by ELISA

The Envirogard® MC Plate Kit (Strategic Diagnostic Inc., Newark, NJ) was used to quantify MC in the water samples collected. This assay uses antibodies against MC-LR, the most common MC, binding also with other MC variants such as MC-RR, MC-YR, or with NOD [53]. Fifteen milliliters of whole water samples were frozen and thawed, and then sonicated on ice for 5 min at 50 W to facilitate cell lysis. The resulting solutions were then applied to the above mentioned ELISA kit following the manufacturer’s instructions. The absorbance was measured using a Synergy™ HT Multi-Detection Microplate Reader (BioTek® Instruments Inc., Winooski, VT) using BioTek’s Gen5™ Data Analysis Software. Values are presented in μg MC-LR equivalents/mL. Previous work has shown that ELISA is efficient for the quantitation of total MC in this reservoir, taken into account the MC chemical profile [54].

3.5. Statistical Analysis

The nonparametric Spearman Rank Correlation coefficient was calculated as a measure of correlation between all possible pairs of variables. Statistical analysis was performed using the GraphPad Prism version 5.01 for Windows (GraphPad Software, San Diego, CA) statistical analysis software. Correlations showing P value <0.05 were considered significant in this analysis.

4. Conclusions

A negative significant correlation was observed between toxic (with mcy genes) and non-toxic (without mcy genes) genotypes ratio and the overall Microcystis density. The results suggest positive selection of non-toxic genotypes under favorable environmental growth conditions. Significant positive correlations could be found between quantity of toxic genotypes and MC concentration, suggesting that the method applied could be useful to predict potential MC toxicity risk. No significant correlation was found between the limnological parameters measured and MC concentrations or toxic genotypes proportions indicating that other abiotic and biotic factors should be governing MC production and toxic genotypes dynamics. The qPCR method here applied is useful to rapidly estimate the potential toxicity of environmental samples and therefore, it may contribute to the more efficient management of water use in eutrophic systems.

Acknowledgments

We acknowledge the Portuguese Governmental Foundation for Science and Technology (FCT) that financed through PTDC/AMB/67075/2006 and PTDC/AAC-CLI/116122/2009 this work and the grant to António Martins.
  • Samples Availability: Available from the authors.

References

  1. Carpenter, SR; Caraco, NF; Correll, DL; Howarth, RW; Sharpley, AN; Smith, VH. Nonpoint pollution of surface waters with phosphorus and nitrogen. Ecol. Appl 1998, 8, 559–568. [Google Scholar]
  2. Smith, VH; Tilman, GD; Nekola, JC. Eutrophication: Impacts of excess nutrient inputs on freshwater, marine, and terrestrial ecosystems. Environ. Poll 1999, 100, 179–196. [Google Scholar]
  3. Kuiper-Goodman, T; Falconer, I; Fitzgerald, J. Human Health Aspects. In Toxic Cyanobacteria in Water: A Guide to Their Public Health Consequences, Monitoring and Management; Chorus, I, Bartram, J, Eds.; E & FN Spon: London, UK, 1999; pp. 113–153. [Google Scholar]
  4. Sivonen, K; Jones, G. Cyanobacterial Toxins. In Toxic Cyanobacteria in Water: A Guide to Their Public Health Consequences, Monitoring and Management; Chorus, I, Bartram, J, Eds.; E & FN Spoon: London, UK, 1999; pp. 55–71. [Google Scholar]
  5. Carmichael, WW; Falconer, IR. Diseases Related to Freshwater Blue Green Algal Toxins, and Control Measures. In Algal Toxins in Seafood and Drinking Water; Falconer, IR, Ed.; Academic Press: New York, NY, USA, 1993; pp. 187–209. [Google Scholar]
  6. Carmichael, WW. The toxins of cyanobacteria. Sci. Am 1994, 270, 78–86. [Google Scholar]
  7. Vasconcelos, VM. Cyanobacterial toxins in Portugal: Effects on aquatic animals and risk for human health. Braz. J. Med. Biol. Res 1999, 32, 249–254. [Google Scholar]
  8. Vasconcelos, VM; Sivonen, K; Evans, WR; Carmichael, WW; Namikoshi, M. Isolation and characterization of microcystins (heptapeptide hepatotoxins) from Portuguese strains of Microcystis aeruginosa Kutz. emed Elekin. Arch. Hydrobiol 1995, 134, 295–305. [Google Scholar]
  9. Vasconcelos, VM; Sivonen, K; Evans, WR; Carmichael, WW; Namikoshi, M. Microcystin (heptapeptide hepatotoxins) diversity in cyanobacterial blooms collected in Portuguese fresh waters. Water Res 1996, 30, 2377–2384. [Google Scholar]
  10. MacKintosh, C; Beattie, KA; Klumpp, S; Cohen, P; Codd, GA. Cyanobacterial MC-LR is a potent and specific inhibitor of protein phosphatases 1 and 2A from both mammals and higher plants. FEBS Lett 1990, 264, 187–192. [Google Scholar]
  11. Bhattacharya, R; Sugendran, K; Dangi, RS; Rao, PV. Toxicity evaluation of freshwater cyanobacterium Microcystis aeruginosa PCC 7806: II. Nephrotoxicity in rats. Biomed. Environ. Sci 1997, 10, 93–101. [Google Scholar]
  12. Falconer, IR. Tumor promotion and liver injury caused by oral consumption of cyanobacteria. Environ. Toxicol. Water Qual 1991, 6, 177–184. [Google Scholar]
  13. Ito, E; Kondo, F; Terao, K; Harada, K-I. Neoplastic nodular formation in mouse liver induced by repeated intraperitoneal injections of microcystin-LR. Toxicon 1997, 35, 1453–1457. [Google Scholar]
  14. Dietrich, D; Hoeger, S. Guidance values for microcystins in water and cyanobacterial supplement products (blue-green algal supplements): A reasonable or misguided approach? Toxicol. Appl. Pharmacol 2005, 203, 273–289. [Google Scholar]
  15. Dittmann, E; Neilan, BA; Erhard, M; Von Döhren, H; Börner, T. Insertional mutagenesis of a peptide synthetase gene that is responsible for hepatotoxin production in the cyanobacterium Microcystis aeruginosa PCC 7806. Mol. Microbiol 1997, 26, 779–787. [Google Scholar]
  16. Neilan, BA; Dittmann, E; Rouhiainen, L; Bass, RA; Schaub, V; Sivonen, K; Börner, T. Nonribosomal peptide synthesis and toxigenicity of cyanobacteria. J. Bacteriol 1999, 181, 4089–4097. [Google Scholar]
  17. Nishizawa, T; Asayama, M; Fujii, K; Harada, KI; Shirai, M. Genetic analysis of the peptide synthetase genes for a cyclic heptapeptide microcystin in Microcystis spp. J Biochem 1999, 126, 520–529. [Google Scholar]
  18. Tillett, D; Dittmann, E; Erhard, M; von Döhren, H; Börner, T; Neilan, BA. Structural organization of microcystin biosynthesis in Microcystis aeruginosa PCC7806: An integrated peptide-polyketide synthetase system. Chem. Biol 2000, 7, 753–764. [Google Scholar]
  19. Harada, K. Laboratory Analysis of Cyanotoxins. In Toxic Cyanobacteria in Water: A Guide to Their Public Health Consequences, Monitoring, and Management; Chorus, I, Bartram, J, Eds.; E & FN Spon: London, UK, 1999; pp. 369–405. [Google Scholar]
  20. Sivonen, K. Emerging high throughput analyses of cyanobacterial toxins and toxic cyanobacteria. Adv. Exp. Med. Biol 2008, 619, 539–557. [Google Scholar]
  21. Nishizawa, T; Ueda, A; Asayama, M; Fujii, K; Harada, K-I; Ochi, K; Shirai, M. Polyketide synthase gene coupled to the peptide synthetase module involved in the biosynthesis of the cyclic heptapeptide microcystin. J. Biochem 2000, 127, 779–789. [Google Scholar]
  22. Hisbergues, M; Christiansen, G; Rouhiainen, L; Sivonen, K; Börner, T. PCR-based identification of microcystin-producing genotypes of different cyanobacterial genera. Arch. Microbiol 2003, 180, 402–410. [Google Scholar]
  23. Rantala, A; Rajaniemi-Wacklin, P; Lyra, C; Lepisto, L; Rintala, J; Mankiewicz-Boczek, J; Sivonen, K. Detection of microcystin-producing cyanobacteria in finnish lakes with genus-specific microcystin synthetase gene E (mcyE) PCR and associations with environmental factors. Appl. Environ. Microbiol 2006, 72, 6101–6110. [Google Scholar]
  24. Yoshida, M; Yoshida, T; Takashima, Y; Hosoda, N; Hiroishi, S. Dynamics of microcystin-producing and non-microcystin-producing Microcystis populations is correlated with nitrate concentration in a Japanese lake. FEMS Microbiol. Lett 2007, 266, 49–53. [Google Scholar]
  25. Ha, JH; Hidaka, T; Tsuno, H. Quantification of toxic Microcystis and evaluation of its dominance ratio in blooms using real-time PCR. Environ. Sci. Technol 2008, 43, 812–818. [Google Scholar]
  26. Rinta-Kanto, JM; Konopko, EA; DeBruyn, JM; Bourbonniere, RA; Boyer, GL; Wilhelm, SW. Lake Erie Microcystis: Relationship between microcystin production, dynamics of genotypes and environmental parameters in a large lake. Harmful Algae 2009, 8, 665–673. [Google Scholar]
  27. Sabart, M; Pobel, D; Briand, E; Combourieu, B; Salencon, MJ; Humbert, JF; Latour, D. Spatiotemporal variations in microcystin concentrations and in the proportions of microcystin-producing cells in several Microcystis aeruginosa populations. Appl. Environ. Microbiol 2010, 76, 4750–4759. [Google Scholar]
  28. Vaitomaa, J; Rantala, A; Halinen, K; Rouhiainen, L; Tallberg, P; Mokelke, L; Sivonen, K. Quantitative real-time pcr for determination of microcystin synthetase E copy numbers for Microcystis and Anabaena in lakes. Appl. Environ. Microbiol 2003, 69, 7289–7297. [Google Scholar]
  29. Kaebernick, M; Neilan, BA. Ecological and molecular investigations of cyanotoxin production. FEMS Microbiol. Ecol 2001, 35, 1–9. [Google Scholar]
  30. Chorus, I. Environmental Factors and MC Levels in Waterbodies. In Cyanotoxins: Occurrence, Causes, Consequences; Chorus, I, Ed.; Springer-Verlag: Berlin, Germany, 2001; pp. 159–177. [Google Scholar]
  31. Janse, I; Kardinaal, WEA; Agterveld, MK-V; Meima, M; Visser, PM; Zwart, G. Contrasting microcystin production and cyanobacterial population dynamics in two Planktothrix-dominated freshwater lakes. Environ. Microbiol 2005, 7, 1514–1524. [Google Scholar]
  32. Gobler, CJ; Davis, TW; Coyne, KJ; Boyer, GL. Interactive influences of nutrient loading, zooplankton grazing, and microcystin synthetase gene expression on cyanobacterial bloom dynamics in a eutrophic New York lake. Harmful Algae 2007, 6, 119–133. [Google Scholar]
  33. Davis, TW; Berry, DL; Boyer, GL; Gobler, CJ. The effects of temperature and nutrients on the growth and dynamics of toxic and nontoxic strains of Microcystis during cyanobacterial blooms. Harmful Algae 2009, 8, 715–725. [Google Scholar]
  34. Kardinaal, WEA; Janse, I; Kamst-Van Agterveld, M; Meima, M; Snoek, J; Mur, LR; Huisman, J; Zwart, G; Visser, PM. Microcystis genotype succession in relation to microcystin concentrations in freshwater lakes. Aquat. Microb. Ecol 2007, 48, 1–12. [Google Scholar]
  35. Kardinaal, WEA; Tonk, L; Janse, I; Hol, S; Slot, P; Huisman, J; Visser, PM. Competition for light between toxic and nontoxic strains of the harmful cyanobacterium Microcystis. Appl. Environ. Microbiol 2007, 73, 2939–2946. [Google Scholar]
  36. Welker, M; Šejnohová, L; Némethová, D; von Döhren, H; Jarkovský, J; Maršálek, B. Seasonal shifts in chemotype composition of Microcystis sp. communities in the pelagial and sediment of a shallow reservoir. Limnol. Oceanogr 2007, 52, 609–691. [Google Scholar]
  37. Oliva Teles, L; Pereira, E; Saker, M; Vasconcelos, V. Virtual experimentation on cyanobacterial bloom dynamics and its application to a temperate reservoir (Torrão, Portugal). Lakes Reserv. Res. Manag 2008, 13, 135–143. [Google Scholar]
  38. Kurmayer, R; Christiansen, G; Chorus, I. The abundance of microcystin-producing genotypes correlates positively with colony size in Microcystis sp. and determines its microcystin net production in lake wannsee. Appl. Environ. Microbiol 2003, 69, 787–795. [Google Scholar]
  39. Kurmayer, R; Kutzenberger, T. Application of real-time PCR for quantification of microcystin genotypes in a population of the toxic cyanobacterium Microcystis sp. Appl. Environ. Microbiol 2003, 69, 6723–6730. [Google Scholar]
  40. Ye, W; Liu, X; Tan, J; Li, D; Yang, H. Diversity and dynamics of microcystin—Producing cyanobacteria in China’s third largest lake, Lake Taihu. Harmful Algae 2009, 8, 637–644. [Google Scholar]
  41. Ohtake, A; Shirai, M; Aida, T; Mori, N; Harada, KI; Matsuura, K; Suzuki, M; Nakano, M. Toxicity of Microcystis species isolated from natural blooms and purification of the toxin. Appl. Environ. Microbiol 1989, 55, 3202–3207. [Google Scholar]
  42. Shirai, M; Ohtake, A; Sano, T; Matsumoto, S; Sakamoto, T; Sato, A; Aida, T; Harada, KI; Shimada, T; Suzuki, M; et al. Toxicity and toxins of natural blooms and isolated strains of Microcystis spp. (cyanobacteria) and improved procedure for purification of cultures. Appl. Environ. Microbiol 1991, 57, 1241–1245. [Google Scholar]
  43. Vezie, C; Brient, L; Sivonen, K; Bertru, G; Lefeuvre, J-C; Salkinoja-Salonen, M. Variation of MC content of cyanobacterial bloom sand isolated strains in Lake Grand-Lieu (France). Microb. Ecol 1998, 35, 126–135. [Google Scholar]
  44. Rohrlack, T. Isolation and characterization of colony-forming Microcystis aeruginosa strains. In Cyanotoxins: Occurrences, Causes, Consequences; Chorus, I, Ed.; Springer Verlag: Berlin, Germany, 2001; pp. 152–158. [Google Scholar]
  45. Briand, E; Escoffier, N; Straub, C; Sabart, M; Quiblier, C; Humbert, J-F. Spatiotemporal changes in the genetic diversity of a bloom-forming Microcystis aeruginosa (cyanobacteria) population. ISME J 2009, 3, 419–429. [Google Scholar]
  46. Nonneman, D; Zimba, PV. A PCR-based test to assess the potential for microcystin occurrence in channel catfish production ponds. J. Phycol 2002, 38, 230–233. [Google Scholar]
  47. Briand, E; Gugger, M; Francois, J-C; Bernard, C; Humbert, J-F; Quiblier, C. Temporal variations in the dynamics of potentially microcystin-producing strains in a bloom-forming Planktothrix agardhii (cyanobacterium) population. Appl. Environ. Microbiol 2008, 74, 3839–3848. [Google Scholar]
  48. Kardinaal, WEA; Visser, PM. Dynamics of Cyanobacterial Toxins: Sources of Variability in Microcystin Concentrations. In Harmful Cyanobacteria; Huisman, J, Matthijs, HCP, Visser, PM, Eds.; Springer: Berlin, Germany, 2005; pp. 41–63. [Google Scholar]
  49. Yoshida, M; Yoshida, T; Kashima, A; Takashima, Y; Hosoda, N; Nagasaki, K; Hiroishi, S. Ecological dynamics of the toxic bloom-forming cyanobacterium Microcystis aeruginosa and its cyanophages in freshwater. Appl. Environ. Microbiol 2008, 74, 3269–3273. [Google Scholar]
  50. Crosby, LD; Criddle, CS. Understanding bias in microbial community analysis techniques due to rrn operon copy number heterogeneity. BioTechniques 2003, 34, 790–802. [Google Scholar]
  51. Nübel, U; Garcia-Pichel, F; Muyzer, G. PCR primers to amplify 16S rRNA genes from cyanobacteria. Appl. Environ. Microbiol 1997, 63, 3327–3332. [Google Scholar]
  52. Neilan, BA; Jacobs, D; Therese, DD; Blackall, LL; Hawkins, PR; Cox, PT; Goodman, AE. rRNA sequences and evolutionary relationships among toxic and nontoxic cyanobacteria of the genus Microcystis. Int. J. Syst. Bacteriol 1997, 47, 693–697. [Google Scholar]
  53. Chu, FS; Huang, X; Wei, RD. Enzyme-linked immunosorbent assay for microcystins in blue-green algal blooms. J. Assoc. Off. Anal. Chem 1990, 73, 451–456. [Google Scholar]
  54. Martins, J; Saker, M; Moreira, C; Welker, M; Fastner, J; Vasconcelos, V. Peptide diversity in strains of the cyanobacterium Microcystis aeruginosa isolated from Portuguese water supplies. Appl. Microbiol. Biotechnol 2009, 82, 951–961. [Google Scholar]
Figure 1. Variations in the numbers of Cyanobacteria 16S rRNA, Microcystis 16S rRNA, mcyA and mcyB genes, expressed as cell equivalents during the sampling period.
Marinedrugs 09 01715f1
Figure 2. Ratios obtained between number of mcyB and Microcystis 16S rRNA genes, expressed in cell equivalents, for each sampling date, along the sampling period.
Marinedrugs 09 01715f2
Figure 3. Comparison between the number of mcyB genes, expressed in cell equivalents/mL, and MCs concentration for each sampling date along the sampling period.
Marinedrugs 09 01715f3
Figure 4. Ratios obtained between MCs concentration values and number of mcyB and Microcystis 16S rRNA genes, expressed in cell equivalents number/mL, for each sampling date, along the sampling period.
Marinedrugs 09 01715f4aMarinedrugs 09 01715f4b
Table 1. Limnological data of Torrão reservoir during the study period.
Sampling date01.07.0915.07.0930.07.0912.08.0926.08.0901.10.0928.10.09
pH8.88.48.18.77.86.16.9
Dissolved oxygen (mg/L)-6.510.5-4.27.04.0
Temperature (°C)26.125.125.227.025.322.820.5
Conductivity (μS/Cm)6063656774118155
Table 2. Efficiencies and standard curve parameters obtained by real-time qPCR analysis for the cyanobacteria 16S rRNA, Microcystis 16S rRNA, mcyB and mcyA specific primer sets.
Target geneReference strainEfficiencySlopeY-interceptR2Melting temperature
Cyanobacteria 16S rRNAM. aeruginosa genomic DNA90.7−3.56837.2880.99186.5–87.0 °C
Microcystis 16S rRNAM. aeruginosa genomic DNA88.4−3.63634.1560.99987.5–88.0 °C
Cyanobacterial mcyAM. aeruginosa genomic DNA87.6−3.66035.0920.99882.0–82.5 °C
Microcystis mcyBM. aeruginosa genomic DNA88.3−3.63734.8621.00081.5–82.0 °C
Table 3. Spearman correlations (r) between limnological values and cyanobacteria estimation by qPCR (in bold significant correlations p < 0.005).
Spearman correlation valuespHDissolved oxygen (mg/L)Temp. (°C)Cond. (μS/Cm)MC-LR (μg eq/L)Cyanob. 16S rRNAMicrocystis 16S rRNACyanob. mcyAMicrocystis mcyB
pH
Dissolved oxygen (mg/L)−0.31
Temperature (°C)0.79−0.26
Conductivity (μS/Cm)0.860.14−0.57
Microcystins μg/L−0.430.20−0.110.71
Cyanobacterial 16S rRNA (cell number equivalent/mL)−0.290.490.290.500.75
Microcystis16S rRNA (cell number equivalent/mL)−0.180.600.360.320.680.96
Cyanobacterial mcyA (cell number equivalent/mL)−0.210.600.210.320.790.860.93
Microcystis mcyB (cell number equivalent/mL)−0.210.600.210.320.790.860.931.00
Table 4. Primers used for qPCR quantifications.
TargetPrimerSequence (5′–3′)Size (bp)Reference
Cyanobacteria 16S rRNACya 359F
Cya 781R
GGGGAATYTTCCGCAATGGG
GACTACWGGGGTATCTAATCCCWTT
446[16]
Microcystis 16S rRNAMicr 184F
Micr 431R
GCCGCRAGGTGAAAMCTAA
AATCCAAARACCTTCCTCCC
220[16]
mcyA All generamcyA CD1F
mcyA CD1R
AAAATTAAAAGCCGTATCAAA
AAAAGTGTTTTATTAGCGGCTCAT
297[22]
mcyB MicrocystismcyB 2959F
mcyB 3278R
TGGGAAGATGTTCTTCAGGTATCCAA
AGAGTGGAAACAATATGATAAGCTAC
350[46]
Table 5. PCR conditions applied with the primers used qPCR quantifications.
PCR protocolPrimer pair

Initial denaturationDenaturationAnnealingExtensionNumber of cycles
CYA 359F/781R5 min at 95 °C15 s at 95 °C15 s at 60 °C30 s at 72 °C50
Micr 184F/381R5 min at 95 °C15 s at 95 °C30 s at 52 °C30 s at 72 °C40
mcyA CD1F/CD1R5 min at 95 °C15 s at 95 °C30 s at 59 °C30 s at 72 °C40
mcyB 2959F/3278R5 min at 95 °C15 s at 95 °C30 s at 59 °C30 s at 72 °C40

