Simulation Models for Socioeconomic Inequalities in Health: A Systematic Review

Abstract
:1. Introduction
2. Experimental Section
2.1. Systematic Review
2.1.1. Eligibility Criteria
2.1.2. Information Sources and Search
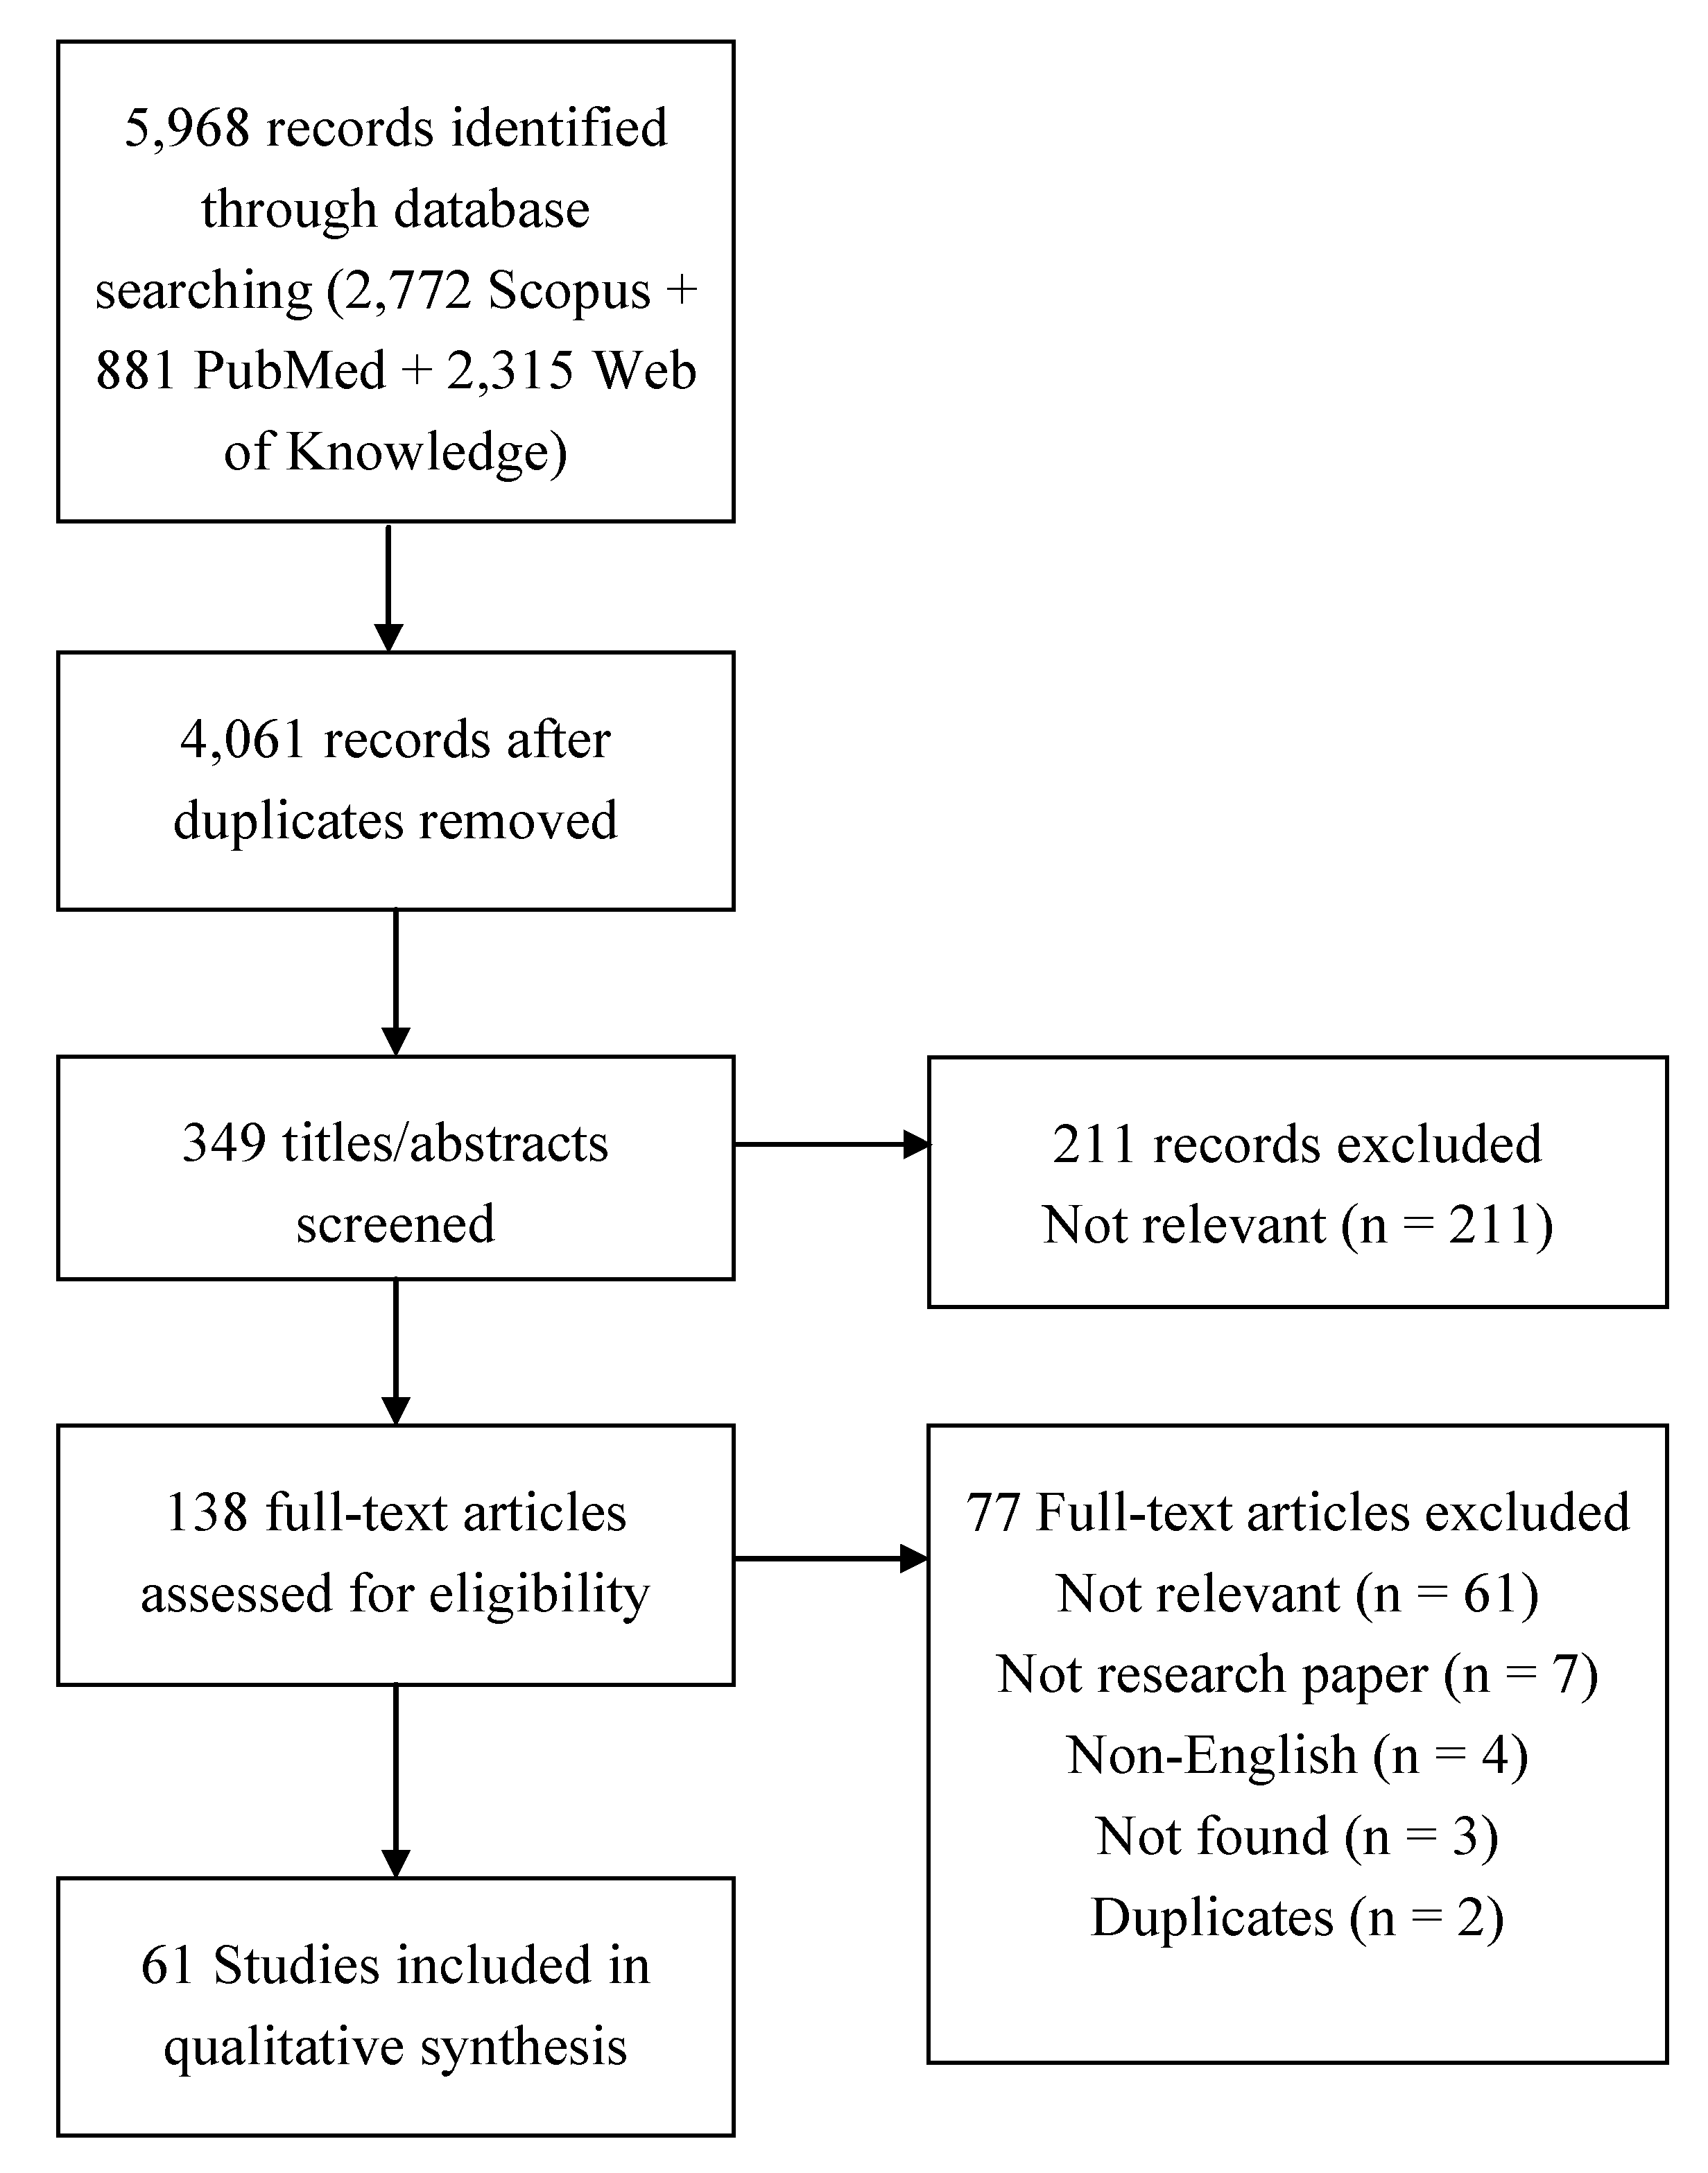
2.1.3. Study Selection
2.1.4. Data Collection Process and Data Items

| Individual-based | |
| Microsimulation | In these models, individuals are represented as passive micro-level entities. The experiment consists in modifying individuals’ attributes. Analyses are made using regression-based or econometric methods. |
| Agent-based | In agent-based models, individuals are represented as active (i.e., are able to adapt to the environment, interact with others and make autonomous decisions) micro-level entities. The experiment consists in modifying agents’ rules or the system structure. |
| Network | In network models, individuals are represented as micro-level entities interacting with each other. The experiment consists in modifying individuals’ relationships. |
| Population-based | |
| State-transition | State-transition models are developed with differential equations. The population is divided in subgroups through which individuals pass. These subgroups may be defined according to health states or by SES. This category includes system dynamics models with stocks, flows and feed-back loops, epidemic models (e.g., Susceptible/Infected/Recovered models), and Markov models. |
| Optimization | In this category, the basic components modeled are facilities or services. The optimal allocation of health care resources is estimated by maximizing or minimizing a function. |
| Risk assessment | In these models, the unequal distribution of a health risk of a simulated exposure is estimated. |
| Projection | Based on actual population data and rates, these models project future population demographics under several assumptions. |
| Game | These models study strategies in which the decision of an individual or group depends on the decision of the others. |
| Behavioral/stress | Behavioral: the model consists in a recursive system of equations. In this model, individuals maximize a lifetime utility function. Stress: individual’s health is determined by endowments, permanent shocks, and transitory shocks. |
| Diffusion | Temporal and spatial diffusion of an innovation are modeled as subsystems transitions from dynamic to steady states. |
2.2. Agent-Based Model (ABM)

3. Results
3.1. Review
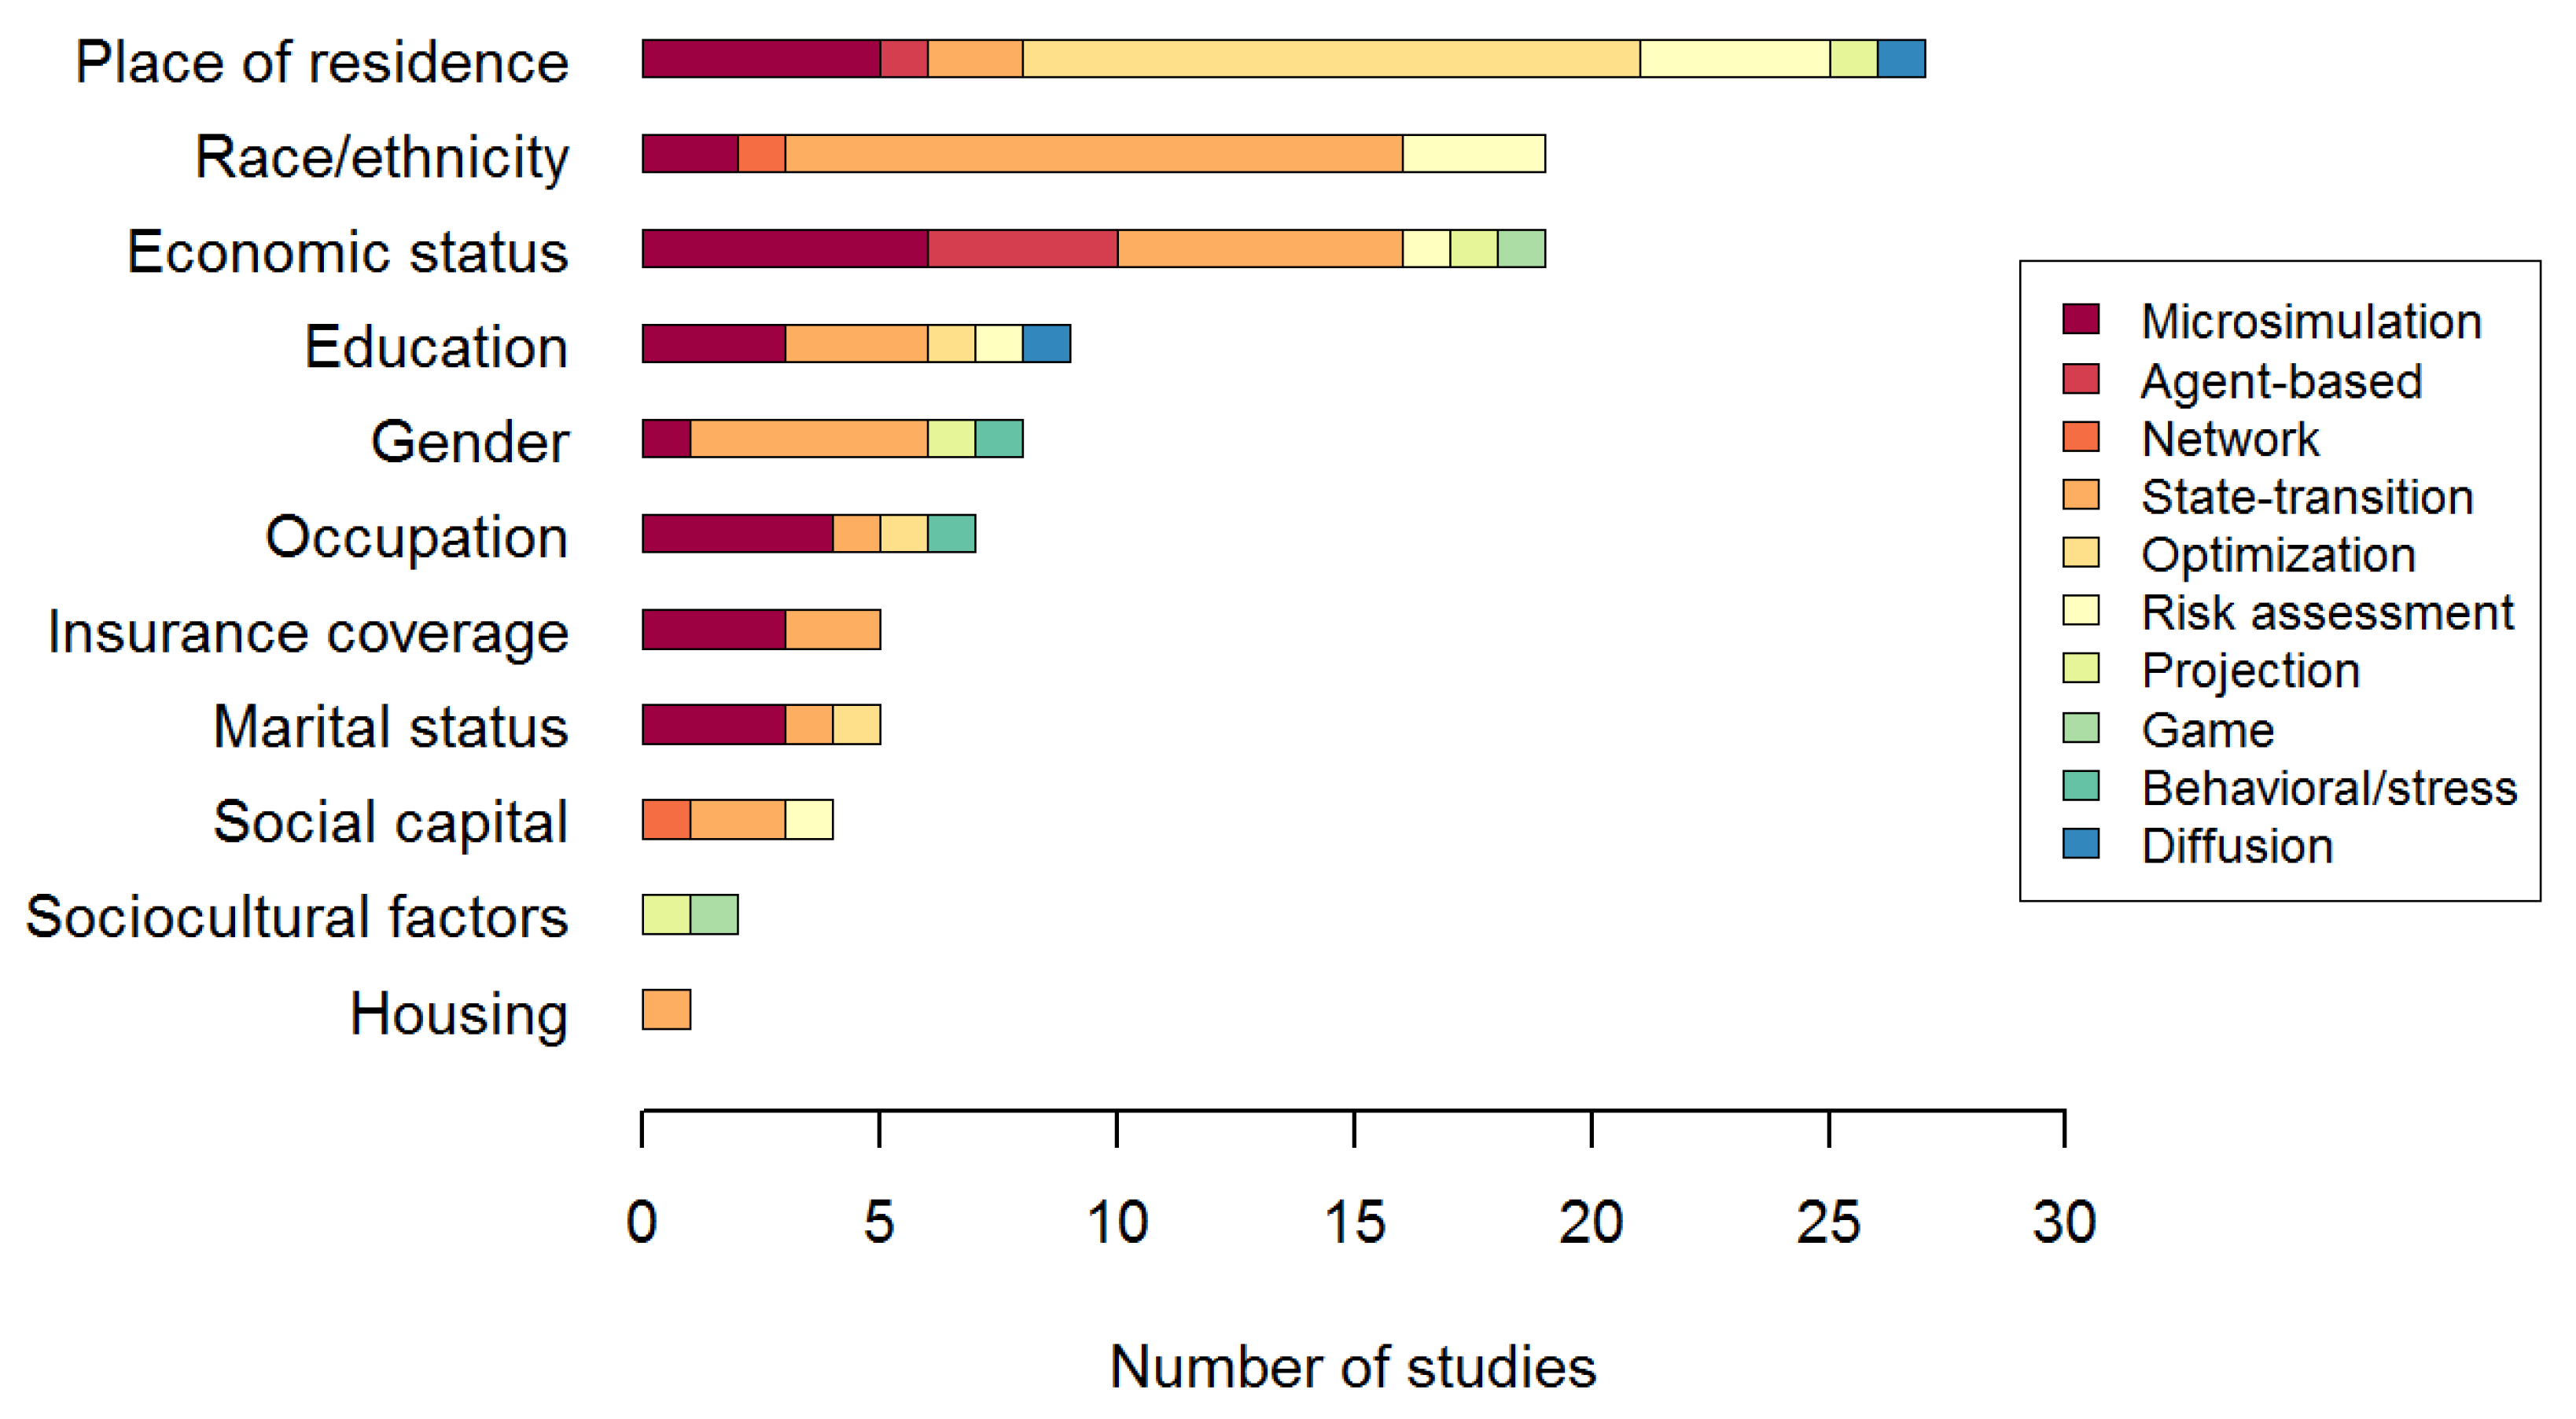
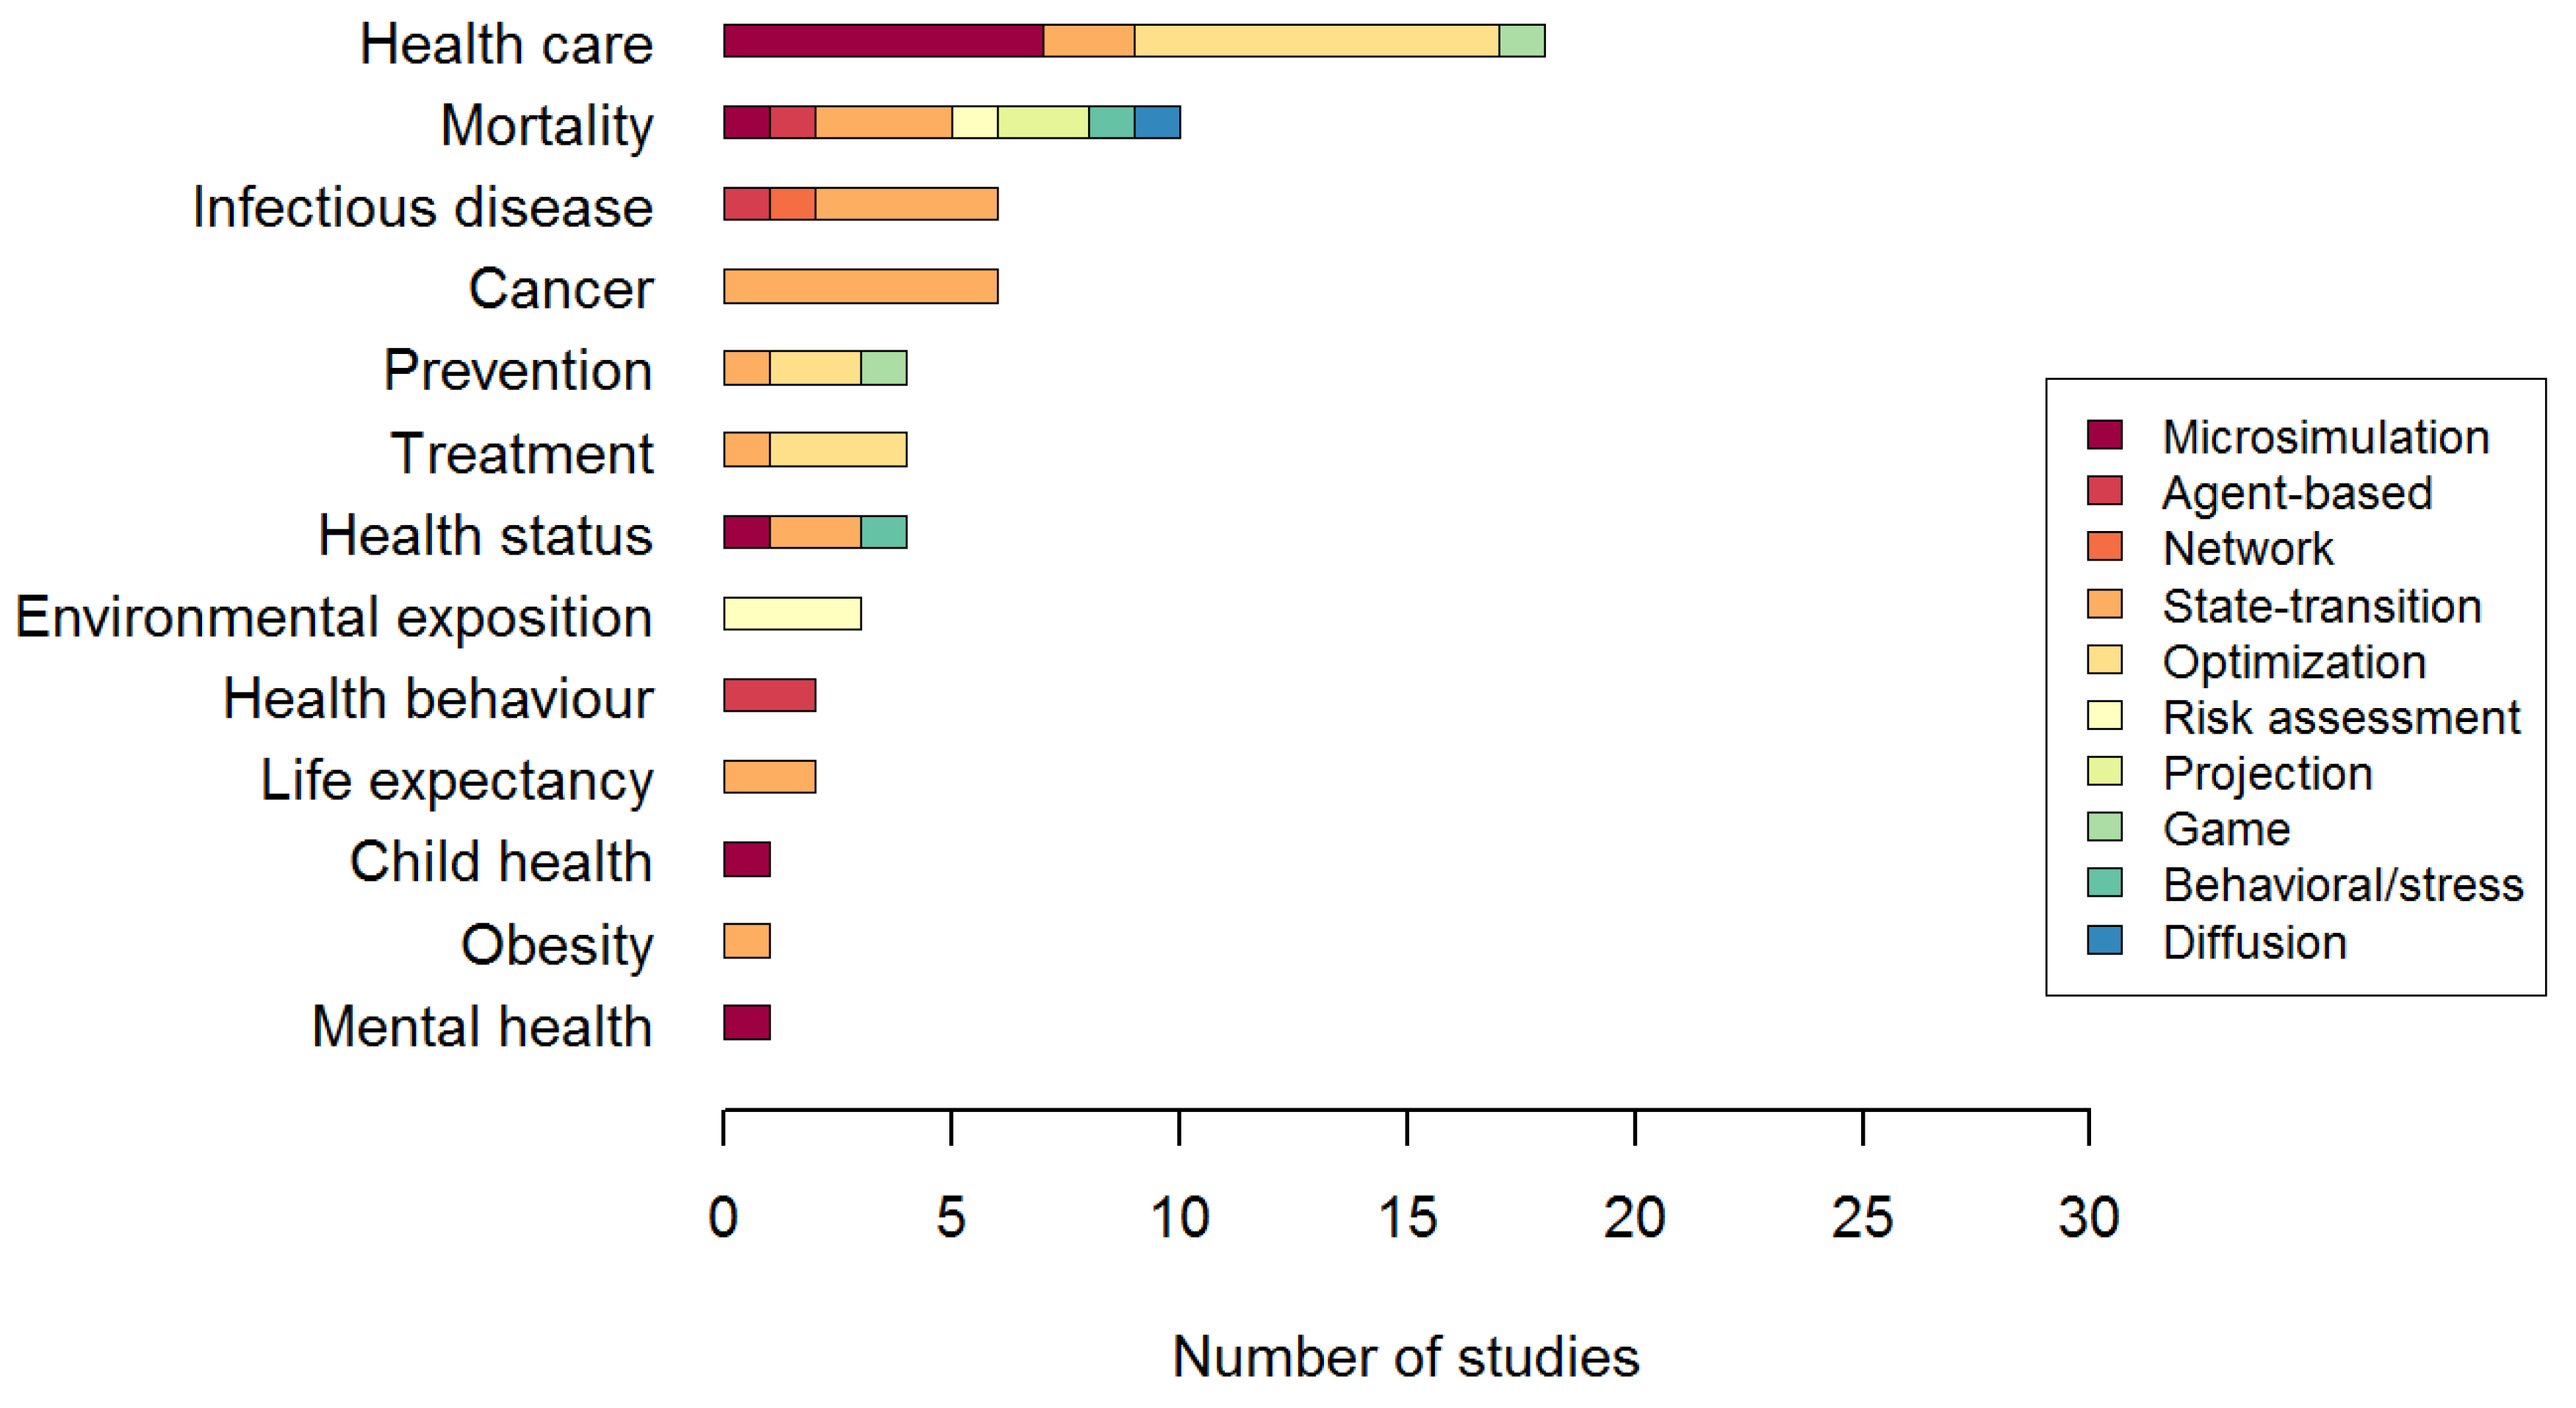
3.1.1. Description of Selected Studies

| Individual-based | Population-based | ||||||||||
|---|---|---|---|---|---|---|---|---|---|---|---|
| Microsimulation | Agent-based | Network | State.transition | Optimization | Risk assessment | Projection | Game | Behavioral | Diffusion | ||
| Total number of studies | 61 | 11 | 4 | 1 | 21 | 13 | 4 | 2 | 2 | 2 | 1 |
| Characteristics of the system modeled | |||||||||||
| 1. Multilevel | 59 | 10 | 4 | 1 | 20 | 13 | 4 | 2 | 2 | 2 | 1 |
| 2. Dynamic | 40 | 6 | 4 | 1 | 20 | 2 | 2 | 1 | 1 | 2 | 1 |
| 3. Stochastic | 34 | 6 | 4 | 1 | 13 | 4 | 3 | 0 | 1 | 2 | 0 |
| 4. Heterogeneous micro-level entities | 40 | 11 | 4 | 1 | 13 | 3 | 2 | 2 | 1 | 2 | 1 |
| interacting with each other | 6 | 0 | 2 | 1 | 2 | 0 | 0 | 0 | 1 | 0 | 0 |
| adapting to their environment | 10 | 1 | 3 | 0 | 3 | 1 | 0 | 0 | 1 | 1 | 0 |
| 5. Feed-back loop | 7 | 0 | 2 | 0 | 5 | 0 | 0 | 0 | 0 | 0 | 0 |
| 6. Spatial | 37 | 6 | 4 | 0 | 6 | 13 | 4 | 1 | 1 | 1 | 1 |
| Validation and utilization of the model | |||||||||||
| Validation on observational data | 14 | 2 | 1 | 0 | 6 | 4 | 1 | 0 | 0 | 0 | 0 |
| Development of a framework | 17 | 1 | 1 | 0 | 3 | 8 | 2 | 1 | 0 | 1 | 0 |
| Test of an intervention/scenario | 48 | 5 | 4 | 1 | 18 | 13 | 3 | 2 | 2 | 0 | 0 |


3.1.2. Characteristics of the System Modeled
3.1.3. Validation and Utilization of the Model
3.2. Agent-Based Illustrative Model


4. Discussion and Conclusions
| Situation of inequality | Most frequently reported characteristics of the system | Approach used |
|---|---|---|
| Unequal access to health care resources | Static, deterministic, spatial Interdependency of components’ decisions Passive heterogeneous individuals | Optimization Game Microsimulation |
| Unequal health behavior | Dynamic, stochastic, heterogeneous individuals adapting to their environment | Agent-based |
| Unequal transmission of a disease or unequal disease stages transitions | Dynamic, stochastic, passive (heterogeneous) individuals Heterogeneous individuals interacting with each other | State-transition (+ microsimulation) Network, agent-based |
| Unequal environmental exposition/risk | Static, passive (heterogeneous) individuals, spatial Dynamic, spatial diffusion | Risk assessment (+ microsimulation) Diffusion |
| Unequal health status or mortality | Static, deterministic, passive heterogeneous individuals Dynamic, stochastic | Microsimulation, projection Behavioral |
Acknowledgments
Conflicts of Interest
References
- Evans, T.; Brown, H. Road traffic crashes: Operationalizing equity in the context of health sector reform. Inj. Control Saf. Promot. 2003, 10, 11–12. [Google Scholar] [CrossRef]
- Commission on Social Determinants of Health W.H.O, Closing the Gap in a Generation. Health Equity through Action on the Social Determinants of Health; Commission on Social Determinants of Health: Geneva, Switzerland, 2008.
- Konings, P.; Harper, S.; Lynch, J.; Hosseinpoor, A.R.; Berkvens, D.; Lorant, V.; Geckova, A.; Speybroeck, N. Analysis of socioeconomic health inequalities using the concentration index. Int. J. Public Health 2010, 55, 71–74. [Google Scholar] [CrossRef]
- Speybroeck, N.; Konings, P.; Lynch, J.; Harper, S.; Berkvens, D.; Lorant, V.; Geckova, A.; Hosseinpoor, A.R. Decomposing socioeconomic health inequalities. Int. J. Public Health 2010, 55, 347–351. [Google Scholar] [CrossRef]
- Hosseinpoor, A.R.; van Doorslaer, E.; Speybroeck, N.; Naghavi, M.; Mohammad, K.; Majdzadeh, R.; Delavar, B.; Jamshidi, H.; Vega, J. Decomposing socioeconomic inequality in infant mortality in Iran. Int. J. Epidemiol. 2006, 35, 1211–1219. [Google Scholar] [CrossRef]
- Van de Poel, E.; Hosseinpoor, A.R.; Jehu-Appiah, C.; Vega, J.; Speybroeck, N. Malnutrition and the disproportional burden on the poor: The case of Ghana. Int. J. Equity Health 2007, 6, 21. [Google Scholar] [CrossRef]
- Van Malderen, C.; Ogali, I.; Khasakhala, A.; Muchiri, S.N.; Sparks, C.; van Oyen, H.; Speybroeck, N. Decomposing Kenyan socio-economic inequalities in skilled birth attendance and measles immunization. Int. J. Equity Health 2013, 12, 3. [Google Scholar] [CrossRef]
- Goli, S.; Doshi, R.; Perianayagam, A. Pathways of economic inequalities in maternal and child health in urban India: A decomposition analysis. PLoS One 2013, 8, e58573. [Google Scholar] [CrossRef]
- Van Malderen, C.; van Oyen, H.; Speybroeck, N. Contributing determinants of overall and wealth-related inequality in under-5 mortality in 13 African countries. J. Epidemiol. Community Health 2013, 67, 667–676. [Google Scholar] [CrossRef]
- Galea, S.; Riddle, M.; Kaplan, G.A. Causal thinking and complex system approaches in epidemiology. Int. J. Epidemiol. 2010, 39, 97–106. [Google Scholar] [CrossRef]
- Cerda, M.; Diez-Roux, A.V.; Tchetgen, E.T.; Gordon-Larsen, P.; Kiefe, C. The relationship between neighborhood poverty and alcohol use: Estimation by marginal structural models. Epidemiology 2010, 21, 482–489. [Google Scholar] [CrossRef]
- Nandi, A.; Glymour, M.M.; Kawachi, I.; VanderWeele, T.J. Using marginal structural models to estimate the direct effect of adverse childhood social conditions on onset of heart disease, diabetes, and stroke. Epidemiology 2012, 23, 223–232. [Google Scholar] [CrossRef]
- Troch, I.; Breitenecker, F. Control systems, robotics and automation. Vol. IV—Modeling and simulation of dynamic systems. Encycl. Life Support Syst. 2011, 4, 1–13. [Google Scholar]
- Dormann, C.F.; Schymanski, S.J.; Cabral, J.; Chuine, I.; Graham, C.; Hartig, F.; Kearney, M.; Morin, X.; Römermann, C.; Schröder, B.; Singer, A. Correlation and process in species distribution models: Bridging a dichotomy. J. Biogeogr. 2012, 39, 2119–2131. [Google Scholar] [CrossRef]
- Moher, D.; Liberati, A.; Tetzlaff, J.; Altman, D.G.; the PRISMA Group. Preferred reporting items for systematic reviews and meta-analyses: The PRISMA statement. Ann. Intern. Med. 2009, 151, 264–269. [Google Scholar] [CrossRef]
- Welch, V.; Petticrew, M.; Tugwell, P.; Moher, D.; O’Neill, J.; Waters, E.; White, H.; PRISMA-Equity Bellagio Group. PRISMA-Equity 2012 extension: Reporting guidelines for systematic reviews with a focus on health equity. PLoS Med. 2012, 9. [Google Scholar] [CrossRef]
- R Core Team. R: A Language and Environment for Statistical Computing. R Foundation for Statistical Computing, Vienna, Austria. Available online: http://www.R-project.org (accessed on 24 June 2013).
- Grimm, V.; Berger, U.; DeAngelis, D.L.; Polhilld, J.G.; Giskee, J.; Railsbackf, S.F. The ODD protocol: A review and first update. Ecol. Model. 2010, 221, 2760–2768. [Google Scholar] [CrossRef]
- Schofield, D.J.; Shrestha, R.N.; Callander, E.J. Access to general practitioner services amongst underserved Australians: A microsimulation study. Hum. Resour. Health 2012, 10, 1. [Google Scholar] [CrossRef]
- Huber, H. Decomposing the causes of inequalities in health care use: A micro-simulations approach. J. Health Econ. 2008, 27, 1605–1613. [Google Scholar] [CrossRef]
- Propper, C. Equity and the UK National-Health-Service—A review of the evidence. Econ. Soc. Rev. 1994, 25, 343–365. [Google Scholar]
- Truong, K.D.; Reifsnider, O.S.; Mayorga, M.E.; Spitler, H. Estimated number of preterm births and low birth weight children born in the United States due to maternal binge drinking. Matern. Child Health J. 2013, 17, 677–688. [Google Scholar] [CrossRef]
- Riva, M.; Smith, D.M. Generating small-area prevalence of psychological distress and alcohol consumption: Validation of a spatial microsimulation method. Soc. Psychiatry Psychiatr. Epidemiol. 2012, 47, 745–755. [Google Scholar] [CrossRef]
- Abu-Zaineh, M.; Mataria, A.; Moatti, J.P.; Ventelou, B. Measuring and decomposing socioeconomic inequality in healthcare delivery: A microsimulation approach with application to the Palestinian conflict-affected fragile setting. Soc. Sci. Med. 2011, 72, 133–141. [Google Scholar] [CrossRef]
- Zayas-Cabán, T. Modeling access to health care within a community. Int. J. Health Care Qual. Assur. 2003, 16, 273–278. [Google Scholar] [CrossRef]
- Tomintz, M.N.; Clarke, G.P.; Rigby, J.E.; Green, J.M. Optimising the location of antenatal classes. Midwifery 2013, 29, 33–43. [Google Scholar] [CrossRef]
- Deb, P.; Munkin, M.K.; Trivedi, P.K. Private insurance, selection, and health care use: A Bayesian analysis of a Roy-type model. J. Bus. Econ. Stat. 2006, 24, 403–415. [Google Scholar] [CrossRef]
- Zajacova, A.; Goldman, N.; Rodriguez, G. Unobserved heterogeneity can confound the effect of education on mortality. Math. Popul. Stud. 2009, 16, 153–173. [Google Scholar] [CrossRef]
- Ballas, D.; Clarke, G.; Dorling, D.; Rigby, J.; Wheeler, B. Using geographical information systems and spatial microsimulation for the analysis of health inequalities. Health Inform. J. 2006, 12, 65–79. [Google Scholar] [CrossRef]
- Auchincloss, A.H.; Riolo, R.L.; Brown, D.G.; Cook, J.; Diez Roux, A.V. An agent-based model of income inequalities in diet in the context of residential segregation. Am. J. Prev. Med. 2011, 40, 303–311. [Google Scholar] [CrossRef]
- Yang, Y.; Roux, A.V.; Auchincloss, A.H.; Rodriguez, D.A.; Brown, D.G. Exploring walking differences by socioeconomic status using a spatial agent-based model. Health Place 2012, 18, 96–99. [Google Scholar] [CrossRef]
- Lee, B.Y.; Brown, S.T.; Bailey, R.R.; Zimmerman, R.K.; Potter, M.A.; McGlone, S.M.; Cooley, P.C.; Grefenstette, J.J.; Zimmer, S.M.; Wheaton, W.D.; et al. The benefits to all of ensuring equal and timely access to influenza vaccines in poor communities. Health Aff. 2011, 30, 1141–1150. [Google Scholar] [CrossRef]
- Rahman, A.; Setayeshi, S.; Shamsaei Zafargandi, M. Wealth adjustment in an artificial society, based on a sugarscape model using one fifth of the wealth variable. Iran. J. Electr. Comput. Eng. 2009, 8, 35–40. [Google Scholar]
- Morris, M.; Kurth, A.E.; Hamilton, D.T.; Moody, J.; Wakefield, S. Concurrent partnerships and HIV prevalence disparities by race: Linking science and public health practice. Am. J. Public Health 2009, 99, 1023–1031. [Google Scholar] [CrossRef]
- Friedberg, M.W.; Safran, D.G.; Coltin, K.; Dresser, M.; Schneider, E.C. Paying for performance in primary care: Potential impact on practices and disparities. Health Aff. 2010, 29, 926–932. [Google Scholar] [CrossRef]
- Diaz, R.; Behr, J.G.; Tulpule, M. A system dynamics model for simulating ambulatory health care demands. Simul. Healthc. 2012, 7, 243–250. [Google Scholar] [CrossRef]
- Milstein, B.; Homer, J.; Hirsch, G. Analyzing national health reform strategies with a dynamic simulation model. Am. J. Public Health 2010, 100, 811–819. [Google Scholar]
- Plucinski, M.M.; Ngonghala, C.N.; Getz, W.M.; Bonds, M.H. Clusters of poverty and disease emerge from feedbacks on an epidemiological network. J. R. Soc. Interface 2013, 10. [Google Scholar] [CrossRef]
- Chang, Y.; Schechter, C.B.; van Ravesteyn, N.T.; Near, A.M.; Heijnsdijk, E.A.; Adams-Campbell, L.; Levy, D.; de Koning, H.J.; Mandelblatt, J.S. Collaborative modeling of the impact of obesity on race-specific breast cancer incidence and mortality. Breast Cancer Res. Treat. 2012, 136, 823–835. [Google Scholar] [CrossRef]
- Lansdorp-Vogelaar, I.; Kuntz, K.M.; Knudsen, A.B.; van Ballegooijen, M.; Zauber, A.G.; Jemal, A. Contribution of screening and survival differences to racial disparities in colorectal cancer rates. Cancer Epidemiol. Biomark. Prev. 2012, 21, 728–736. [Google Scholar] [CrossRef]
- Tasosa, J.; Schuster, R.; McAlearney, J.S. Cost-effectiveness of treating hypertension, hyperglycemia, and hyperlipidemia in African Americans and the general population with type 2 diabetes. J. Health Care Poor Underserved 2010, 21, 161–176. [Google Scholar] [CrossRef]
- Rudge, J.W.; Hanvoravongchai, P.; Krumkamp, R.; Chavez, I.; Adisasmito, W.; Chau, P.N.; Phommasak, B.; Putthasri, W.; Shih, C.S.; Stein, M.; et al. Health system resource gaps and associated mortality from pandemic influenza across six asian territories. PLoS One 2012, 7, e31800. [Google Scholar] [CrossRef]
- Rendall, M.S.; Weden, M.M.; Fernandes, M.; Vaynman, I. Hispanic and black US children’s paths to high adolescent obesity prevalence. Pediatr. Obes. 2012, 7, 423–435. [Google Scholar] [CrossRef]
- Mukandavire, Z.; Malunguza, N.J.; Chiyaka, C.; Musuka, C.; Tchuenche, J.M. HIV/AIDS model assessing the effects of gender-inequality affecting women in african heterosexual settings. Int. J. Biomath. 2010, 3, 43–67. [Google Scholar] [CrossRef]
- Lansdorp-Vogelaar, I.; van Ballegooijen, M.; Zauber, A.G.; Boer, R.; Wilschut, J.; Winawer, S.J.; Habbema, J.D. Individualizing colonoscopy screening by sex and race. Gastrointest. Endosc. 2009, 70, 96–108. [Google Scholar] [CrossRef]
- Turner, K.M.E.; Garnett, G.P.; Ghani, A.C.; Sterne, J.A.; Low, N. Investigating ethnic inequalities in the incidence of sexually transmitted infections: Mathematical modelling study. Sex. Transm. Infect. 2004, 80, 379–385. [Google Scholar] [CrossRef]
- Goldie, S.J.; Daniels, N. Model-based analyses to compare health and economic outcomes of cancer control: Inclusion of disparities. J. Natil. Cancer Inst. 2011, 103, 1373–1386. [Google Scholar] [CrossRef]
- Mahamoud, A.; Roche, B.; Homer, J. Modelling the social determinants of health and simulating short-term and long-term intervention impacts for the city of Toronto, Canada. Soc. Sci. Med. 2013, 93, 247–255. [Google Scholar] [CrossRef]
- Wolf, D.A.; Laditka, S.B.; Laditka, J.N. Patterns of active life among older women: Differences within and between groups. J. Women Aging 2002, 14, 9–26. [Google Scholar] [CrossRef]
- Van Ravesteyn, N.T.; Schechter, C.B.; Near, A.M.; Heijnsdijk, E.A.; Stoto, M.A.; Draisma, G.; de Koning, H.J.; Mandelblatt, J.S. Race-specific impact of natural history, mammography screening, and adjuvant treatment on breast cancer mortality rates in the United States. Cancer Epidemiol. Biomark. Prev. 2011, 20, 112–122. [Google Scholar] [CrossRef]
- Losina, E.; Schackman, B.R.; Sadownik, S.N.; Gebo, K.A.; Walensky, R.P.; Chiosi, J.J.; Weinstein, M.C.; Hicks, P.L.; Aaronson, W.H.; Moore, R.D.; et al. Racial and sex disparities in life expectancy losses among hiv-infected persons in the united states: Impact of risk behavior, late initiation, and early discontinuation of antiretroviral therapy. Clin. Infect. Dis. 2009, 49, 1570–1578. [Google Scholar] [CrossRef]
- Soerjomataram, I.; Barendregt, J.J.; Gartner, C.; Kunst, A.; Møller, H.; Avendano, M. Reducing inequalities in lung cancer incidence through smoking policies. Lung Cancer 2011, 73, 268–273. [Google Scholar] [CrossRef]
- Mbah, M.L.N.; Gilligan, C.A. Resource allocation for epidemic control in metapopulations. PLoS One 2011, 6, e24577. [Google Scholar] [CrossRef]
- Menvielle, G.; Soerjomataram, I.; de Vries, E.; Engholm, G.; Barendregt, J.J.; Coebergh, J.W.; Kunst, A.E. Scenarios of future lung cancer incidence by educational level: Modelling study in Denmark. Eur. J. Cancer 2010, 46, 2625–2632. [Google Scholar] [CrossRef]
- Ocana-Riola, R.; Fernandez-Ajuria, A.; Mayoral-Cortes, J.M.; Toro-Cárdenas, S.; Sánchez-Cantalejo, C. Uncontrolled migrations as a cause of inequality in health and mortality in small-area studies. Epidemiology 2009, 20, 411–418. [Google Scholar] [CrossRef]
- Earnshaw, S.R.; Hicks, K.; Richter, A.; Honeycutt, A. A linear programming model for allocating HIV prevention funds with state agencies: A pilot study. Health Care Manag. Sci. 2007, 10, 239–252. [Google Scholar] [CrossRef]
- Bruni, M.E.; Conforti, D.; Sicilia, N.; Trotta, S. A new organ transplantation location-allocation policy: A case study of Italy. Health Care Manag. Sci. 2006, 9, 125–142. [Google Scholar] [CrossRef]
- Wilson, R.M.; Gibberd, R.W. Allocating resources between health care regions: Catchment populations and allocating for equity. Eur. J. Oper. Res. 1990, 49, 333–347. [Google Scholar] [CrossRef]
- Kumar, N. Changing geographic access to and locational efficiency of health services in two Indian districts between 1981 and 1996. Soc. Sci. Med. 2004, 58, 2045–2067. [Google Scholar] [CrossRef]
- Wilson, R.M.; Gibberd, R.W. Combining multiple criteria for regional resource allocation in health care systems. Math. Comput. Model. 1990, 13, 15–27. [Google Scholar] [CrossRef]
- Wilson, D.P.; Blower, S.M. Designing equitable antiretroviral allocation strategies in resource-constrained countries. PLoS Med. 2005, 2, 132–141. [Google Scholar] [CrossRef]
- Verguet, S. Efficient and equitable HIV prevention: A case study of male circumcision in South Africa. Cost Eff. Resour. Alloc. 2013, 11, 1. [Google Scholar] [CrossRef]
- Stinnett, A.A.; Paltiel, A.D. Mathematical programming for the efficient allocation of health care resources. J. Health Econ. 1996, 15, 641–653. [Google Scholar] [CrossRef]
- Chu, S.C.K.; Ho, M.P.P.; Lee, K.K.Y.; Lo, H.P. Nurses allocation models for maternal and child health services. J. Oper. Res. Soc. 2000, 51, 1193–1204. [Google Scholar]
- Sutton, M.; Lock, P. Regional differences in health care delivery: Implications for a national resource allocation formula. Health Econ. 2000, 9, 547–559. [Google Scholar] [CrossRef]
- Diderichsen, F.; Varde, E.; Whitehead, M. Resource allocation to health authorities: The quest for an equitable formula in Britain and Sweden. Br. Med. J. 1997, 315, 875–878. [Google Scholar] [CrossRef]
- Segall, R.S. Some deterministic and stochastic nonlinear optimization modelling for the spatial allocation of multicategorical resources: With an application to real health data. Appl. Math. Model. 1989, 13, 641–650. [Google Scholar] [CrossRef]
- Matsumoto, M.; Ogawa, T.; Kashima, S.; Takeuchi, K. The impact of rural hospital closures on equity of commuting time for haemodialysis patients: Simulation analysis using the capacity-distance model. Int. J. Health Geogr. 2012, 11, 28. [Google Scholar] [CrossRef]
- Caudeville, J.; Bonnard, R.; Boudet, C.; Denys, S.; Govaert, G.; Cicolella, A. Development of a spatial stochastic multimedia exposure model to assess population exposure at a regional scale. Sci. Total Environ. 2012, 432, 297–308. [Google Scholar] [CrossRef]
- Harlan, S.L.; Brazel, A.J.; Prashad, L.; Stefanovb, W.L.; Larsenc, L. Neighborhood microclimates and vulnerability to heat stress. Soc. Sci. Med. 2006, 63, 2847–2863. [Google Scholar] [CrossRef]
- Atlas, M. PER pressure: New Jersey’s “Population Emissions Ratio” environmental equity screening model. Risk Anal. 2003, 23, 69–79. [Google Scholar] [CrossRef]
- Levy, J.I.; Wilson, A.M.; Zwack, L.M. Quantifying the efficiency and equity implications of power plant air pollution control strategies in the United States. Environ. Health Perspect. 2007, 115, 743–750. [Google Scholar] [CrossRef]
- Jiang, Q.; Li, S.; Feldman, M.W. Demographic consequences of gender discrimination in China: Simulation analysis of policy options. Popul. Res. Policy Rev. 2011, 30, 619–638. [Google Scholar] [CrossRef]
- Carrera, C.; Azrack, A.; Begkoyian, G.; Pfaffmann, J.; Ribaira, E.; O’Connell, T.; Doughty, P.; Aung, K.M.; Prieto, L.; Rasanathan, K. The comparative cost-effectiveness of an equity-focused approach to child survival, health, and nutrition: A modelling approach. Lancet 2012, 380, 1341–1351. [Google Scholar] [CrossRef]
- Cojocaru, M.G. Dynamic equilibria of group vaccination strategies in a heterogeneous population. J. Glob. Optim. 2008, 40, 51–63. [Google Scholar] [CrossRef]
- McPake, B.; Hanson, K.; Adam, C. Two-tier charging strategies in public hospitals: Implications for intra-hospital resource allocation and equity of access to hospital services. J. Health Econo. 2007, 26, 447–462. [Google Scholar] [CrossRef]
- Balia, S.; Jones, A.M. Mortality, lifestyle and socio-economic status. J. Health Econ. 2008, 27, 1–26. [Google Scholar] [CrossRef]
- Health Inequality over the Life-Cycle. Available online: http://www.economics.hawaii.edu/research/workingpapers/WP_11-8.pdf (accessed on 17 October 2013).
- Meir, A. A disparity-based diffusion approach to analysis of mortality decline. Espace Popul. Soc. 1990, 1990, 403–406. [Google Scholar] [CrossRef]
- Schmolke, A.; Thorbek, P.; DeAngelis, D.L.; Grimm, V. Ecological models supporting environmental decision making: A strategy for the future. Trends Ecol. Evol. 2010, 25, 479–486. [Google Scholar] [CrossRef]
- Starfield, A.M.; Bleloch, A.L. Building Models for Conservation and Wildlife Management, 2nd ed.; The Burgess Press: Edina, MN, USA, 1991. [Google Scholar]
- Grimm, V.; Railsback, S.F. Pattern-oriented modelling: A ‘multi-scope’ for predictive systems ecology. Philos. Trans. R. Soc. Lond. B Biol. Sci. 2012, 367, 298–310. [Google Scholar] [CrossRef]
- Carrasco, L.R.; Jit, M.; Chen, M.I.; Lee, V.J.; Milne, G.J.; Cook, A.R. Trends in parameterization, economics and host behaviour in influenza pandemic modelling: A review and reporting protocol. Emerg. Themes Epidemiol 2013, 10, 3. [Google Scholar] [CrossRef]
- Health Inequalities: Concepts, Frameworkds and Policy-Briefing Paper. Available online: http://www.nice.org.uk/niceMedia/pdf/health_inequalities_policy_graham.pdf (accessed on 17 October 2013).
- Braveman, P. Social conditions, health equity, and human rights. Health Hum. Rights 2010, 12, 31–48. [Google Scholar]
Appendix
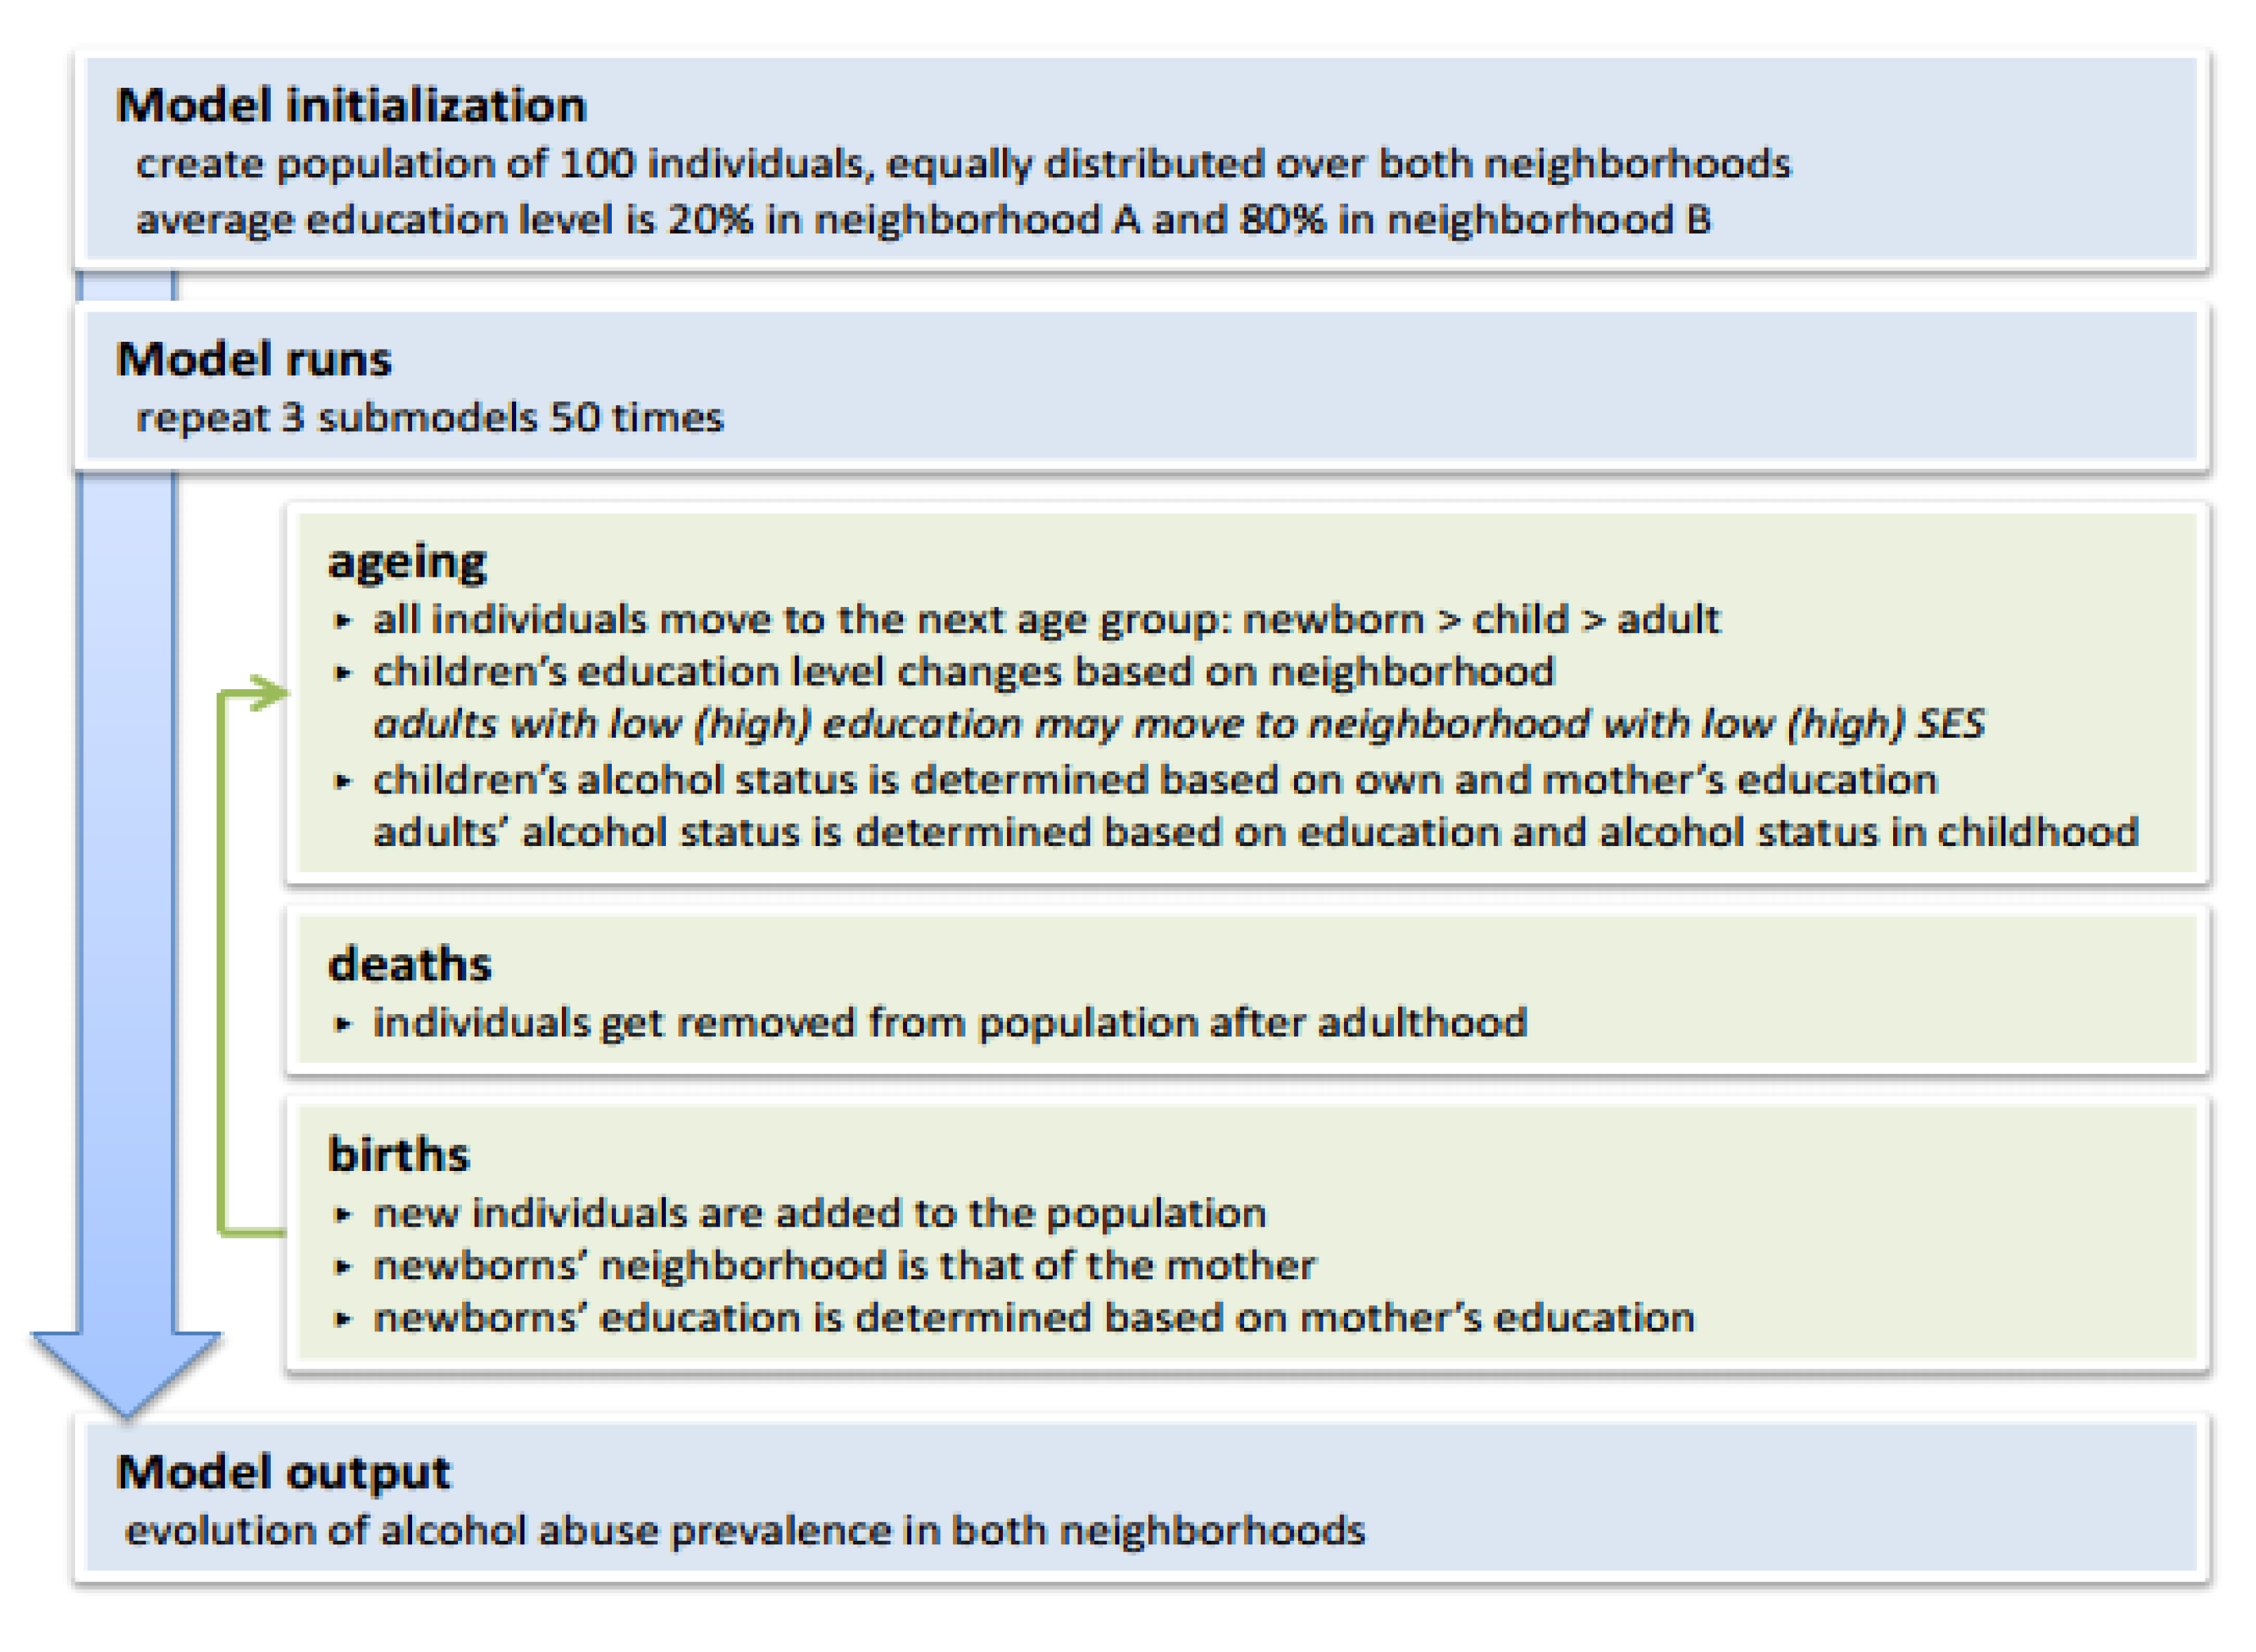
| Overview | |
|---|---|
| Purpose | To understand the emergence of socioeconomic health inequalities. |
| Entities, state variables, and scales | The main model entities are the individual females, each having six state variables:
|
| Process overview and scheduling | The model is updated in discrete time steps:
|
| Design concepts | |
| Basic principles | The model is based on the ideas that education level depends on the neighborhood and on the mothers’ education level; and that alcohol consumption depends on the own and the mothers’ education level. Optionally, the model can be allowed to assume that adults change neighborhood based on own their education level. |
| Emergence | The main model results are the neighborhood-specific average education and alcohol consumption levels. |
| Adaptation | The model contains two adaptive traits:
|
| Objectives | The adaptive traits are not linked to any objective. |
| Learning | There is no change in adaptive traits over time. |
| Prediction | There are no predictions assumed. |
| Sensing | The individuals sense the average education level in their neighborhood. |
| Interaction | There is interaction between mothers and offspring:
|
| Stochasticity | Mother’s education → newborn’s education:
|
| Collective | Individuals belong to two different neighborhoods; these neighborhoods are entities with own state variables. |
| Observation | No external data are observed. |
| Details | |
| Initialization | The model gets initialized with 100 individuals, equally distributed over both neighborhoods.
The initial education level is randomly assigned based on neighborhood:
|
| Input data | No external input data is used. |
| Submodels | See R script. |

| Name of the model | Socioeconomic determinant(s) | Health outcome(s) | Country | Multilevel | Dynamic | Stochastic | Heterogeneous entities | … interacting | … adapting | Feed-back loop | Spatial | Validated (predictive) | Framework created | Intervention/scenario test | Ref. |
|---|---|---|---|---|---|---|---|---|---|---|---|---|---|---|---|
| Microsimulation | |||||||||||||||
| Microsimulation model | Rural/urban, income, employment | Access to GP | Australia | X | X | X | X | [19] | |||||||
| Microsimulation+ decomposition | Household size, income | Number of GP/specialist visits | France | X | X | X | [20] | ||||||||
| Microsimulation model | Income, expenditures, taxes | Delivery of health care | UK | X | X | X | X | [21] | |||||||
| Simulation model | Race, education, employment, marital status | Preterm birth, low birth weight, maternal binge drinking | USA | X | X | X | X | [22] | |||||||
| Spatial microsimulation model | Gender, marital status, economic activity, occupational social class | Mental health surveillance | England | X | X | X | [23] | ||||||||
| Microsimulation+ decomposition | Household expenditures, education, occupational activity, marital status, insurance coverage, place of residence | Utilization of health services | Palestin | X | X | X | [24] | ||||||||
| Discrete simulation model | Ethnicity, insurance | Access to health care | USA | X | X | X | X | [25] | |||||||
| Microsimulation | |||||||||||||||
| Spatial microsimulation+ location-allocation model | Census output area | Access to antenatal care | UK | X | X | X | X | X | X | [26] | |||||
| Roy's model of selectivity | Insurance | Medical utilization | USA | X | X | X | X | X | X | [27] | |||||
| Microsimulation | Education | Mortality | USA | X | X | X | X | X | [28] | ||||||
| Spatial microsimulation | SES, geographic | Health status | UK | X | X | X | X | X | X | [29] | |||||
| Agent-based | |||||||||||||||
| Agent-based model | Residential segregation | Diet | USA | X | X | X | X | X | X | X | X | X | [30] | ||
| Agent-based model | SES | Walking | USA | X | X | X | X | X | X | X | X | X | [31] | ||
| Microsimulation model | Salary, income | Influenza vaccination and transmission | USA | X | X | X | X | X | X | X | [32] | ||||
| Sugarscape model | Wealth | Mortality | (Iran) | X | X | X | X | X | X | X | [33] | ||||
| Network | |||||||||||||||
| Network simulation model | Ethnicity, social network | HIV transmission | USA | X | X | X | X | X | X | [34] | |||||
| State-transition | |||||||||||||||
| Medicare demonstration | Ethnicity, education, public assistance, poverty, unemployment | Primary health care payment | USA | X | X | X | X | X | [35] | ||||||
| Ethnicity, insurance | Ambulatory health care utilization | US | X | X | X | X | [36] | ||||||||
| State-transition | |||||||||||||||
| System dynamics model | Insurance | Disease or injury | USA | X | X | X | X | X | X | [37] | |||||
| Individual-based network model | Poverty | Infectious disease transmission | (USA) | X | X | X | X | X | X | X | X | [38] | |||
| State-transition model | Race | Breast cancer outcomes incidence and mortality | USA | X | X | X | X | X | X | [39] | |||||
| Microsimulation model | Race | Colorectal cancer rate | USA | X | X | X | X | X | X | [40] | |||||
| Markov state-transition model | Race | Treatment of hypertension, hyperglycemia, hyperlipidemia (cost-effectiveness) | adult | X | X | X | X | [41] | |||||||
| Mathematical transmission model | Health system resources | Mortality from pandemic influenza | Cambodia, Indonesia, Lao PDR, Taiwan, Thailand and Vietnam | X | X | X | X | X | [42] | ||||||
| Markov model + decomposition | Race | Obesity prevalence | USA | X | X | X | X | X | [43] | ||||||
| Transmission model | Gender | HIV/AIDS transmission | African countries | X | X | X | X | [44] | |||||||
| Microsimulation model | Race, gender | Colonoscopic screening | USA | X | X | X | X | X | X | [45] | |||||
| Simple deterministic mathematical model | Race, gender | Sexually transmitted infections incidence | UK | X | X | X | X | X | X | [46] | |||||
| Disease simulation model | Race | Cancer control | USA | X | X | X | X | X | X | [47] | |||||
| System dynamics model | Ethnicity, immigration status, gender, income, housing, social cohesion | Chronic disease, disability, and mortality rate | Canada | X | X | X | X | X | [48] | ||||||
| Discrete-time Markov-chains + microsimulation | Race, education, marital history | Remaining years of life and proportion of remaining years with disability | USA | X | X | X | [49] | ||||||||
| Microsimulation model | Race | Breast cancer mortality rate | USA | X | X | X | X | X | X | [50] | |||||
| State-transition model | Race, gender | Life-expectancy | USA | X | X | X | X | X | [51] | ||||||
| State-transition simulation model | SES | Lung cancer incidence | UK | X | X | X | X | X | [52] | ||||||
| SIRS model | Region | Infectious disease transmission | (UK) | X | X | X | X | X | [53] | ||||||
| State-transition model | Education | Lung cancer incidence | Denmark | X | X | X | X | X | [54] | ||||||
| Dynamics systems | Region | Health, mortality | (Spain) | X | X | X | X | [55] | |||||||
| Optimization | |||||||||||||||
| Optimal allocation model | Region | HIV prevention | USA | X | X | X | X | X | [56] | ||||||
| Location-allocation model | Region | Access to organ transplantation | Italy | X | X | X | X | X | [57] | ||||||
| Catchment population formulae | Region | Access to the health care system | Australia | X | X | X | X | X | [58] | ||||||
| Location-allocation model | Geographic location | Access to health services | India | X | X | X | X | X | [59] | ||||||
| Optimization | |||||||||||||||
| Spatial interaction model | Region | Acute-care hospital utilization, accessibility | Australia | X | X | X | X | X | [60] | ||||||
| Spatial mathematical model | Region | Access to antiretrovirals | South Africa | X | X | X | X | [61] | |||||||
| Deterministic epidemic model | Province | Access to male circumcision | South Africa | X | X | X | X | [62] | |||||||
| Mathematical programming model | Program resources | Access to health care resources | (USA) | X | X | X | [63] | ||||||||
| Goal programming model | Region | Nurses for maternal and child health services | China | X | X | X | X | [64] | |||||||
| Resource allocation formulae | Region | Patterns of health care delivery | UK | X | X | X | X | [65] | |||||||
| Formula for resource allocation | Local districts | Use of hospital services | Sweden | X | X | X | X | X | [66] | ||||||
| Resource allocation model | Zone of residence | Access to public service facilities | USA | X | X | X | X | X | [67] | ||||||
| Capacity-distance model | Commuting time | Access to dialysis | Japan | X | X | X | X | X | X | [68] | |||||
| Risk assessment | |||||||||||||||
| Stochastic multimedia exposure model | Region | Exposure to metals | France | X | X | X | X | X | X | X | [69] | ||||
| Energy balance model | Income, poverty, education, ethnicity, geographic location | Exposition to heat stress | USA | X | X | X | X | X | X | [70] | |||||
| Risk assessment | |||||||||||||||
| Environmental equity rule | Ethnicity | Environmental risk on human health | USA | X | X | X | [71] | ||||||||
| Source-receptor matrix | Geographic location | Premature death | USA | X | X | X | X | X | [72] | ||||||
| Projection | |||||||||||||||
| Population projection model | Gender | Mortality, birth | China | X | X | X | X | [73] | |||||||
| Mathematical modelling | Geographic, economic sociocultural factors | Child mortality, stunting | 14 | X | X | X | X | [74] | |||||||
| Game | |||||||||||||||
| Evolutionary variational inequality model | Perception of vaccine | Vaccination | (Canada) | X | X | X | X | X | X | X | X | [75] | |||
| Stackelberg game | Payment mechanism | Utilization of hospital services | Zambia | X | X | [76] | |||||||||
| Behavioral/stress | |||||||||||||||
| Behavioral model + decomposition | Social class based on occupation | Mortality, lifestyle | Great Britain | X | X | X | X | X | X | [77] | |||||
| Stress model | Gender, education | Self-rated health status | any | X | X | X | X | X | [78] | ||||||
| Diffusion | |||||||||||||||
| Mortality decline diffusion model | Geographic location | Mortality | (Israel) | X | X | X | X | [79] | |||||||
© 2013 by the authors; licensee MDPI, Basel, Switzerland. This article is an open access article distributed under the terms and conditions of the Creative Commons Attribution license (http://creativecommons.org/licenses/by/3.0/).
Share and Cite
Speybroeck, N.; Van Malderen, C.; Harper, S.; Müller, B.; Devleesschauwer, B. Simulation Models for Socioeconomic Inequalities in Health: A Systematic Review. Int. J. Environ. Res. Public Health 2013, 10, 5750-5780. https://0-doi-org.brum.beds.ac.uk/10.3390/ijerph10115750
Speybroeck N, Van Malderen C, Harper S, Müller B, Devleesschauwer B. Simulation Models for Socioeconomic Inequalities in Health: A Systematic Review. International Journal of Environmental Research and Public Health. 2013; 10(11):5750-5780. https://0-doi-org.brum.beds.ac.uk/10.3390/ijerph10115750
Chicago/Turabian StyleSpeybroeck, Niko, Carine Van Malderen, Sam Harper, Birgit Müller, and Brecht Devleesschauwer. 2013. "Simulation Models for Socioeconomic Inequalities in Health: A Systematic Review" International Journal of Environmental Research and Public Health 10, no. 11: 5750-5780. https://0-doi-org.brum.beds.ac.uk/10.3390/ijerph10115750