Modeling Monthly Variation of Culex tarsalis (Diptera: Culicidae) Abundance and West Nile Virus Infection Rate in the Canadian Prairies


Abstract
:1. Introduction
2. Materials and Methods
2.1. Mosquito Data

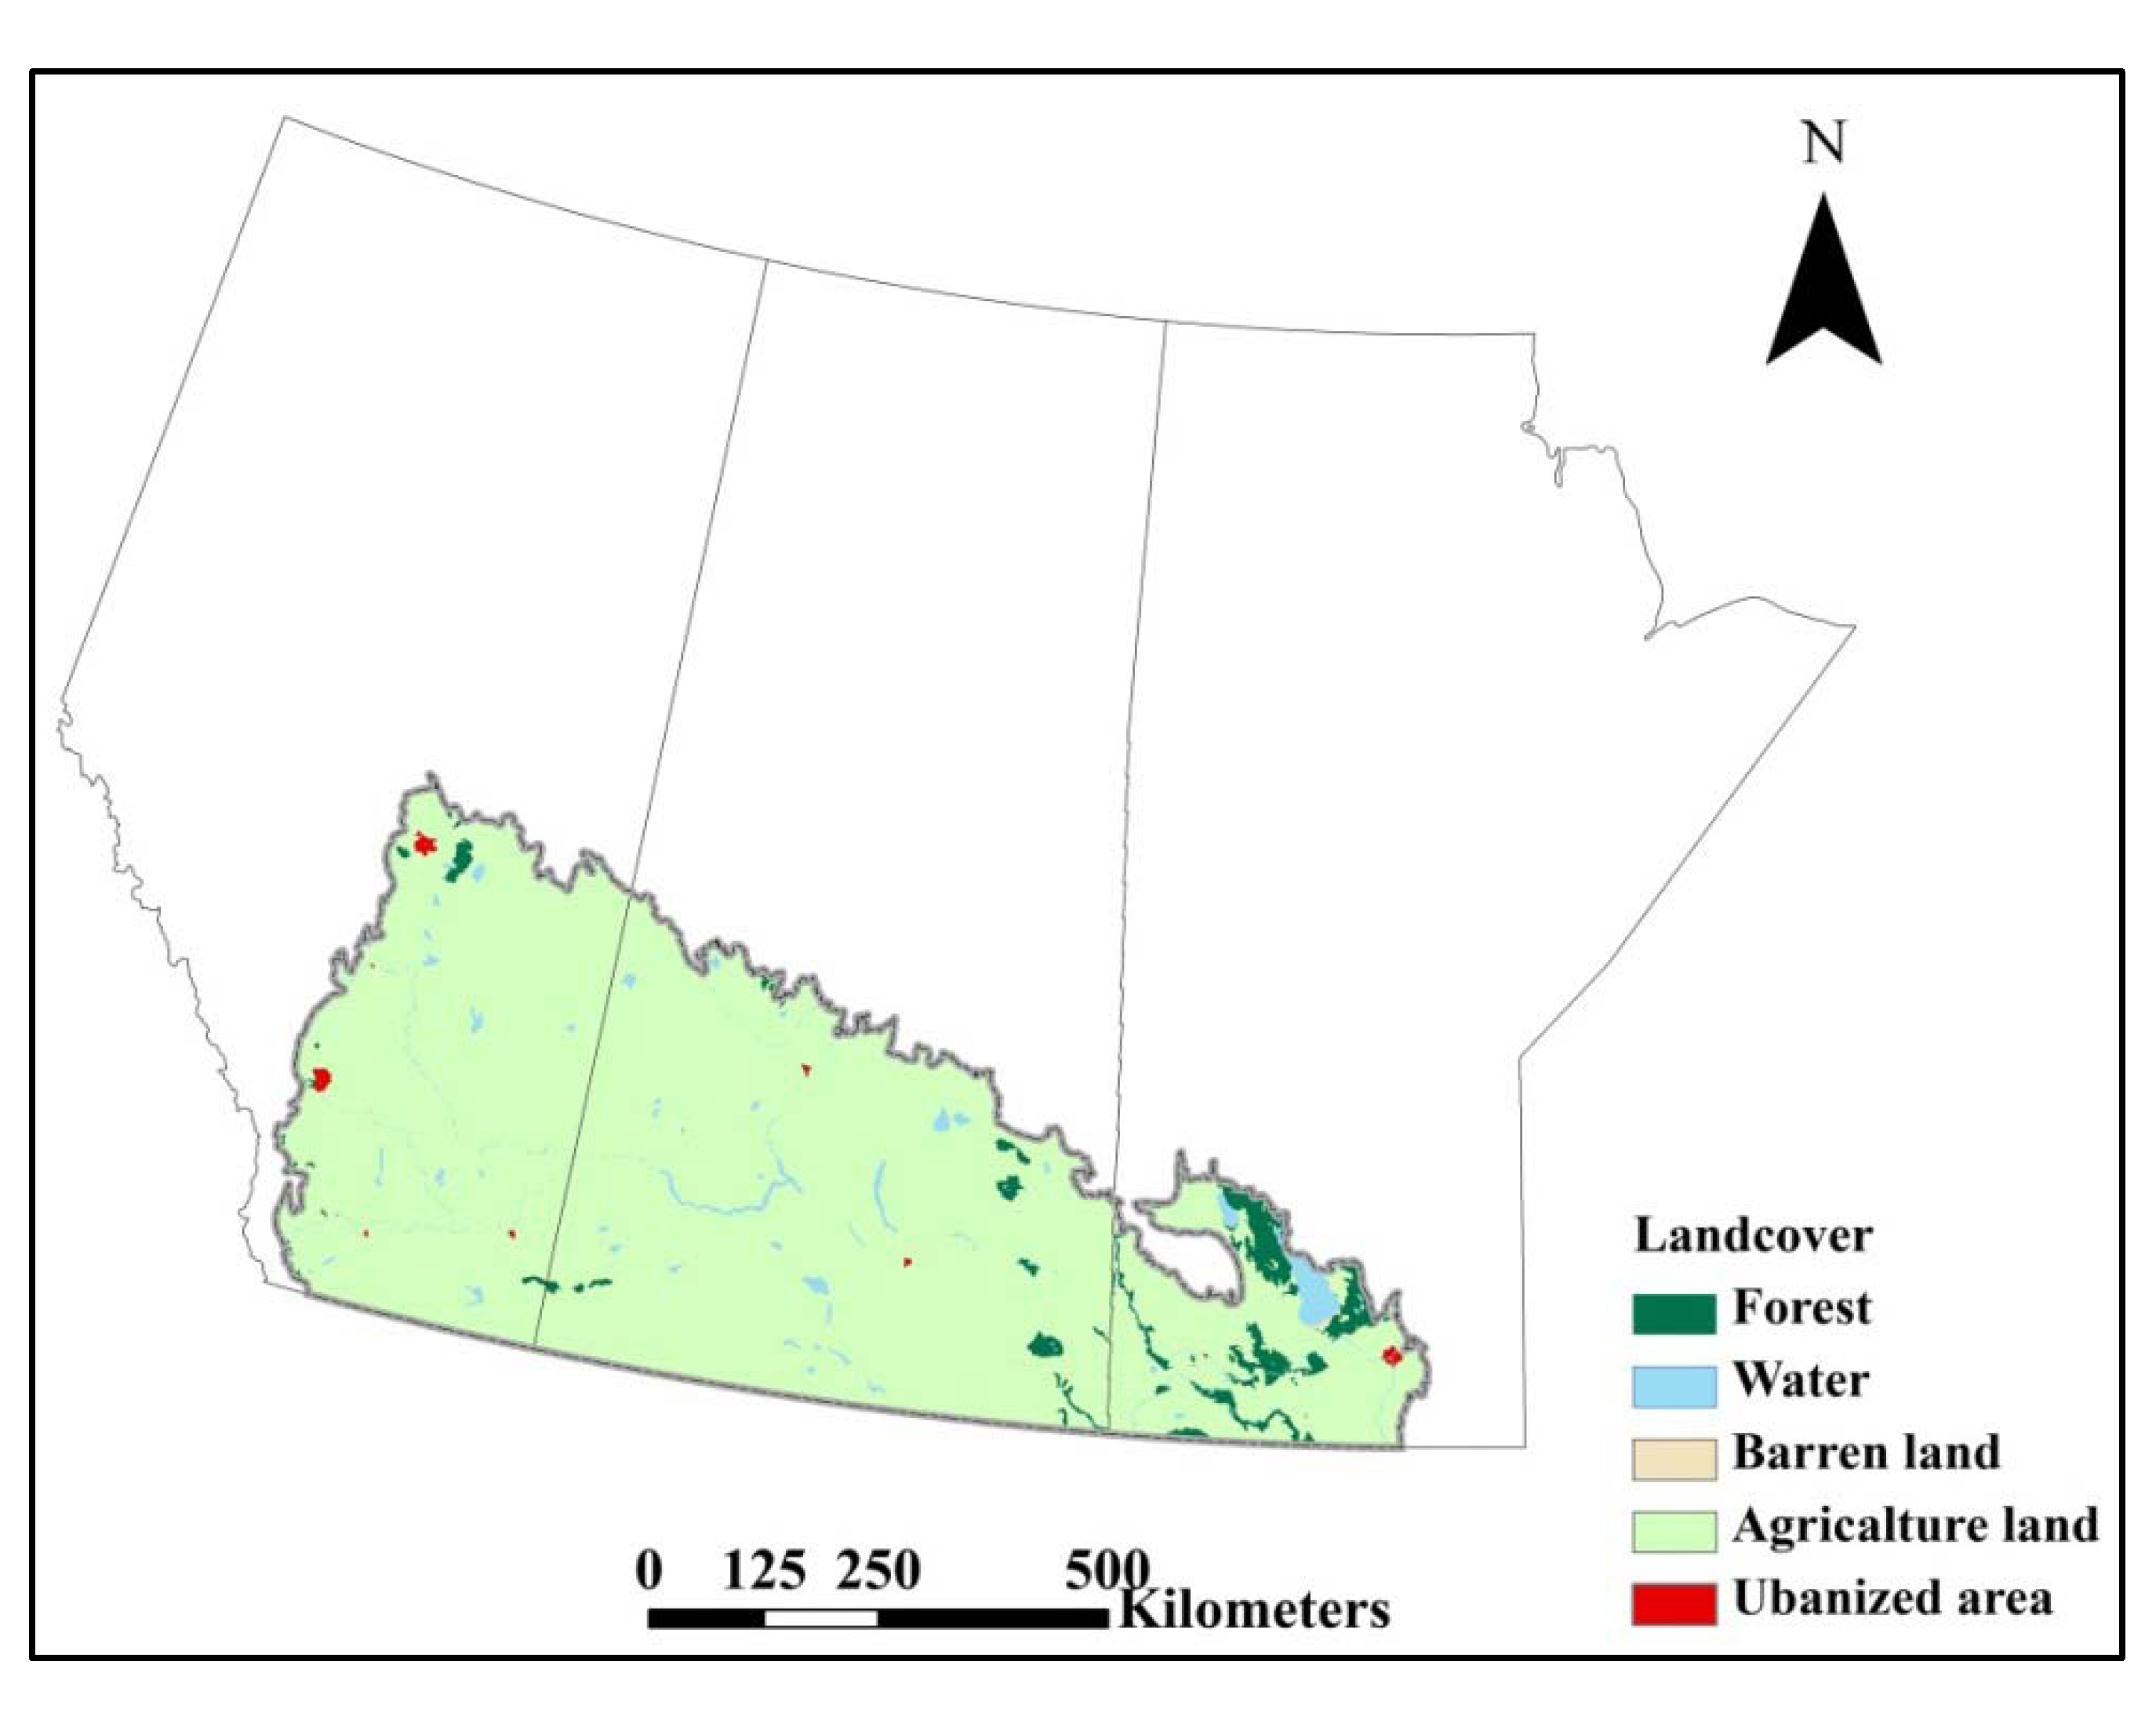
2.2. Land Cover
2.3. Weather Data

| Variables | Correlation (>0.8) | PCA component (Factor loading >0.6) | Variables description | |||
|---|---|---|---|---|---|---|
| LMM | GLMM | LMM | GLMM | |||
| Monthly mean temperature | 1 | 1 | 1 | 1 | Monthly mean temperature of the month of mosquito data collection | |
| 1 month lagged mean temperature | 2 | 2 | 2 | 2 | 1 month lagged mean monthly temperature | |
| 2 month lagged mean temperature | 2 | 2 | 2 | 2 | 2 months lagged mean monthly temperature | |
| 3 months mean temperature | 2 | 2 | 2 | 2 | Including mosquito collection month, and previous 1 and 2 months | |
| Winter mean temperature | 4 | 3 | 3 | From December to February | ||
| Monthly mean degree days | 3 | 3 | 3 | 3 | Monthly mean degree day of the mosquito data collection month | |
| 2 months total of monthly mean degree days | 3 | 3 | 3 | 3 | Created by summing the monthly mean degree days of the month of mosquito data collection and previous month | |
| 3 months total of monthly mean degree days | - | 3 | - | 3 | Created by summing the monthly mean degree days of the month of mosquito data collection, previous one and two months. Not applied in the LMM | |
| Mean temperature fluctuations | 3 | 3, 4 | 3 | 3 | Monthly mean maximum temperature minus monthly mean minimum temperature | |
| 1 months accumulative degree days | 1 | 1 | 1 | 1 | The accumulative degree days of data collection month | |
| 2 months accumulative degree days | 2 | 2 | 2 | 2 | The accumulative degree days of data collection month and previous months | |
| 3 months accumulative degree days | - | 2 | - | 2 | The accumulative degree days of data collection month and previous one and two months. Not used in the LMM | |
| 1 month lagged mean precipitation | - | 4 | - | 4 | 1 month lagged monthly mean daily total precipitation. | |
| Monthly total precipitation | Monthly total precipitation | |||||
| 1 month lagged total precipitation | 4 | 4 | 4 | 1 month lagged monthly total precipitation | ||
| 2 month lagged total precipitation | 2 | 2 | 2 month lagged monthly total precipitation | |||
| Total precipitation of previous year | 4 | 4 | Annual total precipitation of previous year | |||
| 3 months total precipitation | 4 | 4 | The total precipitation of mosquito collection month, and previous one and two months | |||
2.4. Data Analysis
2.5. Model Selection and Validation
3. Results
3.1. Descriptive Statistics
3.2. Constructed Models
| Variables | Single variable | Final model | Full model | |||||
|---|---|---|---|---|---|---|---|---|
| Coef. | 95% CI | Coef. | 95% CI | Coef. | 95% CI | |||
| Intercept | −3.48 * | −4.05 to −2.91 | −3.93 * | −4.6 to −3.25 | ||||
| Weather | ||||||||
| Monthly mean temperature | 0.25 * | 0.22 to 0.26 | 0.22 * | 0.2 to 0.25 | 0.22 * | 0.19 to 0.25 | ||
| 1 month lagged temperature | 0.08 * | 0.07 to 0.1 | 0.07 * | 0.05 to 0.09 | 0.06 * | 0.04 to 0.09 | ||
| Winter mean temperature | −0.04 * | −0.06 to −0.01 | −0.03 * | −0.06 to −0.01 | ||||
| Monthly mean degree days | 0.28 * | 0.23 to 0.33 | 0.032 | −0.04 to 0.1 | ||||
| Monthly total precipitation | −0.003 * | −0.004 to −0.001 | 0.0033 * | 0.002 to 0.005 | 0.0032 * | 0.002 to 0.005 | ||
| 1 month lagged precipitation | 0.006 * | 0.005 to 0.007 | 0.0042 * | 0.003 to 0.005 | 0.0037 * | 0.002 to 0.004 | ||
| 2 month lagged precipitation | 0.005 * | 0.004 to 0.006 | 0.0033 * | 0.002 to 0.004 | 0.003 * | 0.002 to 0.005 | ||
| Land cover 1 | ||||||||
| Forest | −0.48 * | −0.91 to −0.04 | −0.54 * | −0.9 to −0.17 | −0.59 * | −0.95 to −0.22 | ||
| Water | −0.11 * | −0.47 to −0.26 | 0.03 | −0.28 to 0.34 | ||||
| Variables | Single variable | Final model | Full model | |||||
|---|---|---|---|---|---|---|---|---|
| Coef. | 95% CI | Coef. | 95% CI | Coef. | 95% CI | |||
| Intercept | −2.26 * | −4.47 to −0.05 | −1.64 | −5.64 to 2.37 | ||||
| Cx. tarsalis abundance | 0.16 * | 0.03 to 0.30 | 0.55 * | 0.31 to 0.79 | 0.58 * | 0.28 to 0.87 | ||
| Weather | ||||||||
| Monthly mean temperature | −0.14 * | −0.2 to −0.08 | −0.04 | −0.18 to 0.10 | ||||
| 1 month lagged temperature | 0.25 * | 0.21 to 0.29 | 0.32 * | 0.22 to 0.41 | 0.32 * | 0.21 to 0.42 | ||
| Winter mean temperature | 0.23 * | 0.06 to 0.40 | 0.01 * | −0.13 to 0.15 | ||||
| 3 months total of monthly mean degree days | 0.20 * | 0.16 to 0.24 | −0.10 * | −0.2 to −0.01 | −1.10 | −0.21 to 0.002 | ||
| Monthly total precipitation | −0.015 * | −0.02 to −0.01 | −0.01 | −0.02 to 0.003 | ||||
| 1 month lagged mean precipitation | −0.48 * | −0.56 to −0.39 | −0.27 * | −0.36 to −0.18 | −0.43 * | −0.62 to −0.24 | ||
| 2 month lagged total precipitation | 0.003 | −0.001 to 0.01 | −0.01 | −0.02 to 0.003 | ||||
| 3 months total precipitation | −0.085 | −0.11 to 0.06 | −0.05 * | −0.08 to −0.02 | 0.013 | −0.06 to 0.08 | ||
| Land cover 1 | ||||||||
| Forest | −1.3 * | −1.84 to −0.76 | −0.43 | −1.27 to 0.41 | ||||
| Water | −1.31 * | −2.8 to −0.182 | −1.52 * | −2.56 to −0.47 | −1.61 * | −2.85 to −0.38 | ||

4. Discussion
5. Conclusions
Acknowledgements
Conflict of Interest
References
- Nash, D.; Mostashari, F.; Fine, A.; Miller, J.; O’Leary, D.; Murray, K.; Huang, A.; Rosenberg, A.; Greenberg, A.; Sherman, M.; et al. The outbreak of West Nile virus infection in the New York city area in 1999. N. Engl. J. Med. 2001, 344, 1807–1814. [Google Scholar] [CrossRef]
- Public Health Agency of Canada. West Nile MONITOR-2007 Human Surveillance. Available online: http://www.phac-aspc.gc.ca/WNV-VNW/mon-hmnsurv-2007.eng.php (accessed on 23 February 2013).
- Curry, P. Saskatchewan mosquitoes and West Nile virus. Blue Jay 2004, 62, 104–111. [Google Scholar]
- Turell, M.J.; Dohm, D.J.; Sardelis, M.R.; O’Guinn, M.L.; Andreadis, T.G.; Blow, J.A. An update on the potential of North American mosquitoes (Diptera: Culicidae) to transmit West Nile virus. J. Med. Entomol. 2005, 42, 57–62. [Google Scholar] [CrossRef]
- Hayes, E.B.; Komar, N.; Nasci, R.S.; Montgomery, S.P.; O’Leary, D.R.; Campbell, G.L. Epidemiology and transmission dynamics of West Nile virus disease. Emerg. Infect. Dis. 2005, 11, 1167–1173. [Google Scholar] [CrossRef]
- Epstein, P.R. West Nile virus and the climate. J. Urban Health 2001, 78, 367–371. [Google Scholar] [CrossRef]
- Eldridge, B. Strategies for surveillance, prevention, and control of arbovirus diseases in western North America. Am. J. Trop. Med. Hyg. 1987, 37, 77–86. [Google Scholar]
- Gu, W.; Lampman, R.; Krasavin, N.; Berry, R.; Novak, R. Spatio-temporal analyses of West Nile virus transmission in Culex mosquitoes in northern Illinois, USA, 2004. Vector Borne Zoonotic Dis. 2006, 6, 91–98. [Google Scholar] [CrossRef]
- Brownstein, J.S.; Holford, T.R.; Fish, D. Enhancing West Nile virus surveillance, United States. Emerg. Infect. Dis. 2004, 10, 1129–1133. [Google Scholar] [CrossRef]
- Yiannakoulias, N.W.; Schopflocher, D.P.; Svenson, L.W. Modelling geographic variations in West Nile virus. Can. J. Public Health. 2006, 97, 374–378. [Google Scholar]
- Goddard, L.B.; Roth, A.E.; Reisen, W.K.; Scott, T.W. Vertical transmission of West Nile virus by three California Culex (Diptera: Culicidae) species. J. Med. Entomol. 2003, 40, 743–746. [Google Scholar] [CrossRef]
- Tempelis, C.H.; Reeves, W.C.; Bellamy, R.E.; Lofy, M.F. A three-year study of the feeding habits of Culex tarsalis in Kern county, California. Am. J. Trop. Med. Hyg. 1965, 14, 170–177. [Google Scholar]
- Reisen, W.K. Effect of temperature on Culex tarsalis (Diptera: Culicidae) from the Coachella and San Joaquin valleys of California. J. Med. Entomol. 1995, 32, 636–645. [Google Scholar]
- Reisen, W.K.; Cayan, D.; Tyree, M.; Barker, C.M.; Eldridge, B.; Dettinger, M. Impact of climate variation on mosquito abundance in California. J. Vector Ecol. 2008, 33, 89–98. [Google Scholar] [CrossRef]
- Reisen, W.K.; Fang, Y.; Martinez, V.M. Effects of temperature on the transmission of West Nile virus by Culex tarsalis (Diptera: Culicidae). J. Med. Entomol. 2006, 43, 309–317. [Google Scholar] [CrossRef]
- Chuang, T.W.; Hildreth, M.B.; Vanroekel, D.L.; Wimberly, M.C. Weather and land cover influences on mosquito populations in Sioux Falls, South Dakota. J. Med. Entomol. 2011, 48, 669–679. [Google Scholar] [CrossRef]
- Wang, G.; Minnis, R.; Belant, J.; Wax, C. Dry weather induces outbreaks of human West Nile virus infections. BMC Infect. Dis. 2010, 10, 38–44. [Google Scholar] [CrossRef]
- Jenkins, D.W. Bionomics of Culex tarsalis in relation to Western equine encephalomyelitis. Am. J. Trop. Med. Hyg. 1950, 30, 909–916. [Google Scholar]
- Hongoh, V.; Berrang-Ford, L.; Scott, M.; Lindsay, L. Expanding geographical distribution of the mosquito, Culex pipiens, in Canada under climate change. Appl. Geogr. 2012, 3, 53–62. [Google Scholar]
- Lafferty, K.D. The ecology of climate change and infectious diseases. Ecology 2009, 90, 888–900. [Google Scholar] [CrossRef]
- Brooker, S.; Hay, S.I.; Bundy, D.A.P. Tools from ecology: Useful for evaluating infection risk models? Trends Parasitol. 2002, 18, 70–74. [Google Scholar] [CrossRef]
- Chen, C.-C.; Epp, T.; Jenkins, E.; Waldner, C.; Curry, P.S.; Soos, C. Predicting weekly variation of Culex tarsalis (Diptera: Culicidae) West Nile virus infection in a newly endemic region, the Canadian prairies. J. Med. Entomol. 2012, 49, 1144–1153. [Google Scholar] [CrossRef]
- Chen, C.C.; Jenkins, E.; Epp, T.; Waldner, C.; Curry, P.S.; Soos, C. Climate change and West Nilevirus in a highly endemic region of North America. Int. J. Environ. Res. Public Health 2013, 3052–3071. [Google Scholar]
- Lanciotti, R.S.; Kerst, A.J.; Nasci, R.S.; Godsey, M.S.; Mitchell, C.J.; Savage, H.M.; Komar, N.; Panella, N.A.; Allen, B.C.; Volpe, K.E.; et al. Rapid detection of West Nile virus from human clinical specimens, field-collected mosquitoes, and avian samples by a TaqMan reverse transcriptase-PCR assay. J. Clin. Microbiol. 2000, 38, 4066–4071. [Google Scholar]
- Drebot, M.A.; Lindsay, R.; Barker, I.K.; Buck, P.A.; Fearon, M.; Hunter, F.; Sockett, P.; Artsob, H. West Nile virus surveillance and diagnostics: A Canadian perspective. Can. J. Infect. Dis. 2003, 14, 105–114. [Google Scholar]
- Biggerstaff, B. PooledInfRate, Version 3.0: A Microsoft Excel Add-In to Compute Prevalence Estimates from Pooled Samples; Centers for Disease Control and Prevention: Fort Collins, CO, USA, 2006. [Google Scholar]
- Chiang, C.L.; Reeves, W.C. Statistical estimation of virus infection rates in mosquito vector populations. Am. J. Epidemiol. 1962, 75, 377–391. [Google Scholar]
- Bernard, K.A.; Maffei, J.G.; Jones, S.A.; Kauffman, E.B.; Ebel, G.; Dupuis, A. West Nile virus infection in birds and mosquitoes, New York State, 2000. Emerg. Infect. Dis. 2001, 7, 679–685. [Google Scholar]
- Gu, W.; Lampman, R.; Novak, R.J. Assessment of arbovirus vector infection rates using variable size pooling. Med. Vet. Entomol. 2004, 18, 200–204. [Google Scholar] [CrossRef]
- Gu, W.; Novak, R.J. Short report: Detection probability of arbovirus infection in mosquito populations. Am. J. Trop. Med. Hyg. 2004, 71, 636–638. [Google Scholar]
- Huffman, T.; Ogston, R.; Fisette, T.; Daneshfar, B.; Gasser, P.; White, L.; Maloley, M.; Chenier, R. Canadian agricultural land-use and land management data for Kyoto reporting. Can. J. Soil Sci. 2006, 86, 431–439. [Google Scholar] [CrossRef]
- Reisen, W.K.; Lothrop, H.D. Population ecology and dispersal of Culex tarsalis (Diptera: Culicidae) in the Coachella Valley of California. J. Med. Entomol. 1995, 32, 490–502. [Google Scholar]
- Zou, L.; Miller, S.N.; Schmidtmann, E.T. A GIS tool to estimate West Nile virus risk based on a degree-day model. Environ. Monit. Assess. 2007, 129, 413–420. [Google Scholar] [CrossRef]
- Allen, J. A modified sine wave method for calculating degree days. Environ. Entomol. 1976, 5, 388–396. [Google Scholar]
- Schrag, A.; Konrad, S.; Miller, S.; Walker, B.; Forrest, S. Climate-change impacts on sagebrush habitat and West Nile virus transmission risk and conservation implications for greater sage-grouse. GeoJournal 2011, 76, 561–575. [Google Scholar] [CrossRef]
- Dohoo, I.; Martin, W.; Stryhn, H. Model-Building Strategies. In Veterinary Epidemiologic Research, 2nd ed.; VER Inc.: Charlottetown, PEI, Canada, 2009; pp. 365–390. [Google Scholar]
- Guadagnoli, E.; Velicer, W.F. Relation of sample size to the stability of component patterns. Psychol. Bull. 1988, 103, 265–275. [Google Scholar] [CrossRef]
- Bolker, B.; Brooks, M.; Clark, C.; Geange, S.; Poulsen, J.; Stevens, M.; White, J. Generalized linear mixed models: A practical guide for ecology and evolution. Trends Ecol. Evol. 2009, 24, 127–135. [Google Scholar] [CrossRef]
- Dohoo, I.; Martin, W.; Stryhn, H. Mixed Models for Continuous Data. In Veterinary Epidemiologic Research, 2nd ed.; VER Inc.: Charlottetown, PEI, Canada, 2009; pp. 553–578. [Google Scholar]
- Burnham, K.P.; Anderson, D.R. Model Selection and Multimodel Inference: A Practical Information-Theoretic Approach; Springer Verlag: New York, NY, USA, 2002; pp. 49–96. [Google Scholar]
- Government of Alberta-Health and Wellness, West Nile Virus. Available online: http://www.health.alberta.ca/health-info/WNv-evidence.html (accessed on 8 September 2012).
- Government of Manitoba-Manitoba Health, West Nile Virus. Available online: http://www.gov.mb.ca/health/wnv/stats.html (accessed on 8 September 2012).
- Government of Saskatchewan-Public Health, West Nile Virus. Available online: http://www.health.gov.sk.ca/wnv-surveillance-results-archive (accessed on 8 September 2012).
- Kramer, L.D.; Ebel, G.D. Dynamics of flavivirus infection in mosquitoes. Adv. Virus Res. 2003, 60, 187–232. [Google Scholar] [CrossRef]
- Lambrechts, L.; Paaijmans, K.P.; Fansiri, T.; Carrington, L.B.; Kramer, L.D.; Thomas, M.B.; Scott, T.W. Impact of daily temperature fluctuations on Dengue virus transmission by Aedes aegypti. Proc. Natl. Acad. Sci. USA 2011, 108, 7460–7465. [Google Scholar] [CrossRef]
- Kramer, L.; Hardy, J.; Presser, S. Effect of temperature of extrinsic incubation on the vector competence of Culex tarsalis for western equine encephalomyelitis virus. Am. J. Trop. Med. Hyg. 1983, 32, 1130–1139. [Google Scholar]
- Reisen, W.; Meyer, R.; Presser, S.; Hardy, J. Effect of temperature on the transmission of western equine encephalomyelitis and St. Louis encephalitis viruses by Culex tarsalis (Diptera: Culicidae). J. Med. Entomol. 1993, 30, 151–160. [Google Scholar]
- Kwan, J.L.; Kluh, S.; Reisen, W.K. Antecedent avian immunity limits tangential transmission of West Nile virus to humans. PLoS One 2012, 7, e34127. [Google Scholar] [CrossRef]
- Reeves, W.C. Ecology of mosquitoes in relation to arboviruses. Annu. Rev. Entomol. 1965, 10, 25–46. [Google Scholar] [CrossRef]
- Murray, M.D. Influences of vector biology on transmission of arboviruses and outbreaks of disease: The Culicoides brevitarsis model. Vet. Microbiol. 1995, 46, 91–99. [Google Scholar] [CrossRef]
- Saugstad, E.S.; Dalrymple, J.M.; Eldridge, B.F. Ecology of arboviruses in a Maryland freshwater swamp: Population dynamics and hibitat distribution of potential mosquito vectors. Am. J. Epidemiol. 1972, 96, 114–122. [Google Scholar]
- Arunachalam, N.; Murty, U.S.N.; Narahari, D.; Balasubramanian, A.; Samuel, P.P.; Thenmozhi, V.; Paramasivan, R.; Rajendran, R.; Tyagi, B.K. Longitudinal studies of japanese encephalitis virus infection in vector mosquitoes in Kurnool district, Andhra Pradesh, South India. J. Med. Entomol. 2009, 46, 633–639. [Google Scholar] [CrossRef]
- Wegbreit, J.; Reisen, W.K. Relationships among weather, mosquito abundance, and encephalitis virus activity in California: Kern County 1990–1998. J. Am. Mosq. Control Assoc. 2000, 16, 22–27. [Google Scholar]
- Kilpatrick, A.M.; Kramer, L.D.; Campbell, S.R.; Alleyne, E.O.; Dobson, A.P.; Daszak, P. West Nile virus risk assessment and the bridge vector paradigm. Emerg. Infect. Dis. 2005, 11, 425–429. [Google Scholar] [CrossRef]
- Kwan, J.L.; Kluh, S.; Madon, M.B.; Reisen, W.K. West Nile virus emergence and persistence in Los Angeles, California, 2003–2008. Am. J. Trop. Med. Hyg. 2010, 83, 400–412. [Google Scholar] [CrossRef]
- Reisen, W.K.; Carroll, B.D.; Takahashi, R.; Fang, Y.; Garcia, S.; Martinez, V.M.; Quiring, R. Repeated West Nile virus epidemic transmission in Kern County, California, 2004–2007. J. Med. Entomol. 2009, 46, 139–157. [Google Scholar] [CrossRef]
- Landesman, W.J.; Allan, B.F.; Langerhans, R.B.; Knight, T.M.; Chase, J.M. Inter-annual associations between precipitation and human incidence of West Nile virus in the United States. Vector Borne Zoonotic Dis. 2007, 7, 337–343. [Google Scholar] [CrossRef]
- Epp, T.Y.; Waldner, C.L.; Berke, O. Predicting geographical human risk of West Nile virus-Saskatchewan, 2003 and 2007. Can. J. Public Health. 2009, 100, 344–348. [Google Scholar]
- Shaman, J.; Day, J.F.; Stieglitz, M. Drought-induced amplification and epidemic transmission of West Nile virus in southern Florida. J. Med. Entomol. 2005, 42, 134–141. [Google Scholar] [CrossRef]
- Chase, J.M.; Knight, T.M. Drought-induced mosquito outbreaks in wetlands. Ecol. Lett. 2003, 6, 1017–1024. [Google Scholar] [CrossRef]
- Ezenwa, V.O.; Milheim, L.E.; Coffey, M.F.; Godsey, M.S.; King, R.J.; Guptill, S.C. Land cover variation and West Nile virus prevalence: Patterns, processes, and implications for disease control. Vector Borne Zoonotic Dis. 2007, 7, 173–180. [Google Scholar] [CrossRef]
- Wimberly, M.C.; Hildreth, M.B.; Boyte, S.P.; Lindquist, E.; Kightlinger, L. Ecological niche of the 2003 West Nile virus epidemic in the northern Great Plains of the United States. PLoS One 2008, 3, e3744. [Google Scholar] [CrossRef]
- Ezenwa, V.O.; Godsey, M.S.; King, R.J.; Guptill, S.C. Avian diversity and West Nile virus: Testing associations between biodiversity and infectious disease risk. Proc. R. Soc. Biol. Sci. Ser. 2006, 273, 109–117. [Google Scholar] [CrossRef]
- Shepherd, A.; McGinn, S. Assessment of climate change on the Canadian prairies from downscaled GCM data. Atmosphere-Ocean 2003, 41, 301–316. [Google Scholar] [CrossRef]
© 2013 by the authors; licensee MDPI, Basel, Switzerland. This article is an open access article distributed under the terms and conditions of the Creative Commons Attribution license (http://creativecommons.org/licenses/by/3.0/).
Share and Cite
Chen, C.-C.; Epp, T.; Jenkins, E.; Waldner, C.; Curry, P.S.; Soos, C. Modeling Monthly Variation of Culex tarsalis (Diptera: Culicidae) Abundance and West Nile Virus Infection Rate in the Canadian Prairies. Int. J. Environ. Res. Public Health 2013, 10, 3033-3051. https://0-doi-org.brum.beds.ac.uk/10.3390/ijerph10073033
Chen C-C, Epp T, Jenkins E, Waldner C, Curry PS, Soos C. Modeling Monthly Variation of Culex tarsalis (Diptera: Culicidae) Abundance and West Nile Virus Infection Rate in the Canadian Prairies. International Journal of Environmental Research and Public Health. 2013; 10(7):3033-3051. https://0-doi-org.brum.beds.ac.uk/10.3390/ijerph10073033
Chicago/Turabian StyleChen, Chen-Chih, Tasha Epp, Emily Jenkins, Cheryl Waldner, Philip S. Curry, and Catherine Soos. 2013. "Modeling Monthly Variation of Culex tarsalis (Diptera: Culicidae) Abundance and West Nile Virus Infection Rate in the Canadian Prairies" International Journal of Environmental Research and Public Health 10, no. 7: 3033-3051. https://0-doi-org.brum.beds.ac.uk/10.3390/ijerph10073033