Article

Particulate Matter Exposure in a Police Station Located near a Highway

1
National Environmental Health Research Center, National Health Research Institutes, 35 Keyan Road, Zhunan Town, Miaoli 350, Taiwan
2
Department of Industrial and Information Management, College of Management, National Cheng Kung University, Tainan 701, Taiwan
3
Department of Chemistry, College of Science, National Sun Yat-sen University, Kaohsiung 804, Taiwan
4
Department of Environmental and Occupational Health, College of Medicine, National Cheng Kung University, Tainan 701, Taiwan
5
Department of Administration Police, College of Justice Administration, Central Police University, Taoyuan 333, Taiwan
6
Department of Occupational Safety and Health, College of Medicine and Life Science, Chung Hwa University of Medical Technology, Tainan 717, Taiwan
*
Authors to whom correspondence should be addressed.
Int. J. Environ. Res. Public Health 2015, 12(11), 14541-14556; https://0-doi-org.brum.beds.ac.uk/10.3390/ijerph121114541
Submission received: 8 September 2015 / Revised: 3 November 2015 / Accepted: 6 November 2015 / Published: 13 November 2015
(This article belongs to the Special Issue Occupational Safety and Related Impacts on Health and the Environment)

Abstract

:
People living or working near roadways have experienced an increase in cardiovascular or respiratory diseases due to vehicle emissions. Very few studies have focused on the PM exposure of highway police officers, particularly for the number concentration and size distribution of ultrafine particles (UFP). This study evaluated exposure concentrations of particulate matter (PM) in the Sinying police station near a highway located in Tainan, Taiwan, under different traffic volumes, traffic types, and shift times. We focused on periods when the wind blew from the highway toward the police station and when the wind speed was greater than or equal to 0.5 m/s. PM2.5, UFP, and PM-PAHs concentrations in the police station and an upwind reference station were measured. Results indicate that PM2.5, UFP, and PM-PAHs concentrations in the police station can be on average 1.13, 2.17, and 5.81 times more than the upwind reference station concentrations, respectively. The highest exposure level for PM2.5 and UFP was observed during the 12:00 PM–4:00 PM shift while the highest PAHs concentration was found in the 4:00 AM–8:00 AM shift. Thus, special attention needs to be given to protect police officers from exposure to high PM concentration.

1. Introduction

Particulate matter exposure can result in adverse health effects such as cardiopulmonary diseases [1,2]. Among them, PM2.5 (aerodynamic diameter ≤2.5 μm), ultrafine particles (UFP, aerodynamic diameter ≤100 nm), and polycyclic aromatic hydrocarbons (PAHs) have recently drawn significant attention due to their increasingly known adverse effects in in human health. Elevated PM2.5 concentration has been linked to increased mortality and shortened lifespan [3,4], while UFPs, due to their small size and large number concentrations, can penetrate deep into the lungs, resulting in pulmonary inflation and even lung destruction [5,6,7]. Furthermore, UFP can enter the blood and lymph circulation, reaching sensitive targets such as bone marrow and the heart [8]. PAHs exposure can result in DNA damage [9,10] and even lead to lung cancer [11]. High molecular weight PAHs (PM-PAHs, PAHs with three rings or greater, which are predominately adsorbed on particles) are primarily in the PM2.5 category, with many having been identified as mutagens and carcinogens [12,13].
Highway vehicle emissions are a major source of PM, especially UFP and PAHs [14,15,16,17,18]. Several studies have pointed out that highway maintenance workers or people living near highways are exposed to high levels of PM and noise, and as a consequence, are more vulnerable to cardiovascular diseases [19,20,21]. Other studies have found that highway toll booth workers are exposed to high concentration of PM2.5, UFP, and PAHs [22,23,24]. However, relatively few studies have focused on highway police officers, who spend most of their time working near highways. Most previous studies on the PM exposure of police officers have focused on traffic police officers, as summarized in Table 1. One study from India indicated a decrease in lung function among traffic police officers [25]. Another study from Beirut, Lebanon, pointed out that traffic police are more likely to develop cancer than office-working police due to daily traffic exposure [26]. In China, studies have found high PAHs levels among traffic police officers and a higher incidence in lifetime cancer risk [27,28] investigated the dispersion of UFP from the roadway to the surrounding workplaces; however, their study did not measure workplace UFP concentration during different working shifts, especially the size distribution. Size distribution and number concentration are important parameters for epidemiological studies and regulatory purposes; however, even fewer studies have focused on highway police officers’ PM exposure under different traffic volumes and time periods in police stations.
Currently, there are around 2000 highway police officers working near highways in Taiwan. As such, their working environments make them vulnerable to highway traffic PM pollution. Highway police officers typically work long hours (up to 10 h daily), which increases their exposure duration to PM. Moreover, many highway police officers also spend their off hours resting inside the police station, thereby further increasing their exposure to highway PM. In this study, we investigated the PM exposure in a police station immediately adjacent to the Sinying highway toll booth. At the toll booth, only three out of seven northbound and two out of seven southbound lanes used Electronic Toll Collection (ETC), while the rest of the lanes still used manual collection of highway tickets. In the manual collection lanes, passing traffic must stop completely to hand over highway passes to the highway toll collectors, then accelerate back to normal driving speed (60–110 km/h). These changes in driving speed could increase PM emissions, especially in the UFP range [29,30]. It should be noted that vehicles passing through the ETC lanes only have to slow down to 50km/h instead of stopping completely. To investigate how highway traffic affects the PM concentration in the police station, special attention was focused on PM2.5, UFP, and PM-PAHs during periods when the wind was ±45° perpendicular to the highway and the wind speed was ≥0.5 m/s.
Table 1. Overview of past pollutant exposure studies among traffic police officers.
CityPollutantReferences
Jalgaon, IndiaPMresp, NOx, SOx[25]
Beirut, LebanonVOCs[26]
Tianjin, ChinaPAHs[27]
Grenoble, FrancePMresp, PAHs, and aldehydes[31]
Bangkok, ThailandPM2.5 and PM10[32]
Beijing, ChinaParticle and gas phase PAHs[33]
Kathmandu, NepalPM10[34]
Jakarta, IndonesiaPM2.5, PM10, UFP, CO[35]
Milan, ItalyPMresp, CO, Benzene, Toluene, Ethyl-benzene, M-P Xylene, and O Xylene[36]

2. Experimental Section

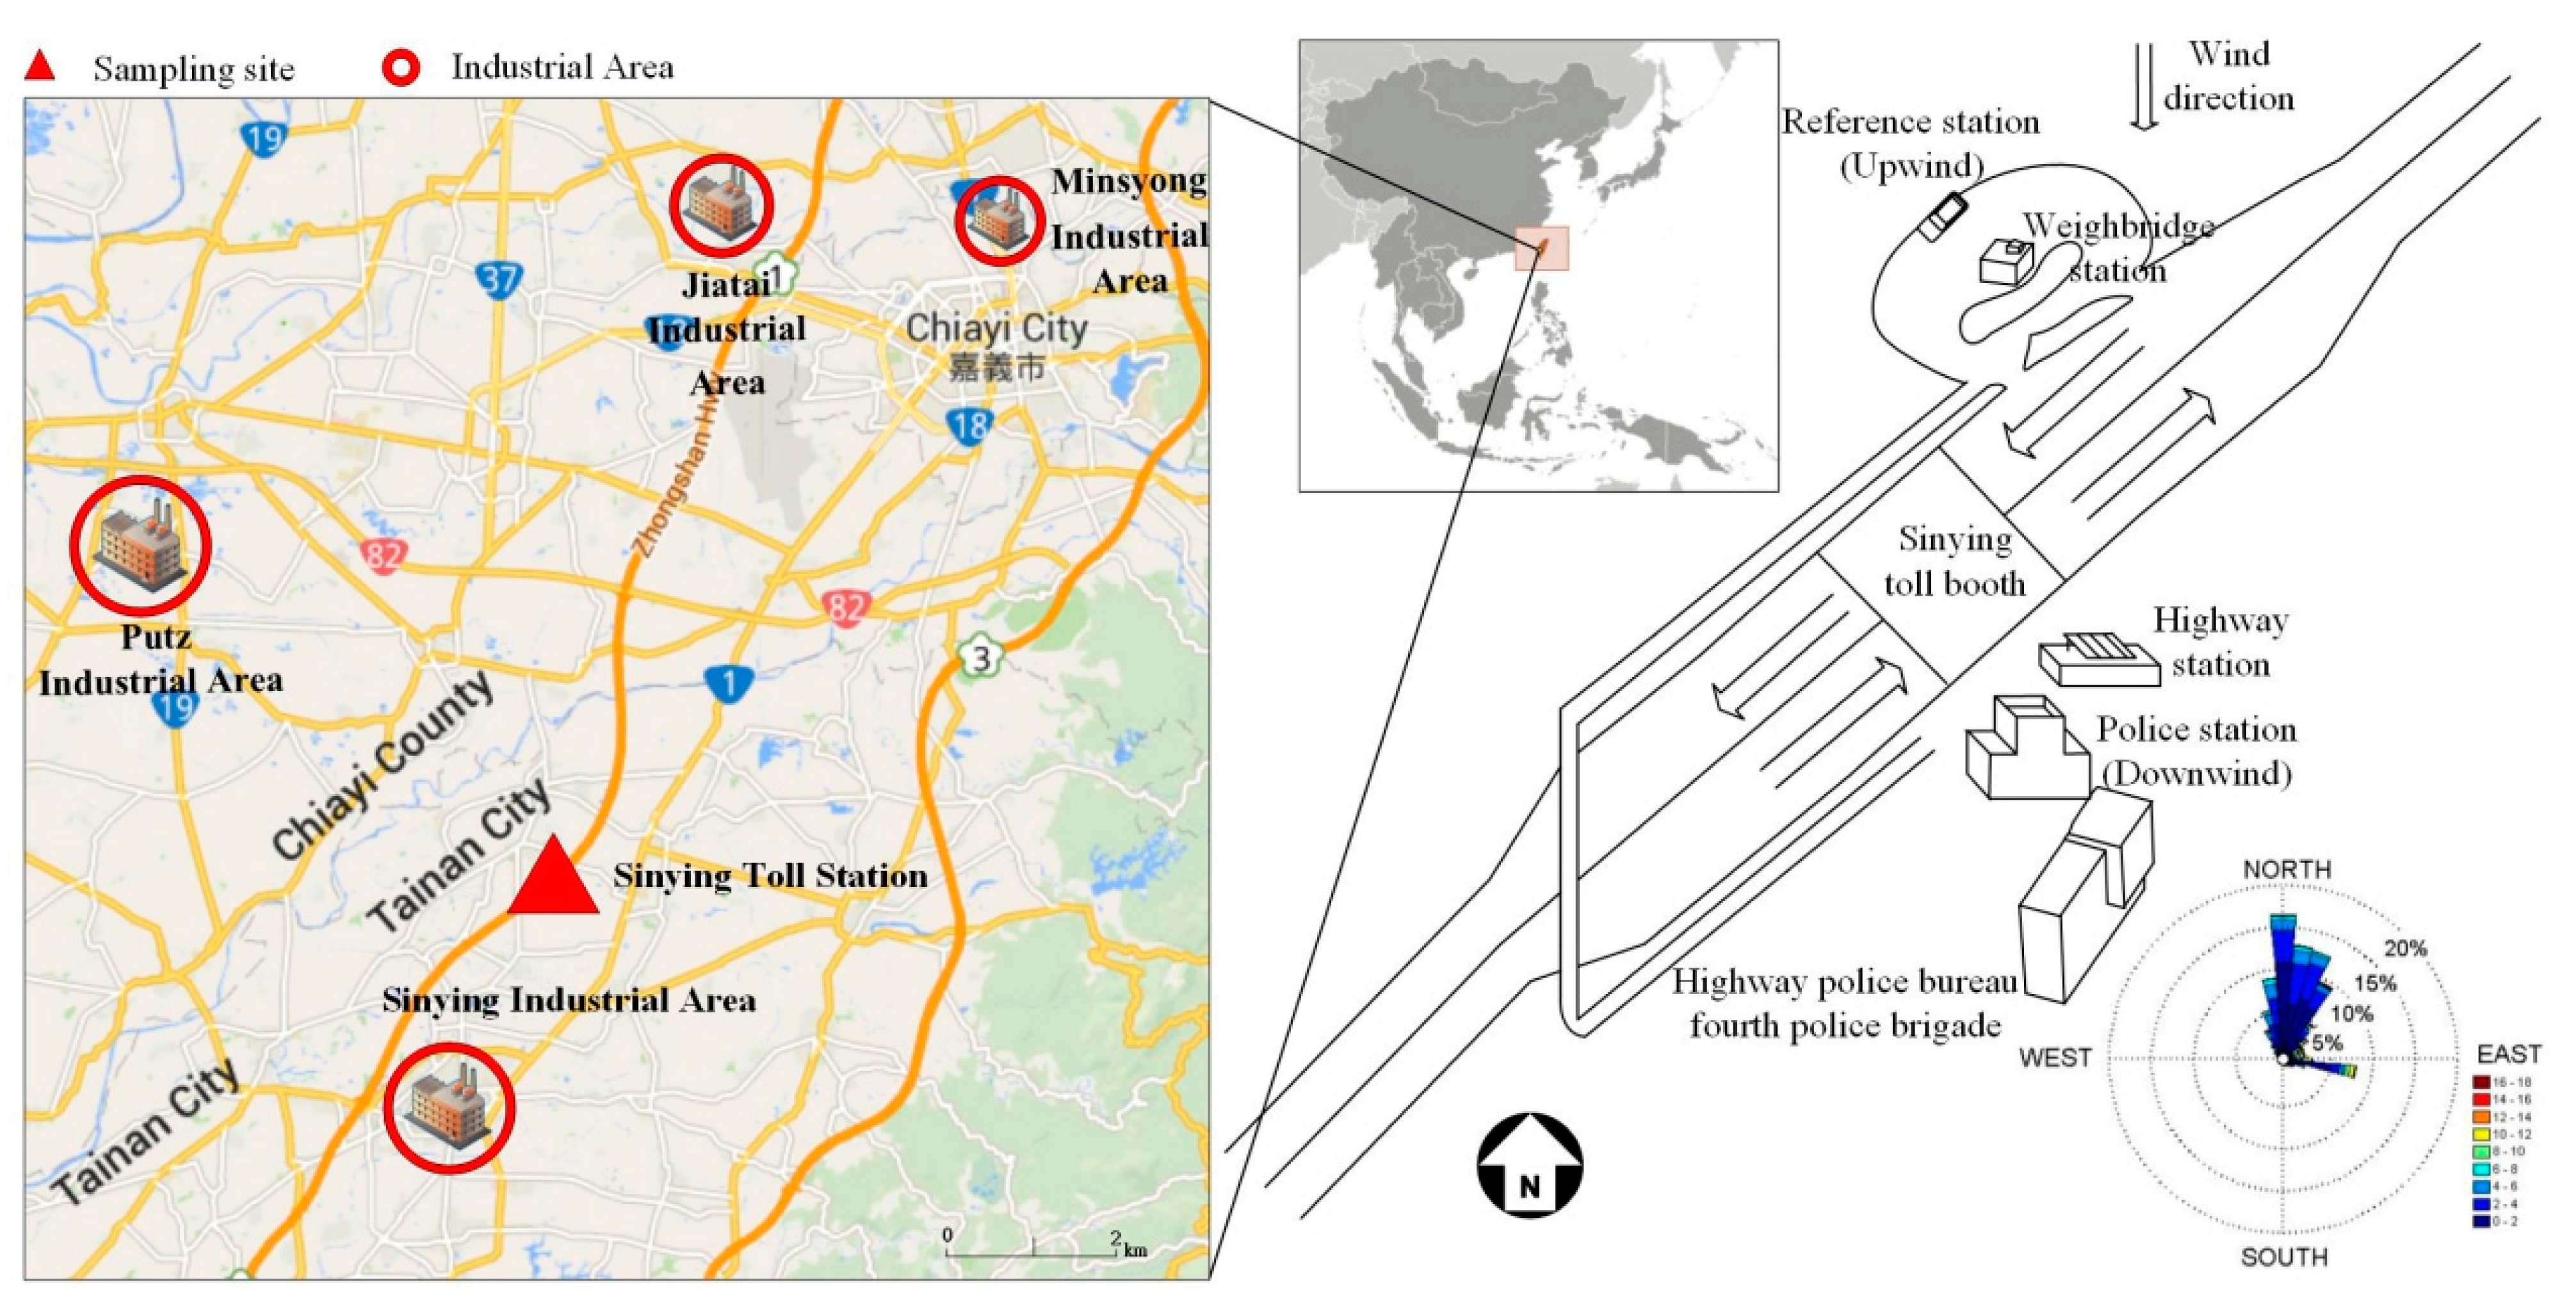
2.1. Description of Sampling Site

To address PM air quality at the police station near the highway toll booth when the wind carries the highway traffic emissions, we selected the fourth police brigade Sinying Branch of the Highway Police Bureau (police station) (23.357948 latitude, 120.339121 longitude) and an upwind reference station for comparison in Tainan, Taiwan. Here, the police station and reference station are located approximately 50 m (south) and 30 m (north) from Highway No. 1, respectively (Figure 1). In addition to highway traffic emissions, there are other PM emission sources from the surrounding industrial areas (such as Putz, Sinying, Minsyong, and Jiatai) which might also contribute to the measured concentrations (Figure 1).
In the Sinying police station, there are 25 police officers working, consisting of one director, four sergeants, and 20 police officers who take turns tending the front desk, which is a four hour shift. Normally, each police officer works for a total of 10 h a day (comprising two to three shifts, with each shift being 2–6 h, and with rest time in between shifts), five days a week. It should be noted that the front door of the police station was left open during the entire sampling period. Thus, the building is naturally ventilated and the penetration factor would be close to one. Furthermore, only one row of bushes approximately 90 cm tall was between the highway and the police station. The Annual Average Daily Traffic (AADT) volume was around 72,000 vehicles based on monitoring at a Sinying toll station, consisting of around 30% and 70% of diesel and gasoline vehicles, respectively. (Taiwan Ministry of Transportation and Construction, 2013).
Figure 1. The left panel shows the surrounding areas of the sampling site at the Sinying police station, Tainan, Taiwan and four nearby industrial areas (Putz, and Sinying, Minsyong, and Jiatai in red circles). The right panel indicates the location of the two sampling sites, namely the police and reference stations in Sinying. A wind rose is also included in the figure.
Ijerph 12 14541 g001

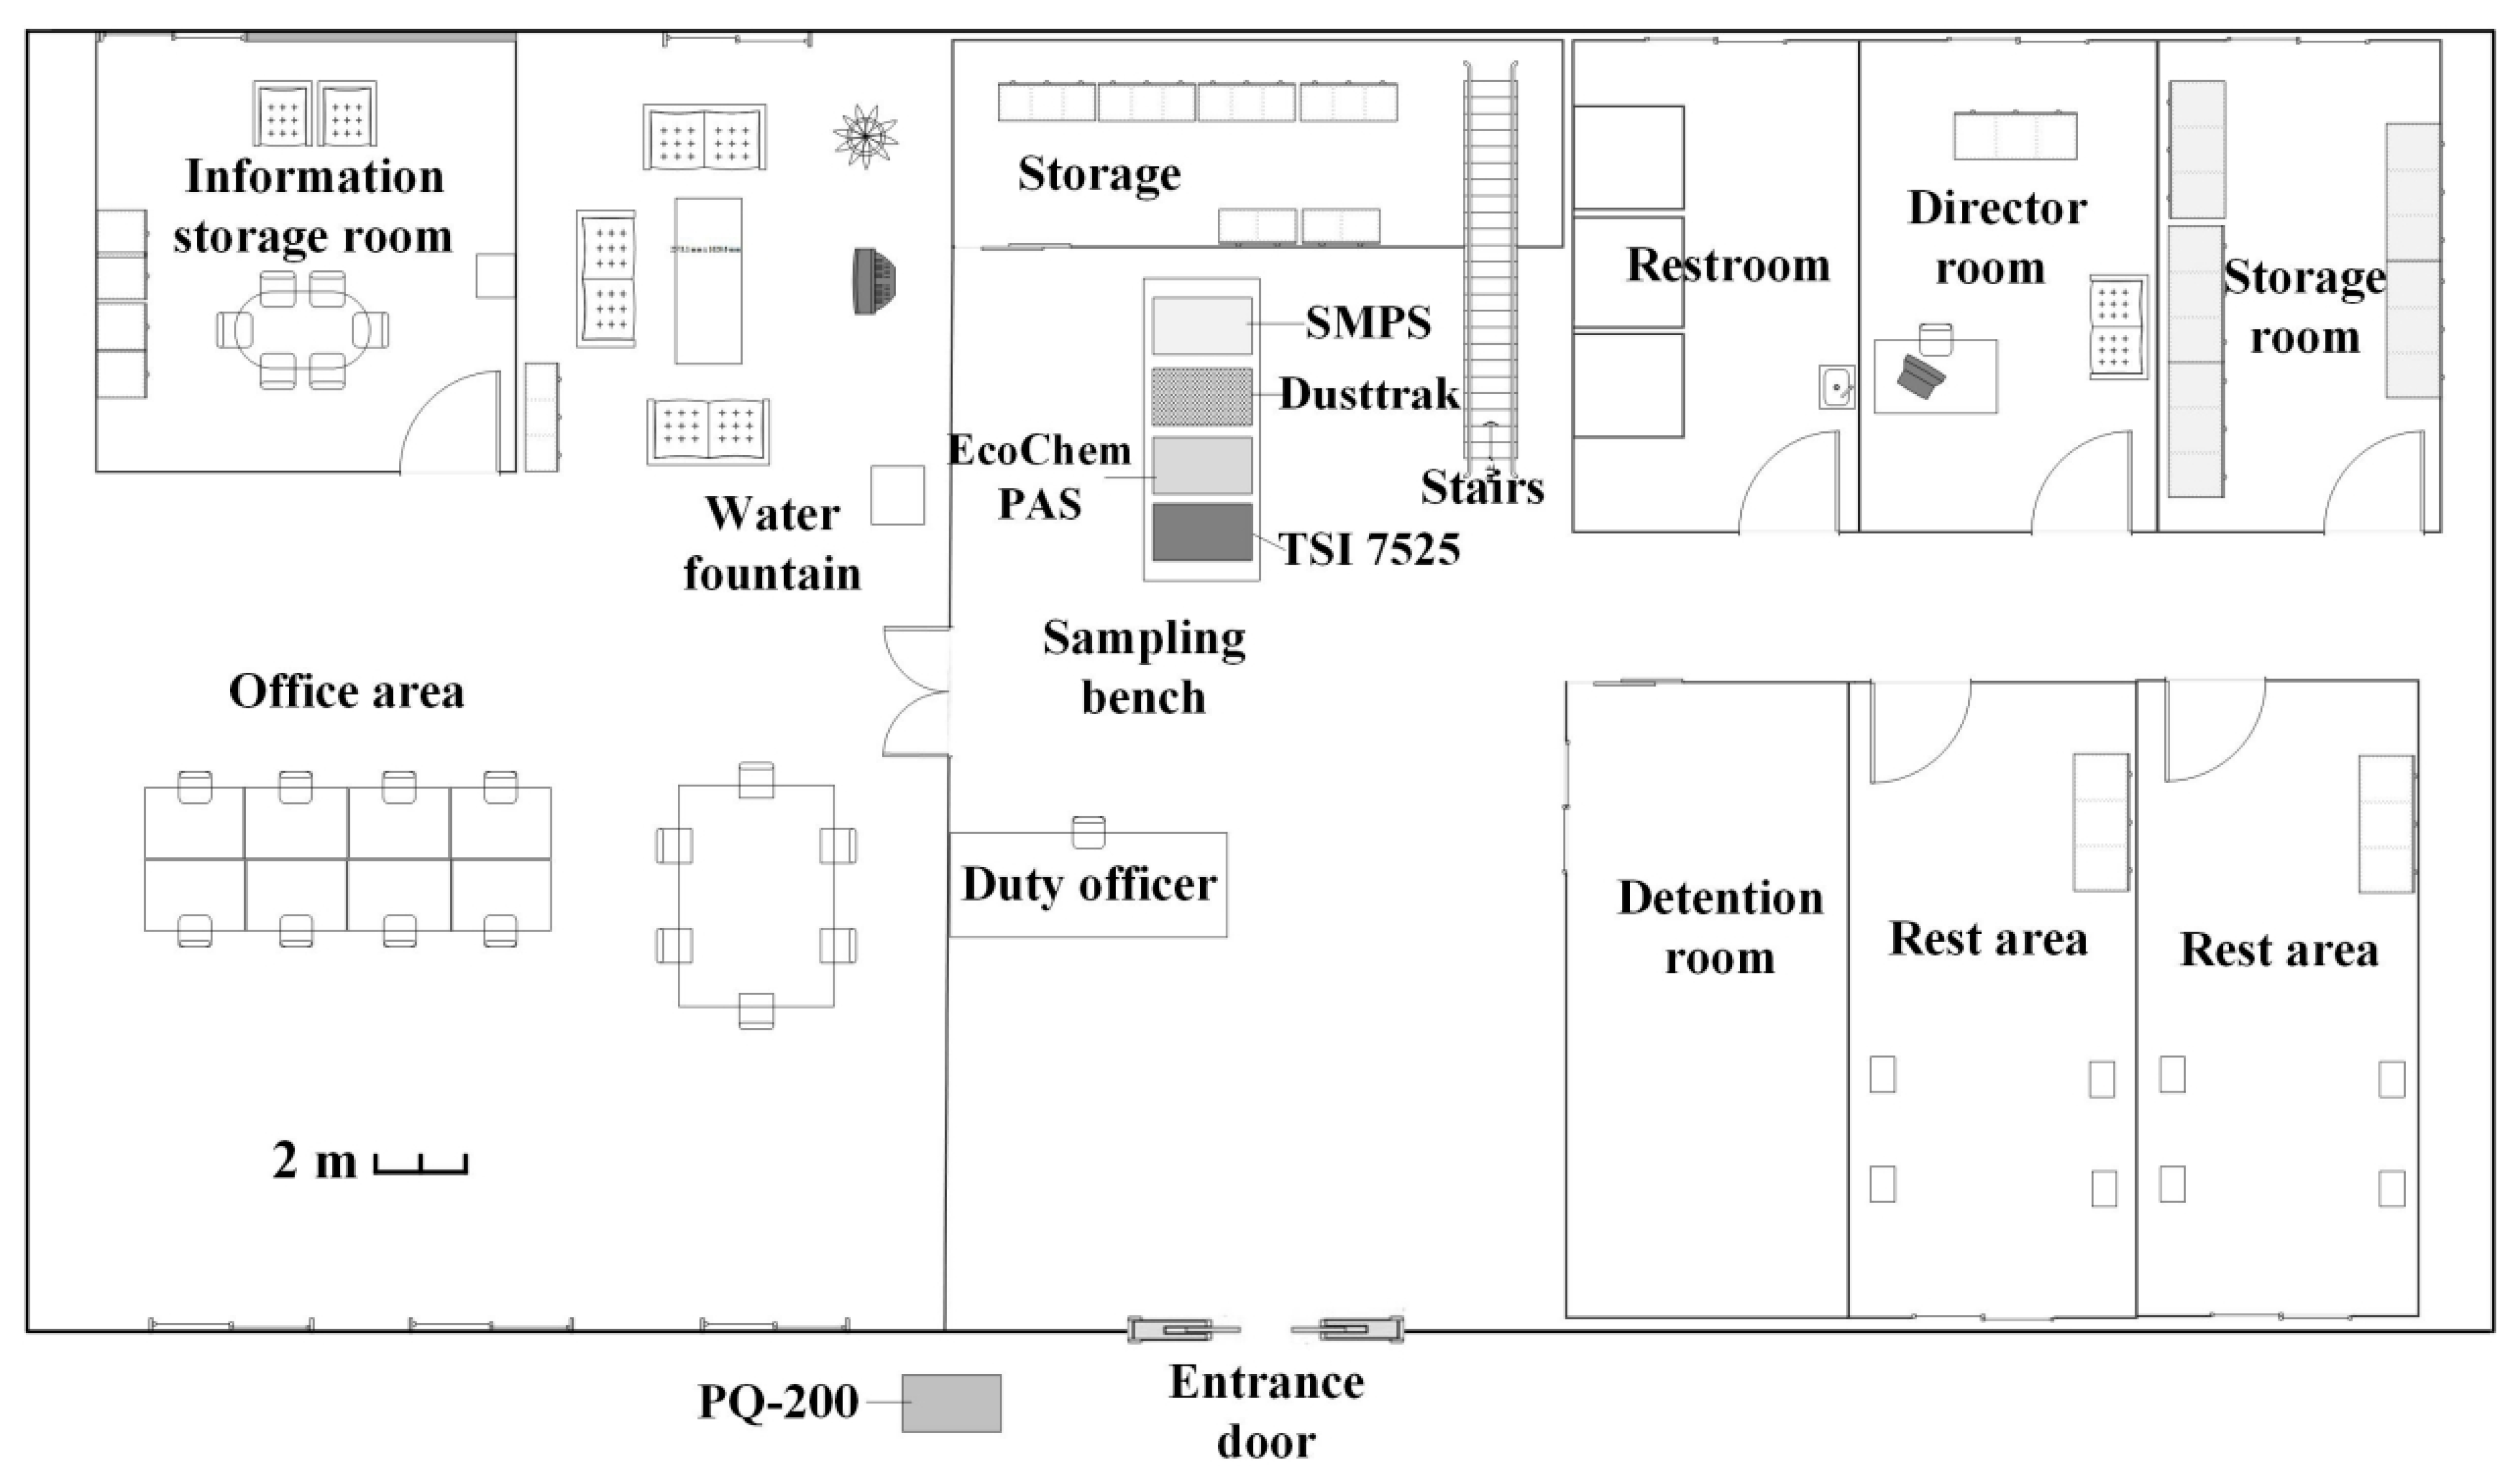
2.1.1. Police Station

We simultaneously investigated the PM concentrations at the Sinying police station (downwind) and reference station (upwind) of the highway from 27 December 2013 1:00 AM to 1 January 2014 12:00 AM (Figure 1). Table 2 lists the instruments and time resolutions of the sampling used at the police station and reference station. For the police station, the inlet of the real-time instruments was made of 1/2ʺ stainless steel and was set 1.5 m above the ground to simulate the workers breathing height. We used a Scanning Mobility Particle Sizer (SMPS, DMA Model 3081 and CPC Model 3787, TSI Inc., Shoreview, MN, USA) to characterize the size distribution and number concentration of the particles ranging from 8 to 224 nm. A layout of the police station floor plan can be seen in Figure 2. The SMPS upscan, downscan, and retrace times were set to 90 s, 30 s, and 30 s, respectively, while the aerosol inlet flow rate was set to 1.5 L/min to avoid diffusional loss between the inlet and sensor. Real-time PM2.5 mass concentration was measured using DustTrak (model 8520, TSI Inc.) with a flow rate of 1.7 L/min. PM-PAHs concentrations were obtained using a PAHs monitor (model PAS2000 CE, EcoChem Analytics, League, TX, USA) with a flow rate set to 2 L/min. We also measured CO2 concentration using an indoor air quality meter (IAQ-Calc, model 7525, TSI Inc.). In addition, we placed an ambient fine particulate sampler (model PQ200, Mesa Labs, Inc., Butler, NJ, USA) 5 m away from the entrance door of the police station. The PQ200 had a flow rate of 16.67 L/min and was used to monitor the outdoor PM2.5 mass concentration. PQ200 samplers are often used for ambient PM2.5 sampling and are in accordance with the US EPA 40CRF Part53. Finally, a video recorder placed at the entrance of the police station was used to record the activities within the police station.
Table 2. Air monitoring instruments and locations.
DataInstrumentSampling IntervalPolice StationReference Station
PM (8–224 nm) physical properties (#/cm3)SMPS150 sindooroutdoor
PM2.5 (μg/m3)PQ20012 h aoutdooroutdoor
PM2.5 (μg/m3)DustTrak852060 sindooroutdoor
CO/CO2 (ppm)IAQ-Calc5 sindooroutdoor
PM-PAHs (ng/m3)PAS 200060 sindooroutdoor
Meteorological dataWatch Dog 255060 sNAoutdoor
a Filter-based measurement; Sampling Interval: time resolution of sampling; NA: not applicable.
Figure 2. Layout of the police station. The instruments were placed on the sampling bench located right behind the duty officer and in front of door.
Ijerph 12 14541 g002

2.1.2. Reference Station

The instruments positioned in the reference station were similar to the ones in the police station. We deployed a van (Hyundai Grand Starex) as the reference station (23.360140 latitude, 120.339510 longitude), which was located in the parking area of the highway weigh station, as shown in Figure 1. The 1/2ʺ stainless steel sampling inlet protruded from the van’s rear window and was approximately 2 m above the ground. In this sampling platform, an SMPS (DMA Model 3081 and CPC Model 3010, TSI Inc.) with an inlet flow rate of 1 L/min was used for particle size distribution (8–224 nm), DustTrak (model 8520, TSI Inc.), PAHs monitor (model PAS2000, EcoChem), and IAQ-Calc (IAQ-Calc, model 7525, TSI Inc.) were also employed to measure PM concentrations. Meteorological data (wind speed, wind direction, temperature, dew point, RH and rainfall) were recorded using a weather station (model Watch Dog 2550, Spectrum Technologies Inc., Aurora IL, USA). A PQ200 for PM2.5 mass concentration was also stationed at the reference station.

2.2. Instrument Inter-Comparison and Quality Assurance

Every other day, we drove to the reference station van to the police station for a side by side inter-comparison of the two sets of instruments. These comparisons continued at least one hour. Upon obtaining the inter-comparison average ratio of the SMPS, we used Savitzky-Golay smoothing [37] to fit the average ratio. Then, we multiplied the reference station SMPS values by this average ratio to better compare the two SMPSs located at the two different places. For the other instruments (PM2.5, PM-PAHs, CO), the average ratios were only a constant value and did not require smoothing. We also synchronized the time of the two sets of instruments during the inter-comparison. In addition, we used a HEPA filter (Pall cooperation, New York, NY, USA) to check for leaks before and after moving the instruments for inter-comparison. It should be noted that the reference station SMPS broke down on 31 December 1:00 AM, while the police station PAS 2000 also did not function from 29 December 12:00 PM–31 December 12:00 AM. Lastly, the weather station broke down on 29 December from 2:37 AM–10:52 PM; therefore, we did not use the data during this period due to unknown wind parameters.

2.3. Data Analysis

PM exposure within the police station under different traffic volumes, types, and working shifts was investigated in this study. Real-time instruments were averaged to 5 min and 4 h for traffic and working shift analysis, respectively. Time dependent figures were used to investigate peaks and diurnal patterns of traffic and pollutants. We further investigated the exposure of the policemen working at the front desk, which follows a 4-h shift system (i.e., 12:00 AM–4:00 AM, 4:00 AM–8:00 AM, 8:00 AM–12:00 PM, 12:00 PM–4:00 PM, 4:00 PM–8:00 PM, and 8:00 PM–12:00 AM). Pearson’s correlation coefficient was used to evaluate the association between variables.

3. Results

In this section, we first present the overall PM exposure (PM2.5, UFP, and PM-PAHs) at the police station and reference station; then, we discuss the PM exposure under different working shifts. Results of the particle size distribution and number concentration from the SMPS are also presented for different working shifts. Finally, we discuss how different traffic flow patterns affect the PM concentration within the police station.

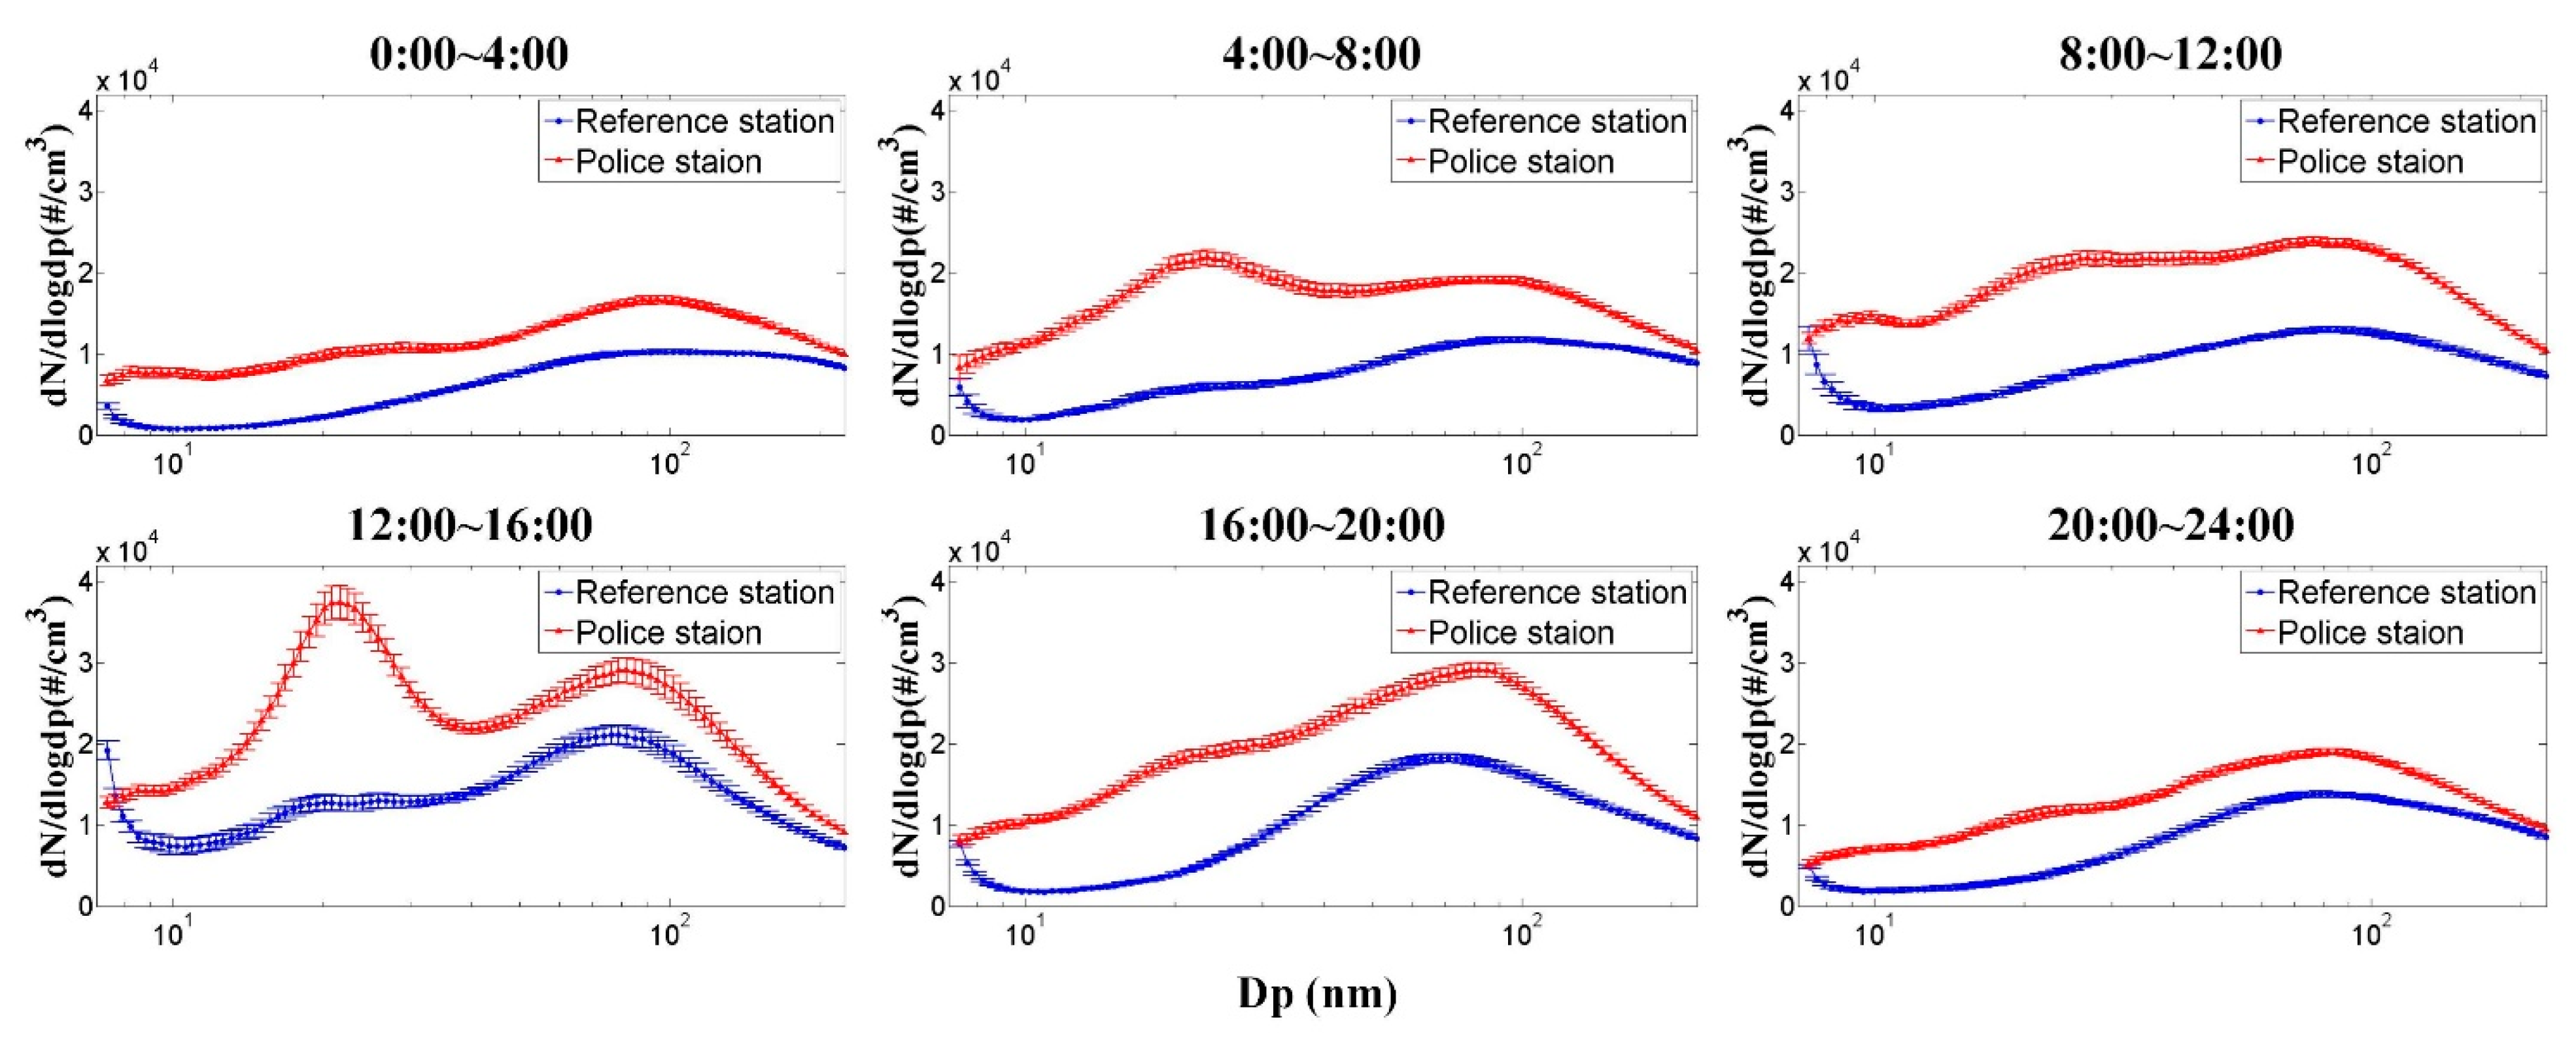
3.1. Police Station and Reference Station Overall PM Exposure

Table 3 shows the descriptive statistics for the PM2.5, UFP, and PM-PAHs concentrations, as well as CO2, wind speed and traffic volumes during the measurement period for the police station and reference station. Here, PM2.5 mass, UFP number, and PM-PAHs concentrations obtained from the police station can on average be 1.13, 2.17, and 5.81 times higher than the upwind reference station, respectively. The mean PM2.5 concentrations from the DustTrak measurements at the police station and reference station were generally around 182 μg/m3 and 161 μg/m3, respectively. A high UFP number concentration (up to 9.18 × 10⁴ #/cm3) from the SMPS measurements with an average value of 1.90 × 10⁴ #/cm3 was observed in the police station, while the average concentration at the reference station was around 8.75 × 10³ #/cm3. The PM-PAHs concentration at the police station and reference station showed averages of around 55 ng/m3 and 9 ng/m3, respectively. It should be noted that the PAS-2000 sampler may respond differently to individual species, resulting in un-proportionality of sampler signals to the concentration of individual species [38].
Table 3. Statistical descriptions of PM2.5, UFP, PM-PAHs CO2, WS and Traffic volume obtained from the police station (PS), reference station (RS), and toll booth.
PM2.5 (μg·m−3)UFP dN/dlogdp (#/cm3)PM-PAHs (ng·m−3)CO2 (ppm)WS (m·s−1)Traffic (Vehicle/5 min)
RSPSRSPSRSPSRSPSRSToll Booth
Minimum35602.28 × 1032.94 × 1030.01.10462465.7026
1st Quartile1121385.73 × 1031.27 × 1042.029.5490503.20.56108
Median1361678.38 × 1031.79 × 1045.047.5500514.92.22251
Mean1611828.75 × 1031.90 × 1049.4354.8510515.63.09232
3rd Quartile1762101.05 × 1042.35 × 10412.073.1526526.64.45325
Maximum4474442.64 × 1049.18 × 104427.0255.4636689.016.7517
Standard deviation79773.90 × 1038.94 × 10315.034.323173.15121
The CO2 concentration in the police station was slightly higher than the reference station, which could be attributed to emission sources and indoor air pollution. However, the maximum CO2 concentration of 689 ppm was still lower than Taiwan’s indoor air quality standards (1000 ppm for an 8-h average). The average wind speed was around 3 m/s, indicating that the wind was often light, not stagnant (<0.5 m/s), during the measurement period.

3.2. GLM Statistical Analysis of PM Exposure Level in the Police Station

Here we use repeated measures generalized linear model (GLM) to find the parameters that best describes the PM exposure level in the police station. We focus on the whole measurement period and during conditions when the wind is from the highway and the wind speed is larger or equal to 0.5 m/s.

3.2.1. PM Exposure Level during the Whole Measurement Period

We first examine the parameters affecting the PM2.5, UFP, and PM-PAHs concentration in the police station during the whole measurement period. Meteorological data (WS, WD, T, and RH), traffic data (car and truck volumes), and time of the day (i.e., 12:00 AM–4:00 AM, 4:00 AM–8:00 AM, 8:00 AM–12:00 PM, 12:00 PM–4:00 PM, 4:00 PM–8:00 PM, and 8:00 PM–12:00 AM, which has been categorized to coincide with working shift) were used as parameter inputs. Wind direction (WD) was derived into 12 classes, each with 30 degrees of amplitude: North (N), North-Northeast (NNE), East-Northeaster (ENE), East (E), East-Southeast (ESE), South-Southeast (SSE), South (S), South-Southwest (SSW), West-Southwest (WSW), West, West-Northwest (WNW), and North-Northwest (NNW). PM2.5 was significantly affected (p < 0.0001, R2 = 0.67) by WS, WD, time of day, and car volumes. UFP was significantly influenced by WS, WD, time of day, and truck volumes “(p < 0.001, R2 = 0.34). PM-PAHs was significantly affected by WD, time of day, and truck volumes (p < 0.0001, R2 = 0.46).

3.2.2. PM Exposure Level during Downwind Conditions

During downwind conditions and when the wind speed is larger or equal to 0.5 m/s, we examine how meteorological data (WS, T, and RH), traffic data (car and truck volumes), and time of the day (grouped to coincide with working shift) affects the PM2.5, UFP, and PM-PAHs concentration in the police station. PM2.5 was significantly affected (p < 0.0001, R2 = 0.21) by WS, time of day, car volumes, T, and RH. UFP was significantly influenced (p < 0.0001, R2 = 0.45) by WS, time of day, and truck volumes. PM-PAHs was only significantly affected by time of day (p < 0.0001, R2 = 0.34). We will further discuss the effects of time of day (categorized to coincide with working shift) and traffic on PM2.5, UFP, and PM-PAHs in the following section.

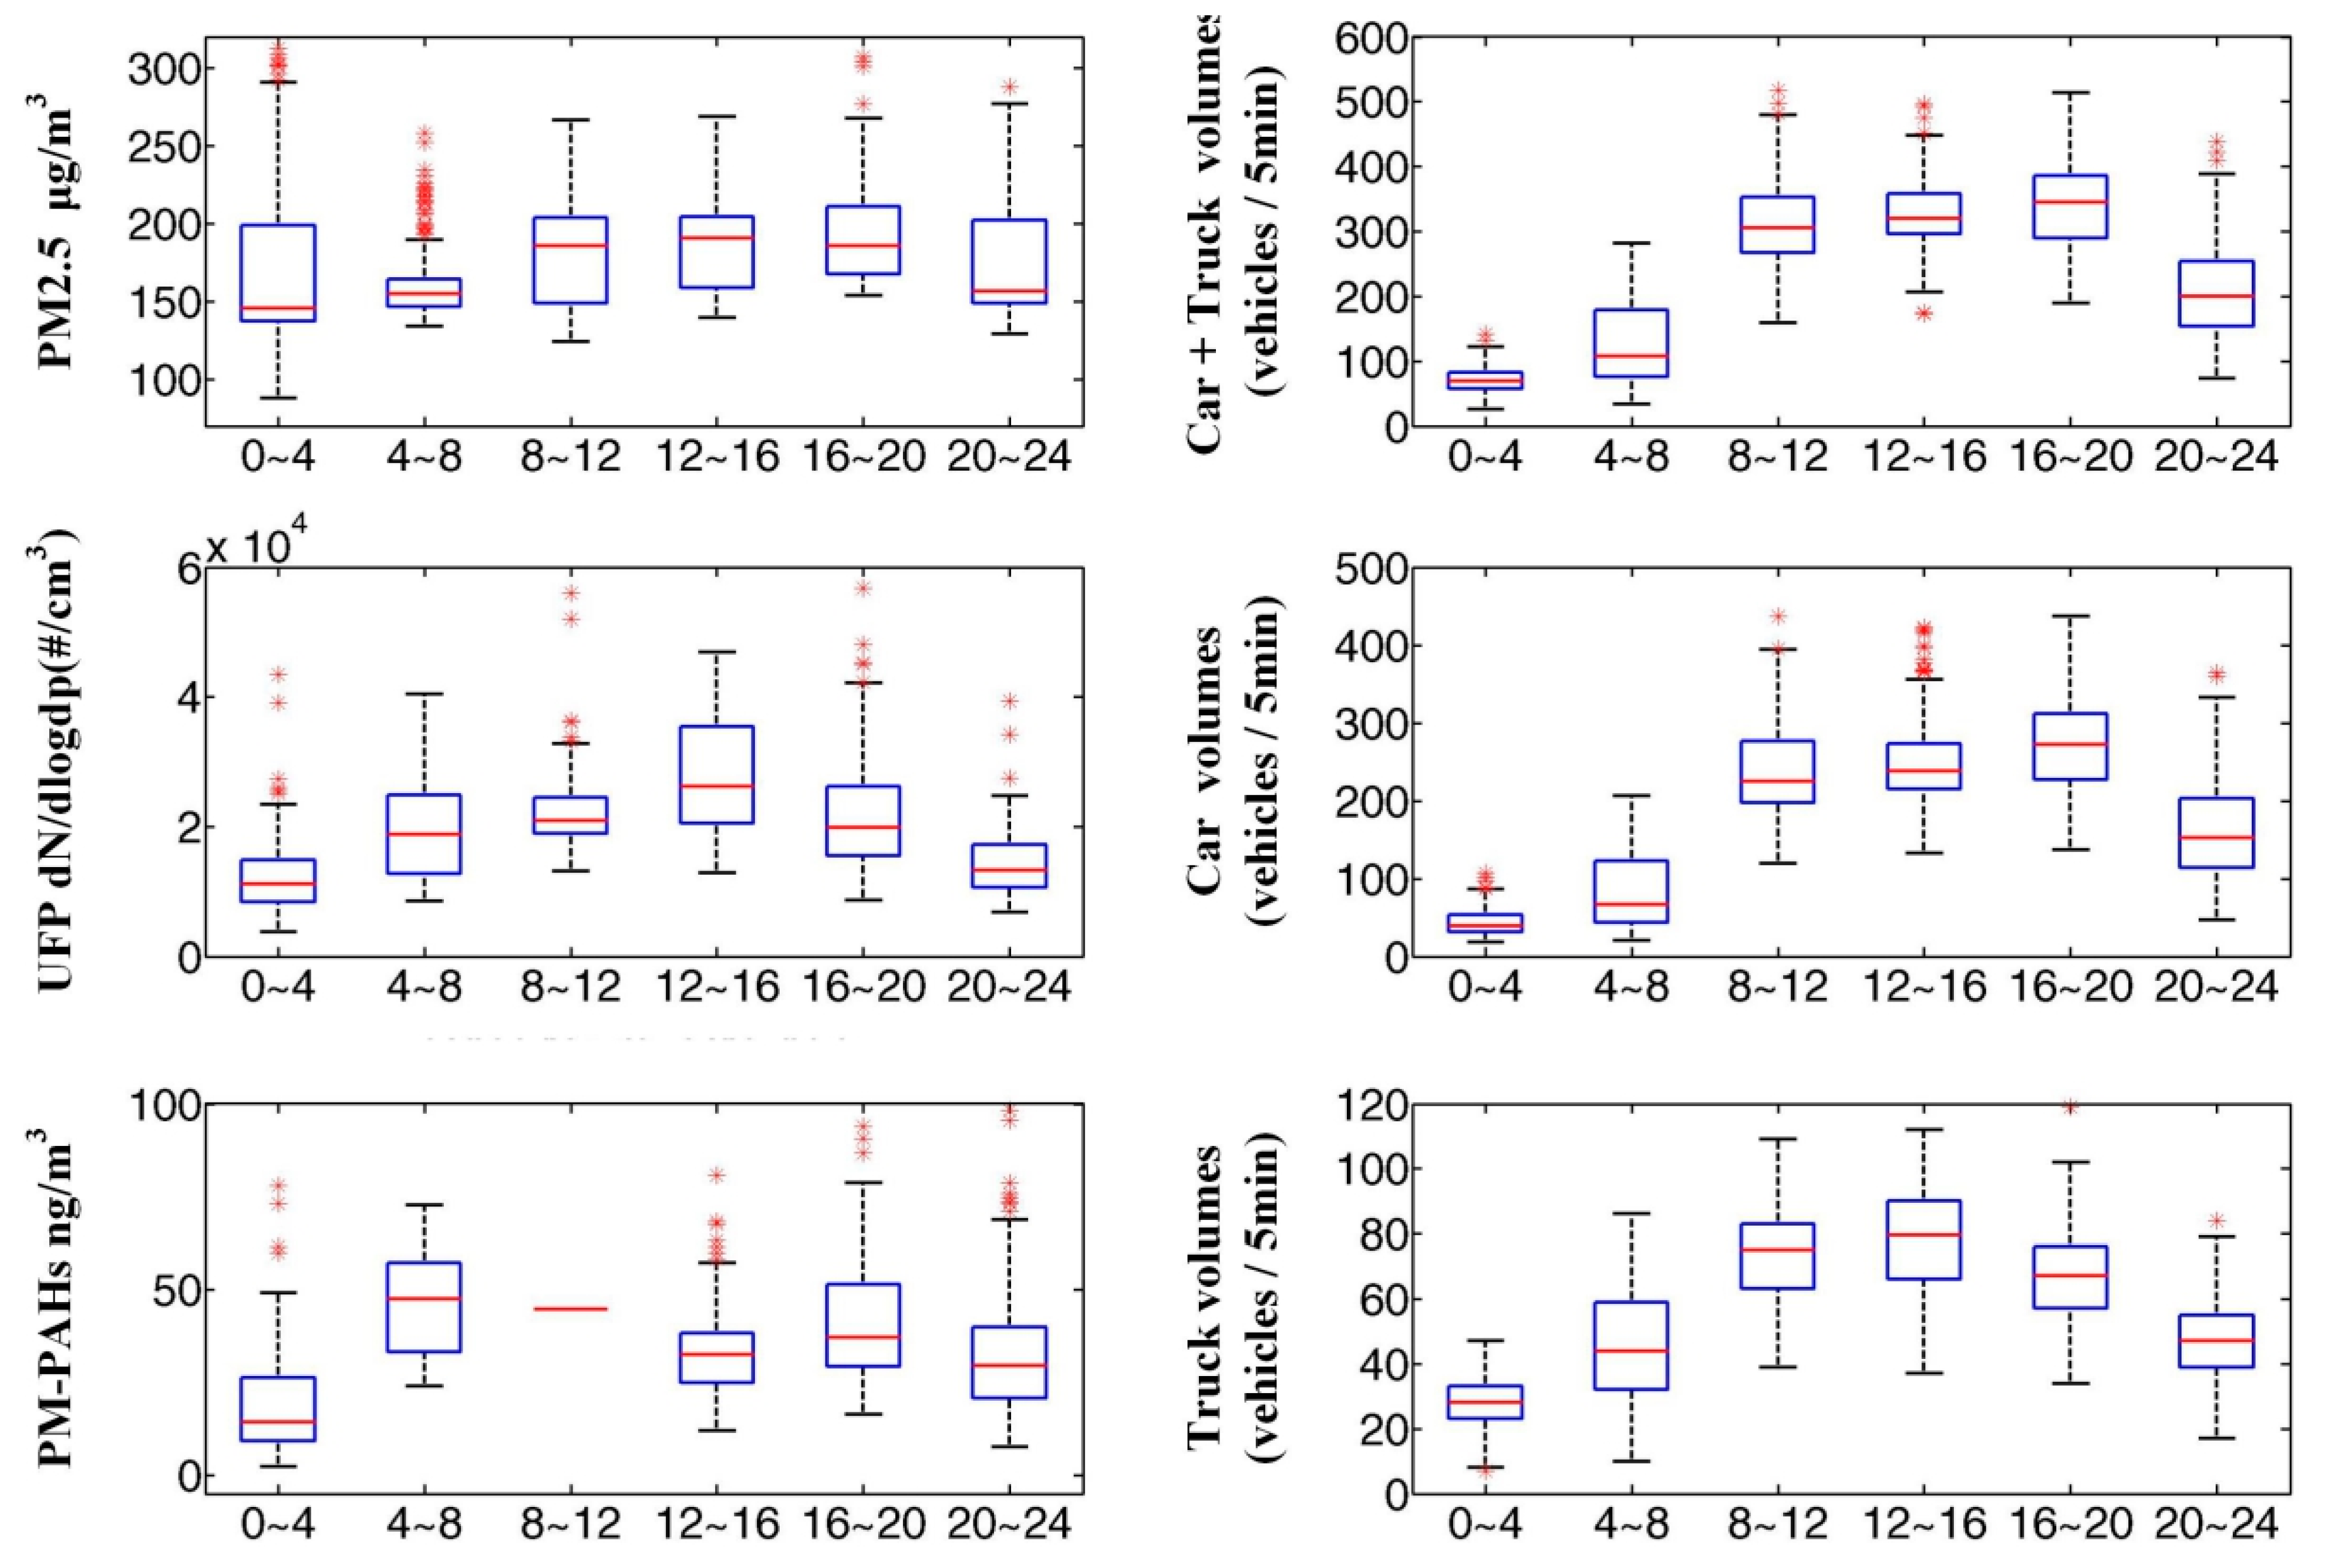
3.3. Police Station PM Exposure on Working Shifts

Figure 3 shows the diurnal pattern of traffic volume, PM2.5, UFP, and PM-PAHs. Notice that the traffic volume for cars has two peaks (8:00 AM–12:00 PM and 4:00 PM–8:00 PM) while the truck volume has only one peak (12:00 PM–4:00 PM). The diurnal pattern of PM2.5 concentrations at the police station indicates that a higher PM2.5 concentration occurs during the daytime (8:00 AM–8:00 PM) as compared to nighttime (8:00 PM–8:00 AM) due to higher daytime traffic volumes. Higher daytime PM2.5 concentrations were also found in other indoor workplaces and near-roadway environments [39,40]. The UFP concentrations in the police station during the daytime was higher than the nighttime concentrations (Figure 3), which is also attributable to higher traffic volumes during the daytime. For the PM-PAHs diurnal pattern, two peaks occurred throughout the day, one at 04:00–08:00 and another at 16:00–20:00. This was attributed to the morning and afternoon traffic rush hours. It should be noted that data from 08:00 to 12:00 was insufficient for drawing the box and whiskers in the boxplot. Further discussion on the contribution of PM from traffic is presented in Section 3.4.
Figure 4 indicates the average particle size distribution and number concentration (8–224 nm) during different working shifts obtained from the police station and reference station. As can be seen, there are peaks at around 20–30 nm at the police station, but not at the reference station when the wind blew from the highway, especially during the daytime hours. This peak may originate from vehicle tailpipe emissions, which usually have a number median diameter of around 20 nm [41,42]. Furthermore, the peak is more obvious during the daytime as compared to nighttime due to the higher daytime traffic volume.
Figure 3. Diurnal pattern of the traffic volume, PM2.5, UFP, and PM-PAHs in the police station during different working shifts. The box represents the 25th and 75th percentiles while the whiskers represent the 5th and 95th percentiles.
Ijerph 12 14541 g003
Figure 4. Average size distribution and number concentration from SMPS data for different four-hour working shifts at the police station and reference station. The error bar represents one standard deviation.
Ijerph 12 14541 g004

3.4. Inter-Correlation of Police Station PM Concentration

The scatter plot of the traffic volume with PM2.5, UFP, and PM-PAHs concentrations for the police station is shown in Figure 5. In general, UFP measurements of the police station had high correlations (R2) using loess curve fit for car plus truck, car, and truck traffic volumes, followed by PM-PAHs and PM2.5. The higher R2 observed for the UFP and PM-PAHs measurements are attributed to direct vehicle emissions. Vehicle emitted UFP are characterized by large number concentrations, but small mass concentrations. Therefore, poor correlations between PM2.5 and traffic volume in the police station were expected. Studies have also indicated that UFP contribution to total PM mass concentration in near-roadway environments is minor [43]. Moreover, trucks with diesel engines could result in higher correlations with UFP than cars and overall traffic in this study. Previous studies have also demonstrated that the trucks with diesel engines emit more UFP, while most cars with gasoline engines release less PM2.5, UFP, and PM-PAHs [44,45].
Figure 5. Inter-correlation between the vehicle data and pollution measured in the police station. The upper right corner shows the coefficient of determination and the red lines in the lower left corner represent loess curves.
Ijerph 12 14541 g005
Figure 6 shows the time series plot of the traffic volume and UFP for police station measurements during the sampling period. As shown, UFP concentrations increase during traffic rush hours when the wind blows from the highway. This is also true for PM-PAHs, for which the trend is similar with traffic volume. Thus, the source of the UFP and PM-PAHs is confirmed to mainly originate from the highway vehicle emissions. In addition, the number of incidental peaks was greater in the police station as compared to the reference station, which could be attributed to smoking near the police station entrance or gas stoves used for boiling water in the police station.
Figure 6. Time series plot of the UFP and vehicle volume throughout the study period. Periods of the color bars (light blue and pink) were not used for analysis since they indicate the wind direction was not from the highway or the data was missing.
Ijerph 12 14541 g006

4. Discussion

4.1. PM Exposure Comparison with Previous Research

PM2.5 concentrations from DustTrak are much higher than the Taiwan indoor and outdoor air quality standard, which states that the PM2.5 24-h averages should both be below 35 μg/m3. However, it should be noted that previous studies have shown that the DustTrak can overestimate the PM mass concentration by a factor of 3 [46,47,48]. The PQ200, set in front of the police station and at the reference station, registered an average PM2.5 concentration of around 61 μg/m3 and 48 μg/m3, respectively. Therefore, we may be overestimating the PM2.5 exposure at the police station from the DustTrak measurements.
These measured UFP concentrations were in accordance with other studies with near-roadway measurements, for which high UFP concentrations (104~105 #/cm3) were also reported [49,50]. Moreover, UFP diurnal trends were similar to previous studies from Beijing, China [51] and Helsinki, Finland [52].

4.2. Health Risk Implications

Police workers as well as people who are living busy roadways are exposed to high concentration of air pollution such as PM2.5, UFP, and PM-PAHs, especially people who are living in the downwind section. If possible, future urban planning should consider the location layout of busy roadways and residential areas to lower the public’s exposure to hazardous air pollutants. The public should also be informed of methods that can be taken to protect them from busy roadway air pollution. Methods include understanding and avoiding the air pollutant peak hours, applying ventilation control, and using respiratory protection devices.

5. Conclusions

Applying real-time instruments can provide “qualitative” exposure concentrations of particles for highway police officers during various working shifts. Police officers working at police stations near busy highways are exposed to high PM concentrations, not only during their duty shifts, but also while spending time resting in the police station. High PM2.5 concentrations consistently over 100 μg/m3 were observed in this study using the DustTrak at both the police station and reference station, while PM2.5 levels from PQ-200 at the police station (61 μg/m3) and reference station (48 μg/m3) were above daily air quality standards (35 μg/m3). Moreover, high UFP concentrations up to 9.18 × 10⁴ #/cm3 were observed in the police station. Traffic volume was found to best correlate with UFP, followed by PM-PAHs and PM2.5 in the police station. As of the time of this study, many workplace UFP exposure limits are not well regulated globally, and only specific UFP species such as carbon nanotubes and titanium oxide are regulated by EU legislation and US Occupational Safety and Health Administration (OSHA). Mean PM-PAHs concentrations were 54.8 ng/m3 in the police station, while PM-PAHs concentrations, on average, were 9.43 ng/m3 at the reference station. The highest PM2.5 and UFP concentrations were observed during the 12:00 PM–4:00 PM shift. Given the high PM2.5, UFP, and PM-PAHs concentrations in the police station, more attention should be devoted to lowering the PM exposure. Respiratory protection devices are recommended at peak traffic hours, especially when the wind blows from the highway. Further toxicological and epidemiological studies are also needed to clarify the effect of PM on workers employed near busy roadways. One major limitation of this study is the use of the DustTrak and PAS 2000 instruments: although they can capture real-time pollution concentrations, the measured values require further verification with federal reference methods. Finally, while the construction work of the ETC was still ongoing during the time of the study, the effect of ETC on reducing vehicle emissions requires further study.

Acknowledgments

Authors greatly acknowledges the support from the Taiwan National Health Research Institutes (NHRI) under grant No. 03A1-EHSP03-023. The authors also wish to thank the financial support from the Taiwan Environmental Protection Agency and the Ministry of Science and Technology under grant Number NSC 102-EPA-F-002-001. We also appreciate the Taiwan Freeway Bureau and the National Highway Police Bureau for their help during the sampling period. A special thanks to the National Highway Police Bureau’s Fourth Police Brigade Chien-You Lin, Yen-Yu Lin, and Ming-Kun Shen. Special thanks to Mu-Jean Chen for help on statistical analysis. The authors are also grateful for the support from Wei-Yen Tu, Wei-Ting Chen, Yue-Tao Lee, Yu-Hsiu Yu, and I-Chun Hsieh during the study.

Author Contributions

Yu-Cheng Chen initiated this study and was responsible for the experimental work, data analysis, and paper writing. Chin-Kai Hsu analyzed the data and worked on the paper writing. Chia C. Wang assisted with the experimental work and data analysis. Perng-Jy Tsai provided valuable inputs and helped structure the study. Mei-Ru Chen contributed to the study design, experimental work, and paper writing. Ming-Yeng Lin coordinated this project, and oversaw the experimental study and paper writing.

Conflicts of Interest

The authors declare no conflict of interest.

References

  1. Pope, C.A.; Dockery, D.W. Health effects of fine particulate air pollution: Lines that connect. J. Air Waste Manag. Assoc. 2006, 56, 709–742. [Google Scholar] [CrossRef] [PubMed]
  2. Fang, S.C.; Cassidy, A.; Christiani, D.C. A systematic review of occupational exposure to particulate matter and cardiovascular disease. Int. J. Environ. Res. Public Health 2010, 7, 1773–1806. [Google Scholar] [CrossRef] [PubMed]
  3. Laden, F.; Schwartz, J.; Speizer, F.E.; Dockery, D.W. Reduction in fine particulate air pollution and mortality—Extended follow-up of the harvard six cities study. Am. J. Respir. Crit. Care Med. 2006, 173, 667–672. [Google Scholar] [CrossRef] [PubMed]
  4. Dockery, D.W.; Pope, C.A.; Xu, X.P.; Spengler, J.D.; Ware, J.H.; Fay, M.E.; Ferris, B.G.; Speizer, F.E. An association between air-pollution and mortality in 6 united-states cities. N. Engl. J. Med. 1993, 329, 1753–1759. [Google Scholar] [CrossRef] [PubMed]
  5. Donaldson, K.; Brown, D.; Clouter, A.; Duffin, R.; MacNee, W.; Renwick, L.; Tran, L.; Stone, V. The pulmonary toxicology of ultrafine particles. J. Aerosol Med. Depos. Clear. Eff. Lung 2002, 15, 213–220. [Google Scholar] [CrossRef] [PubMed]
  6. Oberdorster, G. Pulmonary effects of inhaled ultrafine particles. Int. Arch. Occup. Environ. Health 2001, 74, 1–8. [Google Scholar] [CrossRef] [PubMed]
  7. Chang, C.C.; Chen, C.Y.; Chiu, H.F.; Dai, S.X.; Liu, M.Y.; Yang, C.Y. Elastases from inflammatory and dendritic cells mediate ultrafine carbon black induced acute lung destruction in mice. Inhal. Toxicol. 2011, 23, 616–626. [Google Scholar] [CrossRef] [PubMed]
  8. Oberdorster, G.; Oberdorster, E.; Oberdorster, J. Nanotoxicology: An emerging discipline evolving from studies of ultrafine particles. Environ. Health Perspect. 2005, 113, 823–839. [Google Scholar] [CrossRef] [PubMed]
  9. Garcia-Suastegui, W.A.; Huerta-Chagoya, A.; Carrasco-Colin, K.L.; Pratt, M.M.; John, K.; Petrosyan, P.; Rubio, J.; Poirier, M.C.; Gonsebatt, M.E. Seasonal variations in the levels of PAH-DNA adducts in young adults living in Mexico city. Mutagenesis 2011, 26, 385–391. [Google Scholar] [CrossRef] [PubMed]
  10. Gunter, M.J.; Divi, R.L.; Kulldorff, M.; Vermeulen, R.; Haverkos, K.J.; Kuo, M.M.; Strickland, P.; Poirier, M.C.; Rothman, N.; Sinha, R. Leukocyte polycyclic aromatic hydrocarbon-DNA adduct formation and colorectal adenoma. Carcinogenesis 2007, 28, 1426–1429. [Google Scholar] [CrossRef] [PubMed]
  11. Zhang, Y.X.; Tao, S.; Shen, H.Z.; Ma, J.M. Inhalation exposure to ambient polycyclic aromatic hydrocarbons and lung cancer risk of Chinese population. Proc. Natl. Acad. Sci. USA 2009, 106, 21063–21067. [Google Scholar] [CrossRef] [PubMed]
  12. Lewtas, J.; Lewis, C.; Zweidinger, R.; Stevens, R.; Cupitt, L. Sources of genotoxicity and cancer risk in ambient air. Pharmacogenetics 1992, 2, 288–296. [Google Scholar] [CrossRef] [PubMed]
  13. Masiol, M.; Hofer, A.; Squizzato, S.; Piazza, R.; Rampazzo, G.; Pavoni, B. Carcinogenic and mutagenic risk associated to airborne particle-phase polycyclic aromatic hydrocarbons: A source apportionment. Atmos. Environ. 2012, 60, 375–382. [Google Scholar] [CrossRef] [Green Version]
  14. Mantis, J.; Chaloulakou, A.; Samara, C. PM10-bound polycyclic aromatic hydrocarbons (PAHs) in the greater area of Athens, Greece. Chemosphere 2005, 59, 593–604. [Google Scholar] [CrossRef] [PubMed]
  15. Zhu, Y.F.; Hinds, W.C.; Kim, S.; Sioutas, C. Concentration and size distribution of ultrafine particles near a major highway. J. Air Waste Manag. Assoc. 2002, 52, 1032–1042. [Google Scholar] [CrossRef] [PubMed]
  16. Kleeman, M.J.; Schauer, J.J.; Cass, G.R. Size and composition distribution of fine particulate matter emitted from motor vehicles. Environ. Sci. Technol. 2000, 34, 1132–1142. [Google Scholar] [CrossRef]
  17. Hagler, G.S.W.; Lin, M.Y.; Khlystov, A.; Baldauf, R.W.; Isakov, V.; Faircloth, J.; Jackson, L.E. Field investigation of roadside vegetative and structural barrier impact on near-road ultrafine particle concentrations under a variety of wind conditions. Sci. Total Environ. 2012, 419, 7–15. [Google Scholar] [CrossRef] [PubMed]
  18. Batterman, S.; Ganguly, R.; Harbin, P. High resolution spatial and temporal mapping of traffic-related air pollutants. Int. J. Environ. Res. Public Health 2015, 12, 3646–3666. [Google Scholar] [CrossRef] [PubMed]
  19. Meier, R.; Cascio, W.E.; Danuser, B.; Riediker, M. Exposure of highway maintenance workers to fine particulate matter and noise. Ann. Occup. Hyg. 2013, 57, 992–1004. [Google Scholar] [CrossRef] [PubMed]
  20. Meier, R.; Cascio, W.E.; Ghio, A.J.; Wild, P.; Danuser, B.; Riediker, M. Associations of short-term particle and noise exposures with markers of cardiovascular and respiratory health among highway maintenance workers. Environ. Health Perspect. 2014, 122, 726–732. [Google Scholar] [CrossRef] [PubMed]
  21. Chung, M.; Wang, D.D.; Rizzo, A.M.; Gachette, D.; Delnord, M.; Parambi, R.; Kang, C.M.; Brugge, D. Association of PNC, BC, and PM2.5 measured at a central monitoring site with blood pressure in a predominantly near highway population. Int. J. Environ. Res. Public Health 2015, 12, 2765–2780. [Google Scholar] [CrossRef] [PubMed]
  22. Cheng, Y.H.; Huang, C.H.; Huang, H.L.; Tsai, C.J. Concentrations of ultrafine particles at a highway toll collection booth and exposure implications for toll collectors. Sci. Total Environ. 2010, 409, 364–369. [Google Scholar] [CrossRef] [PubMed]
  23. Lai, C.H.; Liou, S.H.; Shih, T.S.; Tsai, P.J.; Chen, H.L.; Chang, Y.C.; Buckley, T.J.; Strickland, P.; Jaakkola, J.J.K. Exposure to fine particulate matter (PM2.5) among highway toll station workers in Taipei: Direct and indirect exposure assessment. Arch. Environ. Health 2004, 59, 138–148. [Google Scholar] [CrossRef] [PubMed]
  24. Tsai, P.J.; Shih, T.S.; Chen, H.L.; Lee, W.J.; Lai, C.H.; Liou, S.H. Urinary 1-hydroxypyrene as an indicator for assessing the exposures of booth attendants of a highway toll station to polycyclic aromatic hydrocarbons. Environ. Sci. Technol. 2004, 38, 56–61. [Google Scholar] [CrossRef] [PubMed]
  25. Ingle, S.T.; Pachpande, B.G.; Wagh, N.D.; Patel, V.S.; Attarde, S.B. Exposure to vehicular pollution and respiratory impairment of traffic policemen in Jalgaon City, India. Ind. Health 2005, 43, 656–662. [Google Scholar] [CrossRef] [PubMed]
  26. Borgie, M.; Garat, A.; Cazier, F.; Delbende, A.; Allorge, D.; Ledoux, F.; Courcot, D.; Shirali, P.; Dagher, Z. Traffic-related air pollution. A pilot exposure assessment in Beirut, Lebanon. Chemosphere 2014, 96, 122–128. [Google Scholar] [CrossRef] [PubMed]
  27. Hu, Y.D.; Bai, Z.P.; Zhang, L.W.; Wang, X.; Zhang, L.; Yu, Q.C.; Zhu, T. Health risk assessment for traffic policemen exposed to polycyclic aromatic hydrocarbons (PAHs) in Tianjin, China. Sci. Total Environ. 2007, 382, 240–250. [Google Scholar] [CrossRef] [PubMed]
  28. Olvera, H.A.; Lopez, M.; Guerrero, V.; Garcia, H.; Li, W.W. Ultrafine particle levels at an international port of entry between the us and Mexico: Exposure implications for users, workers, and neighbors. J. Expo. Sci. Environ. Epidemiol. 2013, 23, 289–298. [Google Scholar] [CrossRef] [PubMed]
  29. Ronkko, T.; Pirjola, L.; Ntziachristos, L.; Heikkila, J.; Karjalainen, P.; Hillamo, R.; Keskinen, J. Vehicle engines produce exhaust nanoparticles even when not fueled. Environ. Sci. Technol. 2014, 48, 2043–2050. [Google Scholar] [CrossRef] [PubMed]
  30. Tan, P.; Mu, Z.; Lou, D. Exhaust particle number of vehicle diesel engine during transient operating conditions. J. Mech. Eng. 2012, 48, 134–140. [Google Scholar] [CrossRef]
  31. Maitre, A.; Soulat, J.M.; Masclet, P.; Stoklov, M.; Marques, M.; de Gaudemaris, R. Exposure to carcinogenic air pollutants among policemen working close to traffic in an urban area. Scand. J. Work Environ. Health 2002, 28, 402–410. [Google Scholar] [CrossRef] [PubMed]
  32. Jinsart, W.; Tamura, K.; Loetkamonwit, S.; Thepanondh, S.; Karita, K.; Yano, E. Roadside particulate air pollution in Bangkok. J. Air Waste Manag. Assoc. 2002, 52, 1102–1110. [Google Scholar] [CrossRef] [PubMed]
  33. Zhang, W.-T.; Dou, H.; Liu, Y.-N.; Zhang, X.-L.; Tao, S. Exposure of traffic police in Haidian district to PAHs. Huanjing Kexue 2006, 27, 224–227. [Google Scholar] [PubMed]
  34. Majumder, A.K.; Islam, K.M.N.; Bajracharya, R.M.; Carter, W.S. Assessment of occupational and ambient air quality of traffic police personnel of the Kathmandu valley, Nepal; in view of atmospheric particulate matter concentrations (PM10). Atmos. Pollut. Res. 2012, 3, 132–142. [Google Scholar] [CrossRef]
  35. Both, A.F.; Westerdahl, D.; Fruin, S.; Haryanto, B.; Marshall, J.D. Exposure to carbon monoxide, fine particle mass, and ultrafine particle number in Jakarta, Indonesia: Effect of commute mode. Sci. Total Environ. 2013, 443, 965–972. [Google Scholar] [CrossRef] [PubMed]
  36. Cattaneo, A.; Taronna, M.; Consonni, D.; Angius, S.; Costamagna, P.; Cavallo, D.M. Personal exposure of traffic police officers to particulate matter, carbon monoxide, and benzene in the city of Milan, Italy. J. Occup. Environ. Hyg. 2010, 7, 342–351. [Google Scholar] [CrossRef] [PubMed]
  37. Savitzky, A.; Golay, M.J.E. Smoothing + differentiation of data by simplified least squares procedures. Anal. Chem. 1964, 36, 1627–1639. [Google Scholar] [CrossRef]
  38. Niessner, R. The chemical response of the photoelectric aerosol sensor (PAS) to different aerosol systems. J. Aerosol Sci. 1986, 17, 705–714. [Google Scholar] [CrossRef]
  39. Horemans, B.; van Grieken, R. Speciation and diurnal variation of thoracic, fine thoracic and sub-micrometer airborne particulate matter at naturally ventilated office environments. Atmos. Environ. 2010, 44, 1497–1505. [Google Scholar] [CrossRef]
  40. Bathmanabhan, S.; Madanayak, S.N.S. Analysis and interpretation of particulate matter-PM10, PM2.5 and PM1 emissions from the heterogeneous traffic near an urban roadway. Atmos. Pollut. Res. 2010, 1, 184–194. [Google Scholar] [CrossRef]
  41. Janhall, S.; Jonsson, A.M.; Molnar, P.; Svensson, E.A.; Hallquist, M. Size resolved traffic emission factors of submicrometer particles. Atmos. Environ. 2004, 38, 4331–4340. [Google Scholar] [CrossRef]
  42. Kittelson, D.B.; Watts, W.F.; Johnson, J.P. Nanoparticle emissions on Minnesota highways. Atmos. Environ. 2004, 38, 9–19. [Google Scholar] [CrossRef]
  43. Baldauf, R.; Watkins, N.; Heist, D.; Bailey, C.; Rowley, P.; Shores, R. Near-road air quality monitoring: Factors affecting network design and interpretation of data. Air Qual. Atmos. Health 2009, 2, 1–9. [Google Scholar] [CrossRef]
  44. Huang, C.; Lou, D.M.; Hu, Z.Y.; Feng, Q.; Chen, Y.R.; Chen, C.H.; Tan, P.Q.; Yao, D. A PEMS study of the emissions of gaseous pollutants and ultrafine particles from gasoline- and diesel-fueled vehicles. Atmos. Environ. 2013, 77, 703–710. [Google Scholar] [CrossRef]
  45. Miguel, A.H.; Kirchstetter, T.W.; Harley, R.A.; Hering, S.V. On-road emissions of particulate polycyclic aromatic hydrocarbons and black carbon from gasoline and diesel vehicles. Environ. Sci. Technol. 1998, 32, 450–455. [Google Scholar] [CrossRef]
  46. Yanosky, J.D.; Williams, P.L.; MacIntosh, D.L. A comparison of two direct-reading aerosol monitors with the federal reference method for PM2.5 in indoor air. Atmos. Environ. 2002, 36, 107–113. [Google Scholar] [CrossRef]
  47. Cheng, Y.H.; Lin, Y.L.; Liu, C.C. Levels of PM10 and PM2.5 in Taipei rapid transit system. Atmos. Environ. 2008, 42, 7242–7249. [Google Scholar] [CrossRef]
  48. Chung, A.; Chang, D.P.Y.; Kleeman, M.J.; Perry, K.D.; Cahill, T.A.; Dutcher, D.; McDougall, E.M.; Stroud, K. Comparison of real-time instruments used to monitor airborne particulate matter. J. Air Waste Manag. Assoc. 2001, 51, 109–120. [Google Scholar] [CrossRef] [PubMed]
  49. Fuller, C.H.; Brugge, D.; Williams, P.L.; Mittleman, M.A.; Durant, J.L.; Spengler, J.D. Estimation of ultrafine particle concentrations at near-highway residences using data from local and central monitors. Atmos. Environ. 2012, 57, 257–265. [Google Scholar] [CrossRef] [PubMed]
  50. Reche, C.; Viana, M.; Rivas, I.; Bouso, L.; Alvarez-Pedrerol, M.; Alastuey, A.; Sunyer, J.; Querol, X. Outdoor and indoor ufp in primary schools across Barcelona. Sci.Total Environ. 2014, 493, 943–953. [Google Scholar] [CrossRef] [PubMed]
  51. Wu, Z.J.; Hu, M.; Lin, P.; Liu, S.; Wehner, B.; Wiedensohler, A. Particle number size distribution in the urban atmosphere of Beijing, China. Atmos. Environ. 2008, 42, 7967–7980. [Google Scholar] [CrossRef]
  52. Hussein, T.; Hameri, K.A.; Aalto, P.P.; Paatero, P.; Kulmala, M. Modal structure and spatial-temporal variations of urban and suburban aerosols in Helsinki—Finland. Atmos. Environ. 2005, 39, 1655–1668. [Google Scholar] [CrossRef]

