
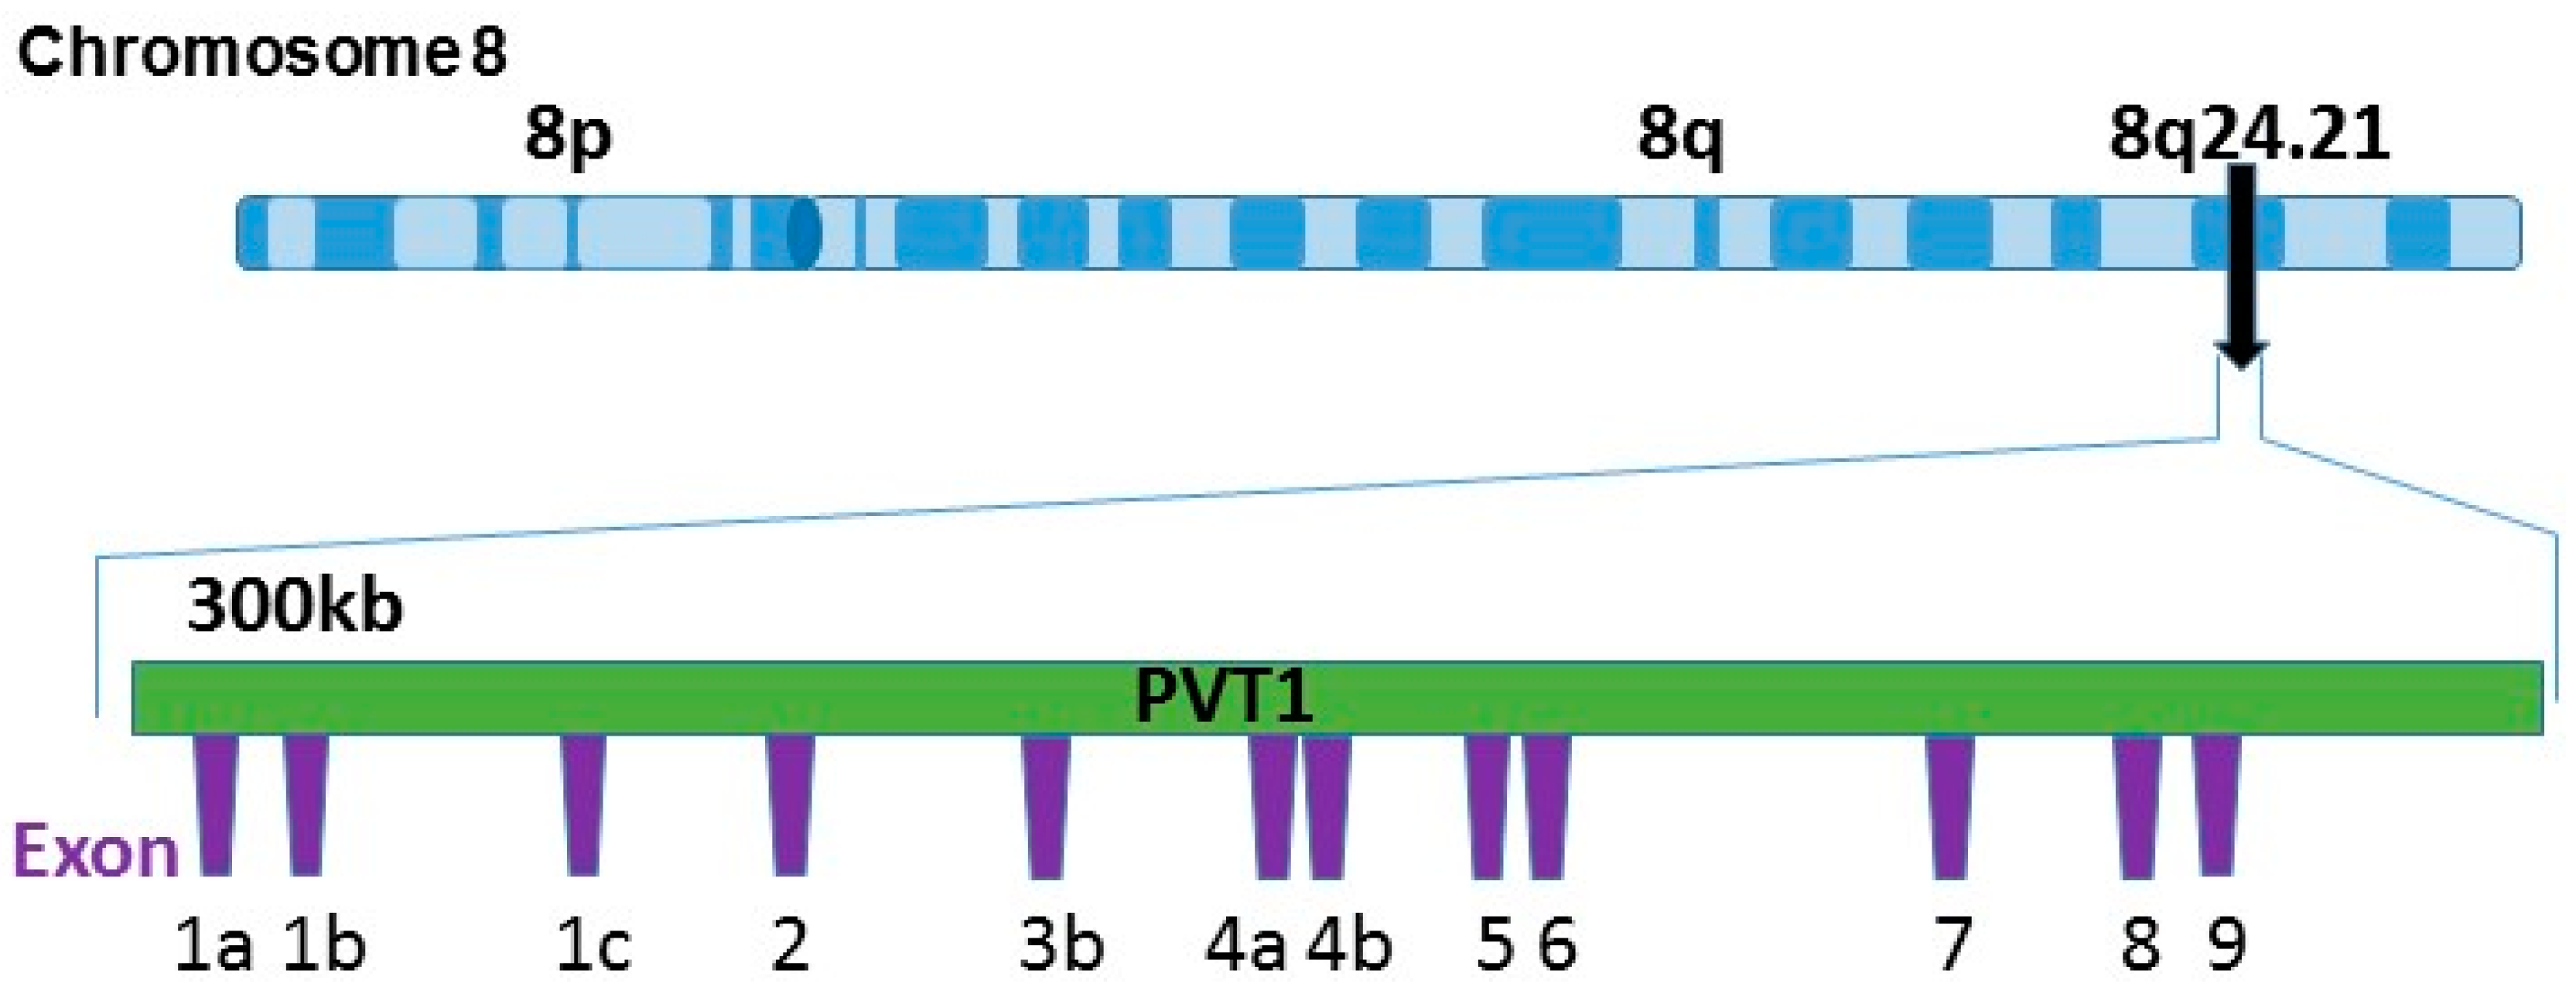
PVT1 Exon 9: A Potential Biomarker of Aggressive Prostate Cancer?


Abstract
:1. Introduction

2. Materials and Methods
2.1. Cell Lines

| Cell line | Caucasian Male (CM) | Male of African Ancestry (MoAA) | Indolent Disease | Aggressive Disease | Normal Prostate | Androgen Status |
|---|---|---|---|---|---|---|
| RWPE1 | √ | √ | Dependent | |||
| WPE1-NA22 | √ | √ | Dependent | |||
| MDA PCa 2b | √ | √ | Dependent | |||
| E006AA | √ | √ | Independent | |||
| E006AA-hT | √ | √ | Independent | |||
| PC-3 | √ | √ | Independent | |||
| VCaP | √ | √ | Dependent |
2.2. Cell Culture and Cell Culture Reagents
2.3. Primer Design and Sequences
| Primer Name | Primer Sequence 5′-3′ |
|---|---|
| PVT1 Exon 1A-F | ACGAGCTGCGAGCAAAGA |
| PVT1 Exon 1A-R | CGTGTCTCCACAGGTCACAG |
| PVT1 Exon 1B-F | CGGAAGCTGCAGAAGGACAAA |
| PVT1 Exon 1B-R | CTCAAATAATGGAGACCAGGCCA |
| PVT1 Exon 1C-F | GCAGTGCAGGAAGCCAACTA |
| PVT1 Exon 1C-F | CTTAGGGGTCCTTACAGCCAAG |
| PVT1 Exon 2-F | AACCATGCACTGGAATGACA |
| PVT1 Exon 2-R | CATCAGATGCTTCACCAGGA |
| PVT1 Exon 3B-F | CATACTCCCTGGAGCCTTCTC |
| PVT1 Exon 3B-R | CAGTGTCCTGGCAGTAAAAGG |
| PVT1 Exon 4A-F | GGGTTCAAGTGATCCTCCTG |
| PVT1 Exon 4A-R | TGTAATCCCAGCACGTTGAA |
| PVT1 Exon 4B-F | CACCTGGGATTTAGGCACTT |
| PVT1 Exon 4B-R | CCAATCTCAAAATACTCCAGCTTT |
| PVT1 Exon 5-F | GCCAACAGAGATTTTGAGAAACAC |
| PVT1 Exon 5-R | TCAGCTCAGGTTCCCATTGT |
| PVT1 Exon 6-F | TGCTAGGGTGACAGAAACTGG |
| PVT1 Exon 6-R | CCCAGGTCTTGATGACAGGT |
| PVT1 Exon 7-F | TTGGTGCTCTGTGTTCACCT |
| PVT1 Exon 7-R | TGTCCACTAGCAGCAACAGG |
| PVT1 Exon 8-F | AGAATAACGGGCTCCCAGAT |
| PVT1 Exon 8-R | AAGCTGGGTCTTCATCCTGA |
| PVT1 Exon 9-F * | CATGACTCCACCTGGACCTT |
| PVT1 Exon 9-R * | GTGGGCGATGAAGTTCGTA |
2.4. RNA Extraction and RT-QPCR
2.5. Statistical Analysis
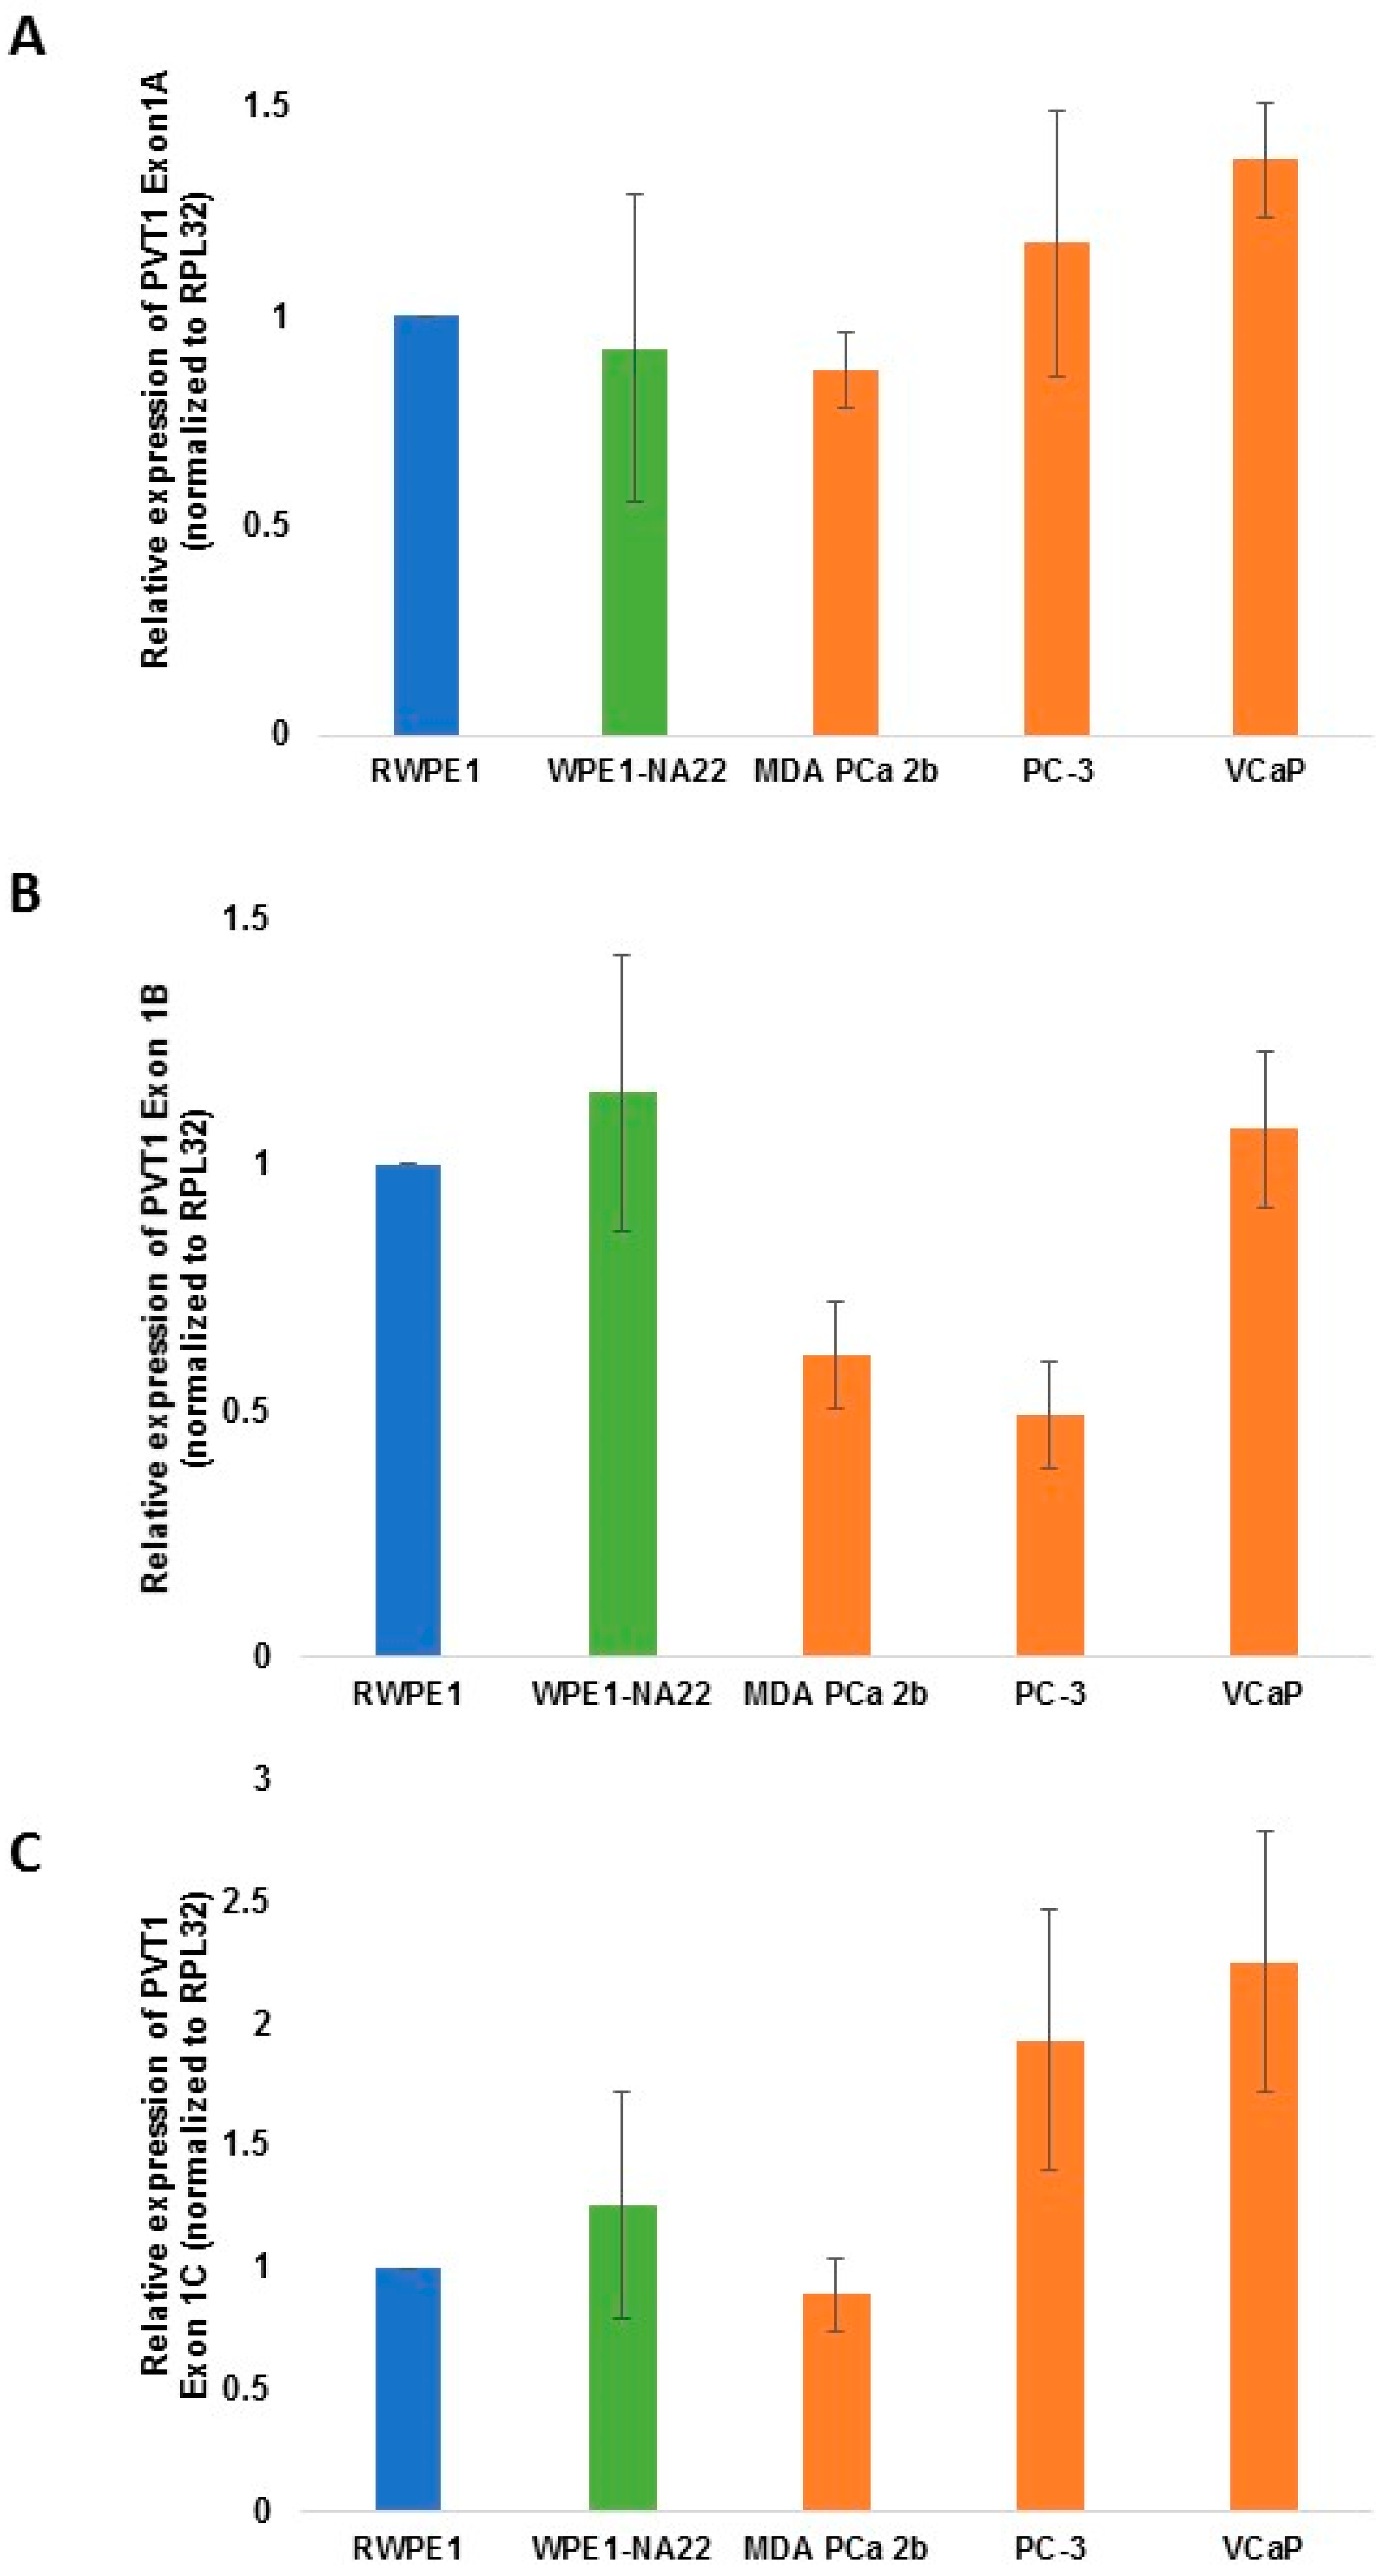
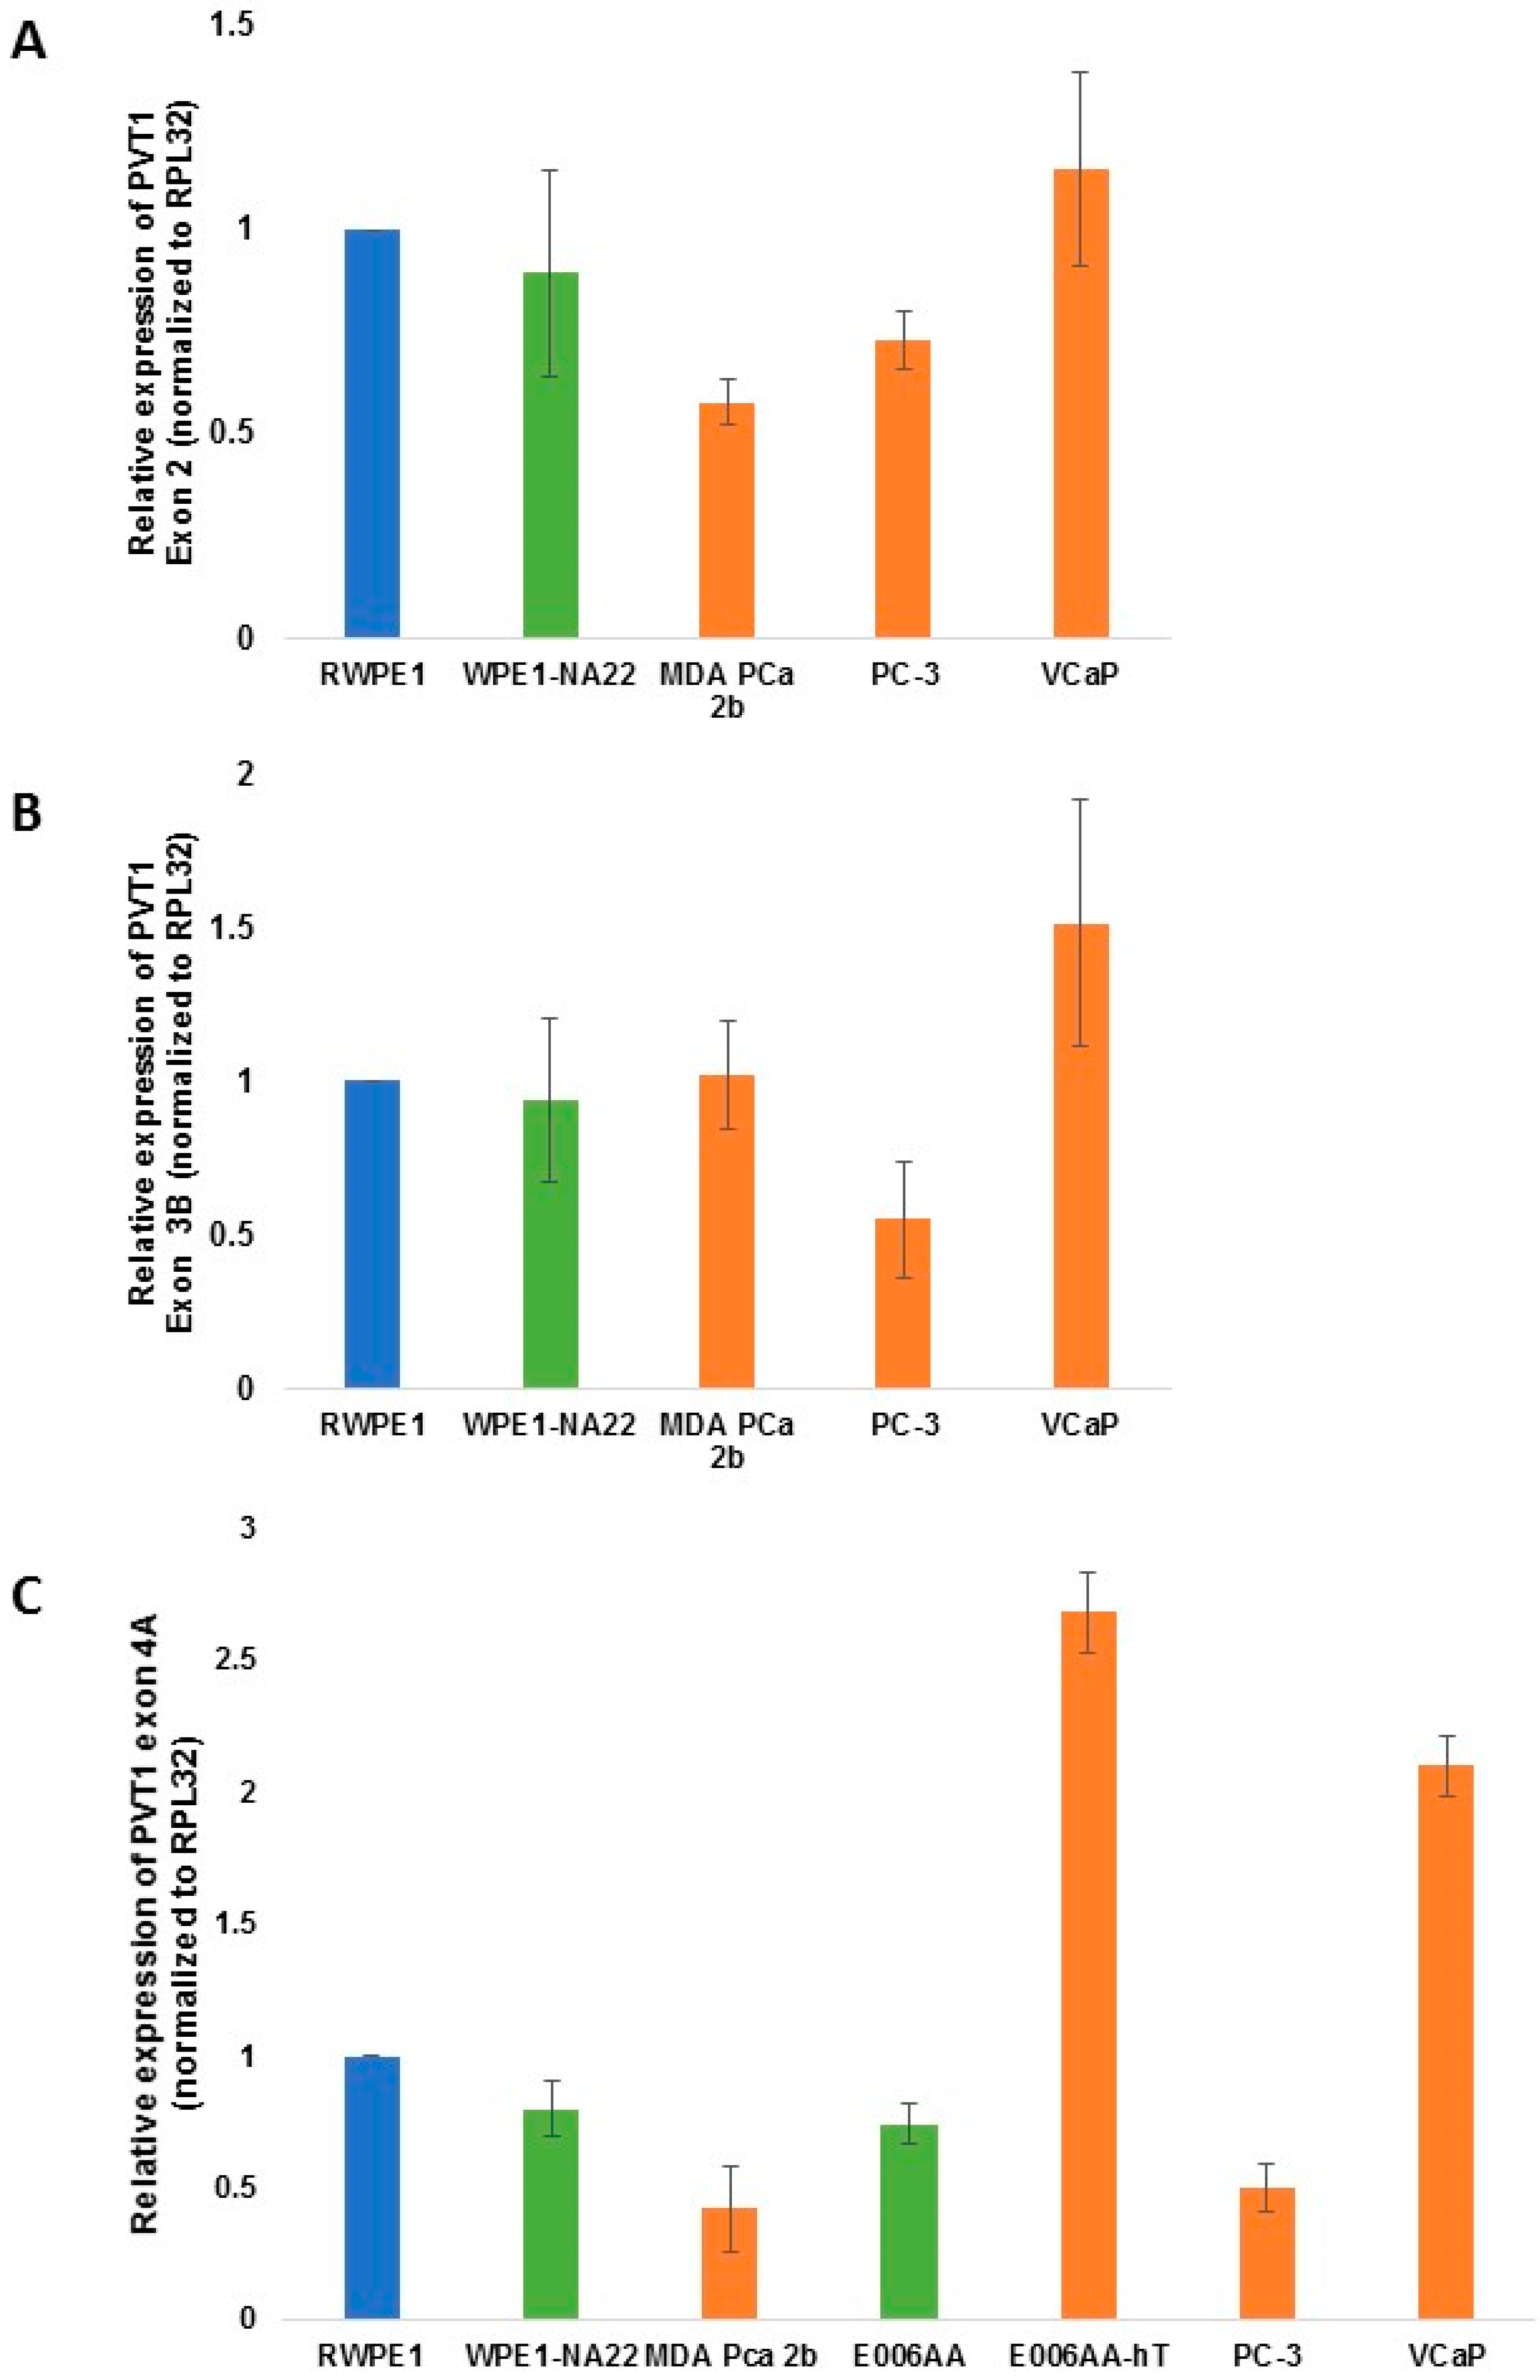
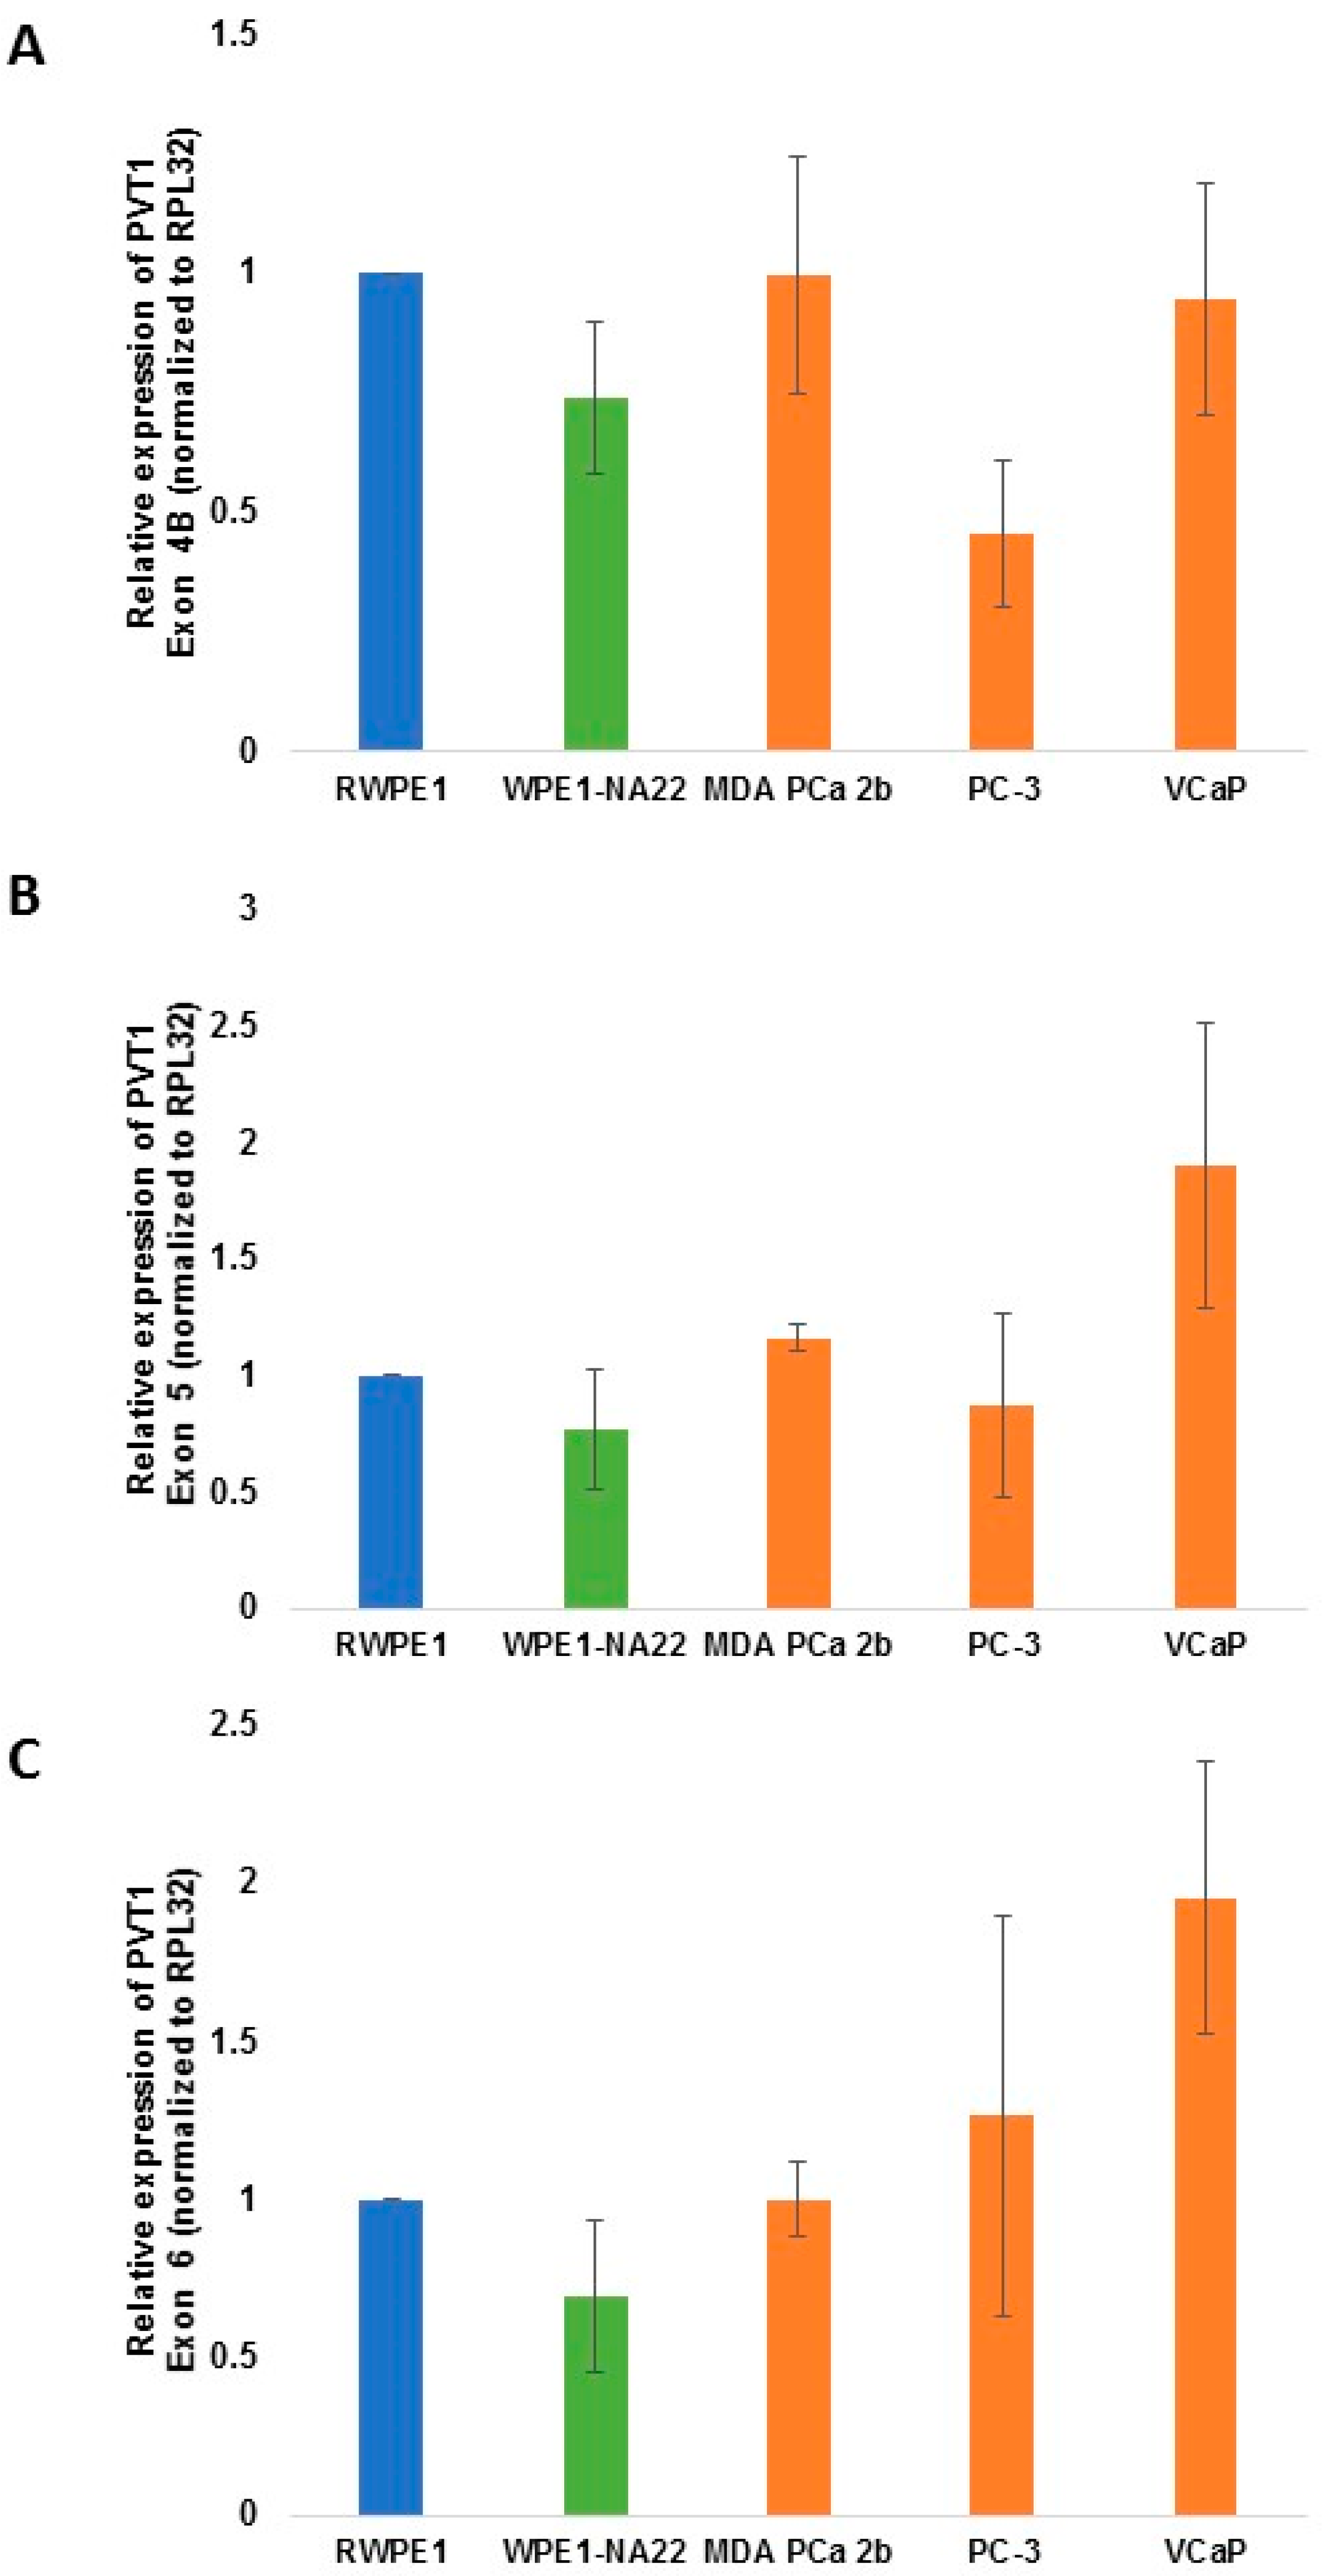
| PVT1 exon | WPE1-NA22 | MDA PCa 2b | E006AA | E006AA-hT | PC-3 | VCaP |
|---|---|---|---|---|---|---|
| PVT1 Exon 1A | 0.4148 | 0.1017 | 0.2865 | 0.0262 | ||
| PVT1 Exon 1B | 0.2950 | 0.0133 | 0.0060 | 0.3158 | ||
| PVT1 Exon 1C | 0.2864 | 0.2326 | 0.0686 | 0.0369 | ||
| PVT1 Exon 2 | 0.3284 | 0.0016 | 0.0114 | 0.2598 | ||
| PVT1 Exon 3B | 0.4073 | 0.4516 | 0.0359 | 0.1179 | ||
| PVT1 Exon 4A | 0.4410 | 0.0010 | 0.3320 | 0.2397 | 0.1518 | 0.0633 |
| PVT1 Exon 4B | 0.0780 | 0.4943 | 0.0130 | 0.4064 | ||
| PVT1 Exon 5 | 0.1867 | 0.0244 | 0.3641 | 0.0938 | ||
| PVT1 Exon 6 | 0.1160 | 0.4997 | 0.3313 | 0.0409 | ||
| PVT1 Exon 7 | 0.1976 | 0.1799 | 0.3066 | 0.1383 | ||
| PVT1 Exon 8 | 0.1492 | 0.2963 | 0.0255 | 0.0650 | ||
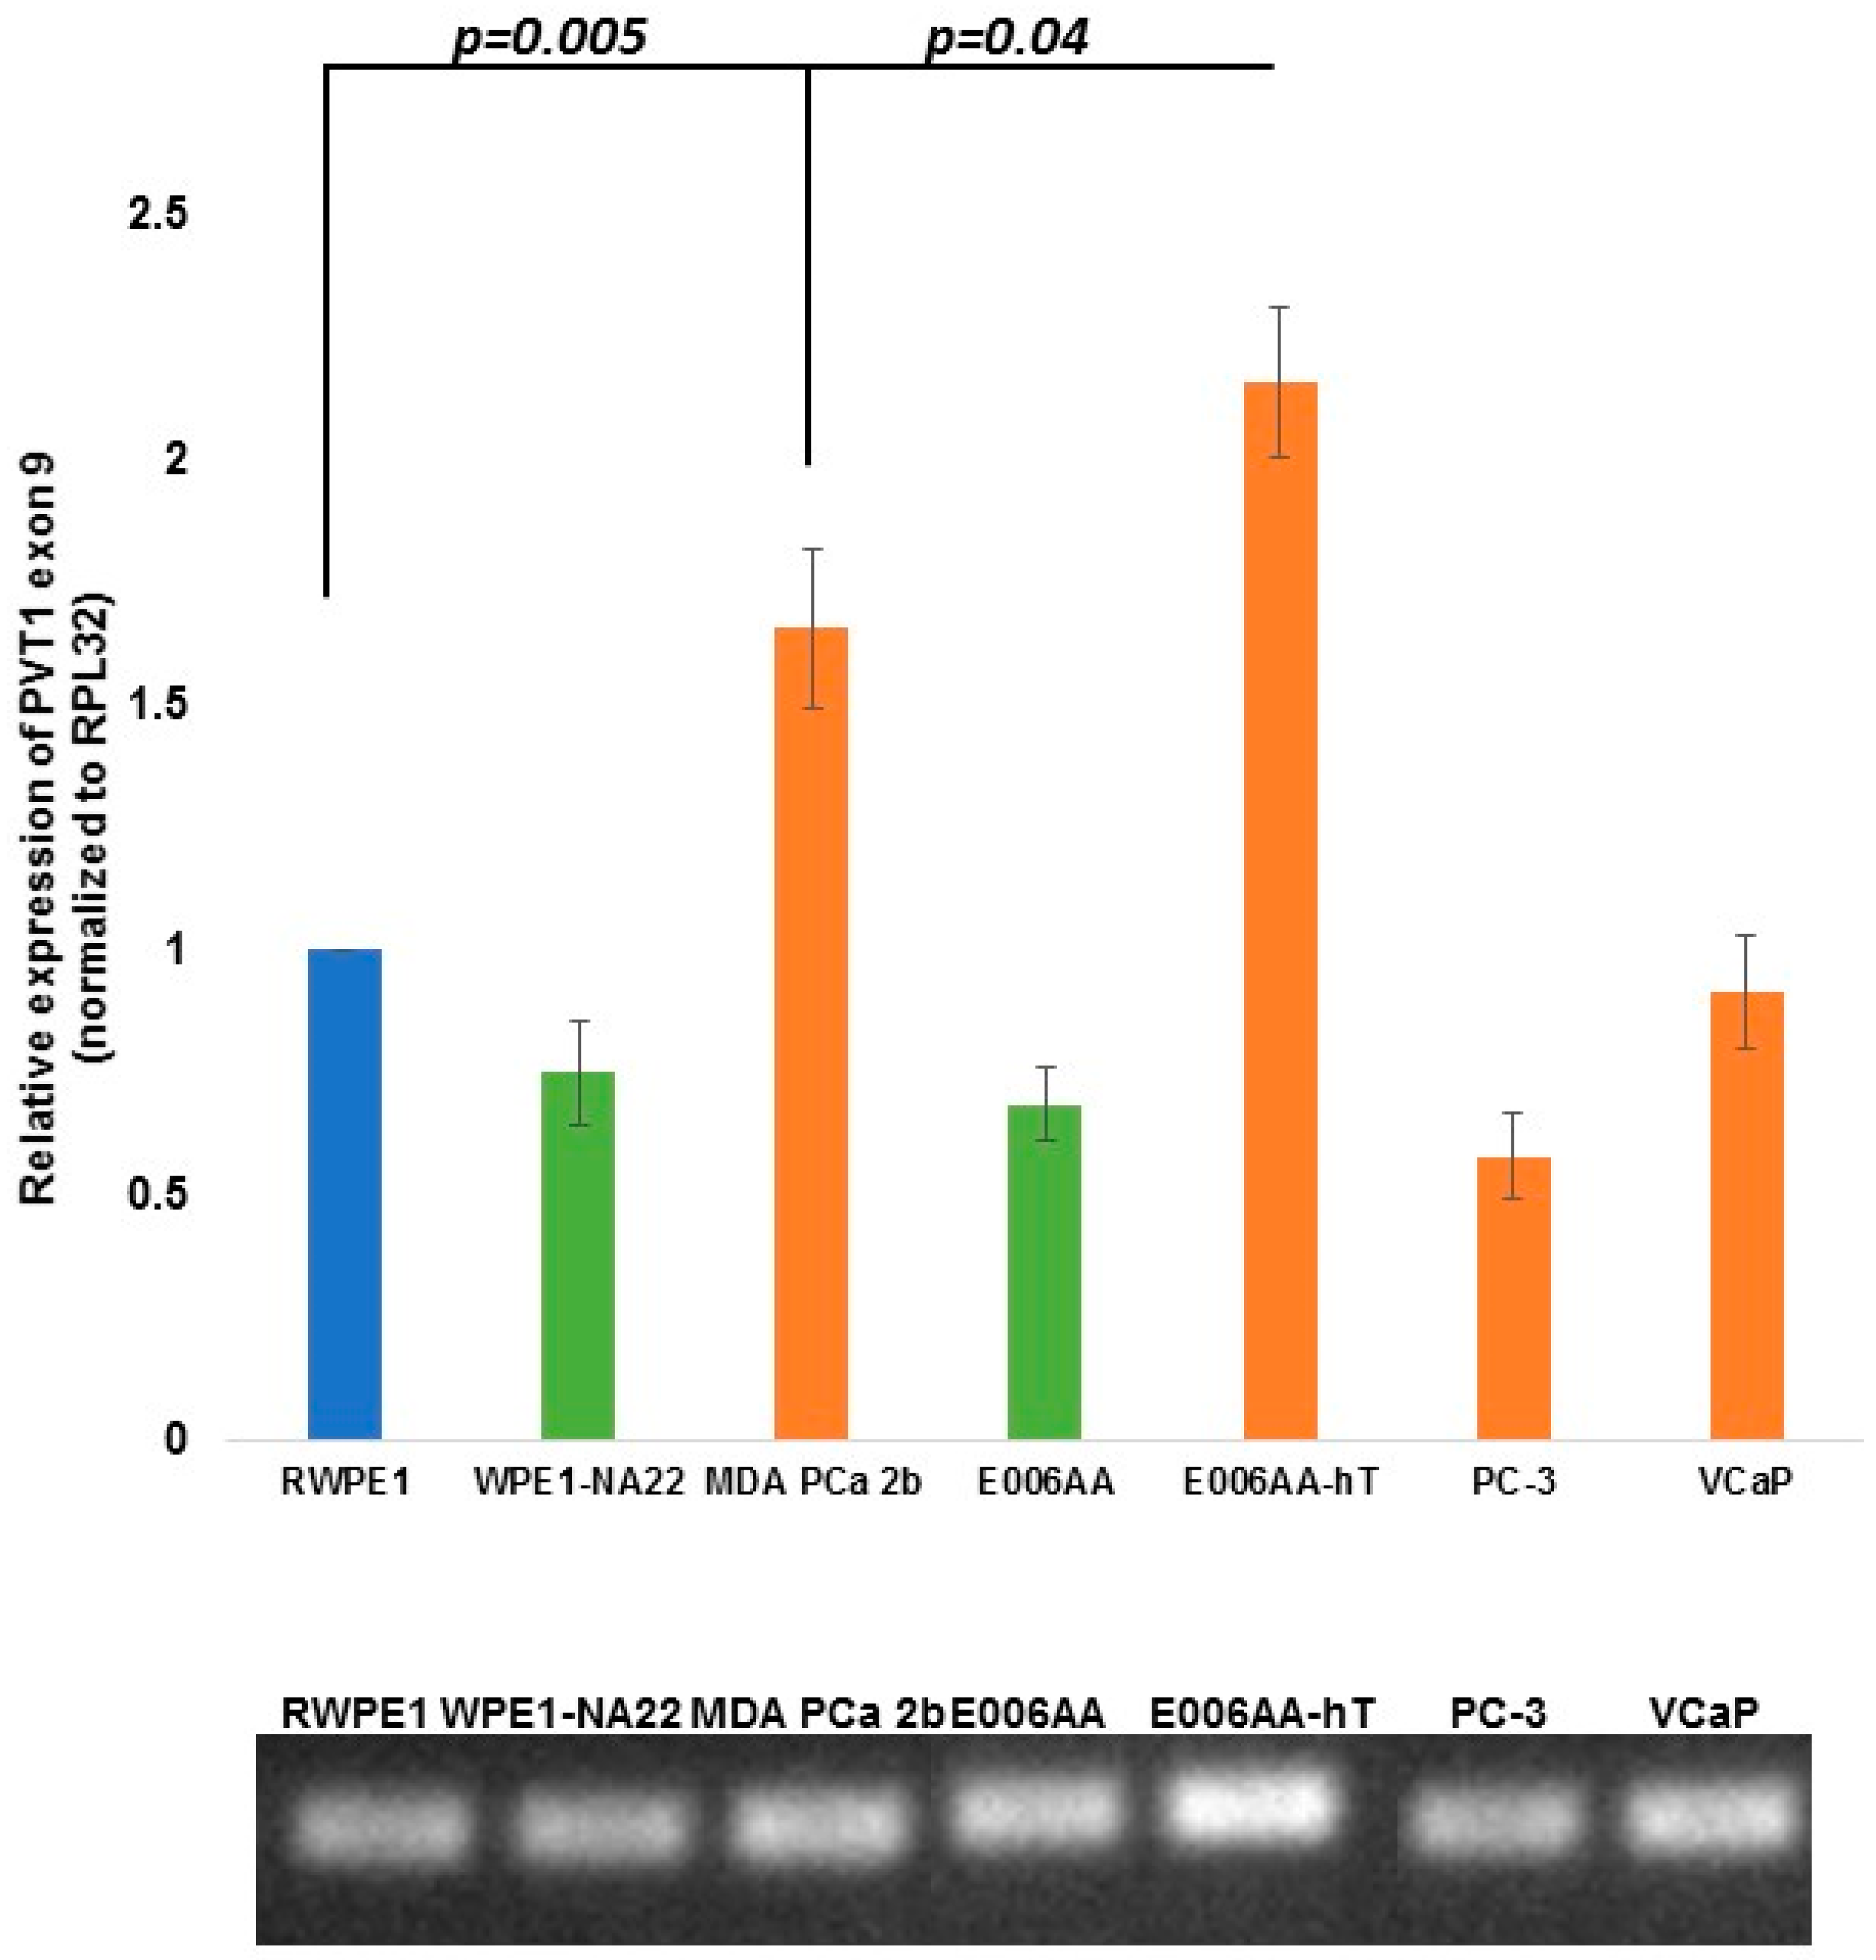
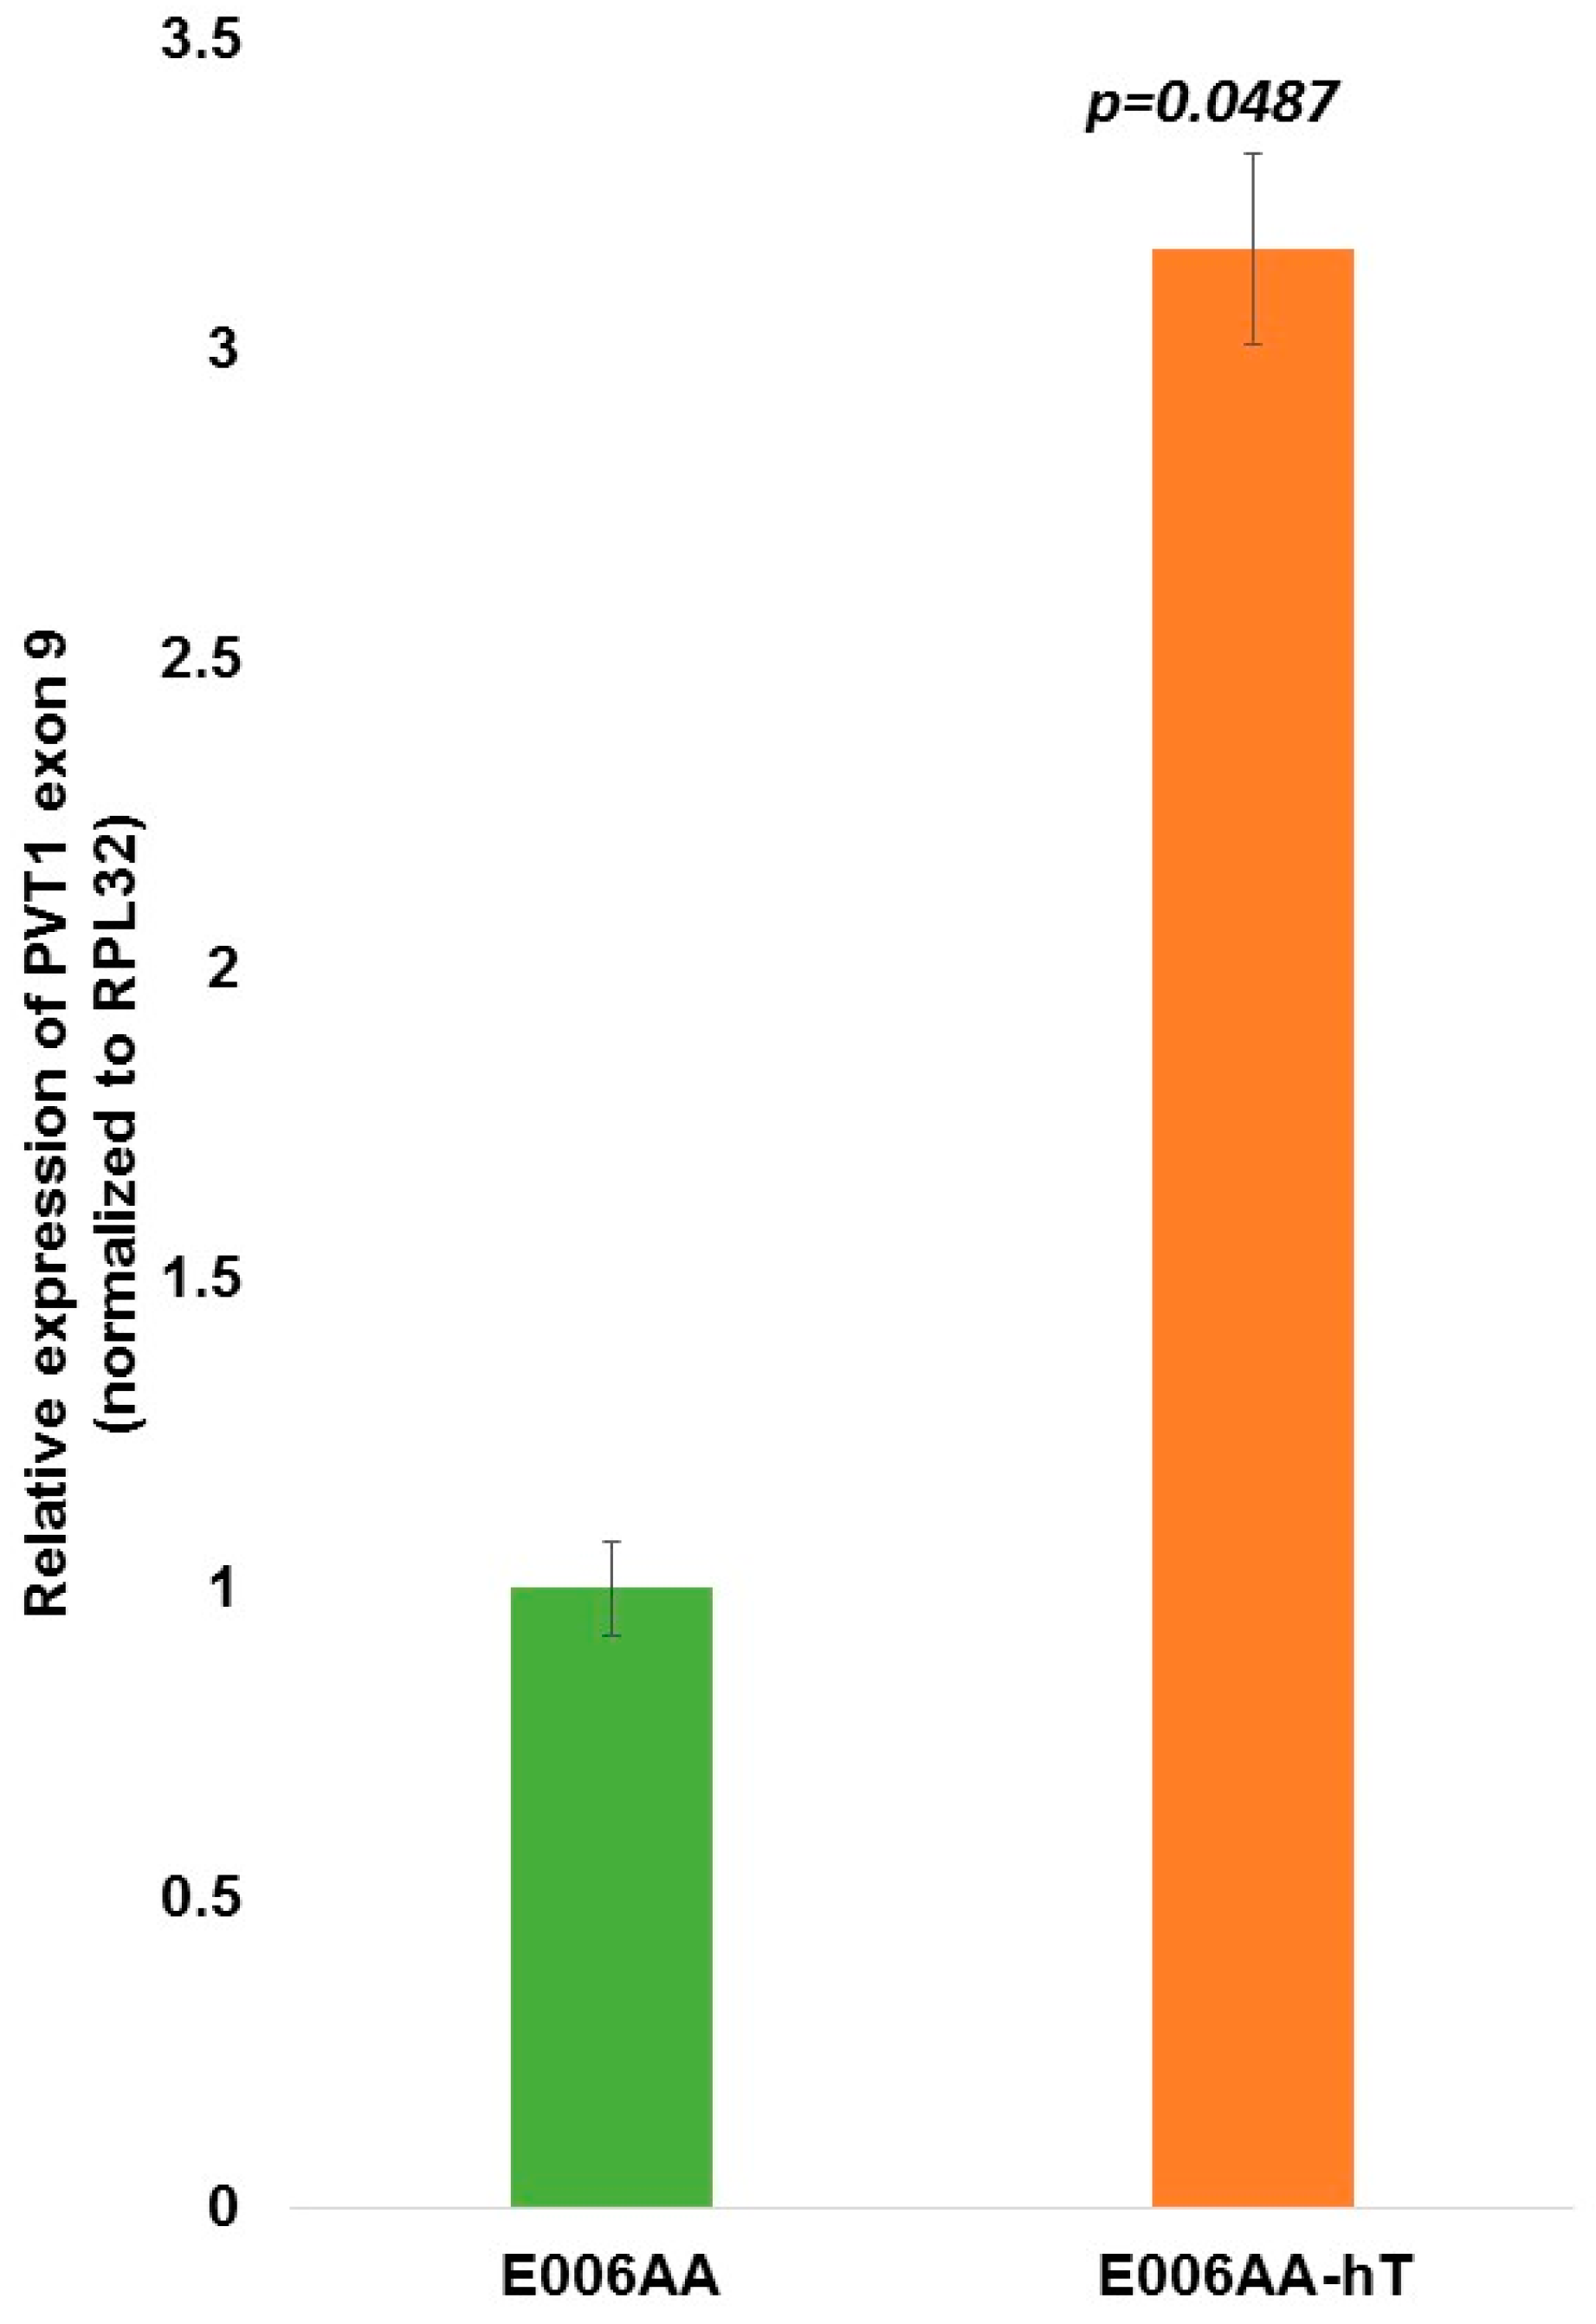
| PVT1 Exon 9 | 0.0179 | 0.0050 | 0.0742 | 0.0416 | 0.0007 | 0.3552 |
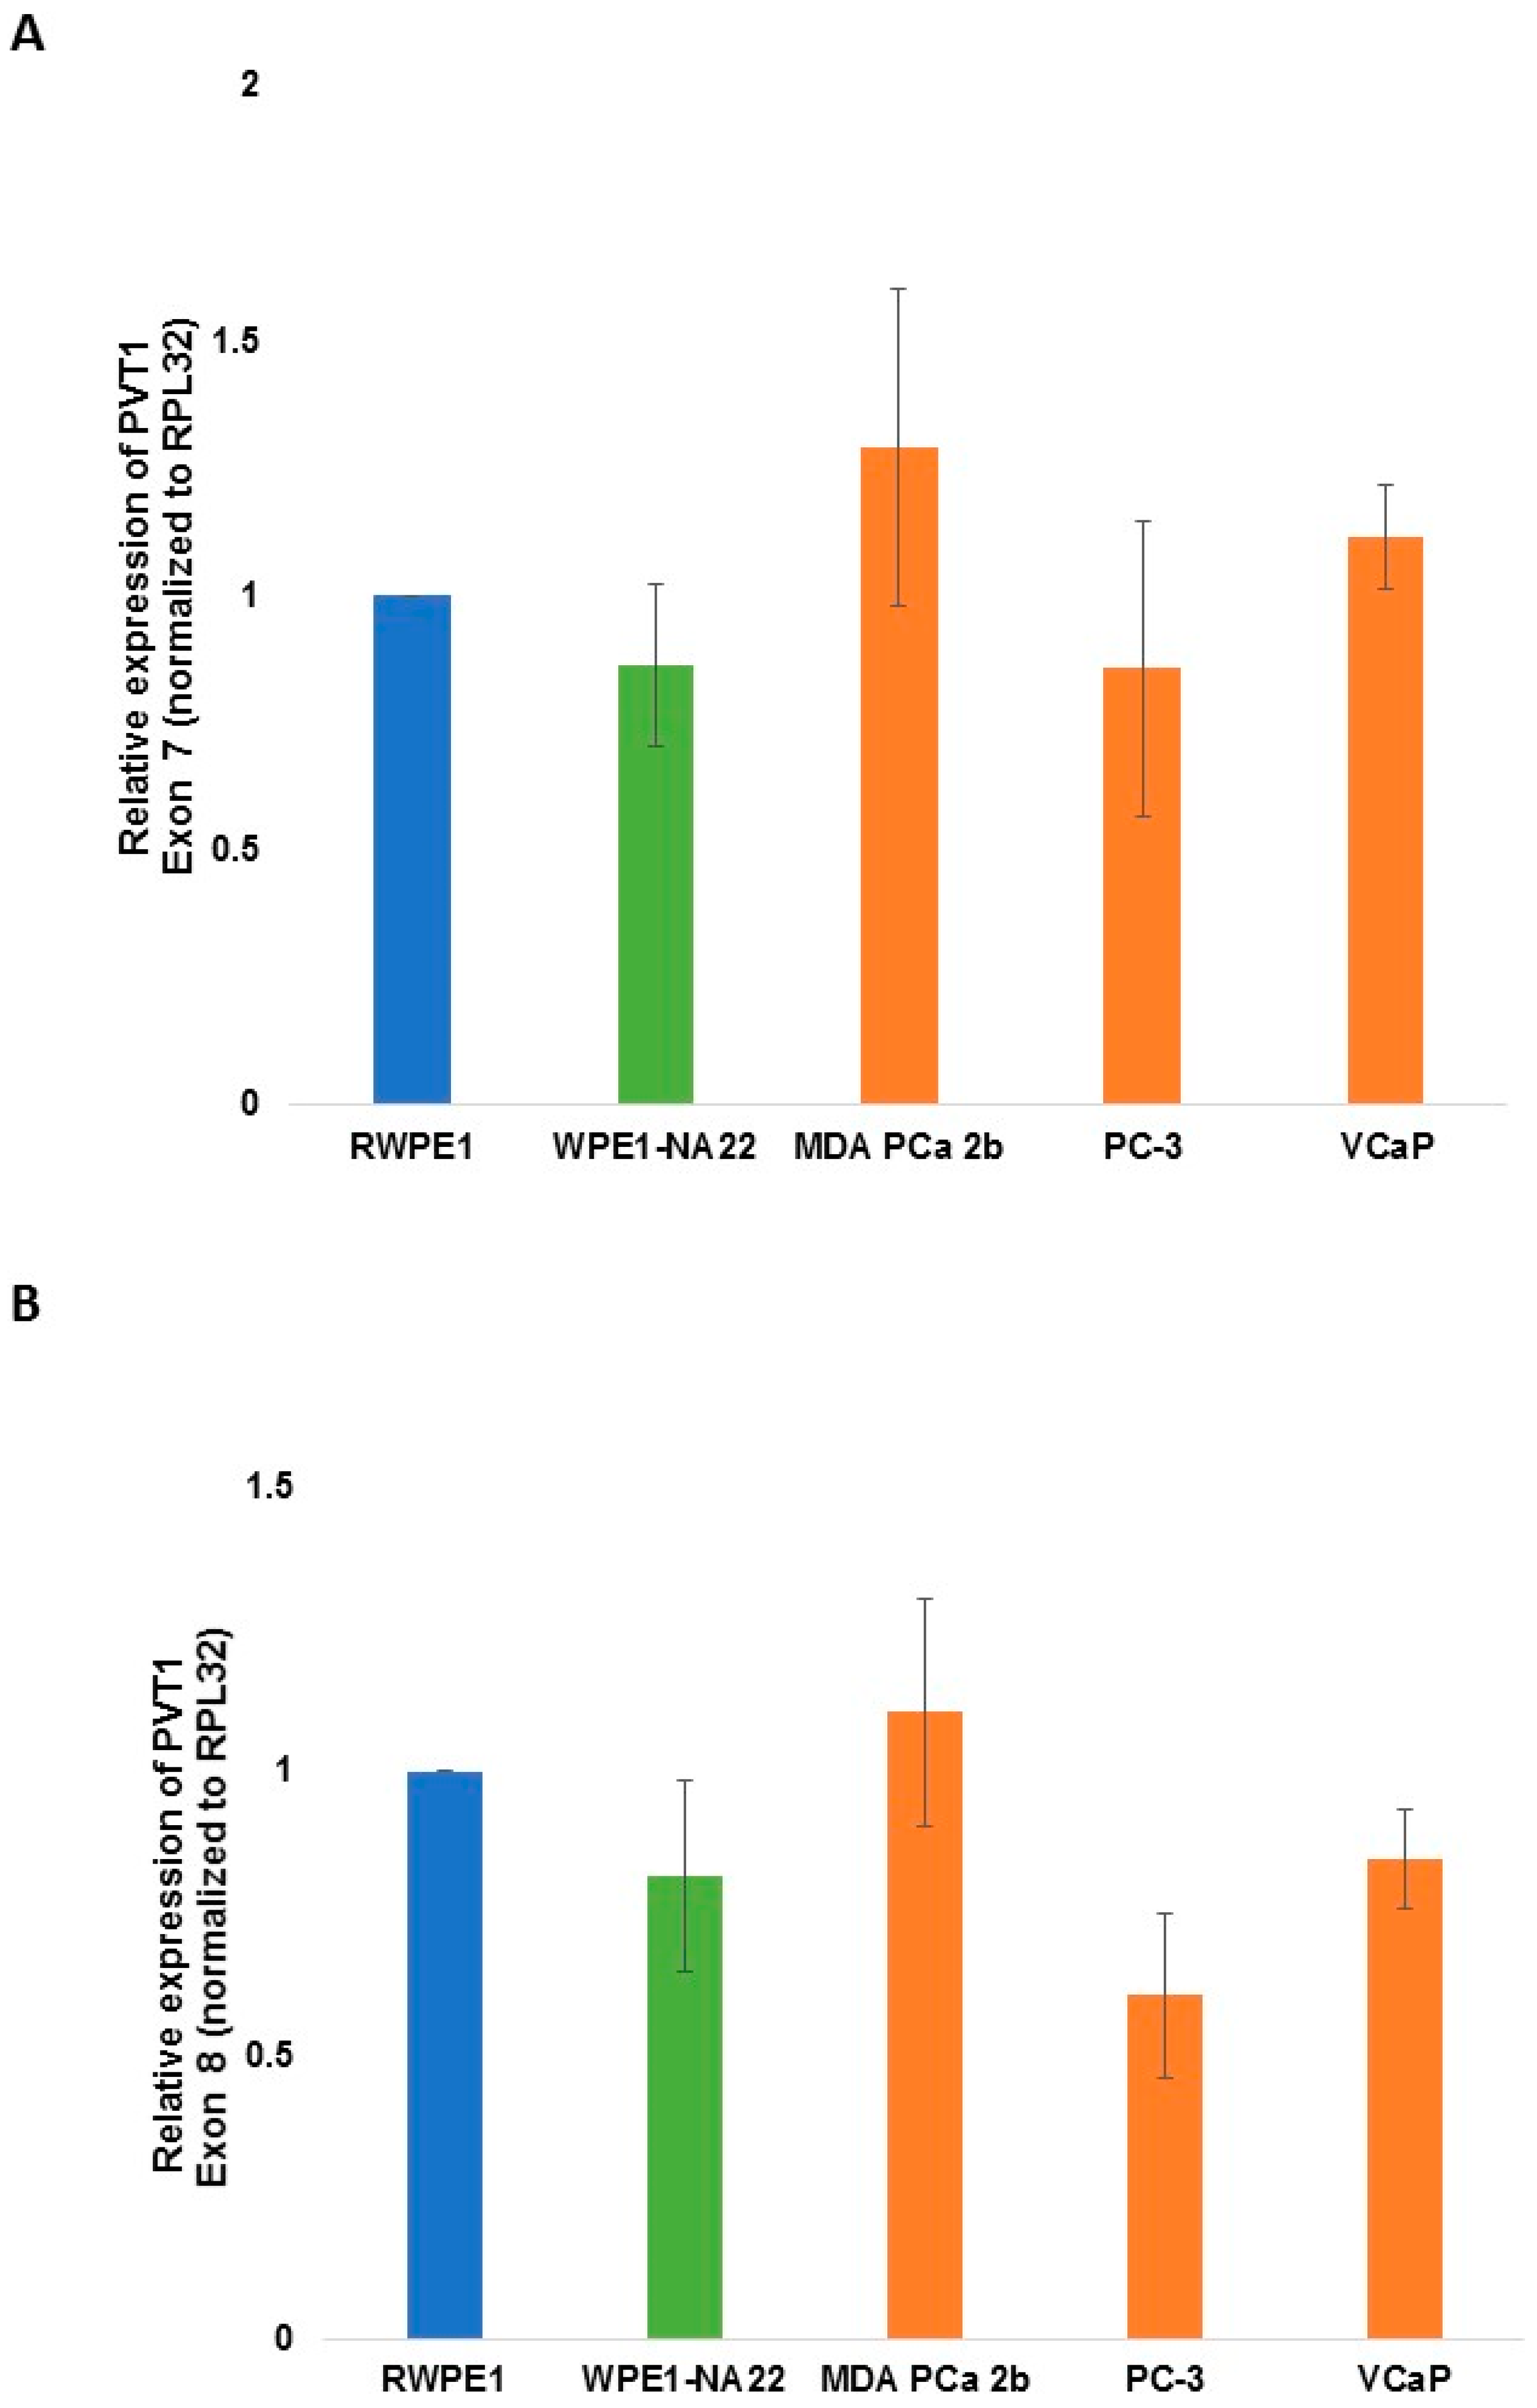
3. Results


4. Discussion
5. Conclusions
Acknowledgments
Author Contributions
Conflicts of Interest
References
- Siegel, R.L.; Miller, K.D.; Jemal, A. Cancer statistics, 2015. CA Cancer J. Clin. 2015, 65, 5–29. [Google Scholar] [CrossRef] [PubMed]
- Siegel, R.; Naishadham, D.; Jemal, A. Cancer statistics, 2013. CA Cancer J. Clin. 2013, 63, 11–30. [Google Scholar] [CrossRef] [PubMed]
- Evans, S.; Metcalfe, C.; Ibrahim, F.; Persad, R.; Ben-Shlomo, Y. Investigating Black-White differences in prostate cancer prognosis: A systematic review and meta-analysis. Int. J. Cancer 2008, 123, 430–435. [Google Scholar] [CrossRef] [PubMed]
- Evans, S.; Metcalfe, C.; Patel, B.; Ibrahim, F.; Anson, K.; Chinegwundoh, F.; Corbishley, C.; Gillatt, D.; Kirby, R.; Muir, G.; et al. Clinical presentation and initial management of black men and white men with prostate cancer in the United Kingdom: The PROCESS cohort study. Br. J. Cancer 2010, 102, 249–254. [Google Scholar] [CrossRef] [PubMed]
- Clegg, L.X.; Reichman, M.E.; Miller, B.A.; Hankey, B.F.; Singh, G.K.; Lin, Y.D.; Goodman, M.T.; Lynch, C.F.; Schwartz, S.M.; Chen, V.W.; et al. Impact of socioeconomic status on cancer incidence and stage at diagnosis: Selected findings from the surveillance, epidemiology, and end results: National Longitudinal Mortality Study. Cancer Causes Control CCC 2009, 20, 417–435. [Google Scholar] [CrossRef] [PubMed]
- Chu, K.C.; Miller, B.A.; Springfield, S.A. Measures of racial/ethnic health disparities in cancer mortality rates and the influence of socioeconomic status. J. Natl. Med. Assoc. 2007, 99, 1092–1100, 1102–1104. [Google Scholar] [PubMed]
- Freedman, M.L.; Haiman, C.A.; Patterson, N.; McDonald, G.J.; Tandon, A.; Waliszewska, A.; Penney, K.; Steen, R.G.; Ardlie, K.; John, E.M.; et al. Admixture mapping identifies 8q24 as a prostate cancer risk locus in African-American men. Proc. Natl. Acad. Sci. USA 2006, 103, 14068–14073. [Google Scholar] [CrossRef] [PubMed]
- Eeles, R.A.; Kote-Jarai, Z.; Giles, G.G.; Olama, A.A.A.; Guy, M.; Jugurnauth, S.K.; Mulholland, S.; Leongamornlert, D.A.; Edwards, S.M.; Morrison, J.; et al. Multiple newly identified loci associated with prostate cancer susceptibility. Nat. Genet. 2008, 40, 316–321. [Google Scholar] [CrossRef] [PubMed]
- Ghoussaini, M.; Song, H.; Koessler, T.; al Olama, A.A.; Kote-Jarai, Z.; Driver, K.E.; Pooley, K.A.; Ramus, S.J.; Kjaer, S.K.; Hogdall, E.; et al. Multiple loci with different cancer specificities within the 8q24 gene desert. J. Natl. Cancer Inst. 2008, 100, 962–966. [Google Scholar] [CrossRef] [PubMed]
- Thomas, G.; Jacobs, K.B.; Yeager, M.; Kraft, P.; Wacholder, S.; Orr, N.; Yu, K.; Chatterjee, N.; Welch, R.; Hutchinson, A.; et al. Multiple loci identified in a genome-wide association study of prostate cancer. Nat. Genet. 2008, 40, 310–315. [Google Scholar] [CrossRef] [PubMed]
- Yeager, M.; Orr, N.; Hayes, R.B.; Jacobs, K.B.; Kraft, P.; Wacholder, S.; Minichiello, M.J.; Fearnhead, P.; Yu, K.; Chatterjee, N.; et al. Genome-wide association study of prostate cancer identifies a second risk locus at 8q24. Nat. Genet. 2007, 39, 645–649. [Google Scholar] [CrossRef] [PubMed]
- Haiman, C.A.; Patterson, N.; Freedman, M.L.; Myers, S.R.; Pike, M.C.; Waliszewska, A.; Neubauer, J.; Tandon, A.; Schirmer, C.; McDonald, G.J.; et al. Multiple regions within 8q24 independently affect risk for prostate cancer. Nat. Genet. 2007, 39, 638–644. [Google Scholar] [CrossRef] [PubMed]
- Huppi, K.; Pitt, J.J.; Wahlberg, B.M.; Caplen, N.J. The 8q24 gene desert: An oasis of non-coding transcriptional activity. Front. Genet. 2012, 3. [Google Scholar] [CrossRef] [PubMed]
- Calin, G.A.; Croce, C.M. MicroRNA signatures in human cancers. Nat. Rev. Cancer 2006, 6, 857–866. [Google Scholar] [CrossRef] [PubMed]
- Trang, P.; Weidhaas, J.B.; Slack, F.J. MicroRNAs as potential cancer therapeutics. Oncogene 2008, 27 (Suppl. 2), S52–S57. [Google Scholar] [CrossRef] [PubMed]
- Chen, L.-L.; Carmichael, G.G. Long noncoding RNAs in mammalian cells: What, where, and why? Wiley Interdiscip. Rev. RNA 2010, 1, 2–21. [Google Scholar] [CrossRef] [PubMed]
- Lipovich, L.; Johnson, R.; Lin, C.-Y. MacroRNA underdogs in a microRNA world: Evolutionary, regulatory, and biomedical significance of mammalian long non-protein-coding RNA. Biochim. Biophys. Acta 2010, 1799, 597–615. [Google Scholar] [CrossRef] [PubMed]
- Ponting, C.P.; Oliver, P.L.; Reik, W. Evolution and functions of long noncoding RNAs. Cell 2009, 136, 629–641. [Google Scholar] [CrossRef] [PubMed]
- Dinger, M.E.; Pang, K.C.; Mercer, T.R.; Mattick, J.S. Differentiating protein-coding and noncoding RNA: Challenges and ambiguities. PLoS Comput. Biol. 2008, 4. [Google Scholar] [CrossRef]
- Shtivelman, E.; Henglein, B.; Groitl, P.; Lipp, M.; Bishop, J.M. Identification of a human transcription unit affected by the variant chromosomal translocations 2;8 and 8;22 of Burkitt lymphoma. Proc. Natl. Acad. Sci. USA 1989, 86, 3257–3260. [Google Scholar] [CrossRef] [PubMed]
- Huppi, K.; Siwarski, D.; Skurla, R.; Klinman, D.; Mushinski, J.F. Pvt-1 transcripts are found in normal tissues and are altered by reciprocal (6;15) translocations in mouse plasmacytomas. Proc. Natl. Acad. Sci. USA 1990, 87, 6964–6968. [Google Scholar] [CrossRef] [PubMed]
- Shtivelman, E.; Bishop, J.M. Effects of translocations on transcription from PVT. Mol. Cell. Biol. 1990, 10, 1835–1839. [Google Scholar] [CrossRef]
- Huppi, K.; Volfovsky, N.; Runfola, T.; Jones, T.L.; Mackiewicz, M.; Martin, S.E.; Mushinski, J.F.; Stephens, R.; Caplen, N.J. The identification of microRNAs in a genomically unstable region of human chromosome 8q24. Mol. Cancer Res. MCR 2008, 6, 212–221. [Google Scholar] [CrossRef] [PubMed]
- Wasserman, N.F.; Aneas, I.; Nobrega, M.A. An 8q24 gene desert variant associated with prostate cancer risk confers differential in vivo activity to a MYC enhancer. Genome Res. 2010, 20, 1191–1197. [Google Scholar] [CrossRef]
- Cory, S.; Graham, M.; Webb, E.; Corcoran, L.; Adams, J.M. Variant (6;15) translocations in murine plasmacytomas involve a chromosome 15 locus at least 72 kb from the c-myc oncogene. EMBO J. 1985, 4, 675–681. [Google Scholar] [PubMed]
- Graham, M.; Adams, J.M. Chromosome 8 breakpoint far 3′ of the c-myc oncogene in a Burkitt’s lymphoma 2;8 variant translocation is equivalent to the murine pvt-1 locus. EMBO J. 1986, 5, 2845–2851. [Google Scholar] [PubMed]
- Takahashi, Y.; Sawada, G.; Kurashige, J.; Uchi, R.; Matsumura, T.; Ueo, H.; Takano, Y.; Eguchi, H.; Sudo, T.; Sugimachi, K.; et al. Amplification of PVT-1 is involved in poor prognosis via apoptosis inhibition in colorectal cancers. Br. J. Cancer 2014, 110, 164–171. [Google Scholar] [CrossRef] [PubMed]
- Kong, R.; Zhang, E.; Yin, D.; You, L.; Xu, T.; Chen, W.; Xia, R.; Wan, L.; Sun, M.; Wang, Z.; et al. Long noncoding RNA PVT1 indicates a poor prognosis of gastric cancer and promotes cell proliferation through epigenetically regulating p15 and p16. Mol. Cancer 2015, 14. [Google Scholar] [CrossRef] [PubMed]
- Yang, Y.-R.; Zang, S.-Z.; Zhong, C.-L.; Li, Y.-X.; Zhao, S.-S.; Feng, X.-J. Increased expression of the lncRNA PVT1 promotes tumorigenesis in non-small cell lung cancer. Int. J. Clin. Exp. Pathol. 2014, 7, 6929–6935. [Google Scholar] [PubMed]
- Meyer, K.B.; Maia, A.-T.; O’Reilly, M.; Ghoussaini, M.; Prathalingam, R.; Porter-Gill, P.; Ambs, S.; Prokunina-Olsson, L.; Carroll, J.; Ponder, B.A.J. A functional variant at a prostate cancer predisposition locus at 8q24 is associated with PVT1 expression. PLoS Genet. 2011, 7. [Google Scholar] [CrossRef] [PubMed]
- Koochekpour, S.; Maresh, G.A.; Katner, A.; Parker-Johnson, K.; Lee, T.J.; Hebert, F.E.; Kao, Y.S.; Skinner, J.; Rayford, W. Establishment and characterization of a primary androgen-responsive African-American prostate cancer cell line, E006AA. Int. J. Biol. Sci. 2004, 10, 834–845. [Google Scholar] [CrossRef] [PubMed]
- Primer3Plus. Available online: http://primer3plus.com/cgi-bin/dev/primer3plus.cgi (accessed on 12 August 2015).
- Barsotti, A.M.; Beckerman, R.; Laptenko, O.; Huppi, K.; Caplen, N.J.; Prives, C. p53-Dependent induction of PVT1 and miR-1204. J. Biol. Chem. 2012, 287, 2509–2519. [Google Scholar] [CrossRef] [PubMed]
- Fu, X.; Ravindranath, L.; Tran, N.; Petrovics, G.; Srivastava, S. Regulation of apoptosis by a prostate-specific and prostate cancer-associated noncoding gene, PCGEM1. DNA Cell Biol. 2006, 25, 135–141. [Google Scholar] [CrossRef] [PubMed]
- Ravasi, T.; Suzuki, H.; Pang, K.C.; Katayama, S.; Furuno, M.; Okunishi, R.; Fukuda, S.; Ru, K.; Frith, M.C.; Gongora, M.M.; et al. Experimental validation of the regulated expression of large numbers of non-coding RNAs from the mouse genome. Genome Res. 2006, 16, 11–19. [Google Scholar] [CrossRef] [PubMed] [Green Version]
- Guan, Y.; Kuo, W.-L.; Stilwell, J.L.; Takano, H.; Lapuk, A.V.; Fridlyand, J.; Mao, J.-H.; Yu, M.; Miller, M.A.; Santos, J.L.; et al. Amplification of PVT1 contributes to the pathophysiology of ovarian and breast cancer. Clin. Cancer Res. Off. J. Am. Assoc. Cancer Res. 2007, 13, 5745–5755. [Google Scholar] [CrossRef] [PubMed]
© 2015 by the authors; licensee MDPI, Basel, Switzerland. This article is an open access article distributed under the terms and conditions of the Creative Commons by Attribution (CC-BY) license (http://creativecommons.org/licenses/by/4.0/).
Share and Cite
Ilboudo, A.; Chouhan, J.; McNeil, B.K.; Osborne, J.R.; Ogunwobi, O.O. PVT1 Exon 9: A Potential Biomarker of Aggressive Prostate Cancer? Int. J. Environ. Res. Public Health 2016, 13, 12. https://0-doi-org.brum.beds.ac.uk/10.3390/ijerph13010012
Ilboudo A, Chouhan J, McNeil BK, Osborne JR, Ogunwobi OO. PVT1 Exon 9: A Potential Biomarker of Aggressive Prostate Cancer? International Journal of Environmental Research and Public Health. 2016; 13(1):12. https://0-doi-org.brum.beds.ac.uk/10.3390/ijerph13010012
Chicago/Turabian StyleIlboudo, Adeodat, Jyoti Chouhan, Brian K. McNeil, Joseph R. Osborne, and Olorunseun O. Ogunwobi. 2016. "PVT1 Exon 9: A Potential Biomarker of Aggressive Prostate Cancer?" International Journal of Environmental Research and Public Health 13, no. 1: 12. https://0-doi-org.brum.beds.ac.uk/10.3390/ijerph13010012