
The Rural-Urban Difference in BMI and Anemia among Children and Adolescents

 ,
,
Abstract
:1. Introduction
2. Materials and Methods
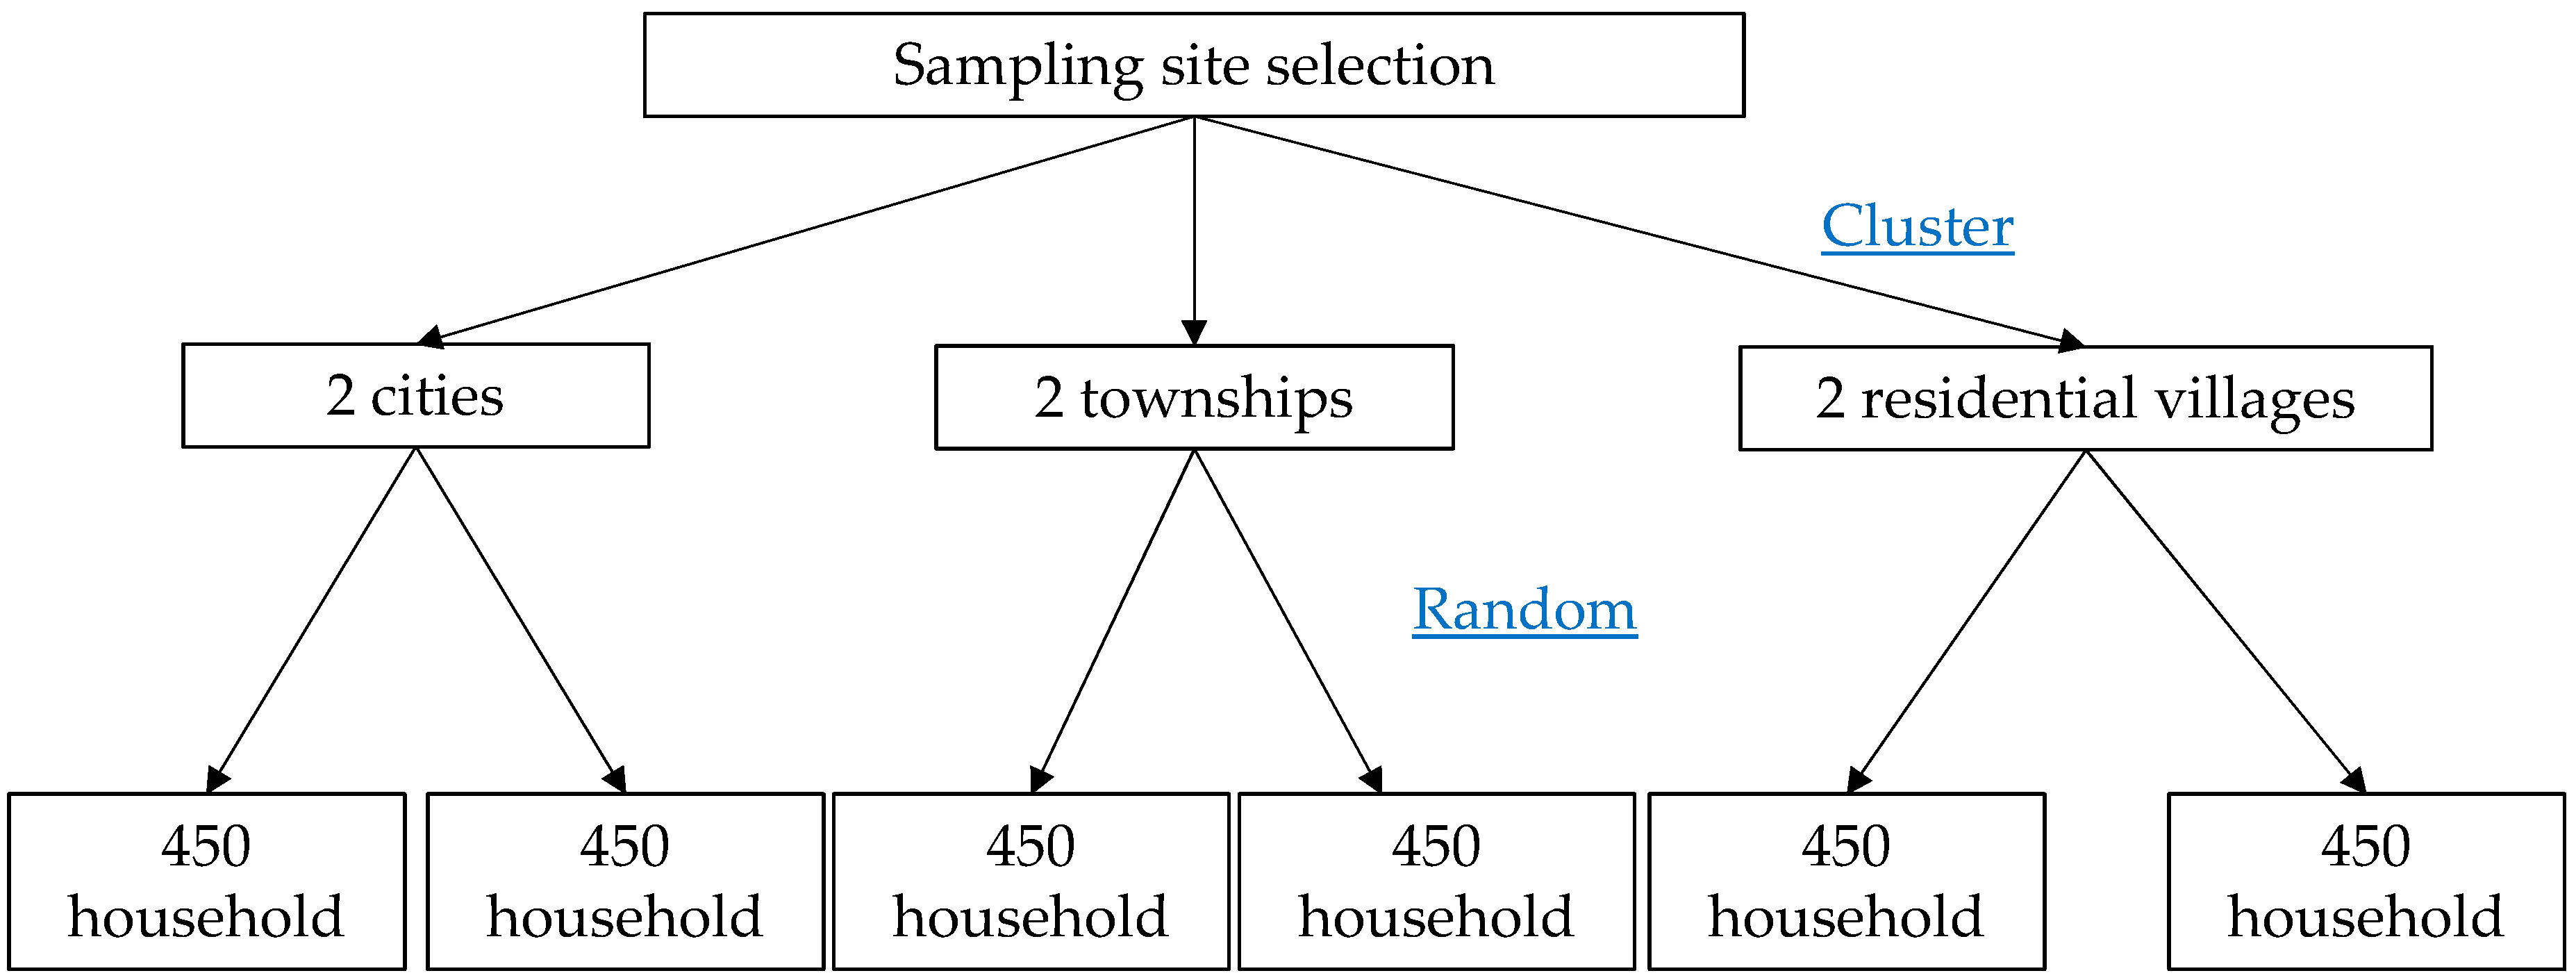
2.1. Participants
2.2. Measurements and Definition
2.3. Ethics
2.4. Statistics
3. Results
Daily Nutrient Intake among Children and Adolescents with Wasting, Reasonable BMI, Overweight and Obesity in Zhejiang Province
4. Discussion
5. Conclusions
Acknowledgments
Author Contributions
Conflicts of Interest
Ethical Approval
Informed Consent
References
- Weiss, R.; Dziura, J.; Burgert, T.S.; Tamborlane, W.V.; Taksali, S.E.; Yeckel, C.W.; Allen, K.; Lopes, M.; Savoye, M.; Morrison, J.; et al. Obesity and the metabolic syndrome in children and adolescents. N. Engl. J. Med. 2004, 350, 2362–2374. [Google Scholar] [CrossRef] [PubMed]
- Fu, J.F.; Liang, L.; Zou, C.C.; Hong, F.; Wang, C.L.; Wang, X.M.; Zhao, Z.Y. Prevalence of the metabolic syndrome in Zhejiang Chinese obese children and adolescents and the effect of metformin combined with lifestyle intervention. Int. J. Obes. 2007, 31, 15–22. [Google Scholar] [CrossRef] [PubMed]
- Lobstein, T.B.L.; Uauy, R. Obesity in children and young people: A crisis in public health. Obes. Rev. 2004, 5, 4–104. [Google Scholar] [CrossRef] [PubMed]
- Zhang, Y.X. Changes in the nutritional status of children and adolescents in Shandong, China. Public Health Nutr. 2016, 19, 2708–2711. [Google Scholar] [CrossRef] [PubMed]
- Li, L.M.; Rao, K.Q.; Kong, L.Z.; Yao, C.H.; Xiang, H.D.; Zhai, F.Y.; Ma, G.S.; Yang, X.G. Technical working group of China national nutrition and health survey: A description on the Chinese national nutrition and health survey in 2002. Chin. J. Epidemiol. 2005, 26, 474–484. [Google Scholar]
- Zimmermann, M.B.; Hurrell, R.F. Nutritional iron deficiency. Lancet 2007, 370, 511–520. [Google Scholar] [CrossRef]
- Hurrell, R.; Egli, I. Iron bioavailability and dietary reference values. Am. J. Clin. Nutr. 2010, 91, 1461S–1467S. [Google Scholar] [CrossRef] [PubMed]
- Winther, S.A.; Finer, N.; Sharma, A.M.; Torp-Pedersen, C.; Andersson, C. Association of anemia with the risk of cardiovascular adverse events in overweight/obese patients. Int. J. Obes. 2014, 38, 432–437. [Google Scholar] [CrossRef] [PubMed]
- Qin, Y.; Melse-Boonstra, A.; Pan, X.; Yuan, B.; Dai, Y.; Zhao, J.; Zimmermann, M.B.; Kok, F.J.; Zhou, M.; Shi, Z. Anemia in relation to body mass index and waist circumference among Chinese women. Nutr. J. 2013, 12. [Google Scholar] [CrossRef] [PubMed]
- Conde, W.L.; Monteiro, C.A. Nutrition transition and double burden of undernutrition and excess of weight in Brazil. Am. J. Clin. Nutr. 2014, 100, 1617S–1622S. [Google Scholar] [CrossRef] [PubMed]
- Laillou, A.; Yakes, E.; Le, T.H.; Wieringa, F.T.; Le, B.M.; Moench-Pfanner, R.; Berger, J. Intra-individual double burden of overweight and micronutrient deficiencies among Vietnamese women. PLoS ONE 2014, 9, e110499. [Google Scholar] [CrossRef] [PubMed]
- Yang, Y.; Wang, G.; Pan, X. China Food Composition Table 2002, 1st ed.; Beijing Medical University Publishing House: Beijing, China, 2002. [Google Scholar]
- Gao, G.; Zuo, P.; Sun, G.; Kai, H. Study on nutritional status of primary and middle school students in Huai’an and Nanjing. J. Hyg. Res. 2009, 38, 313–316. [Google Scholar]
- Hesketh, T.; Ding, Q.J.; Tomkins, A.M. Disparities in economic development in Eastern China: Impact on nutritional status of adolescents. Public Health Nutr. 2002, 5, 313–318. [Google Scholar] [CrossRef] [PubMed]
- Zou, Y.; Zhang, R.; Zhou, B.; Huang, L.; Chen, J.; Gu, F.; Zhang, H.; Fang, Y.; Ding, G. A comparison study on the prevalence of obesity and its associated factors among city, township and ruralarea adults in China. Br. Med. J. 2015, 5, e008417. [Google Scholar] [CrossRef]
- Olaya, B.; Moneta, M.V.; Pez, O.; Bitfoi, A.; Carta, M.G.; Eke, C.; Goelitz, D.; Keyes, K.M.; Kuijpers, R.; Lesinskiene, S.; et al. Country-level and individual correlates of overweight and obesity among primary school children: A cross-sectional study in seven European countries. BMC Public Health 2015, 15, 475. [Google Scholar] [CrossRef] [PubMed]
- Barbu, C.G.; Teleman, M.D.; Albu, A.I.; Sirbu, A.E.; Martin, S.C.; Bancescu, A.; Fica, S.V. Obesity and eating behaviors in school children and adolescents- data from a cross sectional study from Bucharest, Romania. Biol. Med. Cent. Public Health 2015, 15, 206. [Google Scholar] [CrossRef] [PubMed]
- Steinberger, J.; Jacobs, D.R.; Raatz, S.; Moran, A.; Hong, C.P.; Sinaiko, A.R. Comparison of body fatness measurements by BMI and skinfolds vs dual energy X-ray absorptiometry and their relation to cardiovascular risk factors in adolescents. Int. J. Obes. 2005, 29, 1346–1352. [Google Scholar] [CrossRef] [PubMed]
- Nasreddine, L.; Naja, F.; Akl, C.; Chamieh, M.C.; Karam, S.; Sibai, A.M.; Hwalla, N. Dietary, lifestyle and socio-economic correlates of overweight, obesity and central adiposity in Lebanese children and adolescents. Nutrients 2014, 6, 1038–1052. [Google Scholar] [CrossRef] [PubMed]
- Patrick, K.; Norman, G.J.; Calfas, K.J.; Sallis, J.F.; Zabinski, M.F.; Rupp, J.; Cella, J. Diet, physical activity, and sedentary behaviors as risk factors for overweight in adolescence. Arch. Pediatr. Adolesc. Med. 2004, 158, 385–390. [Google Scholar] [CrossRef] [PubMed]
- World Health Organization. Iron Deficiency Anemia: Assessment, Prevention, and Control, 1st ed.; World Health Organization: Geneva, Switzerland, 2001. [Google Scholar]
- Fishman, S.M.; Christian, P.; West, K.P. The role of vitamins in the prevention and control of anemia. Public Health Nutr. 2000, 3, 125–150. [Google Scholar] [CrossRef] [PubMed]
- Sharif, M.; Madani, M.; Tabatabaie, F. Comparative evaluation of iron deficiency among obese and non-obese children. Iran. J. Ped. Hematol. Oncol. 2014, 4, 160–166. [Google Scholar] [PubMed]
- Cepeda-Lopez, A.C.; Osendarp, S.J.; Melse-Boonstra, A.; Aeberli, I.; Gonzalez-Salazar, F.; Feskens, E.; Villalpando, S.; Zimmermann, M.B. Sharply higher rates of iron deficiency in obese Mexican women and children are predicted by obesity-related inflammation rather than by differences in dietary iron intake. Am. J. Clin. Nutr. 2011, 93, 975–983. [Google Scholar] [CrossRef] [PubMed]


| Nutritional Status | Population | City | Township | Residential Village | χ2 | p |
|---|---|---|---|---|---|---|
| Wasting | Children | 5.2% | 8.6% | 9.7% | 3.749 | 0.153 |
| Adolescents | 9.5% | 9.1% | 10.9% | 0.472 | 0.790 | |
| Obesity | Children | 10.3% | 8.5% | 5.5% | 4.544 | 0.103 |
| Adolescents | 1.4% | 2.9% | 2.8% | 1.037 | 0.595 | |
| Anemia | Children | 4.3% | 2.5% | 4.5% | 1.955 | 0.376 |
| Adolescents | 6.1% | 3.7% | 11.3% | 10.824 | 0.024 |
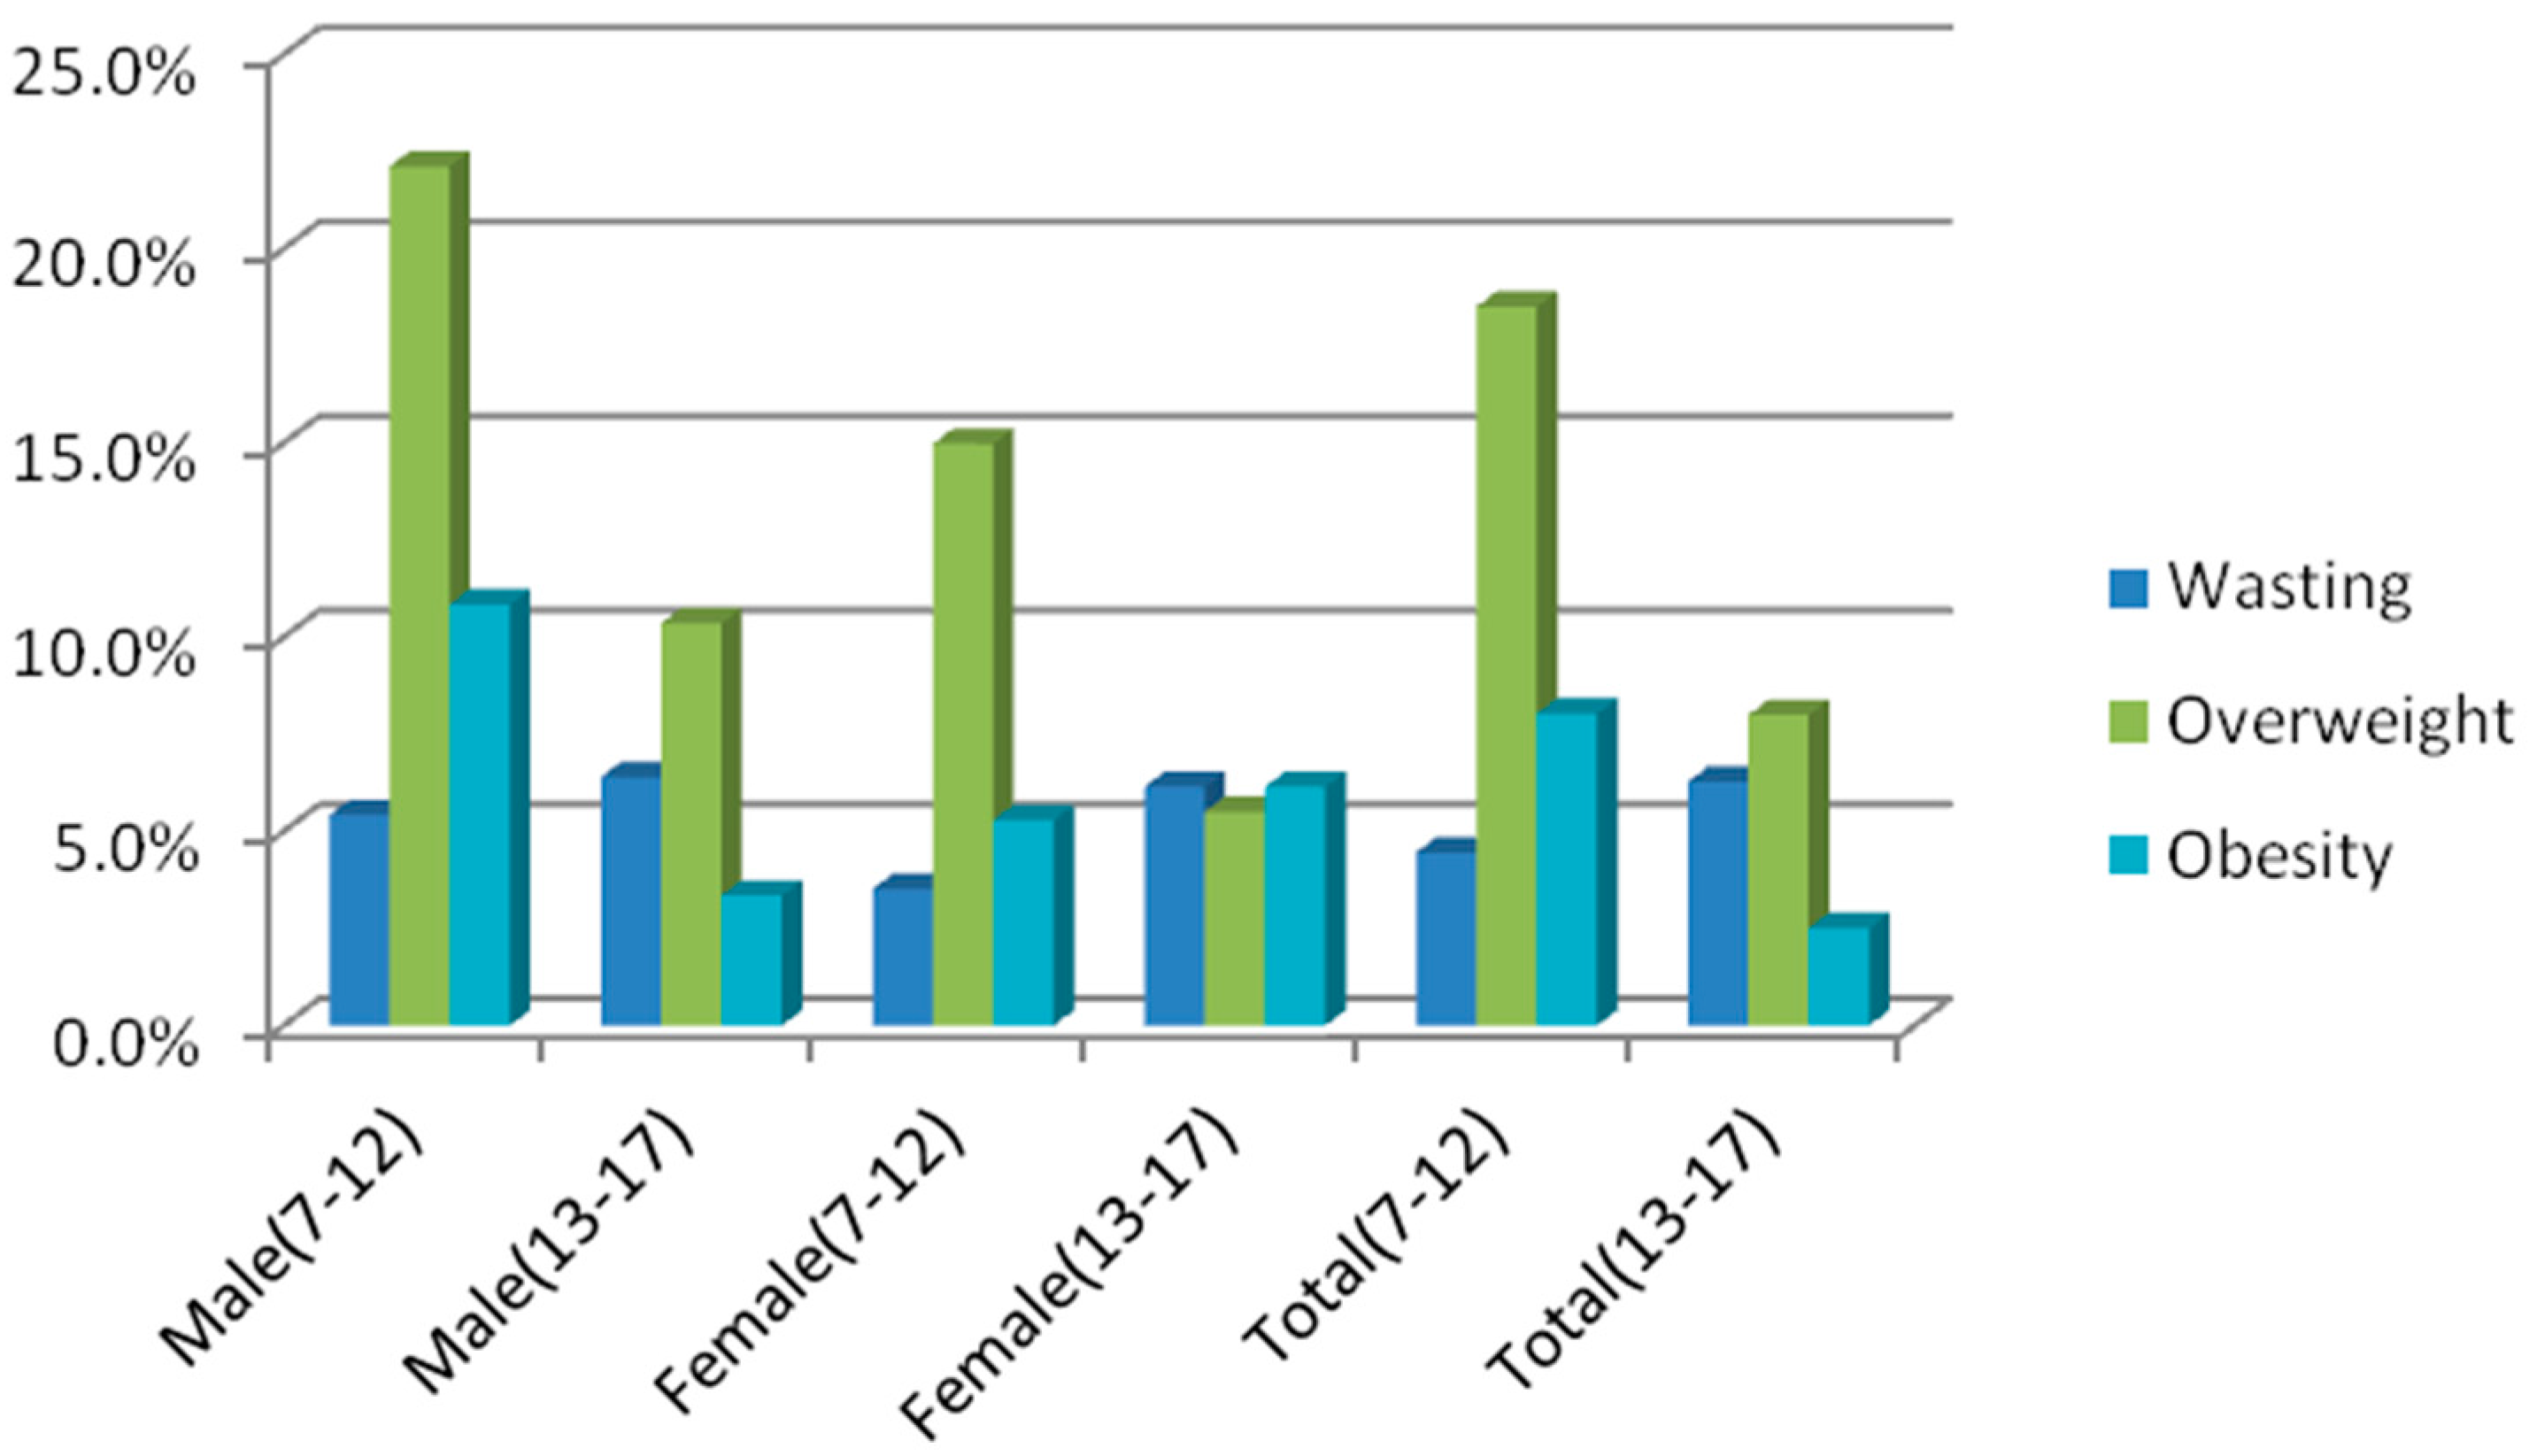
| Age (Years) | Male | Female | Total | ||||||||||||||||||
|---|---|---|---|---|---|---|---|---|---|---|---|---|---|---|---|---|---|---|---|---|---|
| Wasting | Overweight | Obesity | Wasting | Overweight | Obesity | Wasting | Overweight | Obesity | |||||||||||||
| N | Percentage | N | Percentage | N | Percentage | Total | N | Percentage | N | Percentage | N | Percentage | Total | N | Percentage | N | Percentage | N | Percentage | Total | |
| 7 | 4 | 4.82% | 17 | 20.48% | 9 | 10.84% | 83 | 4 | 4.12% | 16 | 16.49% | 7 | 7.22% | 97 | 8 | 4.44% | 33 | 18.33% | 16 | 8.89% | 180 |
| 8 | 4 | 5.13% | 26 | 33.33% | 16 | 20.51% | 78 | 2 | 2.78% | 17 | 23.61% | 6 | 8.33% | 72 | 6 | 4.00% | 43 | 28.67% | 22 | 14.67% | 150 |
| 9 | 6 | 9.84% | 14 | 22.95% | 8 | 13.11% | 61 | 2 | 2.90% | 12 | 17.39% | 5 | 7.25% | 69 | 8 | 6.15% | 26 | 20.00% | 13 | 10.00% | 130 |
| 10 | 3 | 3.95% | 16 | 21.05% | 7 | 9.21% | 76 | 2 | 2.63% | 8 | 10.53% | 1 | 1.32% | 76 | 5 | 3.29% | 24 | 15.79% | 8 | 5.26% | 152 |
| 11 | 5 | 6.94% | 13 | 18.06% | 2 | 2.78% | 72 | 2 | 2.74% | 7 | 9.59% | 3 | 4.11% | 73 | 7 | 4.83% | 20 | 13.79% | 5 | 3.45% | 145 |
| 12 | 2 | 2.74% | 12 | 16.44% | 6 | 8.22% | 73 | 4 | 5.97% | 8 | 11.94% | 2 | 2.99% | 67 | 6 | 4.29% | 20 | 14.29% | 8 | 5.71% | 140 |
| 13 | 4 | 5.56% | 6 | 8.33% | 2 | 2.78% | 72 | 7 | 12.28% | 3 | 5.26% | 1 | 1.75% | 57 | 11 | 8.53% | 9 | 6.98% | 3 | 2.33% | 129 |
| 14 | 7 | 10.77% | 5 | 7.69% | 1 | 1.54% | 65 | 3 | 4.84% | 0 | 0.00% | 0 | 0.00% | 62 | 10 | 7.87% | 5 | 3.94% | 1 | 0.79% | 127 |
| 15 | 3 | 4.62% | 8 | 12.31% | 2 | 3.08% | 65 | 4 | 5.56% | 7 | 9.72% | 2 | 2.78% | 72 | 7 | 5.11% | 15 | 10.95% | 4 | 2.92% | 137 |
| 16 | 4 | 5.97% | 6 | 8.96% | 3 | 4.48% | 67 | 2 | 2.86% | 3 | 4.29% | 1 | 1.43% | 70 | 6 | 4.38% | 9 | 6.57% | 4 | 2.92% | 137 |
| 17 | 3 | 5.08% | 9 | 15.25% | 3 | 5.08% | 59 | 3 | 6.25% | 4 | 8.33% | 1 | 2.08% | 48 | 6 | 5.61% | 13 | 12.15% | 4 | 3.74% | 107 |
| Total (7–12) | 24 | 5.42% | 98 | 22.12% | 48 | 10.84% | 443 | 16 | 3.52% | 68 | 14.98% | 24 | 5.29% | 454 | 40 | 4.46% | 166 | 18.51% | 72 | 8.03% | 897 |
| Total (13–17) | 21 | 6.40% | 34 | 10.36% | 11 | 3.35% | 328 | 19 | 6.15% | 17 | 5.50% | 5 | 6.15% | 309 | 40 | 6.28% | 51 | 8.00% | 16 | 2.51% | 637 |
| Age (Years) | Male | Female | Total | ||||||||||
|---|---|---|---|---|---|---|---|---|---|---|---|---|---|
| Hemoglobin (g/L) | SD | Anemia (N, %) | Hemoglobin (g/L) | SD | Anemia (N, %) | Hemoglobin (g/L) | SD | Anemia (N, %) | Total | ||||
| 7 | 132.33 | 10.06 | 4 | 4.80% | 133.33 | 13.16 | 4 | 4.10% | 132.86 | 11.78 | 8 | 4.40% | 180 |
| 8 | 135.92 | 13.00 | 4 | 5.10% | 134 | 13.02 | 5 | 6.90% | 134.95 | 13.00 | 9 | 6.00% | 150 |
| 9 | 135.97 | 10.33 | 2 | 3.30% | 135.62 | 11.15 | 1 | 1.40% | 135.78 | 10.74 | 3 | 2.30% | 130 |
| 10 | 138.56 | 9.54 | 0 | 0.00% | 138.25 | 10.07 | 1 | 1.30% | 138.32 | 9.79 | 1 | 0.70% | 152 |
| 11 | 136.55 | 11.04 | 2 | 2.80% | 139.6 | 10.11 | 0 | 0.00% | 138.06 | 10.66 | 2 | 1.40% | 145 |
| 12 | 139.81 | 12.14 | 6 | 8.20% | 140.4 | 11.54 | 5 | 7.50% | 138.81 | 11.83 | 11 | 7.90% | 140 |
| 13 | 143.84 | 14.47 | 4 | 5.60% | 137.16 | 10.28 | 3 | 5.30% | 140.91 | 13.18 | 7 | 5.40% | 129 |
| 14 | 143.25 | 16.22 | 5 | 7.70% | 135.43 | 10.96 | 4 | 6.50% | 139.61 | 14.49 | 9 | 7.10% | 127 |
| 15 | 154.56 | 18.45 | 4 | 6.20% | 137.89 | 28.18 | 10 | 13.90% | 145.59 | 25.49 | 14 | 10.22% | 137 |
| 16 | 153.71 | 10.33 | 0 | 0.00% | 135.58 | 14.77 | 10 | 15.20% | 144.06 | 15.72 | 10 | 7.29% | 137 |
| 17 | 151.64 | 14.00 | 1 | 1.70% | 133.37 | 13.85 | 5 | 10.40% | 143.35 | 16.60 | 6 | 5.60% | 107 |
| Total (7–12) | 135.78 | 11.17 | 18 | 3.98% | 136.19 | 11.98 | 16 | 3.55% | 136.00 | 11.59 | 34 | 3.79% | 897 |
| Total (13–17) | 149.18 | 15.59 | 14 | 4.21% | 136.07 | 17.61 | 32 | 10.49% | 142.77 | 17.84 | 46 | 7.22% | 637 |
| Anemia | Overweight | Obesity | Overweight | Obesity | χ2 | p | |||||
|---|---|---|---|---|---|---|---|---|---|---|---|
| N | Percentage | N | Percentage | N | Percentage | N | Percentage | ||||
| Male | Yes | 2 | 4.44% | 28 | 4.74% | 0 | 0.00% | 2 | 3.39% | 4.091 | 0.252 |
| No | 43 | 95.56% | 563 | 95.26% | 80 | 100.00% | 57 | 96.61% | |||
| Female | Yes | 2 | 6.90% | 4 | 11.43% | 40 | 6.27% | 2 | 3.51% | 2.321 | 0.508 |
| No | 27 | 93.10% | 31 | 88.57% | 598 | 93.73% | 55 | 96.49% | |||
| Total | Yes | 6 | 7.50% | 68 | 5.53% | 2 | 1.46% | 4 | 4.55% | 5.084 | 0.166 |
| No | 74 | 92.50% | 1161 | 94.47% | 135 | 98.54% | 84 | 95.45% | |||
| Nutrients/Day | Wasting (N = 80) | Reasonable BMI (N = 1149) | Overweight (N = 217) | Obesity (N = 88) | ||||||||||
|---|---|---|---|---|---|---|---|---|---|---|---|---|---|---|
| Median | 25% | 75% | Median | 25% | 75% | Median | 25% | 75% | Median | 25% | 75% | H | p | |
| Energy (kcal) | 1307.83 | 1059.37 | 1408.04 | 1415.83 | 1144.24 | 1758.06 | 1415.3 | 1272.91 | 1758.06 | 848.86 | 396.47 | 1301.24 | 6.534 | 0.088 |
| Protein (g) | 39.89 | 28.21 | 46.21 | 48.31 | 35.47 | 62.31 | 46.49 | 40.4 | 49.29 | 29.09 | 11.03 | 47.15 | 8.015 | 0.046 |
| Fat (g) | 50.35 | 22.95 | 58.04 | 52.59 | 33.26 | 80.87 | 51 | 43.29 | 67.93 | 38.52 | 11.1 | 65.93 | 10.211 | 0.017 |
| Carbohydrate (g) | 160.89 | 134.47 | 198.62 | 182.42 | 149.09 | 234.11 | 179.07 | 155.69 | 234.53 | 93.43 | 53.79 | 133.06 | 1.241 | 0.743 |
| Cholesterol (mg) | 99.96 | 44.22 | 365.79 | 140.55 | 89.51 | 330.56 | 164.47 | 121.92 | 300.86 | 169.6 | 72.84 | 266.36 | 4.025 | 0.259 |
| Dietary fiber (g) | 4.76 | 4.4 | 6.28 | 5.46 | 3.91 | 9.97 | 10.05 | 8.02 | 11.74 | 2.48 | 1.54 | 3.42 | 6.574 | 0.087 |
| Vitamin A (μg RE) | 174.17 | 103.12 | 294.43 | 226.8 | 108.45 | 326.96 | 231.44 | 143.05 | 308.16 | 512.94 | 60.36 | 965.53 | 1.744 | 0.627 |
| Retinol (μg RE) | 34.89 | 20.04 | 139.91 | 50.25 | 23.75 | 108.6 | 59.36 | 33.14 | 181.36 | 457.56 | 25.11 | 890.01 | 5.907 | 0.116 |
| Thiamin (mg) | 0.46 | 0.34 | 0.53 | 0.58 | 0.43 | 0.73 | 0.53 | 0.45 | 0.55 | 0.37 | 0.16 | 0.58 | 5.859 | 0.119 |
| Riboflavin (mg) | 0.4 | 0.32 | 0.53 | 0.51 | 0.32 | 0.66 | 0.5 | 0.44 | 0.55 | 0.51 | 0.12 | 0.9 | 8.366 | 0.039 |
| Niacin (mg NE) | 9.39 | 7.43 | 11.67 | 9.53 | 7.91 | 13.51 | 9.08 | 8.23 | 10.67 | 9.11 | 3.15 | 15.07 | 3.861 | 0.277 |
| Vitamin C (mg) | 28.33 | 21.65 | 49.11 | 27.88 | 17.43 | 46.45 | 29.1 | 22.61 | 31.06 | 14.24 | 9.7 | 18.78 | 4.446 | 0.217 |
| Vitamin E (mg) | 8.55 | 7.85 | 19.38 | 15.37 | 9.42 | 23.56 | 16.39 | 12.44 | 18.19 | 6.31 | 2.5 | 10.11 | 6.435 | 0.092 |
| Ca (mg) | 218.89 | 156.18 | 288.5 | 240.45 | 148.53 | 346.04 | 214.69 | 170.31 | 242.63 | 101.69 | 58.63 | 144.75 | 3.559 | 0.313 |
| P (mg) | 518.84 | 388.44 | 639.16 | 690.35 | 466.93 | 874.84 | 620.37 | 572.42 | 626.39 | 425.55 | 154.27 | 696.83 | 7.886 | 0.048 |
| K (mg) | 814.06 | 642.08 | 1145.42 | 1135.84 | 678.08 | 1622.07 | 1221.53 | 1052.81 | 1363.47 | 619.26 | 289.41 | 949.11 | 3.58 | 0.311 |
| Na (mg) | 2623.96 | 1236.4 | 4179.63 | 3360.17 | 1972.54 | 4599.96 | 2990.45 | 2398 | 4960.4 | 2259.08 | 731.73 | 3786.43 | 1.84 | 0.606 |
| Mg (mg) | 156.16 | 125.04 | 175.45 | 179.94 | 134.16 | 240.09 | 163.08 | 143.08 | 208.88 | 100.48 | 47.51 | 153.45 | 2.941 | 0.401 |
| Fe (mg) | 12.95 | 11.49 | 14.9 | 13.72 | 10.81 | 17.3 | 13.08 | 11.07 | 14.68 | 12.13 | 3.3 | 20.97 | 2.297 | 0.513 |
| Zn (mg) | 6.73 | 5.08 | 7.6 | 7.89 | 6.18 | 9 | 7.24 | 6.1 | 7.75 | 4.62 | 1.68 | 7.55 | 3.97 | 0.265 |
| Se (μg) | 18.04 | 13.55 | 28.42 | 21.98 | 17.77 | 41.78 | 23.99 | 19.56 | 30.31 | 29.61 | 9.56 | 49.66 | 7.645 | 0.054 |
| Cu (mg) | 1.04 | 1 | 1.35 | 1.32 | 0.98 | 1.77 | 1.55 | 1.31 | 3.04 | 0.6 | 0.28 | 0.91 | 4.545 | 0.208 |
| Mn (mg) | 3.3 | 2.46 | 3.68 | 3.89 | 3.39 | 4.53 | 3.54 | 2.73 | 4.35 | 2.48 | 0.88 | 4.07 | 3.662 | 0.3 |
© 2016 by the authors; licensee MDPI, Basel, Switzerland. This article is an open access article distributed under the terms and conditions of the Creative Commons Attribution (CC-BY) license (http://creativecommons.org/licenses/by/4.0/).
Share and Cite
Zou, Y.; Zhang, R.-H.; Xia, S.-C.; Huang, L.-C.; Fang, Y.-Q.; Meng, J.; Chen, J.; Zhang, H.-X.; Zhou, B.; Ding, G.-Q. The Rural-Urban Difference in BMI and Anemia among Children and Adolescents. Int. J. Environ. Res. Public Health 2016, 13, 1020. https://0-doi-org.brum.beds.ac.uk/10.3390/ijerph13101020
Zou Y, Zhang R-H, Xia S-C, Huang L-C, Fang Y-Q, Meng J, Chen J, Zhang H-X, Zhou B, Ding G-Q. The Rural-Urban Difference in BMI and Anemia among Children and Adolescents. International Journal of Environmental Research and Public Health. 2016; 13(10):1020. https://0-doi-org.brum.beds.ac.uk/10.3390/ijerph13101020
Chicago/Turabian StyleZou, Yan, Rong-Hua Zhang, Shi-Chang Xia, Li-Chun Huang, Yue-Qiang Fang, Jia Meng, Jiang Chen, He-Xiang Zhang, Biao Zhou, and Gang-Qiang Ding. 2016. "The Rural-Urban Difference in BMI and Anemia among Children and Adolescents" International Journal of Environmental Research and Public Health 13, no. 10: 1020. https://0-doi-org.brum.beds.ac.uk/10.3390/ijerph13101020