Article

Pollution and Oral Bioaccessibility of Pb in Soils of Villages and Cities with a Long Habitation History

1
GeoConnect, Meester Dekkerstraat 4, Castricum 1901 PV, The Netherlands
2
Rijksinstituut voor Volksgezondheid en Milieu (RIVM), P.O. Box 1, Bilthoven 3720 BA, The Netherlands
3
Rijksdienst voor het Cultureel Erfgoed, Cultural Heritage Agency, P.O. Box 1600, Amersfoort 3800 BP, The Netherlands
4
Bureau de Recherches Géologiques et Minières (BRGM), 3 Avenue Claude-Guillemin, BP 36009, Orléans Cedex 2 45060, The Netherlands
5
Department of Earth Sciences, University Utrecht, P.O. Box 80021, Utrecht 3508 TA, The Netherlands
6
Geology & Geochemistry, Faculty of Earth and Life Sciences, VU University Amsterdam, De Boelelaan 1085, Amsterdam 1081 HV, The Netherlands
*
Author to whom correspondence should be addressed.
Int. J. Environ. Res. Public Health 2016, 13(2), 221; https://0-doi-org.brum.beds.ac.uk/10.3390/ijerph13020221
Submission received: 7 January 2016 / Revised: 4 February 2016 / Accepted: 5 February 2016 / Published: 17 February 2016
(This article belongs to the Special Issue Lead: Risk Assessment and Health Effects)

Abstract

:
The Dutch cities Utrecht and Wijk bij Duurstede were founded by the Romans around 50 B.C. and the village Fijnaart and Graft-De Rijp around 1600 A.D. The soils of these villages are polluted with Pb (up to ~5000 mg/kg). Lead isotope ratios were used to trace the sources of Pb pollution in the urban soils. In ~75% of the urban soils the source of the Pb pollution was a mixture of glazed potsherd, sherds of glazed roof tiles, building remnants (Pb sheets), metal slag, Pb-based paint flakes and coal ashes. These anthropogenic Pb sources most likely entered the urban soils due to historical smelting activities, renovation and demolition of houses, disposal of coal ashes and raising and fertilization of land with city waste. Since many houses still contain Pb-based building materials, careless renovation or demolition can cause new or more extensive Pb pollution in urban soils. In ~25% of the studied urban topsoils, Pb isotope compositions suggest Pb pollution was caused by incinerator ash and/or gasoline Pb suggesting atmospheric deposition as the major source. The bioaccessible Pb fraction of 14 selected urban soils was determined with an in vitro test and varied from 16% to 82% of total Pb. The bioaccessibility appears related to the chemical composition and grain size of the primary Pb phases and pollution age. Risk assessment based on the in vitro test results imply that risk to children may be underestimated in ~90% of the studied sample sites (13 out of 14).

1. Introduction

Pollution of soils with heavy metals, including lead (Pb), started with the domestication of fire [1]. The remnants of burnt firewood are rich in heavy metals and alter the metal content of the topsoil near the fireplace. Lead pollution became significant after the discovery of cupellation (extraction of silver from lead ores) around 3500 B.C [2] and reached its peak in the 1970s when leaded gasoline was the major energy source for cars world-wide [3,4,5,6]. Adoption of a series of regulations to ban leaded gasoline in the 1970s, drastically reduced Pb emissions to the environment [7,8,9,10,11].
Lead pollution in soils is generally recognised by elevated contents of Pb and/or other heavy metals in the topsoil. Since Pb accumulation in soils can also be the result of natural processes, Pb isotope measurements are an effective tracer to establish whether excess Pb contents are from anthropogenic Pb sources [12,13,14,15,16,17,18,19]. Concerns regarding the possible human- and ecotoxicological risks of soils polluted with Pb has led to numerous studies of Pb pollution in various parts of the world since the 1970s [12,13,20,21,22,23]. The majority of these studies focussed on the atmospheric Pb input to soils and sediments [7,8,24,25,26,27]. Very few studies tried to trace and quantify the input of anthropogenic Pb to soils related to domestic activities. Notable exceptions are Walraven et al. [14] and Hansmann and Köppel [15].
The ubiquity of Pb in and around the household, even in Roman times, is well-known [28]. In addition to the often cited lead-paint chips and house dust, high Pb contents have also been found in printed matter, wrapping paper, textiles, ceramics (pots and plates), constructing materials (lead slabs) and even toothpaste [2]. Some of these household and construction artefacts enter soils where they may constitute a highly localised source of Pb pollution. Lead in house paints, for example, can be transferred to soil by natural weathering or by burning-off, sanding or scraping of the old paint before repainting. High Pb contents (up to 1.7 wt.%; [29]) have been found in soils and dirt in the immediate vicinity of old wooden houses [14,29,30].
Although household and construction artefacts only cause very localised Pb pollution, it may pose a threat to human health. Remnants of Pb-containing artefacts may end up in the topsoil of gardens where people grow vegetables and children play. Lead can enter the human body after oral ingestion of vegetables and soil, either accidentally via hand-to-mouth behaviour or deliberately. Children are far more sensitive to Pb poisoning than adults [31]. Even at low exposure levels, Pb causes impairment of normal neurological development in children leading to learning and reasoning difficulties, retardation of physical development, hearing loss, hyperactivity, and reduced attention span [4]. Effects in adults include elevated blood pressure and hypertension, resulting in increased risk of cardiovascular diseases, and renal deficiencies.
During the last decade many in vitro tests have been developed and evaluated to estimate the oral bioavailability of contaminants/compounds, including Pb, in soils [32]. With these tests, oral Pb bioaccessibility can be determined as an indication for the maximum oral Pb bioavailability of Pb polluted soils. There is evidence that the oral bioavailability of Pb in soils depends on the type of anthropogenic Pb source present. Walraven et al. [32], for example, have shown that the oral Pb bioaccessibility, based on the RIVM in vitro test [33], decreased in the following order: Pb bullets and pellets > Car battery Pb > Made ground Pb ≈ Gasoline Pb ≈ Diffuse Pb > City waste (also known as municipal solid waste).
Soils from villages and cities with a long habitation history usually contain various anthropogenic Pb sources and the specific make of these sources will influence the bioavailability, and related human risks, to a great extent. The aim of this study is to determine the sources, mainly related to domestic activities, and oral accessibility of Pb pollution in soils of two villages and two cities with a long habitation history. The two cities were already inhabited in Roman times and the two villages were founded around 1600 A.D. Lead isotope analysis is used to trace the anthropogenic Pb sources responsible for Pb pollution in soils covering the Roman (57 B.C.–350 A.D.), Medieval (500 A.D.–1500 A.D.) and Modern (1500 A.D.–2003 A.D.) time periods.

2. Background Information

A distinction between natural and anthropogenic Pb, and between the anthropogenic Pb sources can only be made if the Pb isotope composition of the various Pb sources differs significantly. Walraven et al. [14] demonstrated that with a combination of Pb isotope analysis, major and trace element analysis and fuzzy clustering, natural Pb in soils can be distinguished from anthropogenic Pb. In addition, three sources of Pb pollution in soils could be distinguished: (1) construction materials of old houses (building materials such as Pb sheets, glazed roof tiles and paint); (2) coal ashes and (3) alkyl-leaded petrol. The village of Graft-De Rijp was used as the basis of the Walraven et al. [14] study. In the present study we extended the research on Pb pollution due to domestic activities, from one village/city to four. Furthermore, the habitation history of the newly investigated cities/villages is longer: from 57 BC to 2003 A.D. instead of 1612 A.D. to 1997 A.D. With a greater number of soil samples and Pb containing artefacts, we attempted to resolve more sources of Pb pollution and to better quantify specific Pb polluting activities.
The 4 studied villages/cities—in order of habitation—are Utrecht, Wijk bij Duurstede, Fijnaart and Graft-De Rijp. The approximate locations of these cities and villages are shown in Figure 1, and their precise location and date of sample collection in Table 1. Various environmental studies have shown that the soils in all 4 villages/cities are polluted with Pb and related heavy metals [14,34,35].

2.1. Utrecht

Utrecht is located approximately 40 km southeast of Amsterdam (Figure 1). It is the fourth largest city in The Netherlands, with a population of ~316,000 persons [36]. The high sandy river banks of the Crooked Rhine and the Old Rhine—where Utrecht is now located—were already inhibited during the Bronze Age (1800–800 B.C.) [37]). In 47 A.D. the Romans arrived and built an outpost on the south bank of the Crooked Rhine on a fordable point which was called Trajectum ad Rhenum (Lat. = fort of the Rhine) [37]. Utrecht was one of the forts on the northern borders of the Roman Empire intended to ward off invasions from Germania. Many Roman artefacts are found in Utrecht and its surroundings, among others lead weights, leaden coins, leaden ornaments and leaden eating utensils [38].
Around 275 A.D. the Romans left Utrecht and little is known about the period 275 to 650 A.D. [37]. During the Middle Ages (500 to 1500 A.D.) Utrecht was a religious and commercial centre [39]. Due to trading activities, Utrecht became a prosperous city with renowned annual fairs. Trade and industry was accompanied by intensive shipping activities, resulting in the construction of many canals and wharfs [39]. In this time period the use of lead for painting, roofing materials, manufacturing of glass and Pb glazed pottery increased [31]. In addition the ubiquitous pewter ware contained high Pb content during these times [31].
With the onset of the Industrial Revolution some small scale Pb working industries were established in Utrecht (e.g., Pb white factory and Pb flatting mills) [40]. Industrialisation, however, only gained momentum in and around Utrecht late in the 19th century and today the local economy predominantly is based mainly on service activities.

2.2. Wijk bij Duurstede

Wijk bij Duurstede is located close to Utrecht (20 km southeast of Utrecht; Figure 1) and has a population of ~23,000 persons [36]. Its history resembles that of Utrecht with evidence for habitation in the Bronze age [41]. In 57 B.C. the Romans settled here and built a fort, presumably called Levefanum, to protect themselves from invasions from Germania [41]. In the early middle ages, a settlement named Dorestad emerged at the site of the Roman fortress. Dorestad was an important trade settlement that drew the attention of the Vikings, who frequently raided the settlement in the 9th century [41]. Wijk bij Duurstede is a small city with no significant industries on the site of Dorestad.

2.3. Fijnaart

Fijnaart is located ~90 km south of Amsterdam (Figure 1) and has a population of ~5,000 persons [36]. Little information is known about the history of Fijnaart. It was founded in 1547 A.D. in a polder [42]. The main buildings were dike houses and ribbon settlement. The main economic activities are agriculture and fishery. There is no significant industry.

2.4. Graft-De Rijp

Graft-De Rijp is located ~25 km north of Amsterdam and has a population of ~6000 persons [36]. A summary of the history of Graft-De Rijp is given below, taken from Walraven et al. [14]. In 1612 A.D., the Beemster (area surrounding Graft-De Rijp) was reclaimed from the sea. Around this time De Rijp was founded. Until the 17th century houses in this village were entirely constructed from wood, which was treated with Pb-based paint and roofed with glazed (Pb-based) and unglazed tiles. During this period rain pipes and gutters were predominantly made from Pb and Zn. In the mid-17th century an economic boom (as a result of whaling) stimulated the development of sites for ship building, sail-lofts and industrial mills. Waste products of these activities were used to raise the land. During this time, three large fires destroyed many houses (in 1654 A.D., 1657 A.D. and 1674 A.D.). The debris from the fires was used to raise more of the land. In the 18th century an economic recession took place. From this time until the 19th century many buildings became derelict or were destroyed. The waste products were again used to raise the land and to fill ditches and channels. In the industrial era (after 1860 year A.D.) gasworks, coal storehouses, printing-works and tanneries were started. Subsequently, the town centre was rebuilt on a mixture of sludge, manure and town refuse [14].

3. Methods

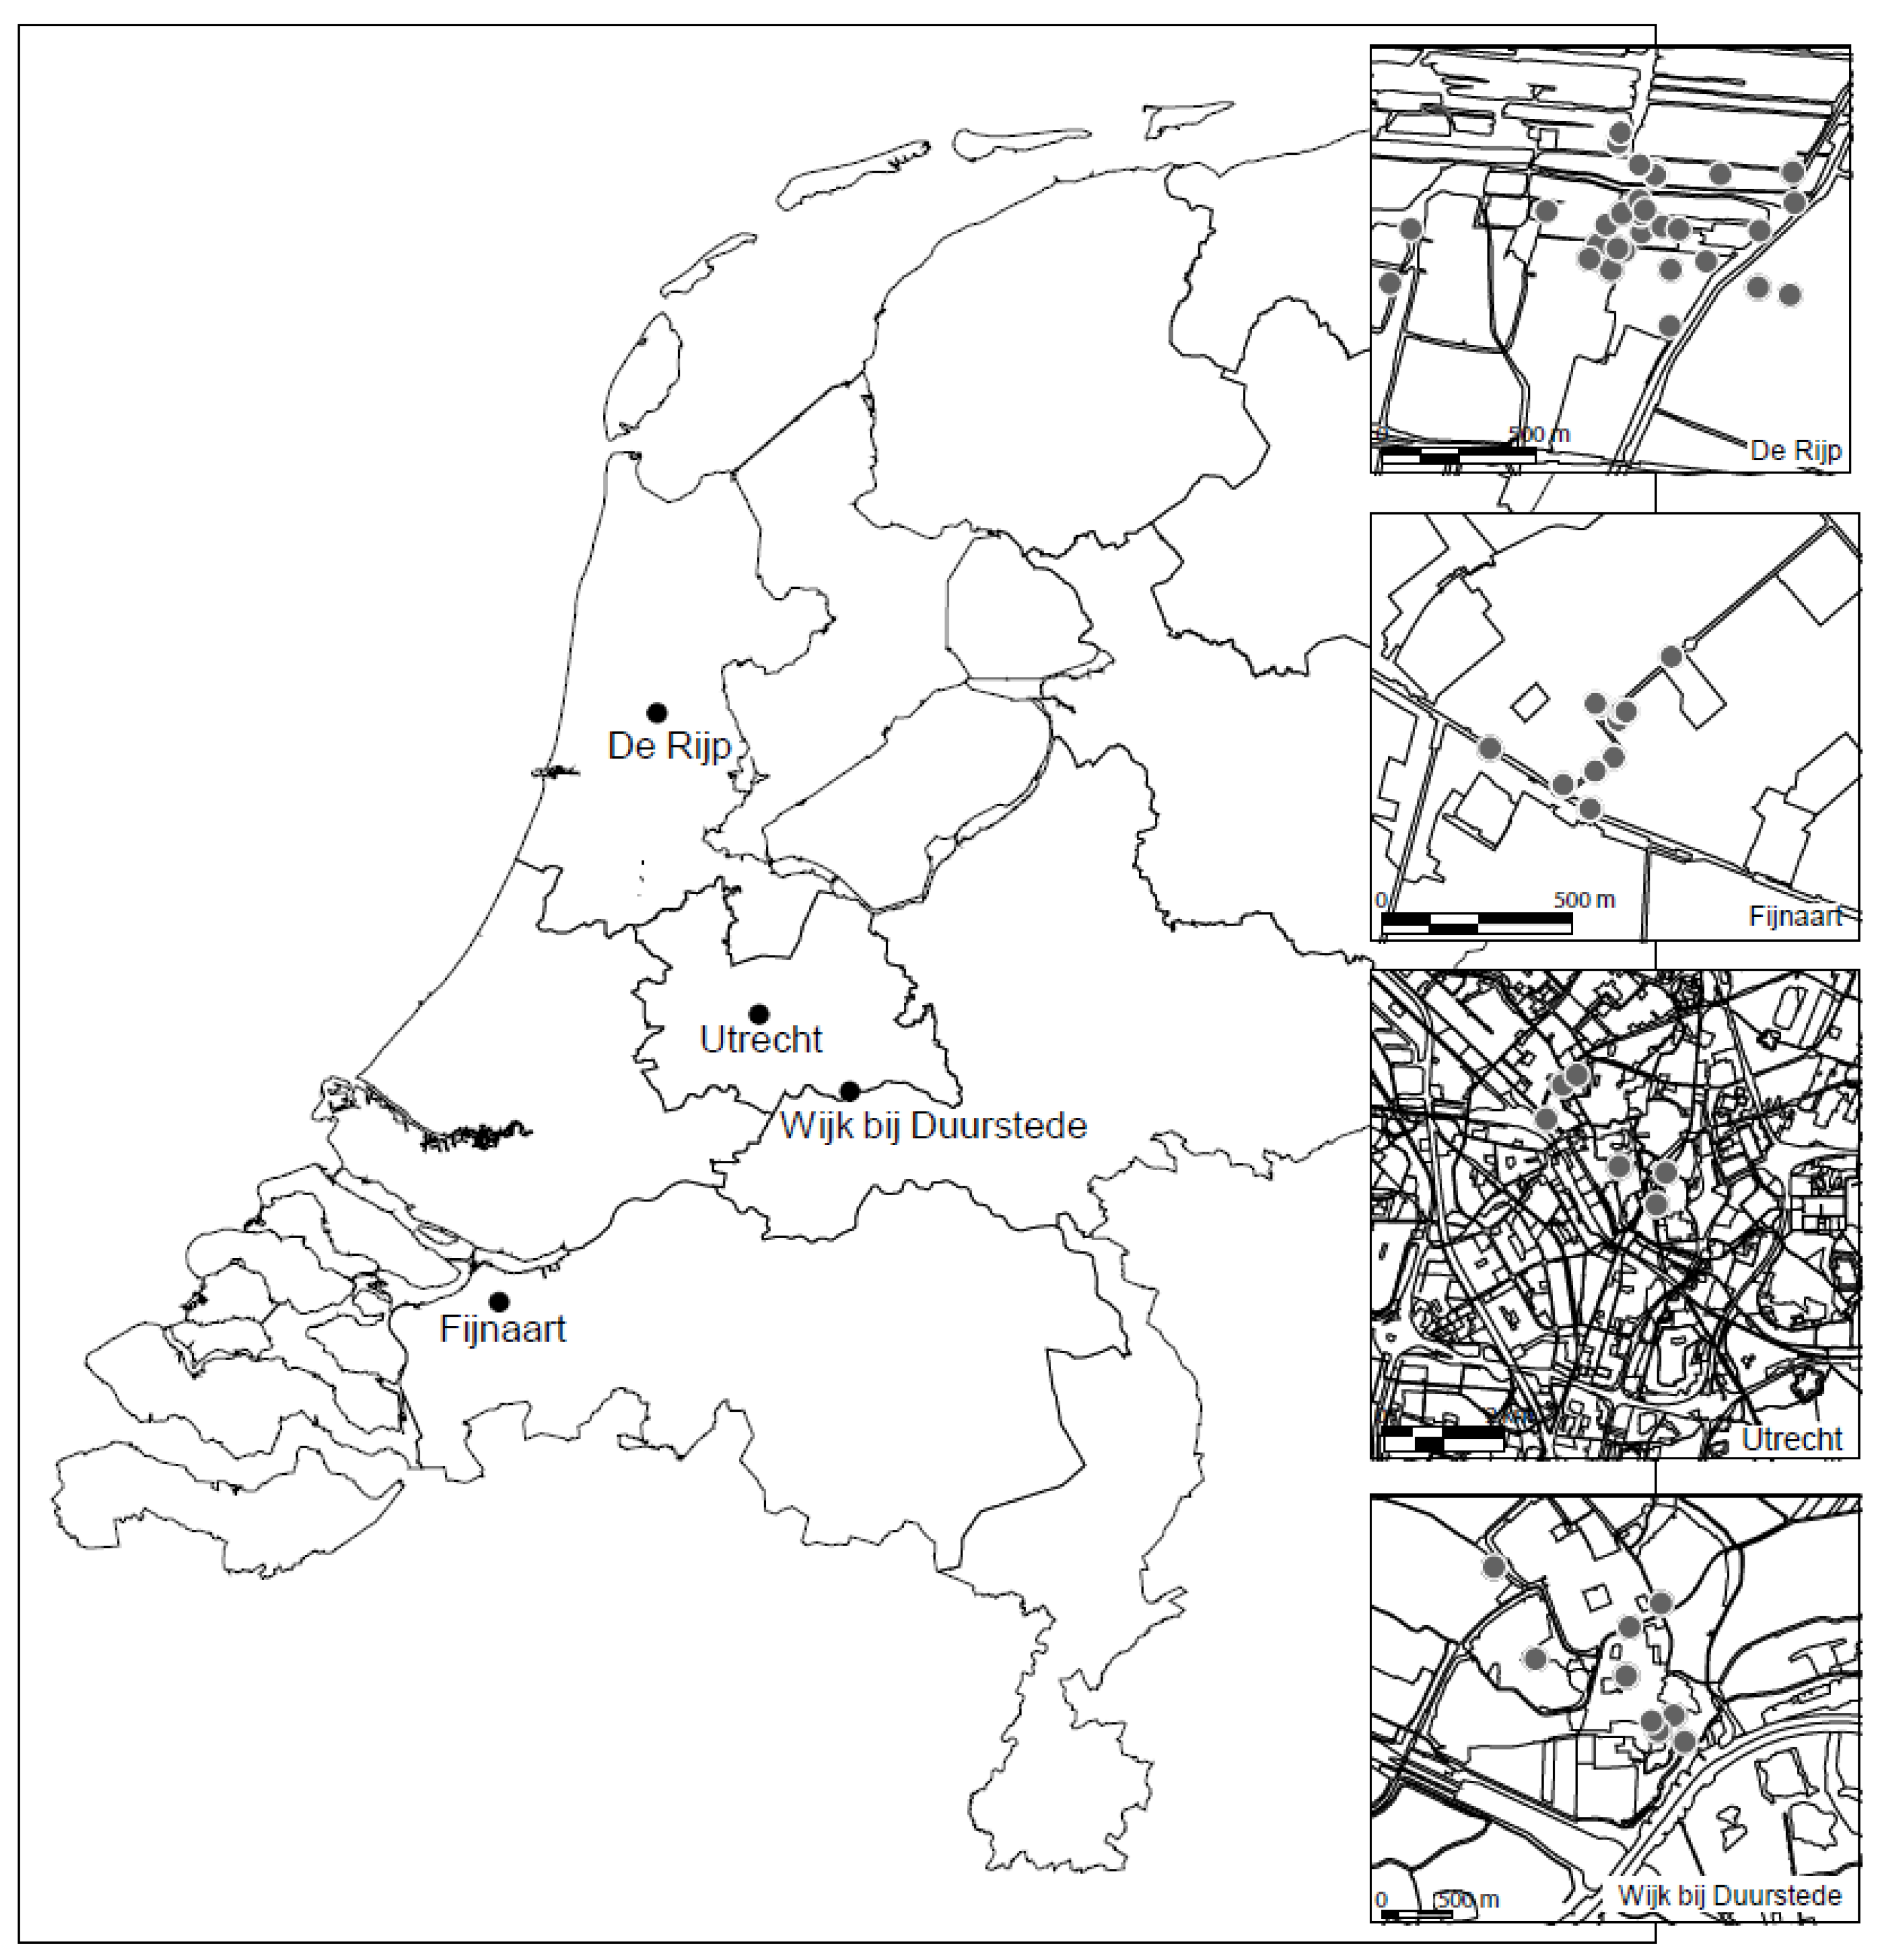
3.1. Site Selection and Soil Sampling

Between January 1996 and May 2003 a total of 137 soil samples were collected from 79 sample sites in four villages/cities in The Netherlands. Soil samples were obtained by driving an Edelman drill up to a depth of 2 m. All cores were described and at least one sample was taken from each soil horizon.
The selected sample sites have been very well studied and documented by archaeologists [41,43,44]. Archaeologists accompanied us in the field when sampling soils. Based on previous archaeological studies and direct field observations by the archaeologists, chronology (Roman, Medieval or Modern time period) was assigned to the soil samples.
These selected sites represent both unpolluted areas and those suspected of local pollution. The unpolluted sites are situated in the open field or at depths >1 m, where no anthropogenic influence could be detected visually. In contrast, the presumed polluted sites were chosen on the basis of findings by environmental contractors of high Pb, Zn and Cu contents.
A total of 75 possible Pb sources (artefacts) were collected in the field and by archaeologists working in the study area. These artefacts include Pb sheets, ceramics and paint. The production period of the artefacts was determined by archaeologists and based on historical knowledge of the sample sites, but it was not always possible to appoint an exact date. We were, however, able to determine the archaeological time period in which the artefacts were made and used. Some of these artefacts can be dated back to Roman times. Other possible Pb sources are coal and coal ashes. Since coal is dispersed through the soils, pure coal and coal ashes samples could not be collected. Therefore, we used twenty coal samples from Dutch and Belgian coalmines (coal data reported in Walraven et al. [14,19]. Approximately 90% of all coal used for domestic purposes comes from Dutch and Belgian coal mines [45].
Trace element contents and Pb isotope ratios of the Graft-De Rijp soils and potential Pb sources were originally reported by Walraven et al. [14]. In the present work Pb isotope data are placed in a broader context—more cities/villages and more time periods—and therefore these data are again reported and discussed.
In August–September 2007, eight sample sites in Wijk bij Duurstede, Utrecht and Graft-De Rijp were revisited by RIVM and 14 Pb polluted soil samples were taken for the in vitro Pb bioaccessibility tests [34]. The Pb polluted soils in Fijnaart were already remediated and were therefore not sampled again. Only soils with Pb contents higher than the current Dutch intervention value for Pb (530 mg/kg for standard soils; 25% clay and 10% organic matter) were sampled. Lead contents were determined in the field using a NITON Xl3t handheld XRF. Since soil Pb content had to be higher than 530 mg/kg, only soils polluted in the Modern period were sampled. In Wijk bij Duurstede and Graft-De Rijp soil inferred to be polluted with city waste were sampled. In Utrecht sampled soils are inferred to be polluted with city waste or Pb white (in the vicinity of a former Pb white factory). For further details, see Hagens et al. [34].

3.2. Sample Preparation

Prior to analysis, soil samples and artefacts from Graft-De Rijp were dried at 60 °C to constant weight. All other samples were dried at 105 °C to constant weight. The dried samples were ground (<20 um) with an automated tungsten-carbide mill (Herzog HSM-HTP), homogenised for 5 min in a Turbula T2C and stored in glass containers. Some samples could not be ground with the automated tungsten-carbide mill (among others painted wood and Pb sheets). These samples were ground manually with an agate mortar or not ground at all.

3.3. Analytical Procedure

The soil samples and the majority (96%) of the artefacts were analysed for Pb and Al content using X-ray fluorescence (XRF) spectrometry. Aluminium (Al) and lead (Pb) have been measured by XRF with a precision (1 RSD)—based on replicate analysis—of 1.6% and 4.8% respectively. For details see Van der Veer [46] and Walraven et al. [47]. One reference sample (ISE 921) was added to each batch of 20 samples to determine accuracy. The certified Al and Pb content of ISE 921 is 5.7 wt.% and 167 mg/kg respectively. The accuracy for Al and Pb is 14% and 1.9% relative bias respectively.
Some artefacts (4%), all from Graft-De Rijp, could not be pressed into tablets (e.g., Pb sheets and paint on wood). After HF based digestion the Pb content of these samples was analysed with a VG Plasmaquad PQ2+ Inductively Coupled Plasma Mass Spectrometer (ICP-MS) with a low uptake nebulizer. Details of the ICP-MS method can be found in Huisman et al. [48]. The relative precision (2RSD) and accuracy for Pb was 11.3% and 0.005% respectively (relative bias).
Lead isotopes were analysed after HF-based sample destruction. Details of the HF-based destruction methods can be found in Walraven et al. [14] and Van der Veer [46] for the Graft-De Rijp and other samples respectively. Lead isotope compositions of the Graft-De Rijp samples were determined with a VG Plasmaquad PQ2+ ICP-MS. Details of this method are described by Walraven et al. [14]. Lead isotopes of all other samples were analysed with an Agilent 7500 ICP-MS. A similar method to Krachler et al. [49] was adopted to correct for mass bias discrimination by bracketing each six samples with the Pb isotope standard NIST 981. The effect of count rate on the mass discrimination was minimized by diluting all residues and isotope standards to a lead concentration of 50 ug/kg. Details of this method are described by Walraven et al. [19,47]. All isotopic ratios of the Graft-De Rijp samples were determined with a precision of <1%, 2RSD. The precision (2RSD) of all other samples was <0.29% for 206Pb/207Pb, <0.24% for 208Pb/207Pb, and <0.55% for 206Pb/208Pb. The average Pb isotope composition and precision (2 SD) of the measured ISE 921 sample was 1.166 ± 0.003 for 206Pb/207Pb, 2.444 ± 0.004 for 208Pb/207Pb, and 0.477 ± 0.002 for 206Pb/208Pb. Average precision and accuracy are based on the entire analytical procedure starting with the sample splits. Blanks indicate reagents contain negligible amounts of Pb (<20 ng/kg).
The RIVM in vitro model, introduced by Oomen et al. [33] was used to determine the oral bioaccessibility of Pb in Pb polluted soil samples. In the in vitro gastrointestinal model dried and sieved soil samples (fraction < 2 mm) were subjected to a number of stages simulating the human digestion process (under fasted conditions; worst case scenario). Duplicate pre-treated subsamples (dried, sieved, not crushed) of 0.06 g were weighed into centrifuge tubes and 9.0 mL of saliva (pH 6.5 ± 0.2) was added. This mixture was rotated for 5 min, end-over-end, at 2900 g (about 55 rpm) at 37 °C. Then, 13.5 mL of gastric juice (pH 1.1 ± 0.1) was added, and the mixture was rotated for 2 h at 37 °C. The pH of the mixture was measured to check that solutions were within method specified pH tolerance of 1.5 ± −0.5. Finally, 27 mL of duodenal juice (pH 7.8 ± 0.2) and 9 mL of bile juice (pH 8.0 ± 0.2) were added simultaneously. This mixture was rotated at 37 ºC for 2 h and subsequently centrifuged at 3000 g for 5 min. This yielded the chyme (the supernatant; gastric + intestinal fraction) and the pellet (the residual soil). The Pb content of the 14 soil samples (and the residual pellets) was determined with ICP-MS according NEN-ISO 17294 [50] after microwave assisted destruction according to NEN 6961 [51], except that a 1:3 dilution of aqua regia with distilled water was used. The Pb content in the chyme samples was determined according to NEN-ISO 17294 [50] after dilution in 0.1 M HNO3.
The RIVM in vitro method used in this study differs slightly from the RIVM in vitro method used by Walraven et al. [32]. Instead of 0.6 g, 0.06 g of soil sample was introduced in the model. RIVM decided to decrease the solid to liquid ratio (from 1:100 to 1:1000) because the oral exposure of young children to soil, due to hand-to-mouth behaviour, is lower (0.06 g instead of 0.6 g) than previously thought [34]. The smaller solid to liquid ratio (1:1000) results in higher oral bioaccessibilities of Pb from soils [34]. For further details see Van de Wiele et al. [52] and Hagens et al. [34].

3.4. Data Analysis

Polluted soils contain both natural and anthropogenic Pb. Consequently, the measured Pb isotope composition is a mixture of the isotopic composition of both the natural and anthropogenic Pb fraction. To derive the Pb isotope composition of the anthropogenic Pb fraction, it is necessary to account for the amount of natural Pb present in the soils. The following equation describes this mass balance principle:
(xPb/yPb)a × Pba = (xPb/yPb)t × Pbt − (xPb/yPb)n × Pbn
In which the letters a, t and n indicate the Pb content and Pb isotope composition (xPb/yPb) of the anthropogenic, total and natural Pb fraction, respectively. (xPb/yPb)t and Pbt of the soils are measured in this study. The natural Pb content (Pbn) in sediments and soils can be calculated based on the common relationship between Pb and Al in unpolluted soils [6,46,47,53] and, because Dutch soils are seldom polluted with Al:
Pbn = 3.69 × Al + 1.75
In which Pbn is the calculated natural Pb content in mg/kg, and Al is the measured Al content in wt.% (n = 303; R2 = 0.89; Standard error of estimate is 2.6 mg/kg).
The anthropogenic Pb content in the topsoils Pba can then be calculated as follows:
Pba = Pbt − Pbn
In which Pba and Pbn (Equation (3)) are the calculated anthropogenic and natural Pb content in mg/kg in the soils, and Pbt is the measured total Pb content in mg/kg in soils.
If the Pb isotope composition of the natural Pb fraction in the soils is known, the Pb isotope composition of the anthropogenic Pb fraction can be calculated using Equation (1). Potentially the Pb isotope composition of the natural Pb fraction in soils can be estimated by analysing the unpolluted deeper soils (>1 m). Unfortunately, the majority (60%) of the deeper soils appears to be polluted with anthropogenic Pb (see Supplementary 1). The variation in Pb isotope composition of background Pb in Dutch topsoils was determined by Walraven et al. [47] based on natural sand(n = 184), fluviatile (n = 22) and marine clay (n = 81).The median values of these data are used for the correction. If the anthropogenic Pb content in soils is low compared with the natural Pb content, the error in the calculated Pb isotope composition of the anthropogenic Pb fraction can be substantial. To minimize this error, (xPb/yPb)a is calculated only for samples for which Pbt/Pbn > 2 (Pb enrichment factor (called EF)).
Provided the sum of the Pb content in the chyme and the Pb content in the residual pellet does not differ significantly from the total Pb content of the soil sample, the bioaccessibility of Pb can be calculated according to Equation (4):
FB-Pb = (Pbchyme/Pbt) × 100%
In which FB-Pb is the calculated bioaccessibility of Pb (%), Pbchyme is the measured Pb content determined in chyme (mg/kg) and Pbt is the measured total Pb content in the soil samples.

4. Results

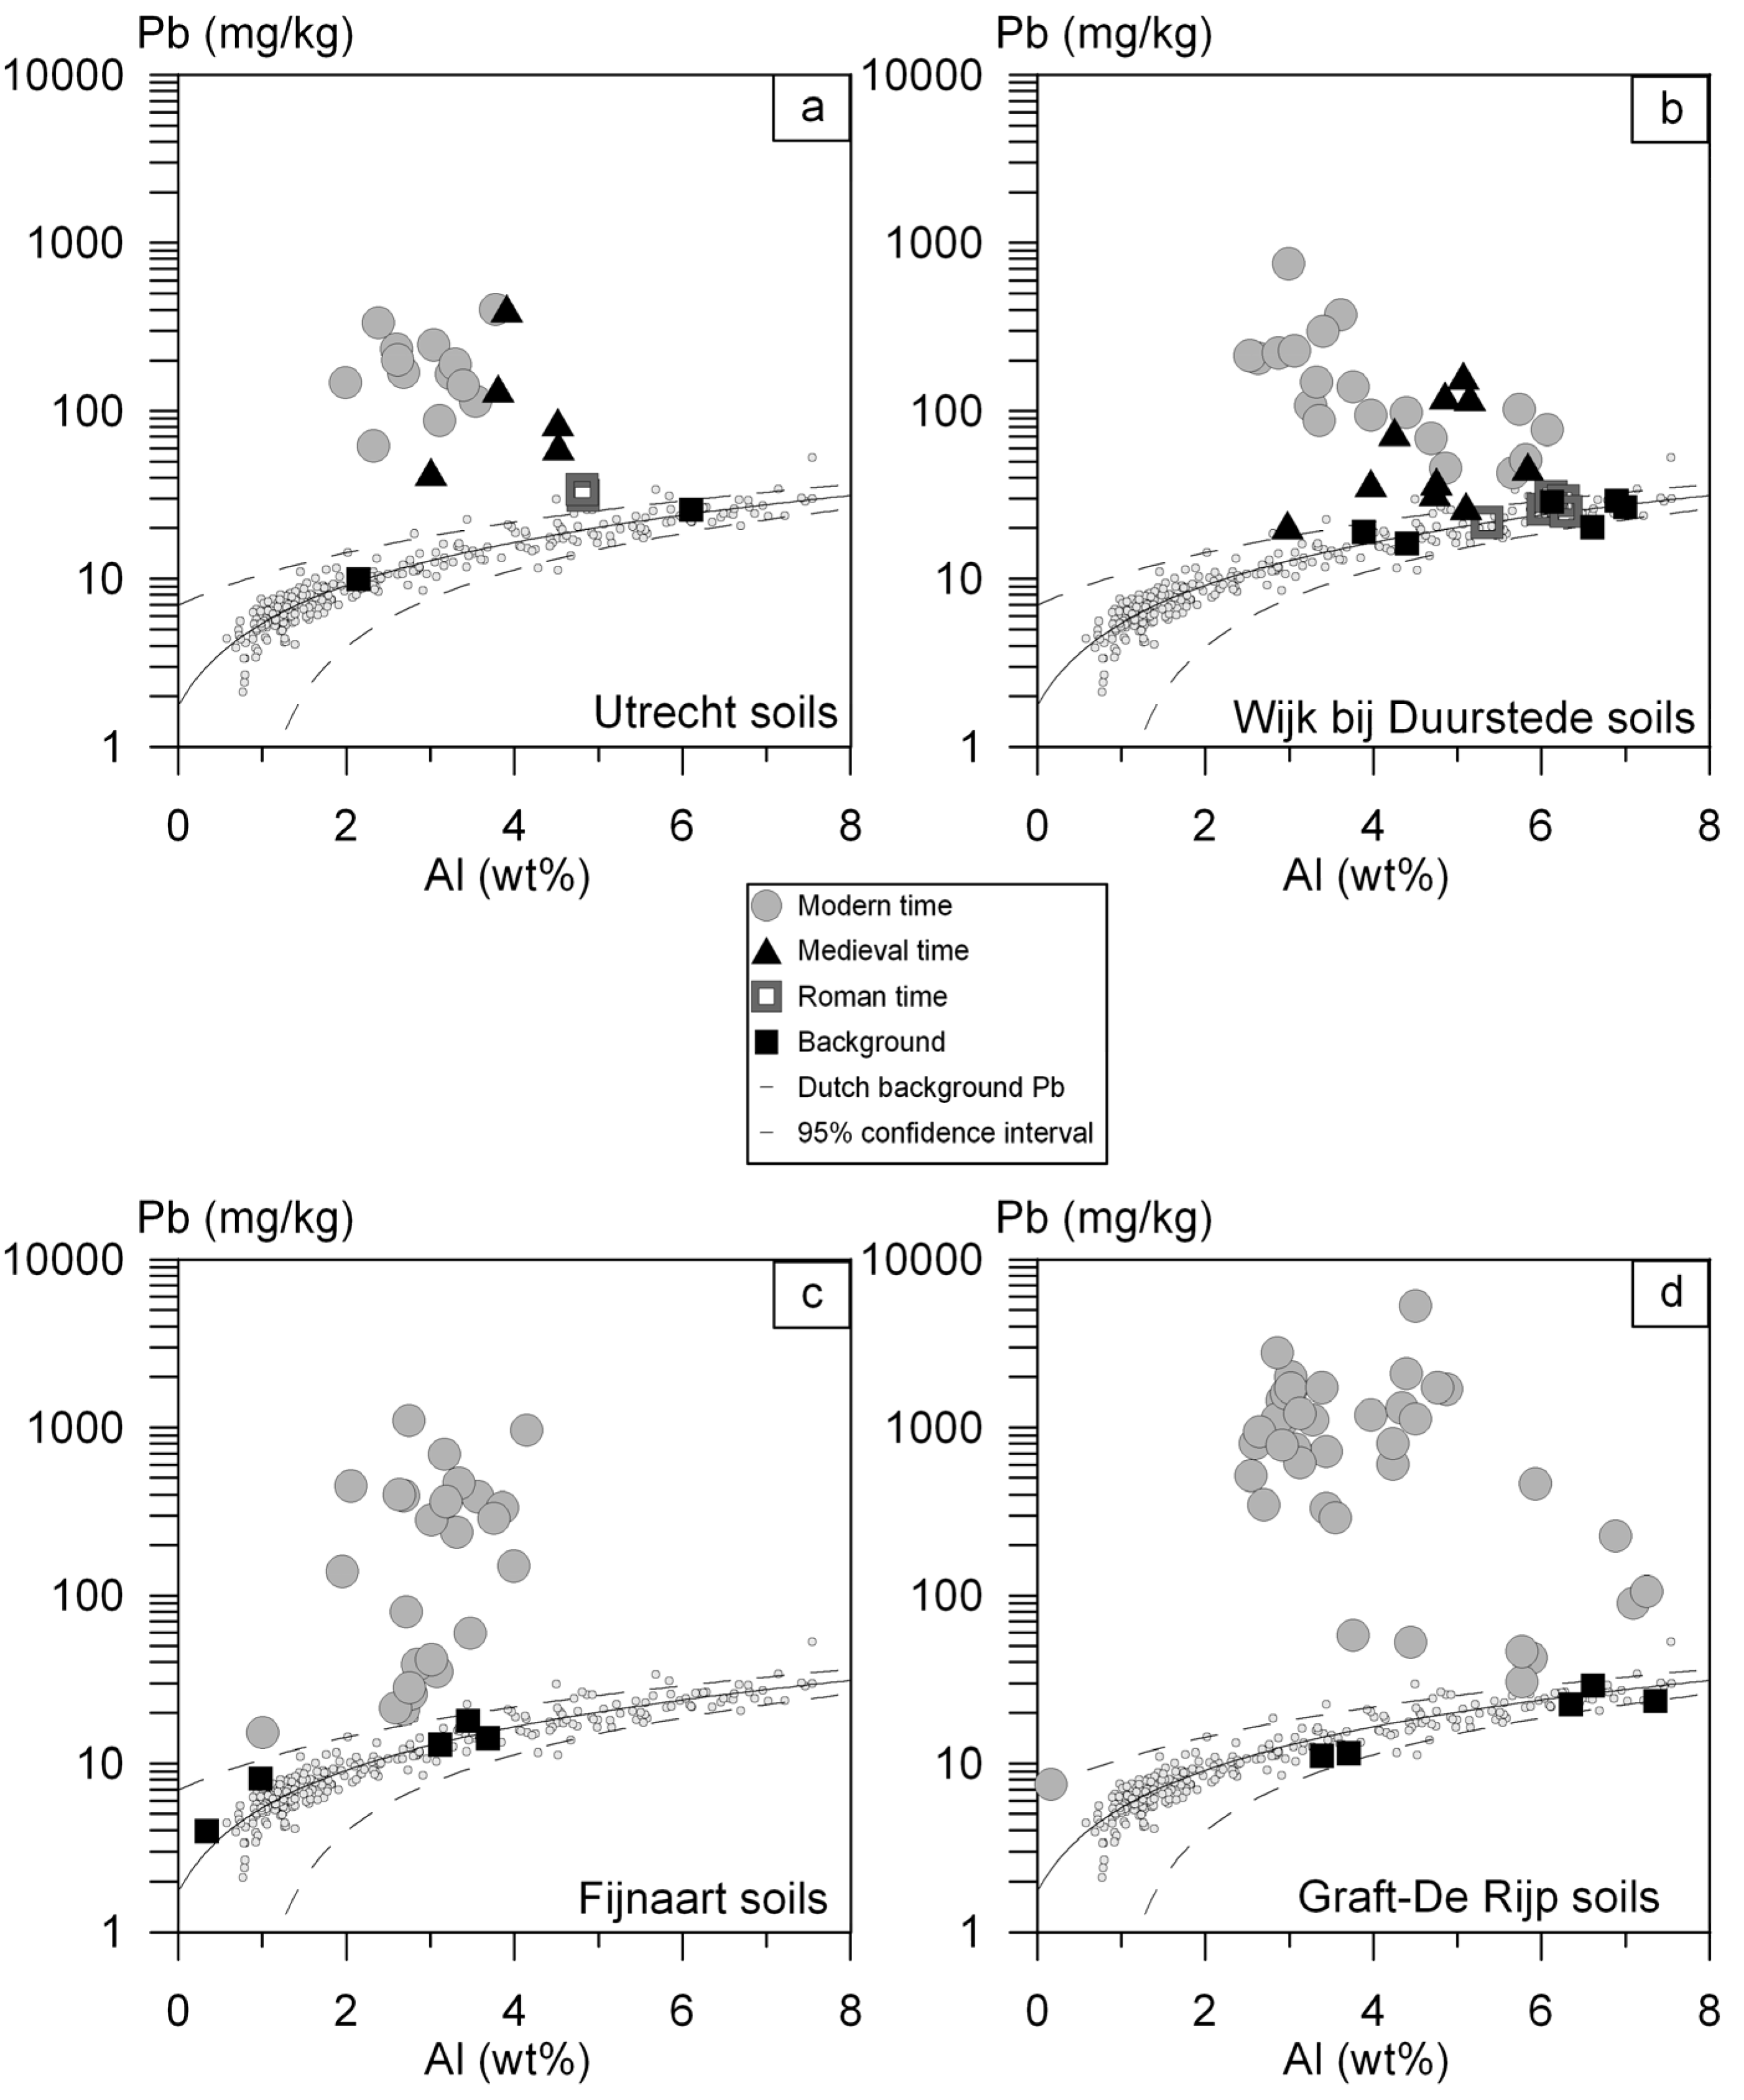
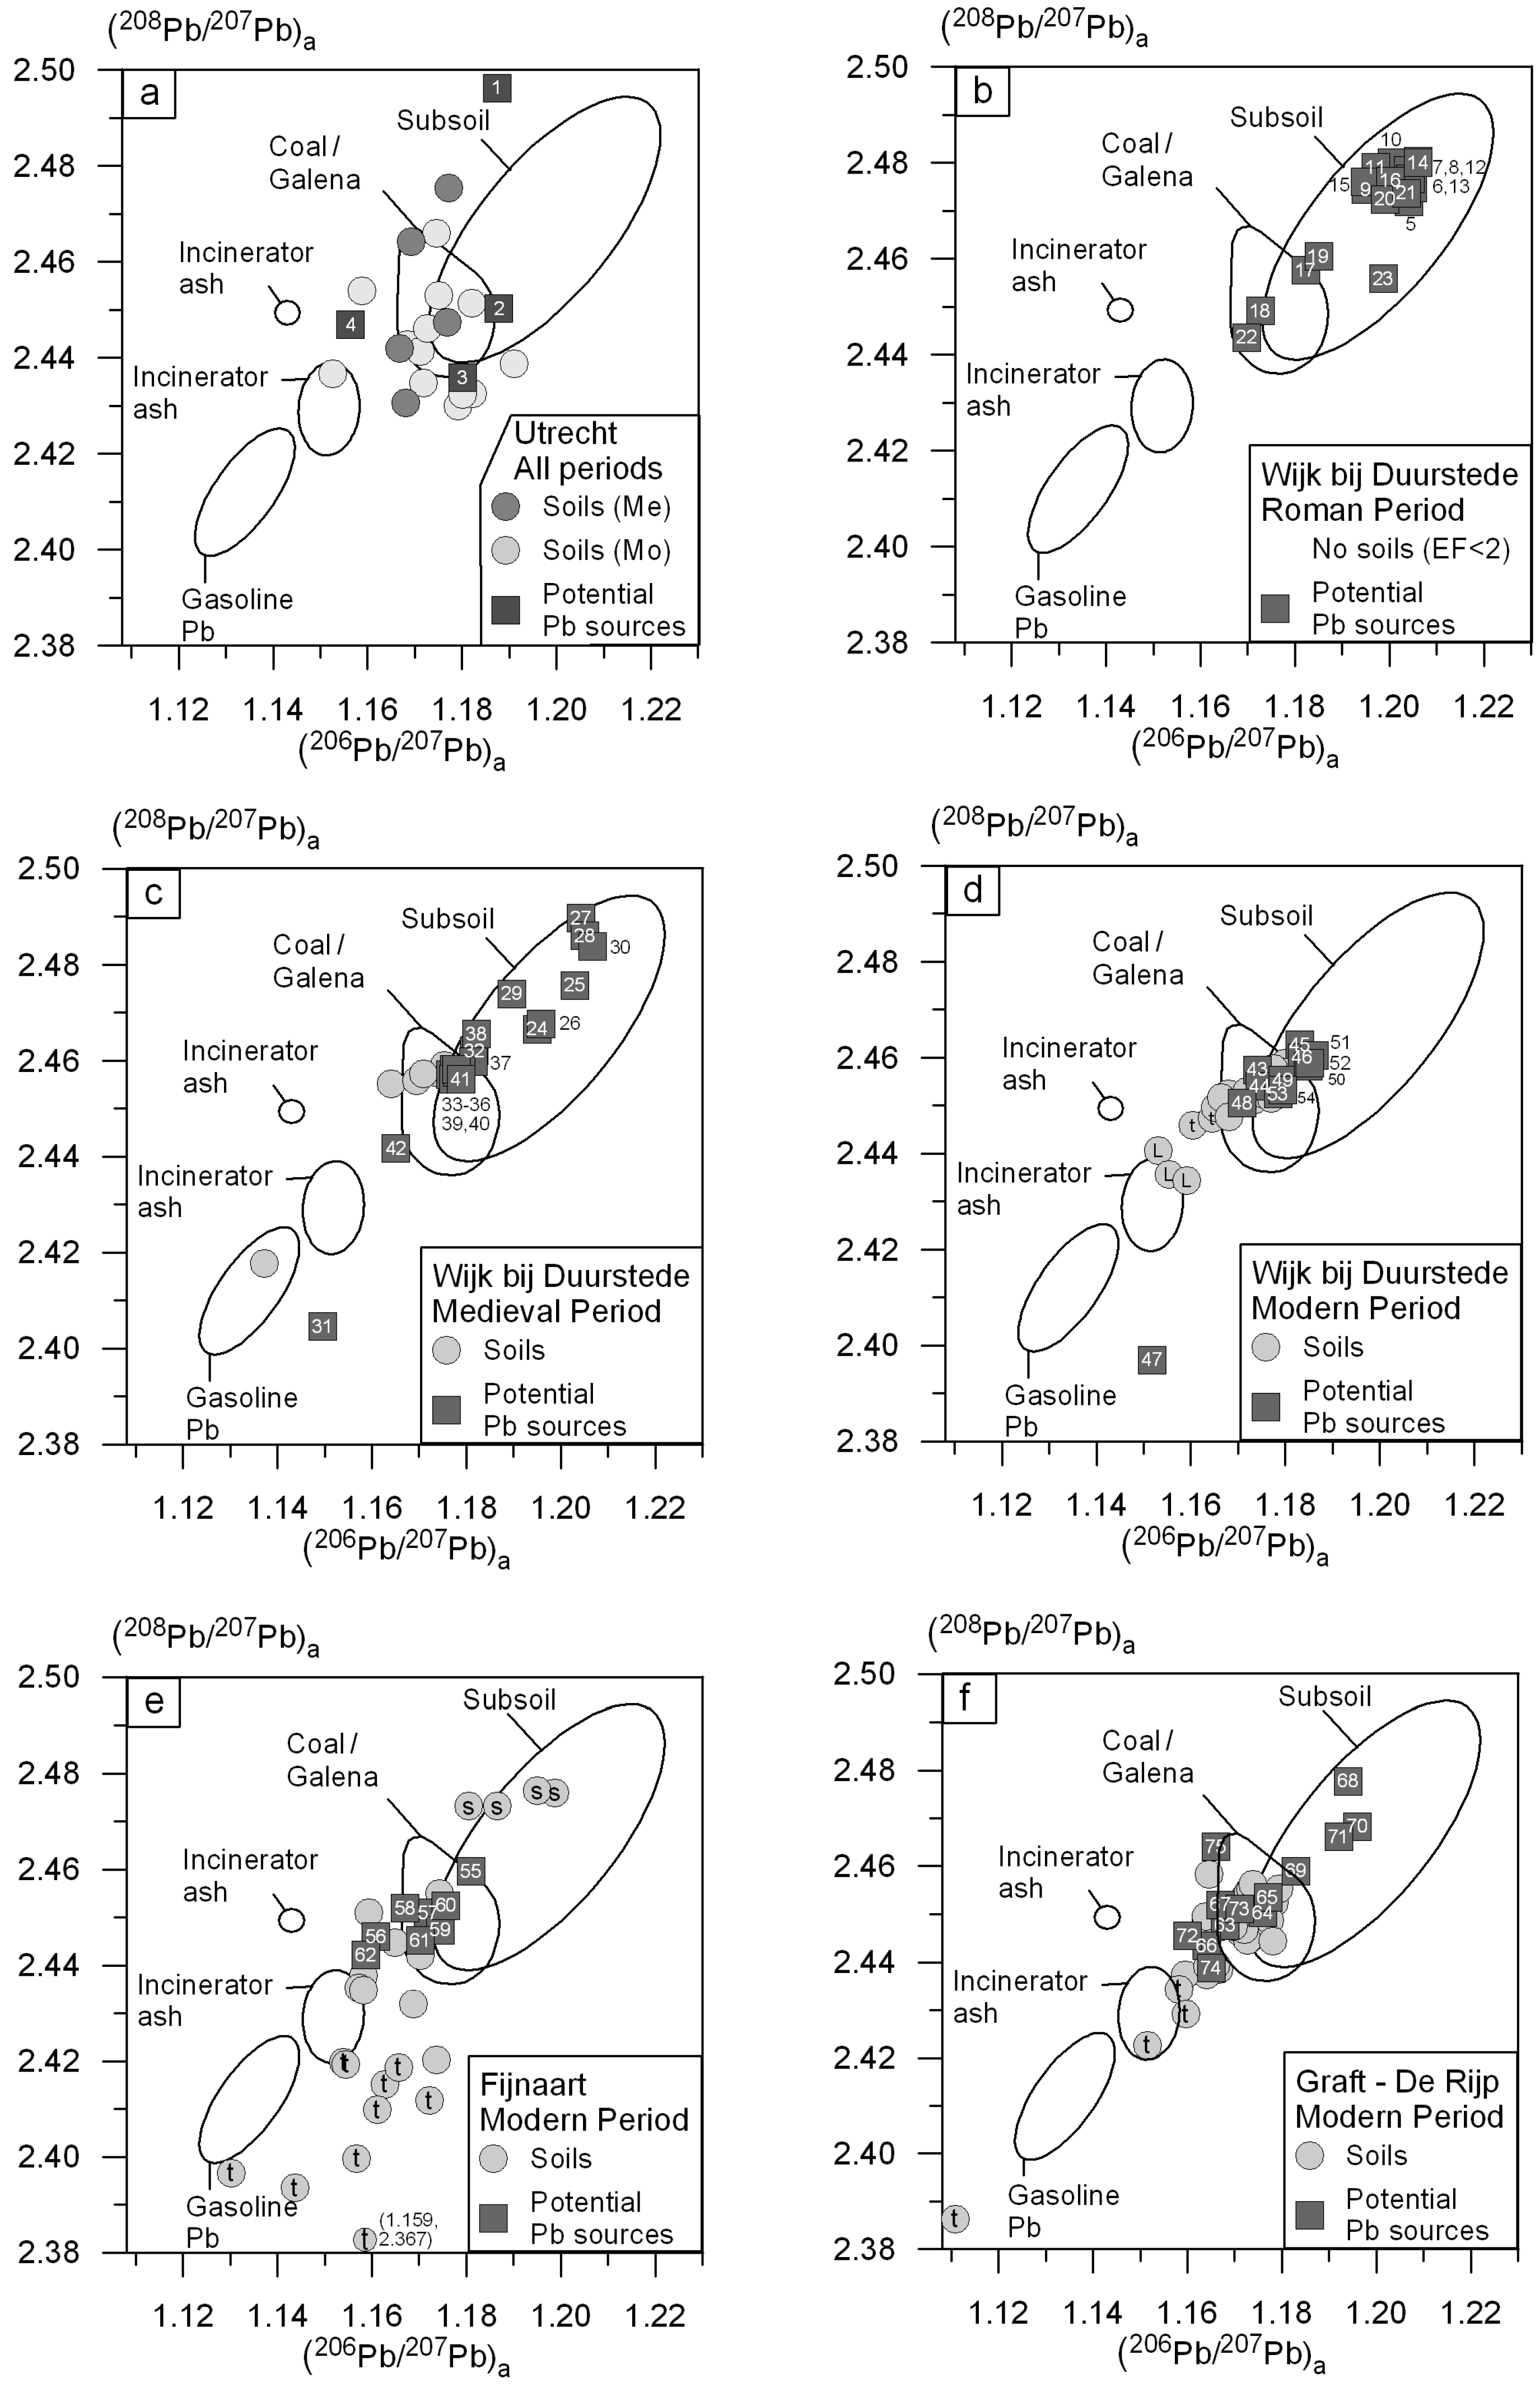
4.1. Chemical and Pb Isotope Composition of the Soil Samples

Sample details (including lithology, sample site coordinates and sample depth), analytical and calculated results of the soil samples are given in Supplementary 1. Table 2 summarizes the measured Al content and the calculated Pb and Pb isotope composition of the anthropogenic Pb fraction of all soil samples categorized per city/village (Utrecht, Wijk bij Duurstede, Fijnaart and Graft-De Rijp) for each time period (Roman, Medieval, Modern). In Figure 2a–d the total Pb contents of the soil samples are plotted versus the Al contents. Eighteen deeper soil samples (>1 m), indicated with ■, have Pb contents matching those of natural Pb (Figure 2a–d). All other soil samples (n = 119) were visually disturbed and/or are enriched in Pb (Supplementary 1, Figure 2a–d). The variation in anthropogenic Pb content and its isotopic composition are presented in box-whisker plots in Figure 3 for the four cities/villages and the three time periods. Pba varies between < limit of detection (LOD) and 5266 mg/kg.
The median soil Pba content in the four cities/villages increases in the following order (Table 2): Wijk bij Duurstede (57 mg/kg) < Utrecht (127 mg/kg) < Fijnaart (133 mg/kg) < Graft-De Rijp (789 mg/kg). The median Pba content for the soils from the three distinguished time periods increases from Roman period (7 mg/kg) to Medieval period (43 mg/kg) to Modern period (235 mg/kg) (Table 2). Only two of the seven soil samples that contain visually recognisable remains from Roman times have enriched Pb contents (Supplementary 1, Figure 2a). These two samples are from Utrecht (Figure 2a). All samples that contain visually recognisable remains from the Medieval or Modern period have enriched Pb contents (Supplementary 1).
The Pb isotope composition of the anthropogenic Pb fractions is calculated only for the soils with EF > 2 (see Section 3.4.). This is the case for ~75% of all soils (102 out of 137). The (206Pb/207Pb)a ratios vary between 1.111 and 1.199 with a median of 1.171 (n = 102; Table 2, Figure 3). Excluding the lowest and highest values (n = 100), the range is reduced to between 1.130 and 1.195 (Supplementary 1). Soils from Utrecht, Wijk bij Duurstede and Graft-De Rijp have comparable median (206Pb/207Pb)a ratios of 1.174, 1.170 and 1.172 respectively (Table 2, Figure 3). The soils from Fijnaart have a slightly deviating median (206Pb/207Pb)a ratio of 1.163 (Table 2, Figure 3). This—lithology independent—regional difference in (206Pb/207Pb)a ratio is observed for all the time periods (Table 2, Figure 3).
The (208Pb/207Pb)a and (206Pb/208Pb)a ratios vary between 2.367 and 2.476 with a median of 2.447, and between 0.465 and 0.490 with a median of 0.478, respectively (n = 102; Table 2 and Figure 3). If the soil samples with the single lowest and highest ratio are disregarded, the ratios vary between 2.386 and 2.475, and between 0.470 and 0.490 (n = 100). Similar patterns are observed for the (206Pb/207Pb)a, (208Pb/207Pb)a and (206Pb/208Pb)a ratios.

4.2. Potential Anthropogenic Pb Sources (Pb Artefacts)

Sample details (including sample location and time period) and analytical results of the potential anthropogenic Pb sources are given in Table 3. The variation in Pb content and isotopic composition is presented in box-whisker plots in Figure 3 for the four cities/villages and the three time periods.
The Pb content of the potential Pb sources varies from 3 mg/kg (Medieval production slag) to ~100 wt.% (Modern Pb sheet). High Pb contents are measured in glazed potsherds (0.5–8.7 wt.%), glazed roof tiles (1.9–5.9 wt.%), paint (6.0–18.6 wt.%), Pb spool (87.8 wt.%) and Pb sheets (~100 wt.%) (Table 3). Low Pb contents are measured in unglazed sherds and potsherds (e.g., 11–40 mg/kg in Roman potsherds) (Table 3). The Pb content of the unglazed sherds and potsherds matches that of clayey soils in The Netherlands [47]. Metal and production slags contain variable Pb contents (e.g., 3–29 mg/kg in Medieval production slag from Wijk bij Duurstede and 58–2265 mg/kg in Medieval production remnants from another site in Wijk bij Duurstede) (Table 3). The Pb content of the potential anthropogenic Pb sources from the 3 distinguished time periods increases in the following order (Table 3, Figure 3): Roman period < Medieval period < Modern period. The artefacts with a Pb content lower than or equal to the background soil Pb content (e.g., unglazed potsherds) cannot cause Pb pollution and are therefore not considered as anthropogenic Pb sources in the discussion.
The 206Pb/207Pb, 208Pb/207Pb and 206b/208Pb ratios of the potential Pb sources vary between 1.150–1.207, 2.397–2.496 and 0.473–0.488 respectively (Table 3). Lead containing artefacts with low Pb contents (<100 mg/kg) are, in general, characterized by high isotopic ratios (Table 3). For example, 206Pb/207Pb, 208Pb/207Pb and 206b/208Pb ratios of unglazed Roman potsherds range between 1.195–1.206, 2.472–2.480 and 0.483–0.487 respectively (Table 3). These ratios match that of unpolluted clays in The Netherlands [47]. Lead containing artefacts with the highest Pb contents are, in general, characterized by low isotopic ratios. For example, 206Pb/207Pb, 208Pb/207Pb and 206b/208Pb ratios of glazed potsherds and roof tiles range between 1.152–1.188, 2.397–2.460 and 0.478–0.485 respectively (Table 3).

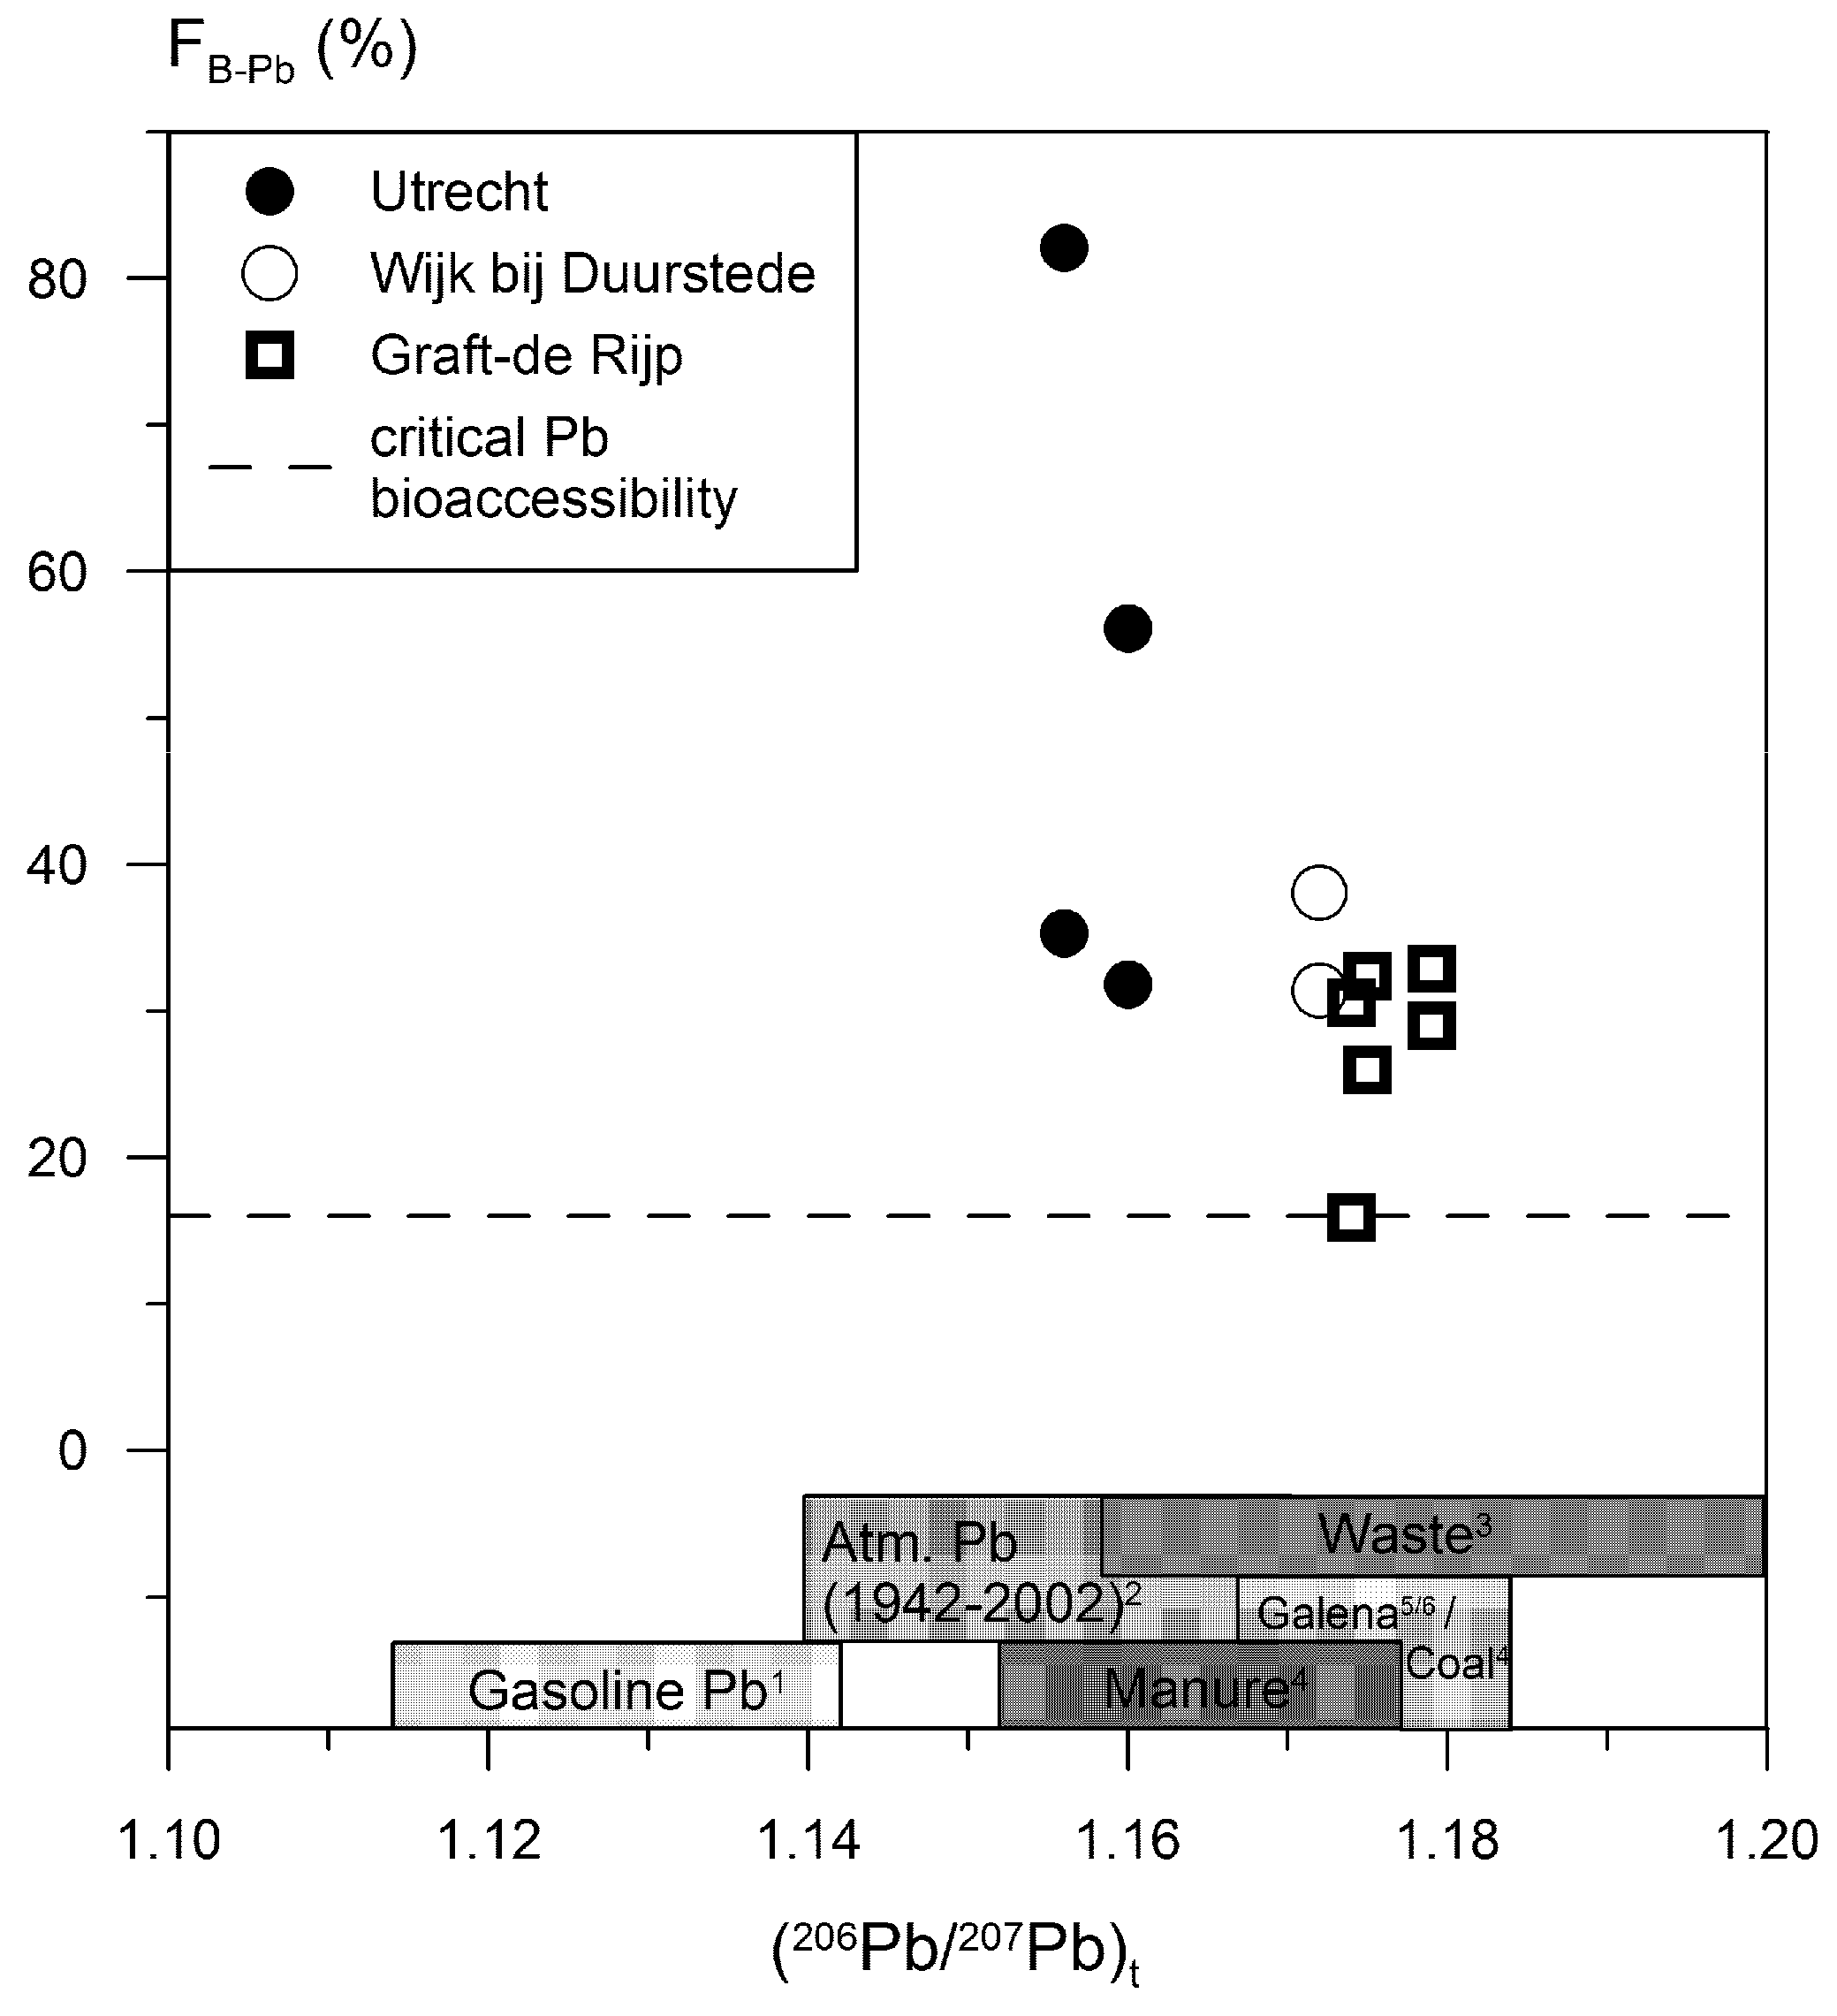
4.3. In Vitro Digestion Model

The Pb content of the soil, chyme and residual pellets, and the calculated Pb bioaccessibilities (Equation (4)) are listed in Table 4. In addition, Pb isotope composition (if available) and inferred Pb sources are presented. The Pb content of the soil and chyme samples varies from 540 to 2335 mg/kg and 175 to 1355 mg/kg respectively (Table 4). The (206Pb/207Pb)t and (208Pb/207Pb)t values of the soil samples vary from 1.156 to 1.179 and from 2.437 to 2.456 respectively (Table 4).
The Pb isotope composition of the total amount of Pb in this set of soil samples is assumed to be equal to the anthropogenic Pb fraction since the natural Pb content is negligible compared to the total Pb content (2–29 mg/kg versus 540–2335 mg/kg).
Since the sum of Pb present in the chyme and the residual pellet does not differ significantly from the total Pb content present in the soil samples bioaccessibility can be calculated quantitatively according to Equation (4) (log(Pbt) = 1.03 ± 0.03 × log(Pbchyme + Pbpellet); through origin; R2 = 0.91; p < 0.05). Although log(Pbt) does not differ significantly from log(Pbchyme + Pbpellet), the difference between the measured total Pb content and the sum of the Pb content in the chyme and in the residual pellet can be substantial (Table 4). This is caused by the presence of heterogeneously distributed, coarse Pb containing particles in the soil samples. Since the soil samples were not ground for the in vitro test (this reflects hand-to-mouth behaviour of children best), the presence or absence of such particles in a sample can influence the Pb content. Calculated (Equation (4)) bioaccessibilities range from 16% (soil polluted with city waste in Graft-De Rijp) to 82% (soil polluted with Pb white from Utrecht).

5. Discussion

5.1. Anthropogenic Pb Sources in Urban Soils

To trace the sources of anthropogenic Pb in the polluted soils of four Dutch cities/villages with a long habitation history, (208Pb/207Pb)a of the soils and potential anthropogenic Pb sources are plotted versus (206Pb/207Pb)a per city/village in Figure 4a–f. These figures also include data (plotted as ellipses) for potential anthropogenic sources as reported in other studies (e.g., gasoline Pb, incinerator ash and Dutch and Belgian coal and galena ore). Belgian coal, Dutch coal and gasoline Pb are reported in Walraven et al. [14], Walraven et al. [19] and Walraven et al. [6] respectively. The Pb isotope compositions of Dutch and Belgian galena and incinerator ash in North-Western Europe were determined and published by others [15,16,54,55,56,57,58].

5.1.1. Differences and Similarities between Cities/Villages

Figure 4a–f shows that the Pb isotope compositions of anthropogenic Pb in the majority of the soils (~75%) match that of anthropogenic Pb sources found in these soils. The matching anthropogenic Pb sources are glazed potsherds, glazed roof tiles, building remnants, metal slag, Pb-based paint, Pb sheets, coal ash and other Pb containing artefacts (Table 3). It also matches with coal and galena mined in The Netherlands and Belgium (Figure 4a–f; see Section 5.2 for further discussion). The anthropogenic Pb sources most likely entered the urban soils due to historical smelting activities (production remnants), renovation and demolition of houses (paint flakes, pieces of glazed roof tiles and Pb sheets), disposal of coal ashes from coal stoves in backyards and raising and fertilization of the land. Due to oxidation of peat in Dutch subsoils, land slowly subsides. City waste and manure was used in the past to raise this subsiding land and to fill channels and ditches [14].
The Pb isotope composition of the anthropogenic Pb fraction in ~25% of the urban soils does not match with the inferred potential Pb sources (Figure 4a–f). These samples mainly represent topsoils with Pb isotope compositions matching that of incinerator ash and in some cases gasoline Pb (Figure 4a,c–f). These topsoils might be polluted with atmospheric Pb instead of building materials and household utensils, coal ashes and metal slag. Three soil samples from a historical landfill (L) in Wijk bij Duurstede have anthropogenic Pb isotope compositions that match incinerator ash (Figure 4d). This landfill contains household garbage. The Pb isotope composition of the landfill soil samples most likely matches that of incinerator ash, because household garbage forms an important part of incinerator ash. The Pb isotope composition of several (n = 8) topsoils from Fijnaart does not match the anthropogenic Pb sources found in the Fijnaart soils (Figure 4e) but are comparable to sherd (artefact 31; Figure 4c) and glazed potsherd (artefact 47; Figure 4d) found in Wijk bij Duurstede soils. In addition, they have compositions close to the atmospheric Pb sources incinerator ash and gasoline Pb, but the 207Pb values are enriched. Since Fijnaart is situated in a highly industrialized area, the topsoils are most likely polluted with an atmospheric Pb source but the exact source is unknown. Four subsoil samples from Fijnaart (S) have enriched Pb contents (Supplementary 1; EF > 2) but their Pb isotope compositions correspond with unpolluted Dutch subsoils (Figure 4e). No potential anthropogenic Pb sources are observed in these soils and it appears that the subsoils are naturally enriched in Pb.
With the exception of the unknown anthropogenic Pb source in some topsoils in Fijnaart, the anthropogenic Pb sources in the soils and cities with a long habitation history are comparable. Due to the high Pb content in glazed potsherds, glazed roof tiles, paint and Pb sheets, these are the sources that influence the anthropogenic Pb content the most. Soils with a large proportion of building materials and household utensils, like in Graft-De Rijp due to the large fires, show the highest Pb contents, up to ~5000 mg/kg (Supplementary 1).
The Pb content and Pb isotope composition of Dutch urban soils in regions with long habitation differs from Dutch rural soils. The median anthropogenic Pb content in the urban soils (140 mg/kg, Table 2) is a factor 10 higher than in the rural soils (13 mg/kg, Walraven et al. [19]). The higher anthropogenic Pb content in urban soils is caused by the presence of anthropogenic Pb sources like glazed potsherd and Pb paint flakes that can contain several wt.% Pb (Table 3). Even small pieces of these artefacts can increase the soil Pb content significantly. The median Pb isotope composition of the urban soils also differs from rural soils. The mean (206Pb/207Pb)a, (208Pb/207Pb)a and (206Pb/208Pb)a values of the urban soils are 1.171, 2.447 and 0.478 respectively, whereas in rural soils these values are 1.159, 2.441 and 0.475 respectively. Both urban and rural soils contain atmospheric Pb. The observed difference in the anthropogenic Pb isotope composition is caused by the presence of Pb containing artefacts in the urban soils. Figure 4a–f show that the origin of Pb in the artefacts most likely has a more local origin (Germany and Belgium) compared with Pb in atmospheric deposition that can contain Pb imported from Australia (e.g., gasoline Pb).

5.1.2. Differences and Similarities between Historical Time Periods

The anthropogenic Pb content of the Utrecht and Wijk bij Duurstede soils—influenced in the Roman period—is relatively low (<LOD to 15 mg/kg; Supplementary 1). Since the EF of these soils is <2, the Pb isotope composition of anthropogenic Pb in these soils has not been calculated (see Section 3.4). Nevertheless, the Pb isotope compositions of the potential Pb sources from the Roman period in Wijk bij Duurstede are presented in Figure 4b. The Pb isotope composition of the majority (~85%) of Roman potential Pb sources corresponds with the Pb isotope composition of unpolluted Dutch subsoils being derived predominantly from unglazed potsherds most likely made from local clay. The glazed potsherds (Figure 4b: sample 17 and 18) and glass fragment (Figure 4b: sample 22) from the Roman period, found in the Wijk bij Duurstede soils, have Pb isotope compositions that match coal and galena Pb (Figure 4b) and probably contain Pb from Dutch or Belgian Pb ores (galena).
There is no clear difference in Pb isotope composition between Utrecht soils influenced in the Medieval and Modern period (Figure 4a). The Pb isotope compositions of anthropogenic Pb in Wijk bij Duurstede soils influenced during the Medieval and Modern period, with the exception of 1 sample, are also consistent (Figure 4c,d). Based on Pb isotope ratios alone the time periods are essentially indistinguishable. However, the anthropogenic Pb content in the soils influenced during the various time periods does differ (Figure 3). Due to the increased use of lead in a variety of products over time and the increased population in The Netherlands, Pb pollution in urban soils also increased with time [31,36]. Since: (1) there are now strict regulations with respect to raising of land with city waste; (2) coal is no longer used as a primary energy source in The Netherlands and (3) public awareness of risks related to Pb increased significantly in recent years, further increase in the anthropogenic Pb content of city soils is expected to be limited. Careless renovation of (mainly old) houses, however, can still result in anthropogenic Pb (Pb based paint, Pb glazed roof tiles and Pb sheets) entering urban soils (backyards). For this reason, the removal of Pb containing building materials should be carried out with the greatest care, to minimize Pb exposure to children who may play in these yards.

5.2. Oral Pb Bioaccessibility

In Figure 5 calculated oral bioaccessibilities are plotted versus the (206Pb/207Pb)t ratios of the soil samples (Pb isotope data are lacking for sample U3 and U4). This figure also includes Pb isotope data of known anthropogenic Pb sources in The Netherlands. Table 4 and Figure 5 show that Pb bioaccessibilities for the studied soils decrease in the following order: Utrecht (32%–82%) > Wijk bij Duurstede (31%–38%) ≈ Graft-De Rijp (16%–38%).
The observed difference in oral Pb bioaccessibilities is also reflected in the soil (206Pb/207Pb)t ratios (Figure 5). The Pb polluted soils from Wijk bij Duurstede and Graft-De Rijp have very distinct (206Pb/207Pb)t ratios (1.172–1.179) that match with coal/galena and household waste that includes Pb-containing artefacts (Figure 5). Both coal and Pb containing artefacts such as remnants of Pb glazed pottery and roof tiles were visible in these soil samples. In addition, Hagens et al. [34] investigated sample GdR3 with a Scanning Electron Microscope (SEM). They concluded that this soil sample is mainly polluted with lead glass and lead glaze—primary Pb phases—with relatively large diameters (up to 675 um). Very few secondary Pb phases (Pb-apatite) were observed and there was a very low Pb content (0.02 wt.%) in the organic matter rich particles in this sample. Hagens et al. [34] concluded that the solubility of these primary Pb phases is relatively low, due to the small reactive surface and the incorporation of Pb in a glass matrix. This low solubility most likely resulted in the formation of very few secondary Pb phases. The coarse grain size and relatively insoluble primary Pb phases (coal and glazed potsherds) most likely explains the relatively low oral Pb bioaccessibility of the soil samples from Graft-De Rijp and Wijk bij Duurstede.
The (206Pb/207Pb)t ratios (1.156–1.160) of the Pb polluted soil samples from Utrecht differ from those of Wijk bij Duurstede and Graft-De Rijp (Figure 5). These ratios match with household waste and atmospheric Pb. In sample U3 to U6 anthropogenic Pb sources were not visible. Sample U5 was analysed with a SEM by Hagens et al. [34]. This sample is polluted with very fine primary Pb phases (<1 um). These particles were observed in the elemental map, but could not be detected using energy dispersive X-Ray fluorescence analysis. Based on the presence of the secondary minerals Pb apatite (10–30 um), and Pb containing organic matter (0.160 wt.%) and Fe phases (5–10 um), this soil most likely contains very fine soluble primary Pb phases like native Pb, Pb oxide or Pb carbonate particles [34]. Soil samples U1 and U2 were taken within ~50 m of a former Pb white factory in Utrecht. These samples most likely contain fine grained Pb white particles emitted from the factory. The fine grain size and relatively soluble primary Pb phases (e.g., Pb white) most likely explain the relatively high oral Pb bioaccessibility of the soil samples from Utrecht.
Residence in the soil is also expected to be an important factor. Assuming that oral bioaccessibility eventually decreases with time (soluble primary Pb phases are leached out or are converted to less soluble secondary Pb phases), soils of Graft-De Rijp are expected to have lower bioaccessibilities than soil U1 and U2 from Utrecht. Graft-De Rijp soils were mainly polluted in the 17th century (see Section 2.4), whereas Utrecht U1 and U2 were mainly polluted in the 19th century when the Pb white factory was in operation. Table 4 and Figure 5 show that bioaccessibilities in Graft-De Rijp soils are indeed lower.
Previous workers also determined oral Pb bioaccessibility of Pb polluted soils [32,59,60,61,62,63,64]. Comparison studies have shown that the bioaccessibility methodologies used in these studies differ substantially [52,65]. In addition, in most other studies, anthropogenic Pb sources were not identified or other Pb sources were involved (e.g., shooting ranges, incinerators, landfills, mining and smelting impacted soils) and therefore a comparison with the Dutch urban soils cannot be made.
The findings of this study can be used to assess human risk. The current practice of risk assessment of Pb in soils in The Netherlands is illustrated in Figure 6.
The total soil Pb content is measured to determine if a soil is polluted. A soil with a Pb content exceeding the intervention value of 530 mg/kg for standard soils (25% clay and 10% organic matter) is classified as “seriously” contaminated [67]. When this intervention value is not exceeded, no further action is required unless there is a specific “sensitive” situation, such as a vegetable garden (Figure 6). In case of a serious soil contamination (Pbstandard soil > 530 mg/kg), the contaminated site has, in principle, to be remediated. The need for remediation, however, is decided on the basis of actual risks to humans and ecosystems and the actual risk due to migration of the contamination. This risk assessment is performed in The Netherlands with the decision-support tool Sanscrit. Two main aspects of the tool can be distinguished (Van Kesteren et al. [66]: (1) the relevant human exposure scenario can be calculated and (2) soil-specific evaluation can be performed by determining the relative bioavailability factor (Rel F). This factor is introduced to compare oral bioavailability of Pb in soils with bioavailability of Pb based on toxicity studies with food, liquids and suspensions on which “legal” threshold values are based (see Walraven et al. [32] for more details). Rel F (= Frelative) is calculated according to Equation (5):
Frelative = Fsoil / Ftox.studies = (FB-soil × FA-soil × FH-soil) / (FB- tox.studies × FA-tox.studies × FH- tox.studies)
In which Frelative is the relative bioavailability of Pb, Fsoil is the bioavailability of Pb in soils, FB-soil is the bioaccessible Pb fraction in soil (the fraction that is mobilized from soil into the digestive juice, i.e., chyme), FA-soil is the bioaccessible Pb fraction from the soil entering the portal vein or lymph, FH-soil is the Pb fraction that entered the portal vein or the lymph and passes through the liver without being metabolized (this may exert toxicity in organs and tissues), Ftox.studies is the bioavailability of Pb determined in toxicity studies (mainly matrices such as foods and liquids), FB-tox.studies is the bioaccessible Pb fraction determined in toxicity studies, FA-tox.studies is the bioaccessible Pb fraction entering the portal vein or lymph determined in toxicity studies and FH-tox.studies is the Pb fraction that entered the portal vein or the lymph and passes through the liver without being metabolized, determined in toxicity studies.
As a worst case scenario, FA-soil is assumed to be 1 for children. Since inorganic Pb is not metabolized in the liver (ATSDR [68]), FH in both soil and toxicity studies is 1. Based on an absorption of 40% dietary lead (Oomen et al. [33]), FB-tox.studies × FA-tox.studies is set at 0.4. Based on these values, Equation (5) becomes:
Frelative = (FB-soil × 1 × 1) / (0.4 × 1) = FB-soil / 0.4
The investigated soils in the four towns are all considered made grounds. For made grounds, Rel F is set to 0.4 in the decision-support tool Sanscrit, implying that FB-soil is 16%. The implication is that if the actual FB-soil is lower than 16%, the bioavailability of Pb in the polluted soils is overestimated by Sanscrit, and vice versa. Table 4 shows that 13 out of 14 soils have bioaccessibilities higher than 16%. This implies that the risk for children may be underestimated at these locations. It is noted, however, that our model represents a worst case scenario. Experiments and calculations are based on fasted conditions. Children are normally fed throughout the day (especially when they play outside).
This finding is comparable to the results of Van Kesteren et al. [66] who performed a validation study in which the bioavailability of lead in 6 soils (including soils from Utrecht and Graft-de Rijp) was estimated using three in vitro bioavailability models (including the RIVM model). These results were compared with the results of a bioavailability study conducted on juvenile swine (in vivo study). The behaviour of lead in the gastrointestinal tract of swine is assumed to be comparable to that in children. Based on the results of their validation study, Van Kesteren et al. [66] proposed to increase Rel F to a value in the range from 0.58 (P50) to 0.84 (P80), taking into account the desired level of conservatism.

6. Conclusions

Anthropogenic Pb content and isotopic composition were determined on urban soils with a long habitation history. The anthropogenic Pb content of the urban soils varied between < LOD to 5266 mg/kg. The median anthropogenic Pb content increased in the following order: Wijk bij Duurstede (57 mg/kg) < Utrecht (127 mg/kg) < Fijnaart (133 mg/kg) < Graft-De Rijp (789 mg/kg). The median anthropogenic Pb content for the soils from the three distinguished time periods increased in the following order: Roman period (7 mg/kg) < Medieval period (43 mg/kg) < Modern period (235 mg/kg).
The Pb isotope composition of the anthropogenic Pb fraction in the urban soils varied from 1.111 to 1.199, 2.367 to 2.476 and 0.464 to 0.490 for 206Pb/207Pb)a, (208Pb/207Pb)a and (206b/208Pb)a respectively. The calculated Pb isotope compositions of anthropogenic Pb in the majority (~75%) of the urban soils appear to represent a mixture of potential anthropogenic Pb sources found in these soils: glazed potsherds, glazed roof tiles, building remnants, metal slag, Pb-based paint, Pb sheets, coal ash and other Pb containing artefacts. These anthropogenic Pb sources most likely entered the urban soils due to historical smelting activities, renovation and demolition of houses, disposal of coal ashes and raising and fertilization of land with city waste. The Pb isotope composition of the anthropogenic Pb fraction in ~25% of the urban soils is inconsistent with the encountered potential Pb sources. These topsoils have Pb isotope compositions consistent with an origin from incinerator ash and in some cases gasoline Pb.
The oral Pb bioaccessibility (FB-Pb)—determined with an in vitro test performed on soils from villages and cities with a long habitation history—varied from 16% to 82%. FB-Pb appears to be related to the chemical composition and grain size of the primary anthropogenic Pb phases and to pollution age. The smaller the grain size, the more soluble the primary Pb phases and a shorter pollution soil residence time yields a higher oral Pb bioaccessibility. Risk assessment based on the in vitro test results (fasted conditions; Rel F is 0.4) shows that in ~90% of the studied samples (13 out of 14) the risk of Pb polluted soil to children may be underestimated.

Supplementary Material

The following is available online at The following are available online at www.mdpi.com/www.mdpi.com/1660-4601/13/2/221/s1, Table S1: Database with the analytical and calculated results of the soil samples.

Acknowledgments

This work was supported financially by TNO and Deltares. We thank Jan van Doesburg of the Cultural heritage Agency of The Netherlands (RCE) for collaborating in this research (assisting in the field and providing some potential anthropogenic Pb sources). Erik van Vilsteren and Rob van Galen are acknowledged for performing the chemical and isotopic analysis. Special thanks to Menno van der Heiden for providing the map.

Author Contributions

All authors contributed to this study on pollution and oral bioaccessibility of Pb in soils of villages and cities with a long habitation history. Nikolaj Walraven wrote the main text with contributions from the other co-authors.

Conflicts of Interest

The authors declare no conflict of interest.

References

  1. Nriagu, J.O. A history of global metal pollution. Science 1996, 272, 223–224. [Google Scholar] [CrossRef]
  2. Macholz, R.M. The Biogeochemistry of Lead in the Environment, Part A: Ecological Cycles; Elsevier/North-Holland Biomedical Press: New York, NY, USA, 1978. [Google Scholar]
  3. Lomborg, B. The Sceptical Environmentalist: Measuring the Real State of the World; Cambridge University Press: Cambridge, UK, 1998. [Google Scholar]
  4. Von Storch, H.; Costa-Cabral, M.; Hagner, C.; Feser, F.; Pacyna, J.; Pacyna, E.; Kolb, S. Four decades of gasoline emissions and control policies in Europe: A retrospective assessment. Sci. Total Environ. 2003, 311, 151–176. [Google Scholar] [CrossRef]
  5. Van der Gon, H.D.; Appelman, W. Lead emissions from road transport in Europe: A revision of current estimates using various estimation methodologies. Sci. Total. Environ. 2009, 407, 5367–5372. [Google Scholar] [CrossRef] [PubMed]
  6. Walraven, N.; van Os, B.J.H.; Klaver, G.T.; Middelburg, J.J.; Davies, G.R. The lead (Pb) isotope signature, behaviour and fate of traffic-related lead pollution in roadside soils in The Netherlands. Sci. Total Environ. 2014, 472, 888–900. [Google Scholar] [CrossRef] [PubMed]
  7. Shotyk, W.; Weiss, D.; Appleby, P.G.; Cheburkin, A.K.; Frei, R.; Gloor, M.; Kramers, J.D.; Reese, S.; Van der Knaap, W.O. History of atmospheric lead deposition since 12,370 14C yr BP from a peat bog, Jura Mountains, Switzerland. Science 1998, 281, 1635–1640. [Google Scholar] [CrossRef] [PubMed]
  8. Weiss, D.; Shotyk, W.; Appleby, P.G.; Kramers, J.D.; Cheburkin, A.K. Atmospheric Pb deposition since the industrial revolution recorded by five Swiss peat profiles: Enrichment factors, fluxes, isotopic composition, and sources. Environ. Sci. Technol. 1999, 33, 1340–1352. [Google Scholar] [CrossRef]
  9. Vile, M.A.; Kelman Wieder, R.; Novák, M. 200 Years of Pb deposition throughout then Czech Republic: Patterns and sources. Environ. Sci. Technol. 2000, 34, 12–21. [Google Scholar] [CrossRef]
  10. Le Roux, G.; Aubert, D.; Stille, P.; Krachler, M.; Kober, B.; Cheburkin, A.; Bonani, G.; Shotyk, W. Recent atmospheric Pb deposition at a rural site in southern Germany assessed using a peat core and snow pack, and comparison with other archives. Atmos. Environ. 2005, 39, 6790–6801. [Google Scholar] [CrossRef]
  11. Walraven, N.; van Os, B.J.H.; Klaver, G.T.; Middelburg, J.J.; Davies, G.R. Reconstruction of historical atmospheric Pb deposition using Dutch urban lake sediments: A Pb isotope study. Sci. Total Environ. 2014, 484, 185–195. [Google Scholar] [CrossRef]
  12. Chow, T.J. Pb accumulation in roadside soil and grass. Nature 1970, 225, 295–296. [Google Scholar] [CrossRef]
  13. Gulson, B.L.; Mizon, K.J.; Law, A.J.; Korsch, M.J.; Davis, J.J. Sources and pathways of lead in humans from the Broken Hill mining community: An alternative use of exploration methods. Econ. Geol. 1994, 89, 889–908. [Google Scholar] [CrossRef]
  14. Walraven, N.; van Os, B.J.H.; Klaver, G.Th.; Baker, J.H.; Vriend, S.P. Trace element concentrations and stable lead isotopes in soils as tracers of lead pollution in Graft-De Rijp, the Netherlands. J. Geochem. Explor. 1997, 59, 47–58. [Google Scholar] [CrossRef]
  15. Hansmann, W.; Köppel, V. Lead-isotopes as tracers of pollutants in soils. Chem. Geol. 2000, 171, 123–144. [Google Scholar] [CrossRef]
  16. Cloquet, C.; Carignan, J.; Libourel, G.; Sterckeman, T.; Perdrix, E. Tracing source pollution in soils using cadmium and lead isotopes. Environ. Sci. Technol. 2006, 40, 2525–2530. [Google Scholar] [CrossRef] [PubMed]
  17. Komárek, M.; Ettler, V.; Chrastný, V.; Mihaljevič, M. Lead isotopes in environmental sciences: A review. Environ. Internat. 2008, 34, 562–577. [Google Scholar] [CrossRef] [PubMed]
  18. Reimann, C.; Smith, D.B.; Woodruff, L.G.; Flem, B. Pb-concentrations and Pb-isotope ratios in soils collected along an east-west transect across the United States. Appl. Geochem. 2011, 26, 1623–1631. [Google Scholar] [CrossRef]
  19. Walraven, N.; van Gaans, P.F.M.; van der Veer, G.; van Os, B.J.H.; Klaver, G.Th.; Vriend, S.P.; Middelburg, J.J.; Davies, G.R. Tracing diffuse anthropogenic Pb sources in rural soils by means of Pb isotope analysis. Appl. Geochem. 2013, 37, 242–257. [Google Scholar] [CrossRef]
  20. Rabinowitz, M.B.; Wetherill, G.W. Identifying sources of lead contamination by stable isotopes techniques. Environ. Sci. Technol. 1972, 6, 705–709. [Google Scholar] [CrossRef]
  21. Olsen, K.W.; Skogerboe, R.K. Identification of soil lead compounds from automotive sources. Environ. Sci. Technol. 1975, 9, 227–230. [Google Scholar] [CrossRef]
  22. Gulson, B.L.; Tiller, K.G.; Mizon, K.J.; Merry, R.H. Use of Pb isotope ratios in soils to identify the sources of Pb contamination near Adelaide, South Australia. Environ. Sci. Technol. 1981, 15, 691–696. [Google Scholar] [CrossRef] [PubMed]
  23. Steinmann, M.; Stille, P. Rare earth element behavior and Pb, Sr, Nd isotope systematics in a heavy metal contaminated soil. Appl. Geochem. 1997, 12, 607–623. [Google Scholar] [CrossRef]
  24. Shiharata, H.; Elias, W.; Patterson, C.C. Chronological variations in concentrations and isotopic compositions of anthropogenic atmospheric lead in sediments of a remote subalpine pond. Geochim. Cosmochim. Acta 1980, 44, 149–162. [Google Scholar] [CrossRef]
  25. Petit, D.; Mennessier, J.P.; Lamberts, L. Stable lead isotopes in pond sediments as tracer of past and present atmospheric lead pollution in Belgium. Atmos. Environ. 1984, 18, 1189–1193. [Google Scholar] [CrossRef]
  26. Moor, H.C.; Schaller, T.; Sturm, M. Recent changes in stable Pb isotope ratios in sediments of Lake Zug, Switzerland. Environ. Sci. Technol. 1996, 30, 2928–2933. [Google Scholar] [CrossRef]
  27. Zang, Y. 100 years of Pb deposition and transport in soils in Champaign, Illinois, USA. Water Air Soil Pollut. 2003, 146, 197–210. [Google Scholar] [CrossRef]
  28. Nriagu, J.O. Lead and Lead Poisoning in Antiquity; John Wiley & Sons Inc: New York, NY, USA, 1983. [Google Scholar]
  29. Ter Haar, G.; Aronow, R. New information on lead in dirt and dust as related to the childhood lead problem. Environ. Health Perspect. 1974, 7, 83–89. [Google Scholar] [CrossRef]
  30. Bogden, J.D.; Louria, D.L. Soil contamination from lead in paint chips. Bull. Environ. Contam. Toxicol. 1975, 14, 289–294. [Google Scholar] [CrossRef] [PubMed]
  31. Grandjean, P. Lead in Danes: Historical and toxicological studies. Environ. Qual. Saf. Suppl. 1975, 2, 6–75. [Google Scholar] [PubMed]
  32. Walraven, N.; Bakker, M.; van Os, B.J.H.; Klaver, G.T.; Middelburg, J.J.; Davies, G.R. Factors controlling the oral bioaccessibility of anthropogenic Pb in polluted soils. Sci. Total Environ. 2015, 2, 149–163. [Google Scholar] [CrossRef] [PubMed]
  33. Oomen, A.G.; Rompelberg, C.J.M.; Bruil, M.A.; Dobbe, C.J.G.; Pereboom, D.P.K.H.; Sips, A.J.A.M. Development of an in vitro digestion model for estimation of bioaccessibility of soil contaminants. Arch. Environ. Contam. Toxicol. 2003, 44, 281–287. [Google Scholar] [CrossRef] [PubMed]
  34. Hagens, W.I.; Walraven, N.; Minekus, M.; Havenaar, R.; Lijzen, J.P.A.; Oomen, A.G. Relative Oral Bioavailability of Lead from Dutch Made Grounds; RIVM report 2009:711701086; National Institute for Public Health and the Wnvironment, Ministry of Health, Welfare and Sport: Utrech, The Netherlands, 2009. [Google Scholar]
  35. Provincie Gaat Door Met Sanering Fijnaart. Available online: http://www.brabant.nl/politiek-en-bestuur/provinciale-staten/vergaderstukken-en-besluiten-ps-en-commissies/zoek.aspx?qvi=9386 (accessed on 26 September 2013).
  36. Centraal Bureau voor de Statistiek: Kies Table. Available online: http://statline.cbs.nl/StatWeb/dome/?TH=3600&LA=nl (accessed on 7 January 2016).
  37. De Bruin, R.E.; Hoekstra, T.J.; Pietersma, A. Twintig Eeuwen Utrecht, Een Korte Geschiedenis; Atelier Rijksbouwmeester: Utrecht, The Netherlands, 1999. [Google Scholar]
  38. Archis. Archeological archive and information system. 2013; (restricted access). [Google Scholar]
  39. Het Utrechts Archief. Available online: http://www.hetutrechtsarchief.nl/werkstukken/onderwerpen/middeleeuwse-stad (accessed on 7 January 2016).
  40. Kooij, P. P.D.’t Hart, Leven in Utrecht 1850–1914: Groei Naar Een Moderne Stad; Het Utrechts Archief: Hilversum, The Netherlands, 2005. [Google Scholar]
  41. Gemeente Wijk bij Duurstede: Geschiedenis. Available online: http://www.wijkbijduurstede.nl/zoeken/resultaten/geschiedenis/ (accessed on 7 January 2016).
  42. Regionaal Archief West Brabant. Available online: http://www.regionaalarchiefwestbrabant.nl/historie/moerdijk/fijnaart-en-heijningen (accessed on 7 January 2016).
  43. Ruimtelijke En Economische Ontwikkeling: Domplein Revisited. Available online: https://www.utrecht.nl/fileadmin/uploads/documenten/3.ruimtelijk-ontwikkeling/Erfgoed/Publicaties/Basisrapportages_Archeologie/BRArch-64-DP7-Domplein.pdf (accessed on 7 January 2016).
  44. Dijkstra, J. Het Domein van de Boer en de Ambachtsman: Een Opgraving op het Terrein van de Voormalige Fruitveiling te Wijk bij Duurstede: Een Deel van Dorestad en de Villa Wijk Archeologisch Onderzocht; ADC Archeoprojecten: Amersfoort, The Netherlands, 2012. [Google Scholar]
  45. Centraal Bureau voor de Statistiek. Available online: http://statline.cbs.nl/StatWeb/publication/?DM=SLNL&PA=71554NED&D1=0–7&D2=a&VW=T (accessed on 7 January 2016).
  46. Van der Veer, G. Geochemical Soil Survey of the Netherlands: Atlas of Major and Trace Elements in Topsoil and Parent Material, Assessment of Natural and Anthropogenic Enrichment Factors; Utrecht University: Utrech, The Netherlands, 2006. [Google Scholar]
  47. Walraven, N.; van Gaans, P.F.M.; van der Veer, G.; van Os, B.J.H.; Klaver, G.Th.; Vriend, S.P.; Middelburg, J.J.; Davies, G.R. Lithologically inherited variation in Pb isotope ratios in sedimentary soils in The Netherlands. Appl. Geochem. 2013, 37, 228–241. [Google Scholar] [CrossRef]
  48. Huisman, D.J.; de Groot, T.; Pols, S.; van Os, B.J.H.; Degryse, P. Compositional variation in roman colourless glass objects from the Bocholtz burial (The Netherlands). Archaeometry 2009, 51, 413–439. [Google Scholar] [CrossRef]
  49. Krachler, M.; Le Roux, G.; Kober, B.; Shotyk, W. Optimising accuracy and precision of lead isotope measurements (206Pb, 207Pb, 208Pb) in acid digests of peat with ICP-SMS using individual mass discrimination correction. J. Anal. Atom. Spectrom. 2004, 19, 354–361. [Google Scholar] [CrossRef]
  50. NEN-ISO-EN 17294-2: 2004 en: Water–Toepassing van Massaspectrometrie Met Inductief Gekoppeld Plasma (ICP-MS)-Deel 2: Bepaling van 62 Elementen. Available online: https://www.nen.nl/NEN-Shop/Norm/NENENISO-1729422004-en.htm (accessed on 01 November 2004).
  51. NEN 6966: 2005/C1:2006: Milieu–Analyse van Geselecteerde Elementen in Water, Eluaten en Destruaten–Atomaire Emissiespectrometrie Met Inductief Gekoppeld Plasma. Available online: https://www.nen.nl/pdfpreview/preview_110620.pdf (accessed on 01 December 2005).
  52. Van de Wiele, T.R.; Oomen, A.G.; Wragg, J.; Cave, M.; Minekus, M.; Hack, A.; Cornelis, C.; Rompelberg, C.J.M.; De Zwart, L.L.; Klinck, B.; et al. Comparison of five in vitro digestion models to in vivo experimental results: Lead bioaccessibility in the human gastrointestinal tract. J. Environ. Sci. Heal. A 2007, 42, 1203–1211. [Google Scholar] [CrossRef] [PubMed] [Green Version]
  53. Huisman, D.J. Geochemical Characterization of Subsurface Sediments in The Netherlands; Netherlands Institute of Applied Geosciences: Utrecht, The Netherlands, 1998. [Google Scholar]
  54. Pasteels, P.; Netels, V.; DeJonghe, L.; Deutsch, S. La composition isotopique du plomb des gisements belges: Implications sur les plans génétique et économique (note préliminaire). Bull. Soc. Belge. Géol. 1980, 89, 123–136. [Google Scholar]
  55. Cauet, S.; Weis, D.; Herbosch, A. Genetic study of Belgian lead zinc mineralizations in carbonate environments through lead isotopic geochemistry. BRGM 1982, 4, 329–341. [Google Scholar]
  56. Monna, F.; Lancelot, J.; Croudace, I.W.; Cundy, A.B.; Lewis, J.T. Lead isotopic composition of airborne material from France and Southern U.K. Implications for Pb pollution sources in urban areas. Environ. Sci. Technol. 1997, 31, 2277–2286. [Google Scholar] [CrossRef]
  57. Chiaradia, M.; Cupelin, F. Behaviour of airborne lead and temporal variations of its source effect in Geneva (Switzerland): Comparison of anthropogenic versus natural processes. Atmos. Environ. 2000, 34, 959–971. [Google Scholar] [CrossRef]
  58. Carignan, J.; Libourel, G.; Cloquet, C.; Le Forestier, L. Lead isotopic composition of fly ash and flue gas residues from municipal solid waste combustors in France: Implication for atmospheric lead source tracing. Environ. Sci. Technol. 2005, 39, 2018–2024. [Google Scholar] [CrossRef] [PubMed] [Green Version]
  59. Madrid, F.; Biasioli, M.; Ajmone-Marsan, F. Availability and bioaccessibility of metals in fine particles of some urban soils. Arch. Environ. Con. Tox. 2008, 55, 212–232. [Google Scholar] [CrossRef] [PubMed]
  60. Smith, E.; Weber, J.; Naidu, R.; McLaren, R.G.; Juhasz, A.L. Assessment of lead bioaccessibility in peri-urban contaminated soils. J. Hazard. Mater. 2011, 186, 300–305. [Google Scholar] [CrossRef]
  61. Appleton, J.D.; Cave, M.R.; Wragg, J. Modelling lead bioaccessibility in urban topsoils based on data from Glasgow, London, Northampton and Swansea, UK. Environ. Pollut. 2012, 171, 265–272. [Google Scholar] [CrossRef] [PubMed] [Green Version]
  62. Luo, X.-S.; Yu, S.; Li, X.-D. The mobility, bioavailability, and human bioaccessibility of trace metals in urban soils of Hong Kong. Appl. Geochem. 2012, 27, 995–1004. [Google Scholar] [CrossRef]
  63. Farmer, J.G.; Broadway, A.; Cave, M.R.; Wragg, J.; Fordyce, F.M.; Graham, M.C.; Ngwenya, B.T.; Bewley, R.J.F. A lead isotopic study of the human bioaccessibility of lead in urban soils from Glasgow, Scotland. Sci. Total Environ. 2011, 409, 4958–4965. [Google Scholar] [CrossRef] [PubMed]
  64. Yang, K.Y.; Cattle, S.R. Bioaccessibility of lead in urban soils of Broken Hill, Australia: A study based on in vitro digestion and the IEUBK model. Sci. Total Environ. 2015, 538, 922–933. [Google Scholar] [CrossRef] [PubMed]
  65. Oomen, A.G.; Hack, A.; Minekus, M.; Zeijdner, E.; Cornelis, C.; Schoeters, G.; Verstraete, W.; Wiele, T.V.; Wragg, J.; Rompelberg, C.J.M.; et al. Comparison of five in vitro digestion models to study the bioaccessibility of soil contaminants. Environ. Sci. Technol. 2002, 36, 3326–3334. [Google Scholar] [CrossRef] [PubMed]
  66. Van Kesteren, P.C.E.; Walraven, N.; Schuurman, T.; Dekker, R.; Havenaar, R.; Maathuis, A.J.H.; Bouwmeester, H.; Kramer, E.; Hoogenboom, R.; Slob, W.; et al. Bioavailability of Lead from Dutch Made Grounds: A Validation Study; RIVM report 607711015/2014; National Institute for Public Health and the Wnvironment, Ministry of Health, Welfare and Sport: Utrech, The Netherlands, 2014. [Google Scholar]
  67. Swartjes, F.A. Risk-Based Assessment of Soil and Groundwater Quality in The Netherlands: Standards and Remediation Urgency. Risk Analysis 1999, 19, 1235–1249. [Google Scholar] [CrossRef] [PubMed]
  68. Agency for Toxic Substances and Disease Registry (ATSDR). Lead Toxicity. Available online: http://www.atsdr.cdc.gov/csem/lead/docs/lead.pdf (accessed on 11 February 2016).
Figure 1. Sample locations of the Pb polluted soils and potential anthropogenic Pb sources.
Ijerph 13 00221 g001
Figure 2. Pb content (mg/kg) of the soil samples—background or influenced in the Roman, Medieval or Modern time—versus Al content (wt.%) per city/village. The line indicates the average relationship between the Al and Pb content of unpolluted Dutch sedimentary soils, based on 303 samples ( ) [47]. The dashed lines are the 95% confidence intervals of the relationship between Al and Pb. a = Utrecht; b = Wijk bij Duurstede; c = Fijnaart; d = Graft-De Rijp.
Ijerph 13 00221 g002
Figure 3. Box-whisker plots of Pba, (206Pb/207Pb)a, (208Pb/207Pb)a and (206Pb/208Pb)a in the urban soils (S) and potential Pb artefacts (A) showing the minimum (lower whisker), maximum (upper whisker), median (centre of the box), lower quartile (bottom of box), and upper quartile (top of box) values. U = Utrecht; WbD = Wijk bij Duurstede; F = Fijnaart; GdR = Graft-De Rijp.
Ijerph 13 00221 g003
Figure 4. (208Pb/207Pb)a versus (206Pb/207Pb)a in urban soils and potential anthropogenic Pb sources in The Netherlands. Ellipses represent the lithologically inherited Pb isotope composition of Dutch soils and the Pb isotope composition of potential anthropogenic Pb sources (gasoline Pb, incinerator ash, coal and galena ore). References ellipses: Subsoil: Walraven et al. [47]. Coal: Walraven et al. [14,19]. Galena: Pasteels et al. [54] and Cauet et al. [55]. Gasoline Pb: Walraven et al. [6]. Incinerator ash: Monna et al. [56], Chiaradia and Cupelin [57], Hansmann and Köppel [15], Carignan et al. [58] and Cloquet et al. [16]. L = landfill, t = topsoil, S = subsoil, R = Roman, Me = Medieval, Mo = Modern, a = Utrecht (all periods); b = Wijk bij Duurstede (Roman period); c = Wijk bij Duurstede (Medieval period); d = Wijk bij Duurstede (Modern period); e = Fijnaart (Modern Period); f = Graft-De Rijp (Modern period). Numbers in the rectangles match with the artefact numbers in Table 3.
Ijerph 13 00221 g004
Figure 5. FB-Pb versus (206Pb/207Pb)t of soils from cities and villages with a long habitation history. 1 Walraven et al. [6]; 2 Walraven et al. [11]; 3 Walraven et al. [14] & this study; 4 Walraven et al. [19]; 5 Pasteels et al. [54]; 6 Cauet et al. [55].
Ijerph 13 00221 g005
Figure 6. Current practice of risk assessment of Pb in The Netherlands (source: Van Kesteren et al. [66]; with permission).
Ijerph 13 00221 g006
Table 1. Sample locations, site coordinates (RD coordinates), sampling dates and founding dates of the cities and villages.
LocationAbbreviationCoordinatesFounded in (year)Sampling Date
UtrechtU136,800, 455,90047 B.C.October 2000
Wijk bij DuurstedeWbD151,900, 442,95057 B.C.May 2003
FijnaartF91,400, 405,6501548 A.D.April 2001
Graft-De RijpGdR118,200, 507,6501612 A.D.January 1996
Table 2. Summary of the analytical and calculated results of the soils from Utrecht, Wijk bij Duurstede, Fijnaart and Graft-De Rijp.
Measured ParameterStatisticAllUtrechtWijk bij DuurstedeFijnaartGraft-De Rijp
AllBRMeMoAllBRMeMoAllBMoAllBMo
Pba (mg/kg)n1372222513406510193052545540
MIN<LOD<LOD<LOD123151<LOD<LOD<LOD620<LOD<LOD9<LOD<LOD5
MED140127213671585734229413332257893790
MAX526639021539038774047142740109331093526635266
(206Pb/207Pb)an10218--51324--61823-2337-37
MIN1.1111.153--1.1671.1531.137--1.1371.1531.130-1.1301.111-1.111
MED1.1711.174--1.1691.1751.170--1.1701.1701.163-1.1631.172-1.172
MAX1.1991.191--1.1771.1911.180--1.1751.1801.199-1.1991.179-1.179
(208Pb/207Pb)an10218--51324--61823-2337-37
MIN2.3672.430--2.4312.4302.418--2.4182.4342.367-2.3672.386-2.386
MED2.4472.442--2.4472.4412.452--2.4572.4512.432-2.4322.448-2.448
MAX2.4762.475--2.4752.4662.459--2.4592.4592.476-2.4762.458-2.458
(206Pb/208Pb)an10218--51324--61823-2337-37
MIN0.4650.472--0.4740.4720.470--0.4700.4730.472-0.4720.465-0.465
MED0.4780.479--0.4780.4800.477--0.4770.4780.479-0.4790.478-0.478
MAX0.4900.488--0.4810.4880.480--0.4780.4800.490-0.4900.482-0.482
Al (wt.%)n1372222513406510193052545540
MIN0.1591.9882.1444.8053.0041.9882.5293.8845.3502.9752.5290.3380.3381.0060.1593.3870.159
MED3.4723.2734.1234.8113.9103.0364.7406.3676.1104.8003.6103.0143.1153.0133.5466.3513.440
MAX7.3576.1016.1014.8174.5233.7756.9976.9976.2925.8426.0724.1473.6834.1477.3577.3577.251
MIN = minimum; MED = median; MAX = maximum; LOD = limit of detection; R = Roman Period; Me = Medieval Period; Mo = Modern Period; B = background.
Table 3. Analytical results of the (potential) anthropogenic Pb sources (Pb artefacts).
SampleNr.SitePeriodCenturyAl (wt.%)Pb (mg/kg)206Pb/207Pb208Pb/207Pb206Pb/208Pb
potsherd1UMe-N.D.471.1872.4960.476
glazed roof tile2UMo-5.96349481.1882.4500.485
building remnants3UMo-3.5945131.1802.4360.484
metal slag4UMo-3.5501061.1562.4470.473
potsherd5WbDR-7.993261.2042.4720.487
potsherd6WbDR-7.546281.2052.4750.487
potsherd7WbDR-11.432351.2032.4760.486
potsherd8WbDR-10.013321.2062.4800.486
potsherd9WbDR-6.803211.1952.4740.483
potsherd10WbDR-9.785311.2002.4800.484
potsherd11WbDR-11.436241.1972.4790.483
potsherd12WbDR-10.061331.2042.4780.486
potsherd13WbDR-8.487281.2042.4770.486
potsherd14WbDR-12.382391.2062.4800.486
potsherd15WbDR-8.989111.1952.4760.483
potsherd16WbDR-12.259401.2002.4760.485
glazed potsherd17WbDR-7.862131291.1822.4580.481
glazed potsherd18WbDR-6.572268361.1732.4490.479
sherd19WbDRmid8.7052971.1852.4600.482
sherd20WbDRmid9.5641941.1992.4720.485
sherd21WbDRearly7.4131561.2042.4740.487
glass22WbDR-1.30681.1702.4440.479
sherd23WbDR3/46.202221.1992.4560.488
production slag24WbDMe-1.195121.1952.4670.485
production slag25WbDMe-6.871291.2032.4760.486
production slag26WbDMe-1.58331.1962.4680.484
sherd27WbDMe-8.175231.2042.4900.484
sherd28WbDMe-9.833271.2052.4860.485
sherd29WbDMe-14.704511.1902.4740.481
glass30WbDMeearly1.14761031.2072.4840.486
sherd31WbDMecar.8.062381.1502.4050.478
sherd32WbDMecar.7.514271.1822.4620.480
glazed potsherd33WbDMe10/1110.444311381.1772.4570.479
glazed potsherd34WbDMe1110.421126201.1772.4580.479
glazed potsherd35WbDMe1210.37853451.1772.4560.479
glazed potsherd36WbDMe138.189305291.1782.4580.479
glazed potsherd37WbDMe147.29197601.1812.4600.480
prod. remnants38WbDMe-5.208581.1822.4660.480
prod. remnants39WbDMe-4.5957121.1792.4580.480
prod. remnants40WbDMe-3.854661.1782.4580.479
prod. remnants41WbDMe-0.1436511.1792.4560.480
prod. remnants42WbDMe-1.07022651.1652.4420.477
glazed potsherd43WbDMo-6.688370381.1742.4570.478
glazed potsherd44WbDMo-5.682168681.1752.4540.479
glazed potsherd45WbDMo16/1711.404100491.1832.4630.480
glazed potsherd46WbDMo167.071409941.1842.4600.481
glazed potsherd47WbDMo177.274153541.1522.3970.480
glazed potsherd48WbDMo176.978869041.1712.4510.478
glazed potsherd49WbDMo176.227168451.1802.4550.481
majolica50WbDMo174.349194781.1852.4580.482
glazed tile51WbDMo175.139115441.1862.4610.482
glazed potsherd52WbDMo177.551215181.1852.4590.482
glazed potsherd53WbDMo187.39966671.1782.4520.481
Pb spool54WbDMo-0.0078783701.1792.4530.481
potsherd55FMo-N.D.391.1812.4600.480
coal ashes56FMo-N.D.1231.1612.4460.475
glazed rooftile57FMo-N.D.231061.1722.4510.478
metal slag58FMo-N.D.411.1672.4520.476
coal ashes59FMo-N.D.21821.1742.4470.480
glazed roof tile60FMo-N.D.193001.1762.4520.479
metal slag61FMo-N.D.821.1702.4450.479
metal slag62FMo-N.D.15021.1592.4420.474
undefined object 63GdRMo-N.D.1961.1682.4480.477
glazed red roof tile 64GdRMo-6.822594191.1762.4500.480
glazed red roof tile 65GdRMo-6.843401861.1772.4530.480
red roof tile 66GdRMo-7.6641661.1642.4430.476
red roof tile 67GdRMo-7.7431891.1672.4520.476
glazed chimney pot68GdRMo-7.447276971.1942.4780.482
grey roof tile69GdRMo-9.918511.1832.4590.481
red paint (on wood)70GdRMo-0.0901856651.1962.4680.485
impregnated wood71GdRMo-0.21749181.1922.4660.483
brown paint72GdRMo-N.D.1078961.1602.4450.474
white paint73GdRMo-0.894600741.1712.4510.478
Pb sheet 174GdRMo-N.D.~10000001.1652.4390.478
Pb sheet 275GdRMo-N.D.~10000001.1662.4640.473
century = determined by archaeologists (for all Pb sources the archeological period could be determined, but not always the exact century in which they were made); car. = Carolingian; mid = middle.
Table 4. Lead isotope composition of the soil samples used in the in vitro digestion model, Pb content of the soils, chyme and pellets, and FB-Pb (Hagens et al. [34]) (see Equation (4)).
LocationSample NameInferred Pb SourceSoilChymePelletBioaccessibility
Pb (mg/kg)206Pb/207Pb208Pb/207PbPb (mg/kg)Pb (mg/kg)FB-Pb (%)
Utrecht 1U1City waste (Pb white)14431.1562.43950948435
Utrecht 1U2City waste (Pb white)16511355120482
Utrecht 2U3City waste1237--77778963
Utrecht 2U4City waste127554158142
Utrecht 3U5City waste9521.1602.43730331332
Utrecht 3U6City waste92752057756
Wijk bij Duurstede 1WbD1City waste 6391.172 *2.453 *20116831
Wijk bij Duurstede 1WbD2City waste 143154549038
Graft-de Rijp 1GdR1City waste 9651.179 *2.455 *31727933
Graft-de Rijp 2GdR2City waste 23351.1752.45667788829
Graft-de Rijp 2GdR3City waste 194750642526
Graft-de Rijp 3GdR4City waste 5401.1742.45117532232
Graft-de Rijp 3GdR5City waste 154947485531
Graft-de Rijp 4GdR6City waste 16681.174 *2.450 *26552416
* measured in different soil sample, but from the same sample location.

