
Vulnerability of Coastal Communities from Storm Surge and Flood Disasters


Abstract
:1. Introduction
2. Data and Methods
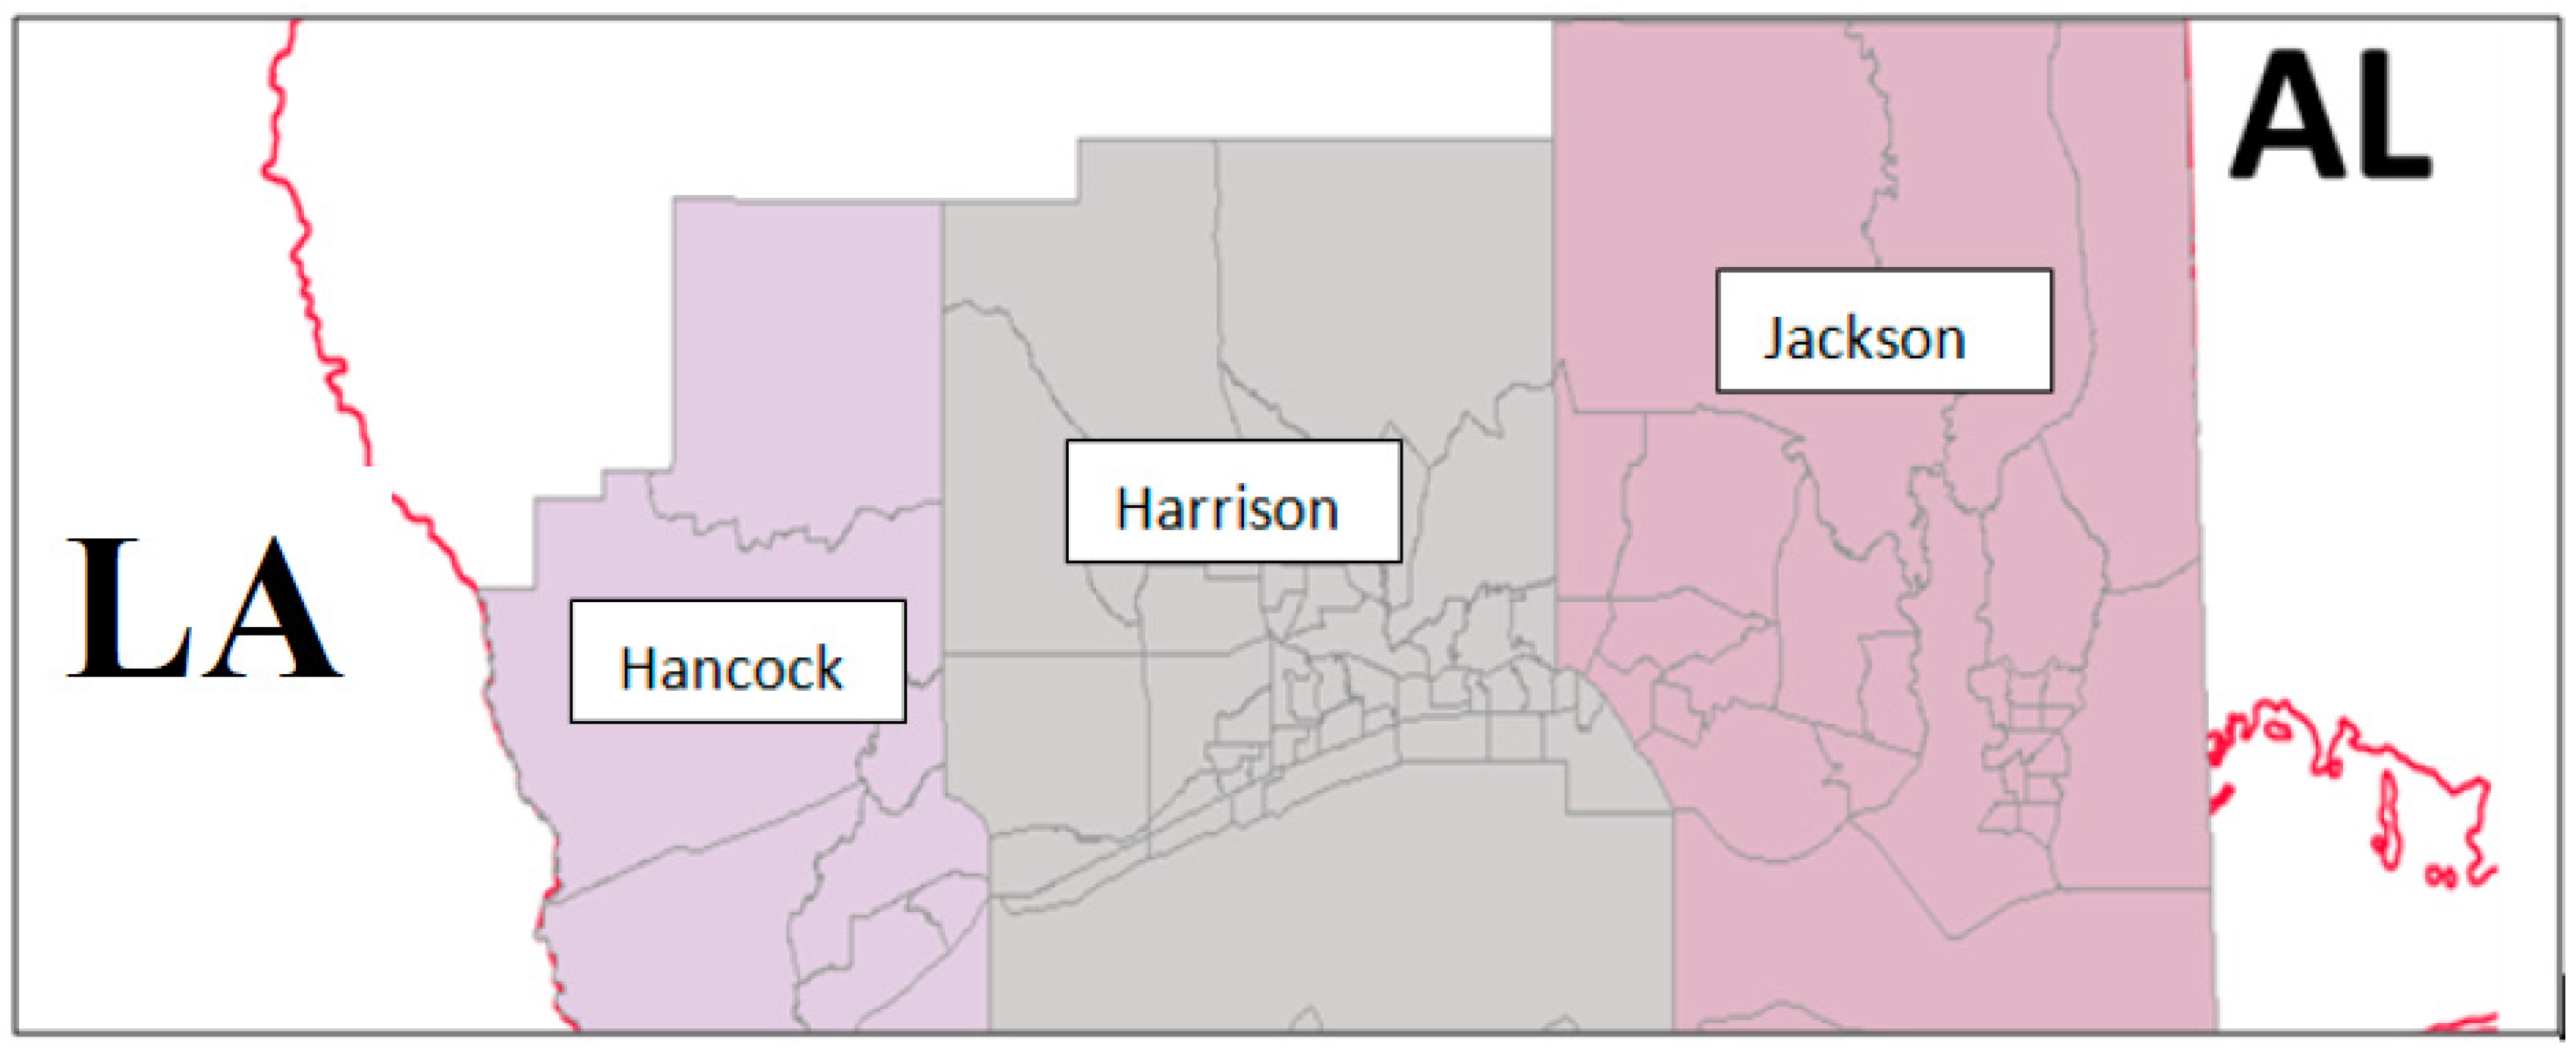
2.1. Study Area
2.2. Methodology
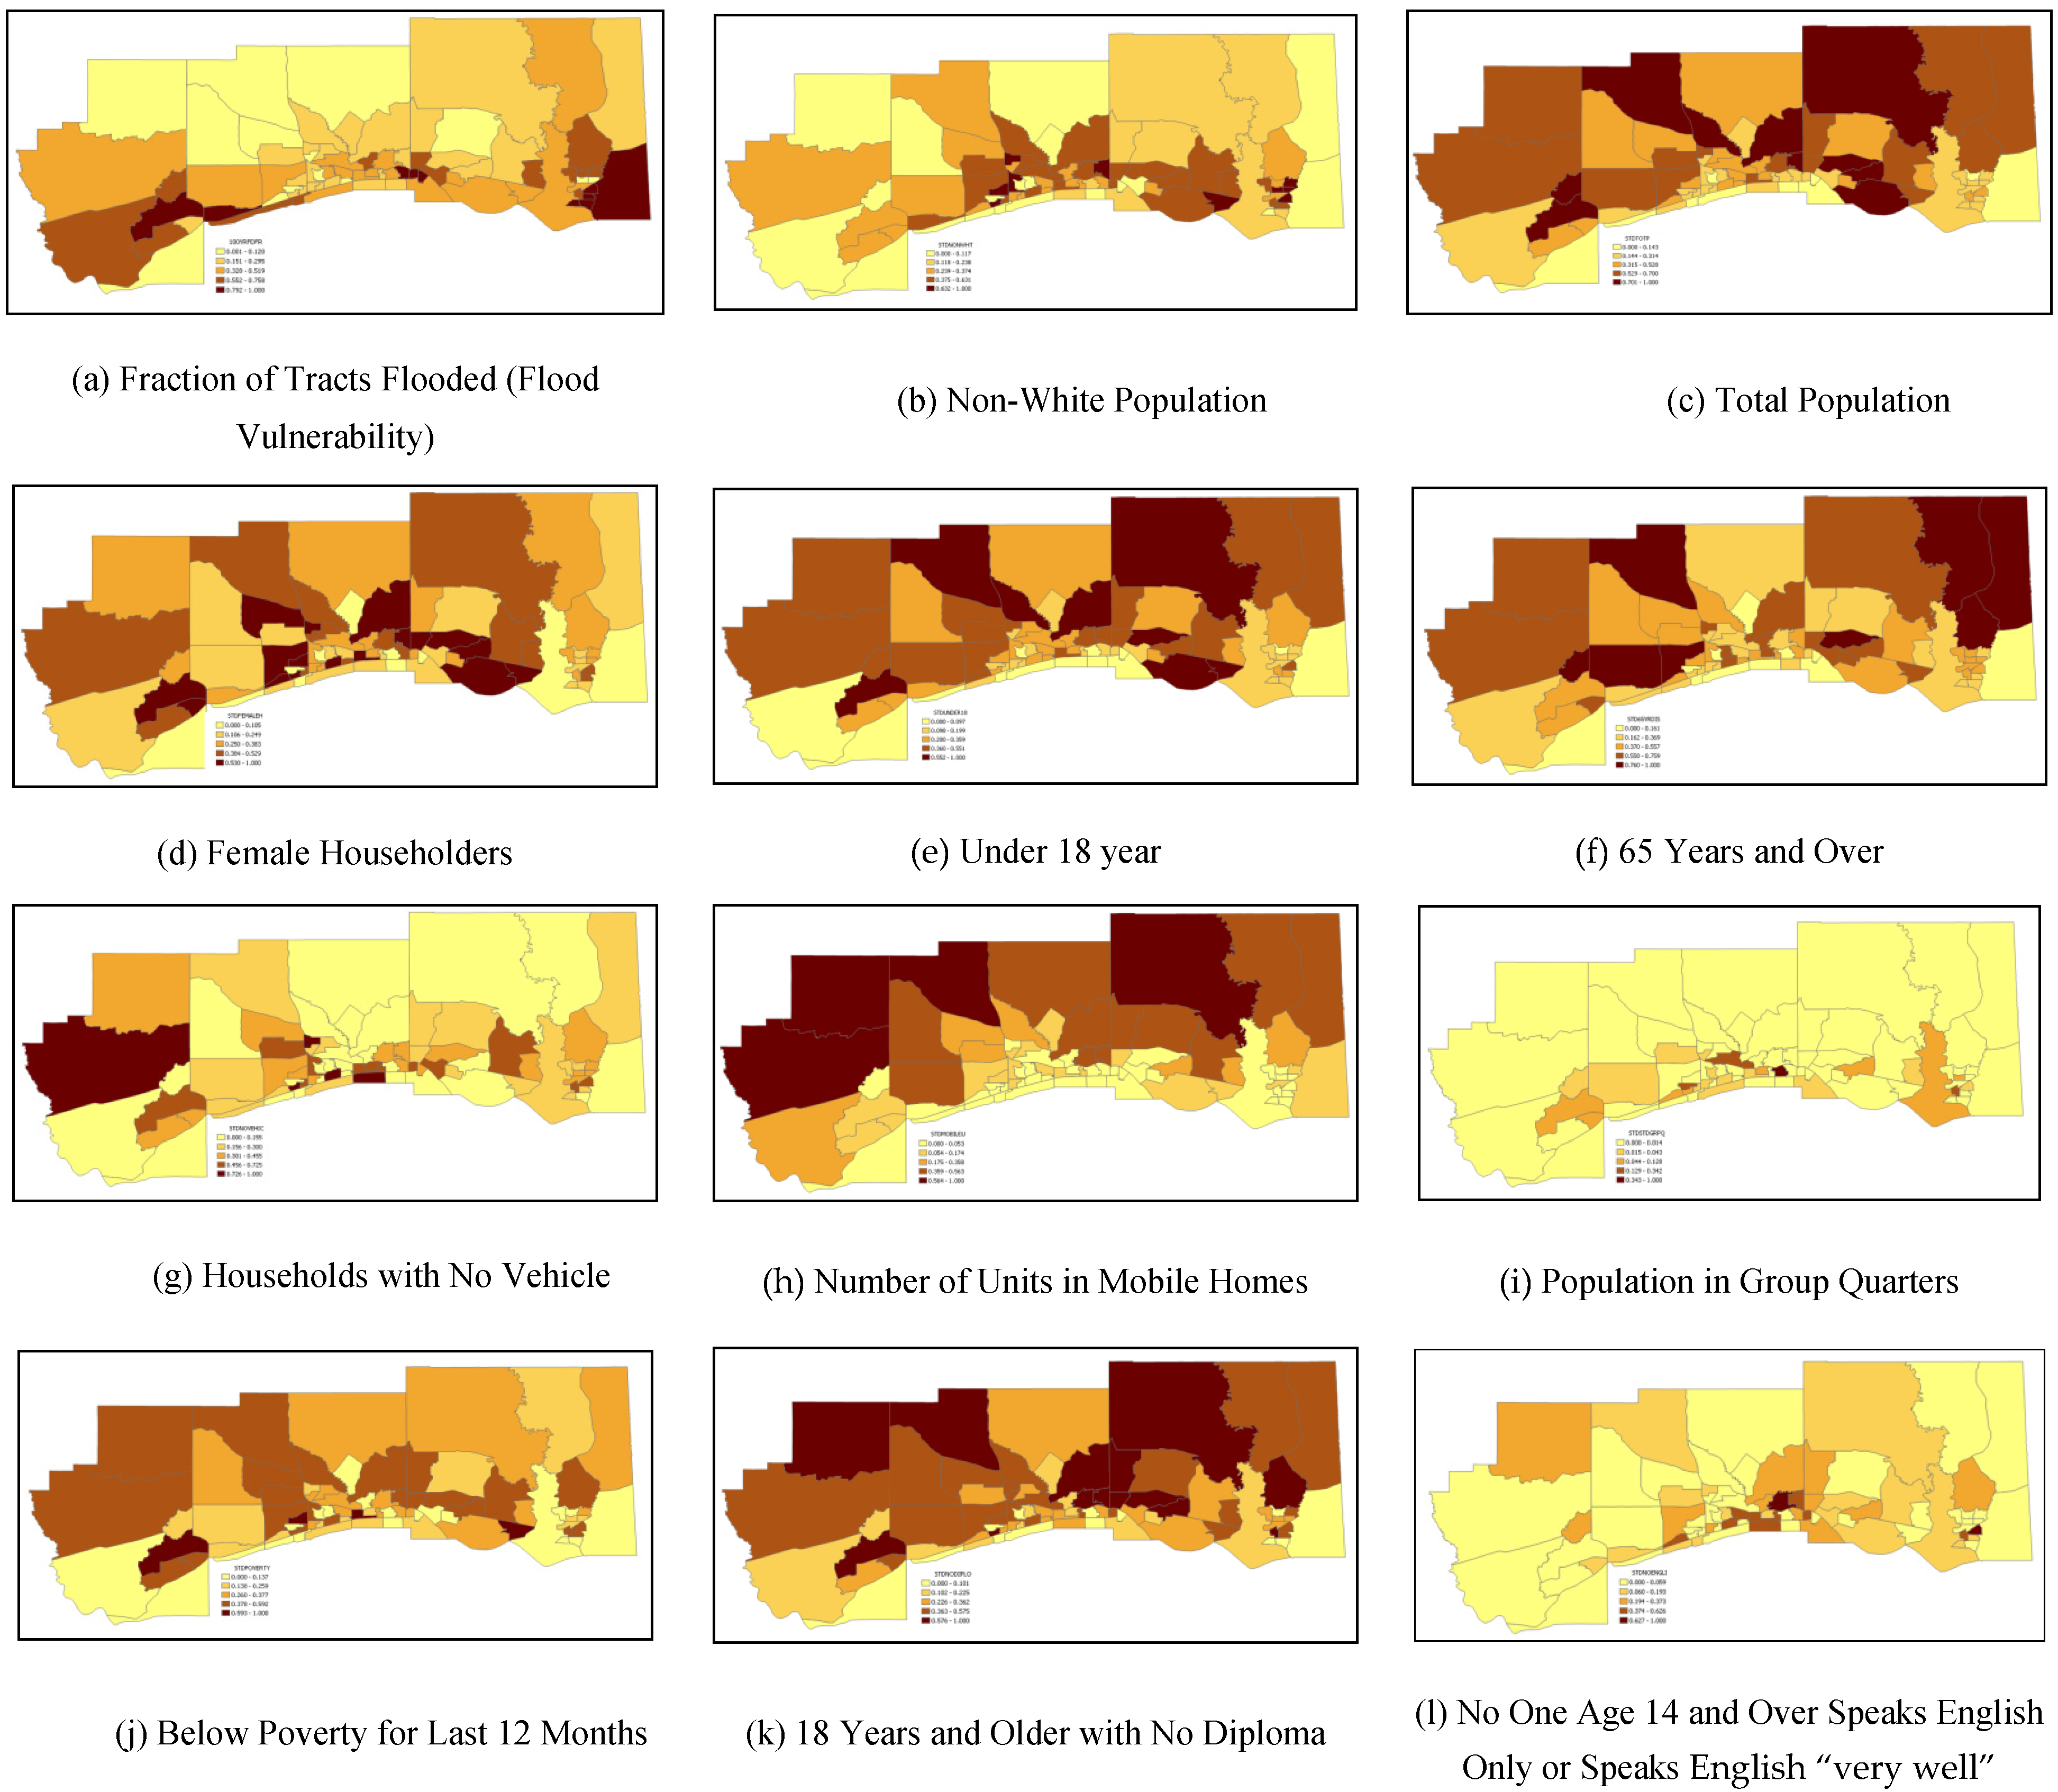
2.2.1. Socioeconomic Vulnerability Indicators
2.2.2. Flood (Climatological) Vulnerability Indicators
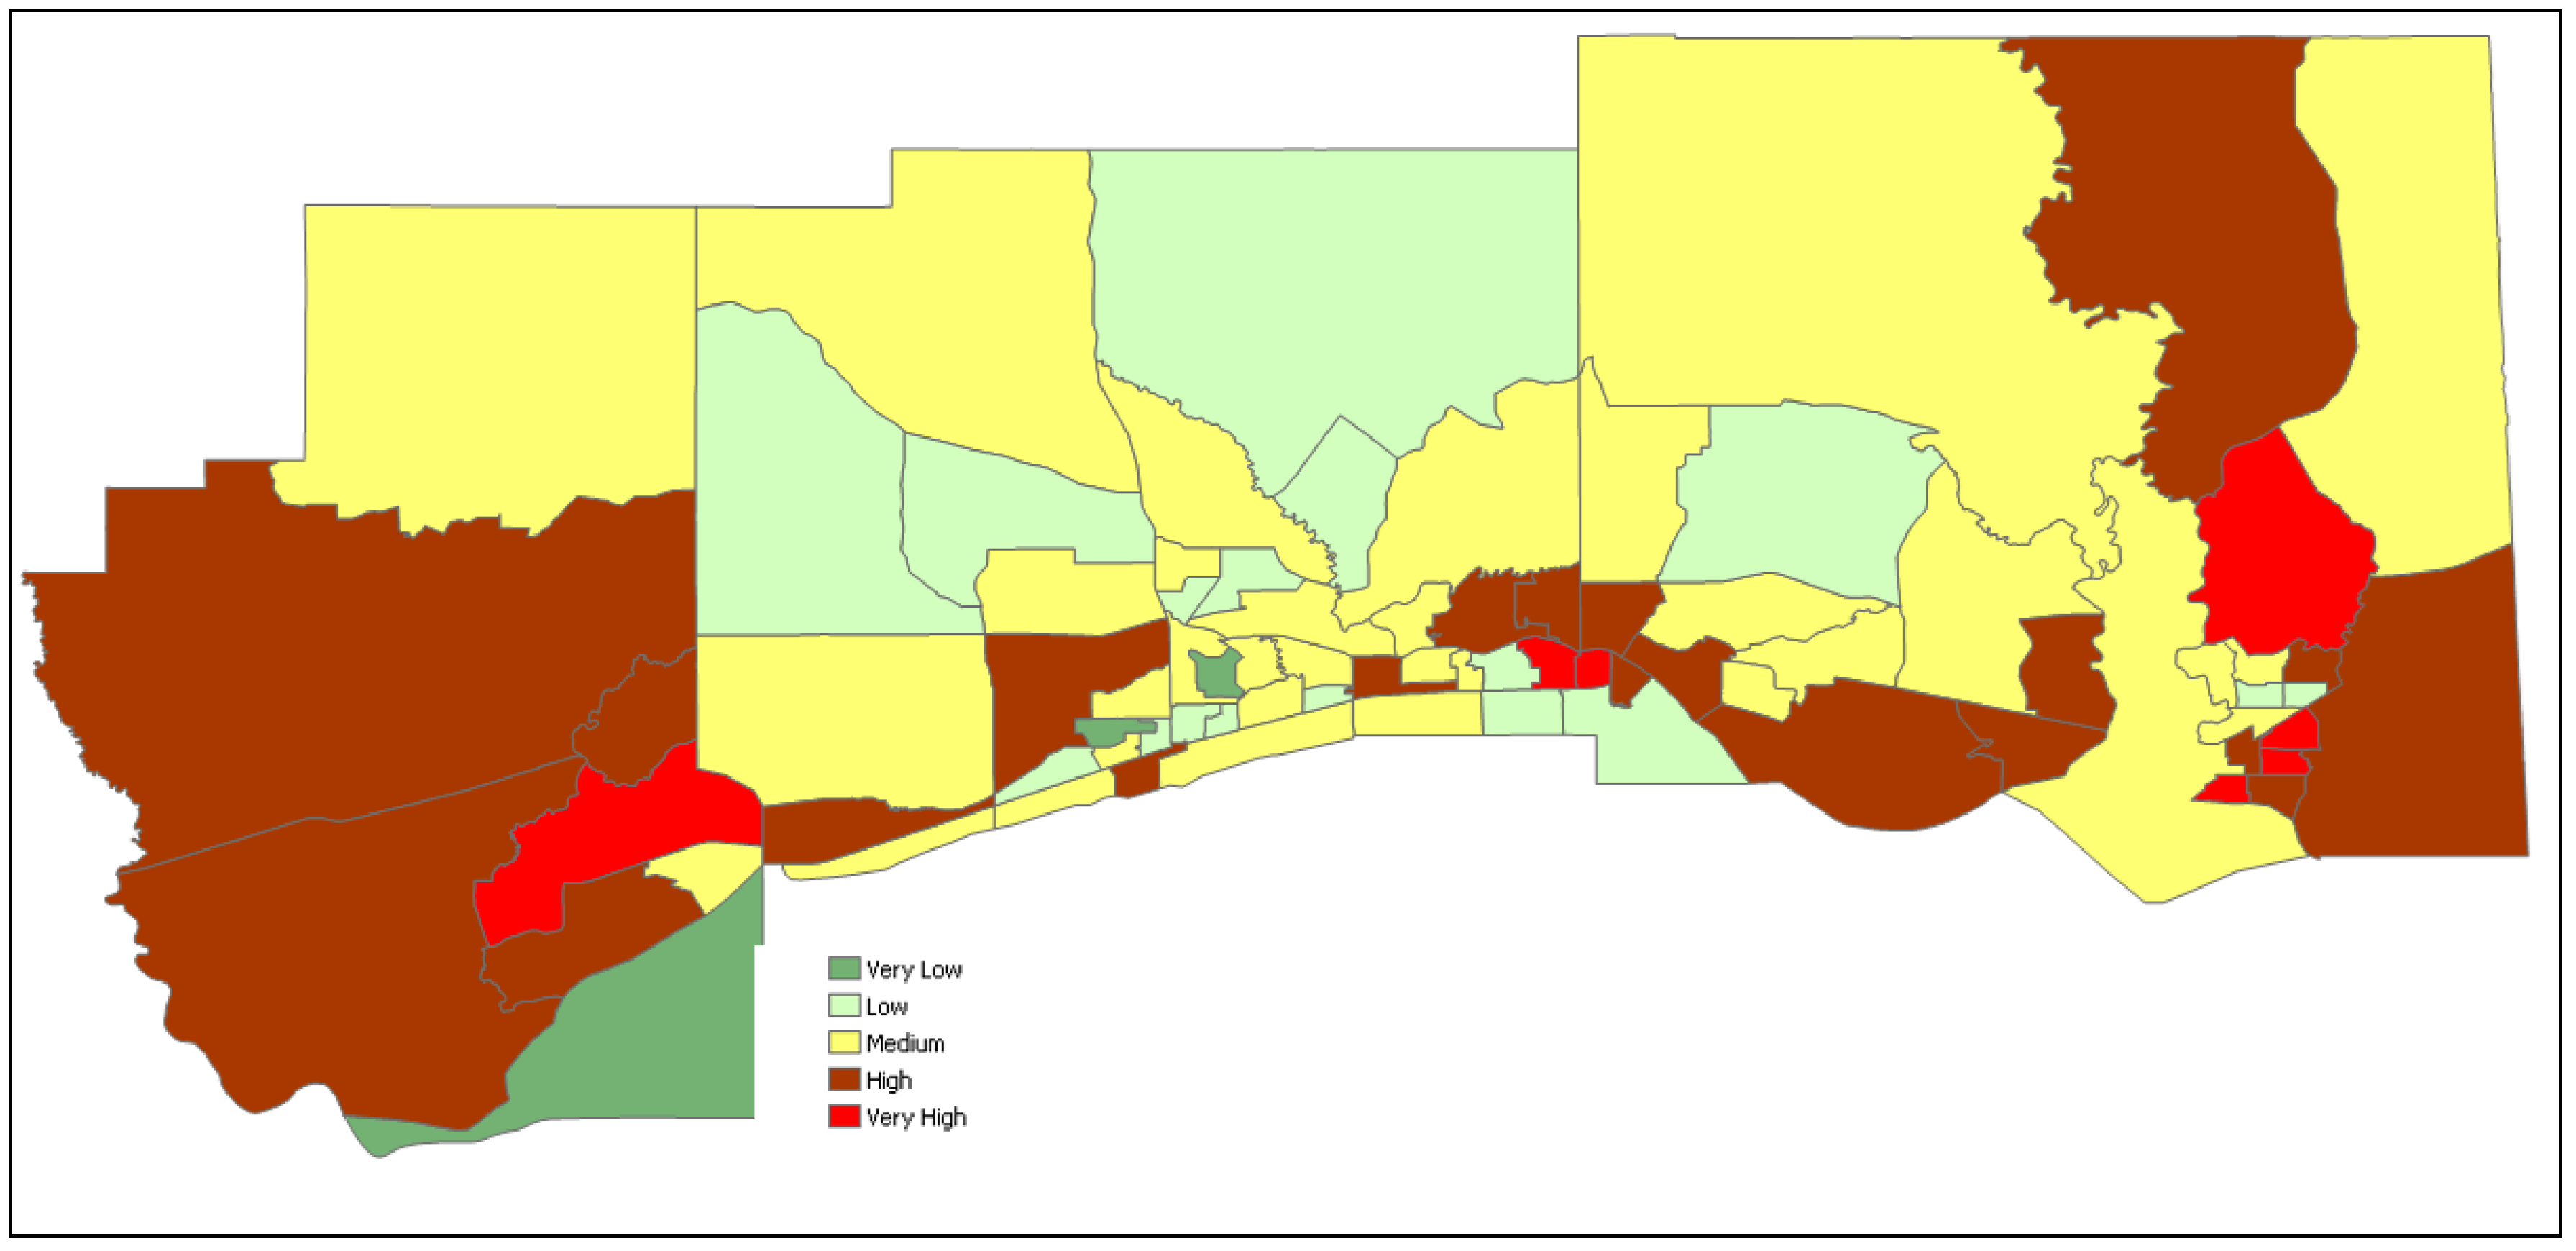
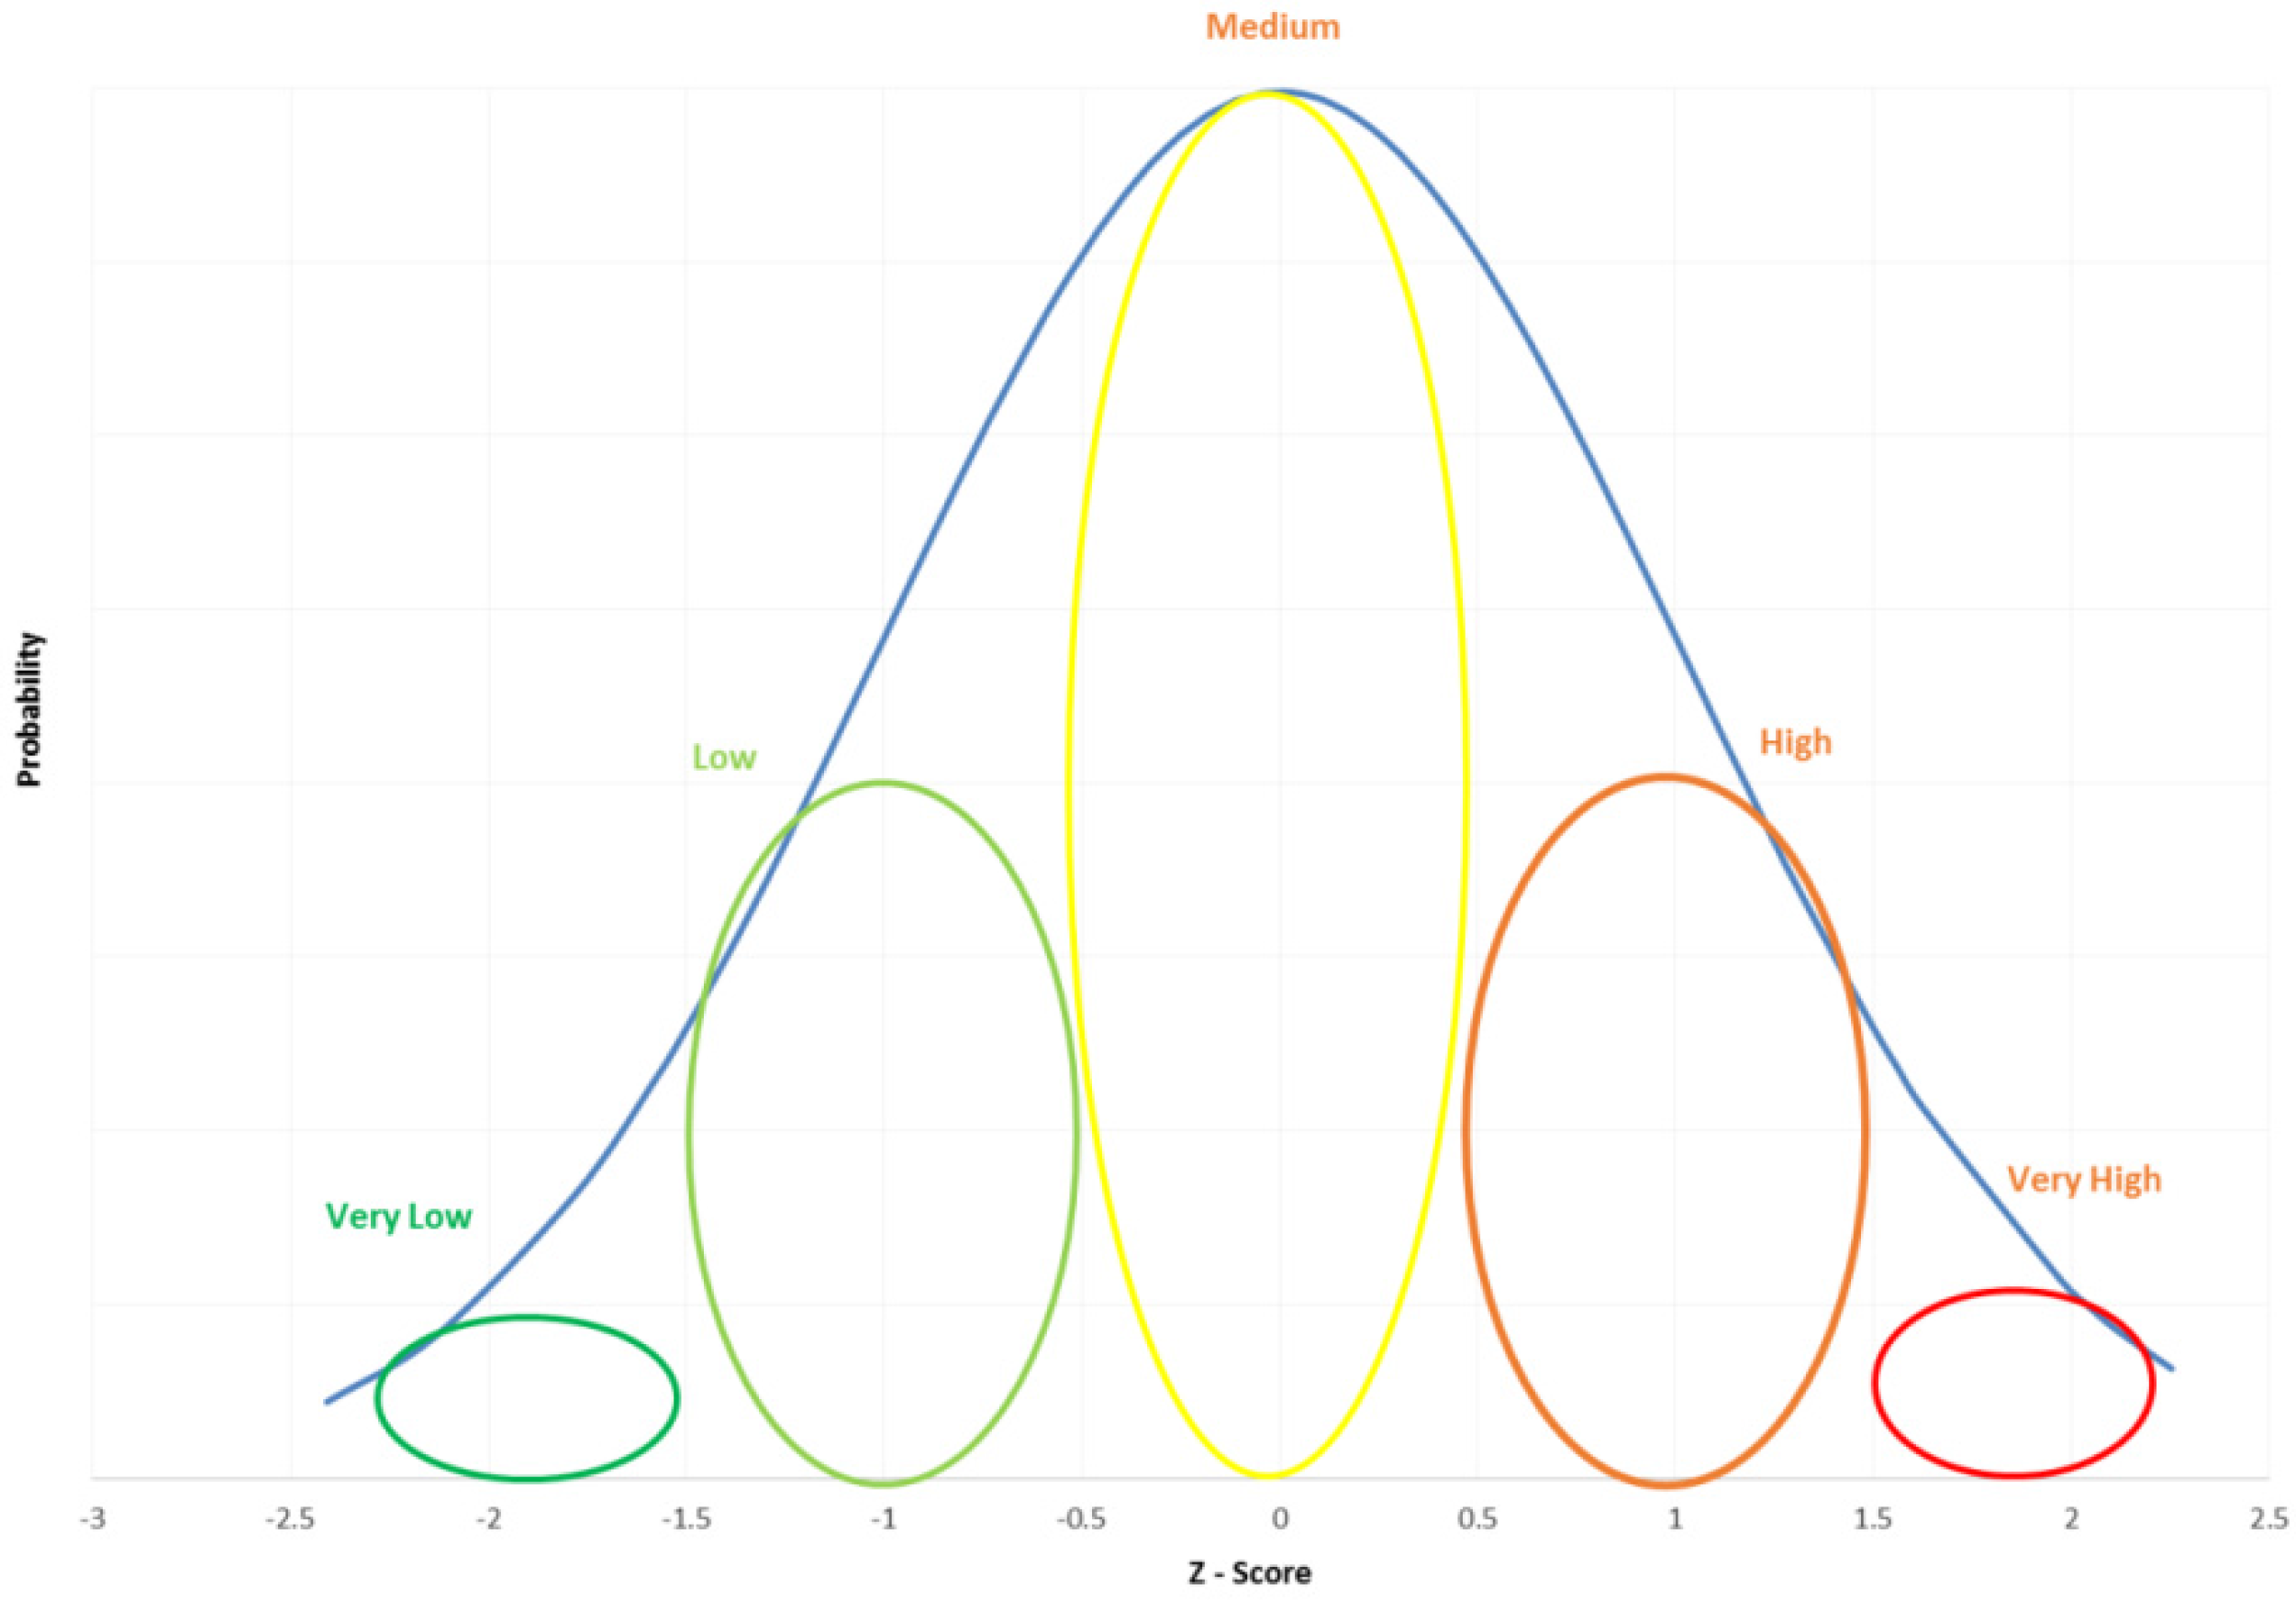
2.2.3. Interactive Vulnerability Mapping
3. Results
4. Conclusions
Acknowledgments
Author Contributions
Conflicts of Interest
References
- Balcia, S.F.; Wright, N.G.; van der Meulen, F. A flood vulnerability index for coastal cities and its use in assessing climate change impacts. Nat. Hazards 2012, 64, 73–105. [Google Scholar]
- NOAA, State of the Coast (2013). Available online: http://stateofthecoast.noaa.gov/population/welcome.html (accessed on 27 October 2015).
- Adeola, F.O.; Picou, J.S. Race, social capital, and the health impacts of Katrina: Evidence from the Louisiana and Mississippi Gulf Coast. Hum. Eco. Rev. 2012, 19, 10–24. [Google Scholar]
- Osofsky, H.J.; Osofsky, J.D.; Hansel, T.C. Deepwater horizon oil spill: Mental health effects on residents in heavily affected areas. Disaster Med. Public Health Prep. 2011, 5, 280–286. [Google Scholar] [CrossRef] [PubMed]
- Morris, J.G.; Grattan, L.M.; Mayer, B.M.; Blackburn, J.K. Psychological responses and resilience of people and communities impacted by the deepwater horizon oil spill. Trans. Am. Clin. Climatol. Assoc. 2013, 124, 191–201. [Google Scholar] [PubMed]
- Grattan, L.M.; Roberts, S.; Mahan, W.T.; McLaughlin, P.K.; Otwell, W.S.; Morris, J.G. The early psychological impacts of the deepwater horizon oil spill on Florida and Alabama communities. Environ. Health Perspect. 2011, 119, 838–843. [Google Scholar] [CrossRef] [PubMed]
- Picou, J.S.; Hudson, K. Hurricane Katrina and mental health: A research note on Mississippi Gulf Coast residents. Sociol. Inq. 2010, 80, 513–524. [Google Scholar] [CrossRef] [PubMed]
- Gamble, B.J.; Hurley, P.A.; Schultz, W.S.; Jaglom, N.K.; Harris, M. Climate change and older Americans: State of the science. Environ. Health Perspect. 2013, 121, 15–22. [Google Scholar] [PubMed]
- Wamsley, T.V.; Collier, Z.A.; Brodie, K.; Dunkin, L.M.; Raff, D.; Rosati, J.D. Guidance for developing coastal vulnerability metrics. J. Coastal Res. 2015, 31, 1521–1530. [Google Scholar] [CrossRef]
- IPCC. Summary for Policymakers. 2007. Available online: https://www.ipcc.ch/pdf/assessment-report/ar4/wg1/ar4-wg1-spm.pdf (accessed on 1 August 2015).
- Lowe, D.; Ebi, K.L.; Forsberg, B. Factors increasing vulnerability to health effects before, during and after floods. Int. J. Environ. Res. Public Health 2013, 10. [Google Scholar] [CrossRef] [PubMed]
- Gornitz, V. Vulnerability of the east coast, USA to future sea level rise. J. Coastal Res. 1990, 9, 201–237. [Google Scholar]
- Klein, R.J.; Nicholls, R.J. Assessment of coastal vulnerability to climate change. Ambio 1999, 28, 2182–2187. [Google Scholar]
- Boruff, B.J.; Emrich, C.; Cutter, S.L. Erosion hazard vulnerability of US coastal counties. J. Coastal Res. 2005, 21, 932–942. [Google Scholar] [CrossRef]
- Nicholls, R.J.; Wong, P.P.; Burkett, V.; Woodroffe, C.D.; Hay, J. Climate change and coastal vulnerability assessment: Scenarios for integrated assessment. Sustain. Sci. 2008, 3, 89–102. [Google Scholar] [CrossRef]
- Jimenez, J.A.; Ciavola, P.; Balouin, Y.; Armaroli, C.; Bosom, E.; Gervais, M. Geomorphic coastal vulnerability to storms in microtidal fetch-limited environments: Application to NW Mediterranean & N Adriatic Seas. J. Coastal Res. 2009, 56, 1641–1645. [Google Scholar]
- McLaughlin, S.; Cooper, A.G. A Multi-scale coastal vulnerability index: A tool for coastal managers? Environ. Hazard. 2010, 9, 233–248. [Google Scholar] [CrossRef]
- Cutter, S.L.; Finch, C. Temporal and spatial changes in social vulnerability to natural hazards. 2008, 105, 2301–2306. [Google Scholar] [CrossRef] [PubMed]
- Cutter, S.L.; Emrich, C.T.; Webb, J.J.; Morath, D. Social Vulnerability to Climate Variability Hazards: A Review of the Literature. Final Report to Oxfam America; Hazards and Vulnerability Research Institute, Department of Geography, University of South Carolina: Columbia, SC, USA, 2009. [Google Scholar]
- Flanagan, B.E.; Gregory, E.W.; Hallisey, E.J.; Heitgerd, J.L. A social vulnerability index for disaster management. J. Homel. Secur. Emerg. Manag. 2011, 8. [Google Scholar] [CrossRef]
- McGuigan, K.; Webster, T.; Collins, K. A flood risk assessment of Lahave River Watershed, Canada using GIS techniques and an unstructured grid combined river-coastal hydrodynamic model. J. Mar. Sci. Eng. 2015, 3, 1093–1116. [Google Scholar] [CrossRef]
- Cooper, H.M.; Chen, Q.; Fletcher, C.H.; Barbee, M.M. Assessing vulnerability due to sea-level rise in Maui, Hawai’i using LiDAR remote sensing and GIS. Clim. Change 2013, 116, 547–563. [Google Scholar] [CrossRef]
- Sowmya, K.; John, C.M.; Shrivastava, N.K. Urban flood vulnerability zoning of Cochin City, southwest coast of India, using remote sensing and GIS. Nat. Hazard. 2015, 75, 1271–1286. [Google Scholar] [CrossRef]
- Kulkarni, A.T.; Mohanty, J.; Eldho, T.I.; Rao, E.P.; Mohan, B.K. A Web GIS based integrated flood assessment modeling tool for coastal urban watersheds. Comput. Geosci. 2014, 64, 7–14. [Google Scholar] [CrossRef]
- Chakraborty, J.; Tobin, G.; Montz, B. Population evacuation: Assessing spatial variability in geophysical risk and social vulnerability to natural hazards. Nat. Hazard. Rev. 2005, 6, 23–33. [Google Scholar] [CrossRef]
- Szlafsztein, C.; Sterr, H. A GIS-based vulnerability assessment of coastal natural hazards, state of Para, Brazil. J. Coastal Conserv. 2007, 11, 53–66. [Google Scholar] [CrossRef]
- Chang, L.F.; Huang, S.L. Assessing urban flooding vulnerability with an emergy approach. Landsc. Urban Plan. 2015, 143, 11–24. [Google Scholar] [CrossRef]
- FEMA. Flood Insurance Study, Hancock County. Mississippi and Incorporated Areas. Number 28045CV001A. 2007. Available online: http://geology.deq.ms.gov/floodmaps/Projects/MapMOD/docs/28045C_FIS_Report.pdf (accessed on 1 August 2015). [Google Scholar]
- FEMA. Flood Insurance Study. Jackson County, Mississippi and Incorporated Areas. Number 28059CV001A. 2007. Available online: http://geology.deq.ms.gov/floodmaps/Projects/MapMOD/docs/28059C_FIS_Report.pdf (accessed on 27 October 2015). [Google Scholar]
- Eamon, C.; Fitzpatrick, P.; Truax, D. Observations of structural damage caused by Hurricane Katrina on the Mississippi Gulf Coast. J. Perform. Constr. Facil. 2007, 21, 117–127. [Google Scholar] [CrossRef]
- Fritz, H.M.; Blount, C.; Sokiloski, R.; Singleton, J.; Funggle, A.; McAdoo, B.G.; Moore, A.; Grass, C.; Tate, B. Hurricane Katrina storm surge distribution and field observation on the Mississippi barrier islands. Estuar. Coast. Shelf Sci. 2007, 74, 12–20. [Google Scholar] [CrossRef]
- American Community Survey. Available online: http://www.census.gov/acs/www/data/data-tables-and-tools/index.php. (accessed on 1 July 2014).
- Lindell, M.K.; Prater, C.S.; Perry, R.W. Fundamentals of Emergency Management. In Hazard, Vulnerability, and Risk; Federal Emergency Management Agency (FEMA), Emergency Management Institute: Emmitsburg, MD, USA, 2006. [Google Scholar]
- Morrow, B.H. Community Resilience: A Social Justice Perspective. Available online: http://www.resilientus.org/wp-content/uploads/2013/03/FINAL_MORROW_9-25-08_1223482348.pdf (accessed on 27 October 2015).
- Bolin, R. Race, class, and disaster vulnerability. In Handbook of Disaster Research; Quarantelli, E.L., Dynes, R., Eds.; Springer: New York, NY, USA, 2006. [Google Scholar]
- Donner, W.R. The political ecology of disaster: An analysis of factors influencing U.S. Tornado fatalities and injuries, 1998–2000. Demography 2007, 44, 669–685. [Google Scholar] [CrossRef] [PubMed]
- Cutter, S.L.; Boruff, B.J.; Shirley, W.L. Social vulnerability to environmental hazards. Soc. Sci. Q. 2003, 84, 242–261. [Google Scholar] [CrossRef]
- Tierney, K. Social inequality: Humans and disasters. In On Risk and Disaster: Lessons from Hurricane Katrina; Daniels, R.J., Keitl, D.F., Kunreuther, H., Eds.; University of Pennsylvania Press: Philadelphia, PA, USA, 2006. [Google Scholar]
- Zoraster, R.M. Vulnerable populations: Hurricane Katrina as a case study. Prehosp. Disaster Med. 2010, 25, 74–78. [Google Scholar] [CrossRef] [PubMed]
- Lane, K.; Charles-Guzman, K.; Wheeler, K.; Abid, Z.; Graber, N.; Matte, T. Health effects of coastal storms and flooding in urban areas: A review and vulnerability assessment. J. Environ. Public Health 2013, 2013. [Google Scholar] [CrossRef] [PubMed]
- Social Vulnerability Analysis: A Comparison of Tools. Institute of Water Resources White Paper 2013. Available online: http://www.iwr.usace.army.mil/Portals/70/docs/iwrreports/Social_Vulnerability_Analysis_Tools.pdf (accessed on 1 July 2014).


| Statistic | Jackson County | Harrison County | Hancock County |
|---|---|---|---|
| Total Population | 139,430 | 188,110 | 44,044 |
| Non-White Population | 37,259 | 54,794 | 5244 |
| Female Population | 70,740 | 94,766 | 22,401 |
| Population < 18 years | 35,338 | 46,078 | 10,423 |
| Population > 65 years with Disability | 7859 | 9476 | 2373 |
| Population Below Poverty | 21,238 | 33,162 | 8572 |
| Average Household Income | 47,266 | 42,060 | 42,028 |
| 1 | Total Population |
| 2 | Non-White Population |
| 3 | Number of Female Households |
| 4 | Population Under 18 Years |
| 5 | Population 65 Years and Older or Disabled |
| 6 | Households with No Vehicle |
| 7 | Housing Units in Mobile Homes |
| 8 | People in Group Quarters |
| 9 | People Below Poverty in Past 12 Months |
| 10 | Population 18 Years and Over with No Diploma |
| 11 | No One Age 14 and Over Speaks English Only or Speaks English “very well”; |
© 2016 by the authors; licensee MDPI, Basel, Switzerland. This article is an open access article distributed under the terms and conditions of the Creative Commons by Attribution (CC-BY) license (http://creativecommons.org/licenses/by/4.0/).
Share and Cite
Bathi, J.R.; Das, H.S. Vulnerability of Coastal Communities from Storm Surge and Flood Disasters. Int. J. Environ. Res. Public Health 2016, 13, 239. https://0-doi-org.brum.beds.ac.uk/10.3390/ijerph13020239
Bathi JR, Das HS. Vulnerability of Coastal Communities from Storm Surge and Flood Disasters. International Journal of Environmental Research and Public Health. 2016; 13(2):239. https://0-doi-org.brum.beds.ac.uk/10.3390/ijerph13020239
Chicago/Turabian StyleBathi, Jejal Reddy, and Himangshu S. Das. 2016. "Vulnerability of Coastal Communities from Storm Surge and Flood Disasters" International Journal of Environmental Research and Public Health 13, no. 2: 239. https://0-doi-org.brum.beds.ac.uk/10.3390/ijerph13020239