Article

Increased Eating Frequency Is Associated with Lower Obesity Risk, But Higher Energy Intake in Adults: A Meta-Analysis

1
Department of Nutrition and Food Hygiene, School of Public Health, Wuhan University, 185 East Lake Road, Wuhan 430071, China
2
Department of Epidemiology and Biostatistics, School of Public Health, Wuhan University, 185 East Lake Road, Wuhan 430071, China
3
Department of Nutrition, University of Tennessee at Knoxville, 1215 West Cumberland Avenue, Knoxville, TN 37996, USA
*
Author to whom correspondence should be addressed.
Int. J. Environ. Res. Public Health 2016, 13(6), 603; https://0-doi-org.brum.beds.ac.uk/10.3390/ijerph13060603
Submission received: 21 April 2016 / Revised: 9 June 2016 / Accepted: 14 June 2016 / Published: 17 June 2016

Abstract

:
Body weight is regulated by energy intake which occurs several times a day in humans. In this meta-analysis, we evaluated whether eating frequency (EF) is associated with obesity risk and energy intake in adults without any dietary restriction. Experimental and observational studies published before July 2015 were selected through English-language literature searches in several databases. These studies reported the association between EF and obesity risk (odd ratios, ORs) in adults who were not in dietary restriction. R software was used to perform statistical analyses. Ten cross-sectional studies, consisting of 65,742 participants, were included in this analysis. ORs were considered as effect size for the analysis about the effect of EF on obesity risk. Results showed that the increase of EF was associated with 0.83 time lower odds of obesity (i.e., OR = 0.83, 95% confidence intervals (CI) 0.70–0.99, p = 0.040). Analysis about the effect of EF on differences in participants’ energy intake revealed that increased EF was associated with higher energy intake (β = 125.36, 95% CI 21.76–228.97, p = 0.017). We conclude that increased EF may lead to lower obesity risk but higher energy intake. Clinical trials are warranted to confirm these results and to assess the clinical practice applicability.

Graphical Abstract

1. Introduction

Prevalence of overweight and obesity, which are established risk factors for non-communicable diseases such as cardiovascular diseases, diabetes, and certain cancers, has dramatically increased around the world since 1980. In 2014, 39% and 13% of adults (above 20 years old) were overweight and obese worldwide, respectively [1]. Fortunately, evidence shows that obesity can be prevented by changing potential causes such as dietary behavior and physical activity [2].
The fundamental cause of obesity is an energy imbalance between energy intake (EI) and energy expenditure (EE). Weight gain indicates that the balance has tipped towards increased EI or reduced EE or a combination of both [3]. In humans, when EI exceeds EE by 11 kcal per day, a one pound weight gain will occur over the course of a year [4]. It has been indicated that ingestive behaviors such as choice of foods, time to consume a meal, as well as meal size and function of gastrointestinal system influence EI [5]. For example, EE can drop when there is an increase of sedentary behavior and elevated use of vehicles, which are associated with a decrease of physical activity. Recently, there have been a number of studies investigating the effect of changing dietary behaviors on EI, which is one of goals of the present study.
One of the modifiable dietary behaviors is eating frequency (EF). Commonly, an eating occasion is defined as any instance in which participants reported consumption of solid meals and snacks, with a minimum gap of 15 min between two eating episodes [6]. However, definition of eating occasion can be different, depending on different research. Currently, the relationship between EF and EI is controversial. Animal experiments found that increased EF was associated with higher EI in mice [7], which was in line with observation in human [8]. However, Speechly et al. reported that increased EF improved appetite control and subsequently reduced EI in obese males [9]. Interestingly, it has been suggested that increased EF had minimal effect on appetite and EI but reduced EF showed negative impact on appetite and EI based on controlled feeding studies in humans [10].
Despite conclusion about the association between EF and EI is far from consistent, it is plausible that EF may influence at least one side of energy balance and thus affects body weight. Previous evidence from animal studies suggested that the effect of EF on energy balance and body composition was not obvious in rats during caloric restriction [11]. This provided implications for the research on the relationship between EF and body weight without food restriction. Verbaeys et al. found that without caloric restriction on a daily basis, rats fed ad libitum gained weight faster than three-time schedule-fed rats [12]. For humans, the mainstream opinion is that increased EF is associated with a healthier body weight status in both children and adults [13,14,15]. Since Fabry et al. pointed out this inverse relationship in the 1960s [16], numerous cross-sectional studies had been carried out and similar results had been obtained. Recently, Kaisari et al. have shown that increased EF was associated with lower obesity risk in children and adolescents, especially in boys [17]. Similarly, Schoenfeld et al. suggested a potential benefit of higher EF for body weight status during weight loss, although the positive findings were produced by a single study [18]. However, several studies demonstrated null [19,20] or positive relationship [21,22,23] between EF and body weight. Duval et al. suggested that after correcting the effect of physical activity EE, the association between EF and obesity was no longer significant [24]. The present study aims to evaluate whether EF is associated with obesity risk and EI in adults without caloric restriction by conducting a meta-analysis of published original observational studies.

2. Methods

This meta-analysis was carried out in accordance with the Preferred Reporting Items for Systematic Reviews and Meta-Analyses (PRISMA) statement [25].

2.1. Search Strategy

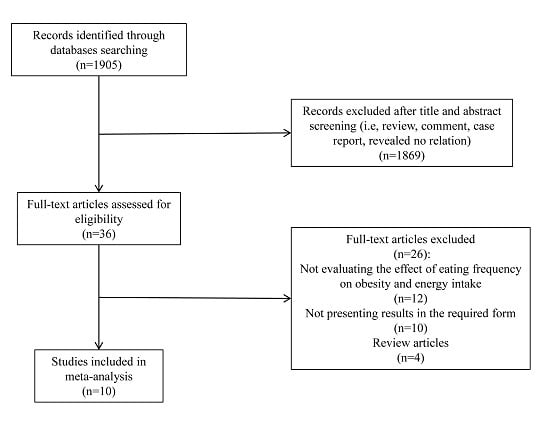
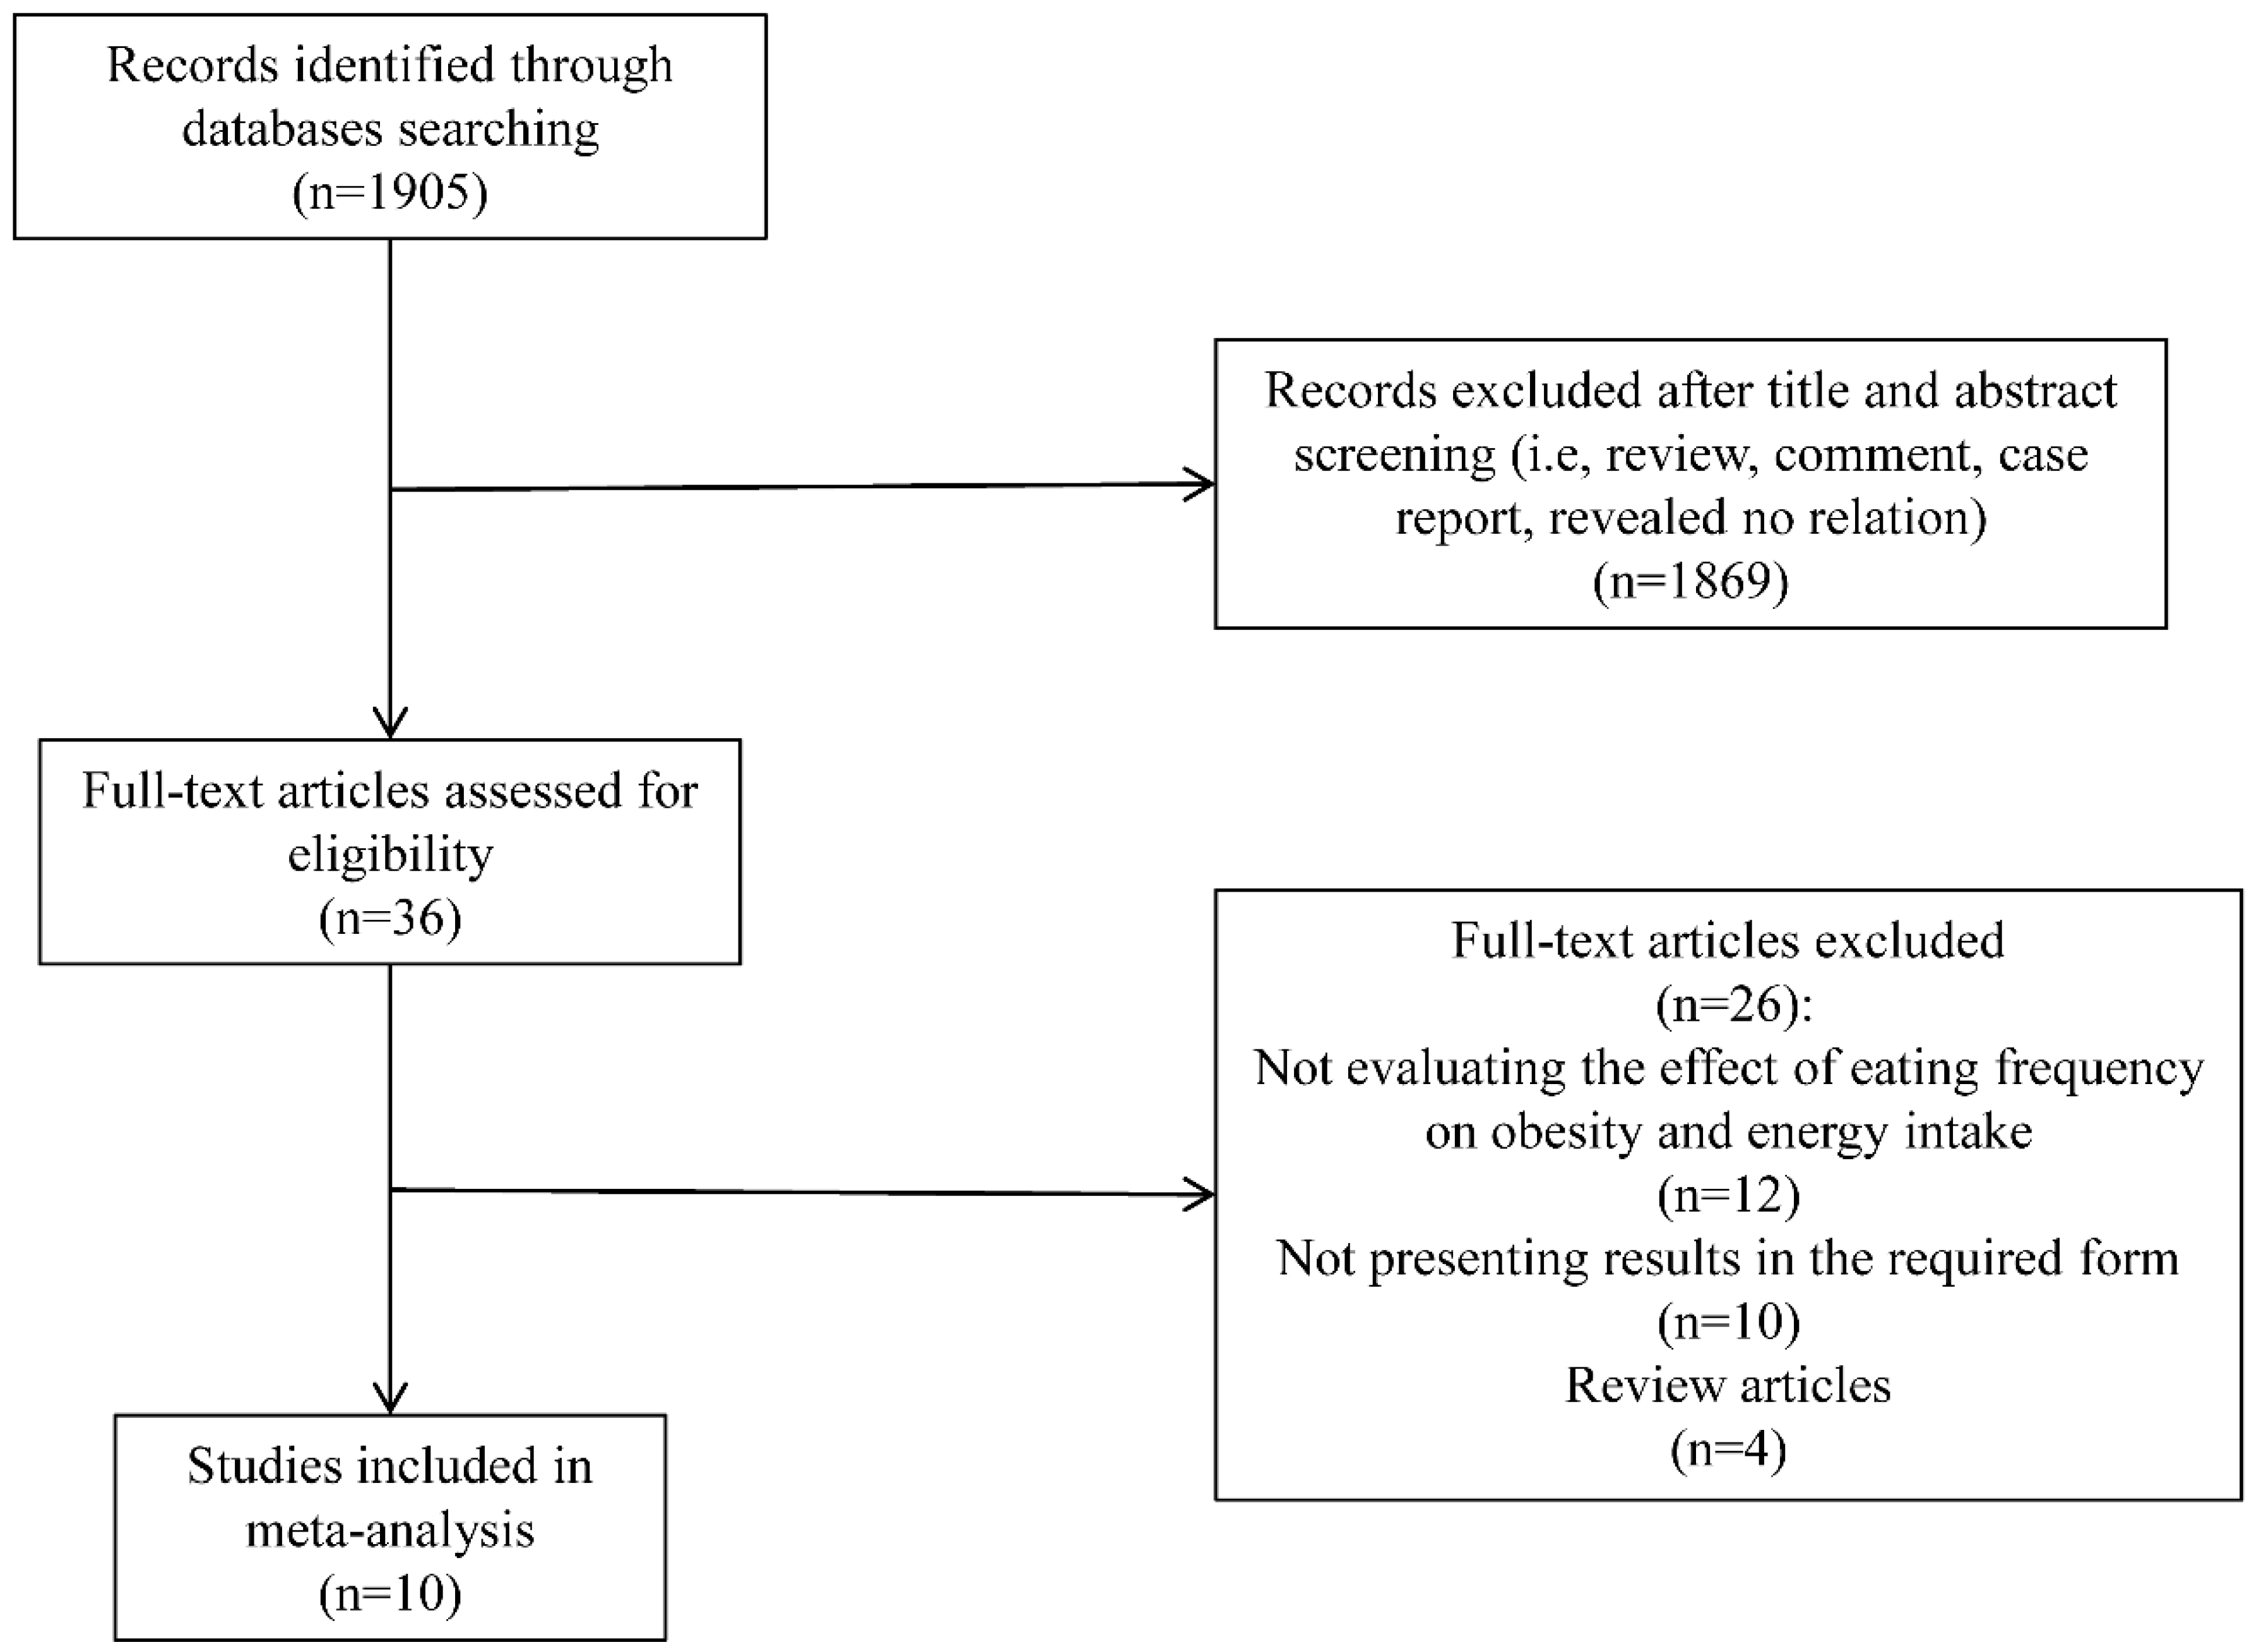
Original research and observational studies (including those identified via review articles) published before July 2015, examining the association between EF and obesity in adults who were not during weight loss, were selected through English-language literature searches in the PubMed, Elsevier Science Direct, Nature, Science Online and Embase databases. Combinations of at least two of the following key words were used as search terms: meal frequency, feeding frequency, EF, eating patterns, eating behaviors, body composition, weight, body mass index (BMI), obesity and EI. In addition, the reference lists of the eligible retrieved articles were used to identify relevant articles that were not extracted through the searching procedure. Abstracts from conferences, reviews, and unpublished dissertations or theses were excluded from analysis. To reduce the potential for selection bias, each study was independently evaluated by 2 of the investigators (Yue-Qiao Wang and Yi-Wen Zhang), and a mutual decision was made jointly as to whether or not it met the basic inclusion criteria. The disagreements were solved by the opinion of the third author (Fei Zhang), and consensus was reached by discussion.

2.2. Inclusion Criteria

Studies were included if they met the following criteria: (1) original research or observational studies published in an English-language refereed journal; (2) all of the selected studies were conducted in adults; (3) participants or subjects were not during weight loss and diet control; (4) participants or subjects did not have psychological and eating disorders; (5) no experience of bariatric surgery; (6) non-pregnancy; (7) the independent variable was EF; (8) the dependent variable was risk of obesity or EI; (9) results were provided in a form that could be used for the present analysis (point estimates of odd ratios (OR) with 95% confidence intervals (CI) or the differences in the mean values of the EI among EF categories and standard errors (SEs) available).

2.3. Data Extraction

The following information was extracted from each included study: first author’s last name; year of publication; country of origin; sample size; age and gender of participants, and the number of daily meals/eating episodes; effect size measurements; 95% CIs; SEs or SDs; the evaluation of EF and EI; the definition of a meal/eating episode and variables that entered into the multivariable model as potential confounding factors. Information and data was extracted by one author (Yue-Qiao Wang) and checked by another (Yun-Quan Zhang). Quality of studies was not assessed because the total number of studies was limited.

2.4. Quality Assessment

Individual study quality was assessed using a score modified from the Agency for Healthcare Research and Quality (AHRQ) Cross-Sectional Study Quality Assessment [26]. For each study, the appropriateness in dealing with eleven items was checked as follows: (1) define the source of information; (2) list inclusion and exclusion criteria for exposed and unexposed subjects or refer to previous publications; (3) indicate time period used for identifying patients; (4) indicate whether or not subjects were consecutive if not population-based; (5) indicate if evaluators of subjective components of study were masked to other aspects of the status of participants; (6) describe any assessments undertaken for quality assurance purposes; (7) explain any patient exclusions from analysis; (8) describe how confounding was assessed and/or controlled; (9) if applicable, explain how missing data were handled in the analysis; (10) summarize patient response rates and completeness of data collection; (11) clarify what follow-up, if any, was expected and the percentage of patients for which incomplete data or follow-up was obtained. For item 5, a score of 1 was assigned when answer was no, and for other items, a score of 1 was assigned when answer was yes.

2.5. Statistical Analysis

For studies investigating the relationship between EF and obesity risk, the effect size was presented as ORs and their corresponding 95% CIs. The lowest category was considered as reference group. If the original study used the highest category as reference, reciprocal of original ORs was calculated for analysis. Single comparison between one EF category versus the reference constituted the units of the meta-analysis. When more than one comparisons of different EF categories were included in the same study, an overall estimate for the study was calculated from ORs using the fixed-effect model [27]. For example, if the EF categories included ≤3; 4–5 and ≥6 and EF ≤ 3 was considered as reference group, we used fixed-effect model to combine ORs of other two groups as overall estimate.
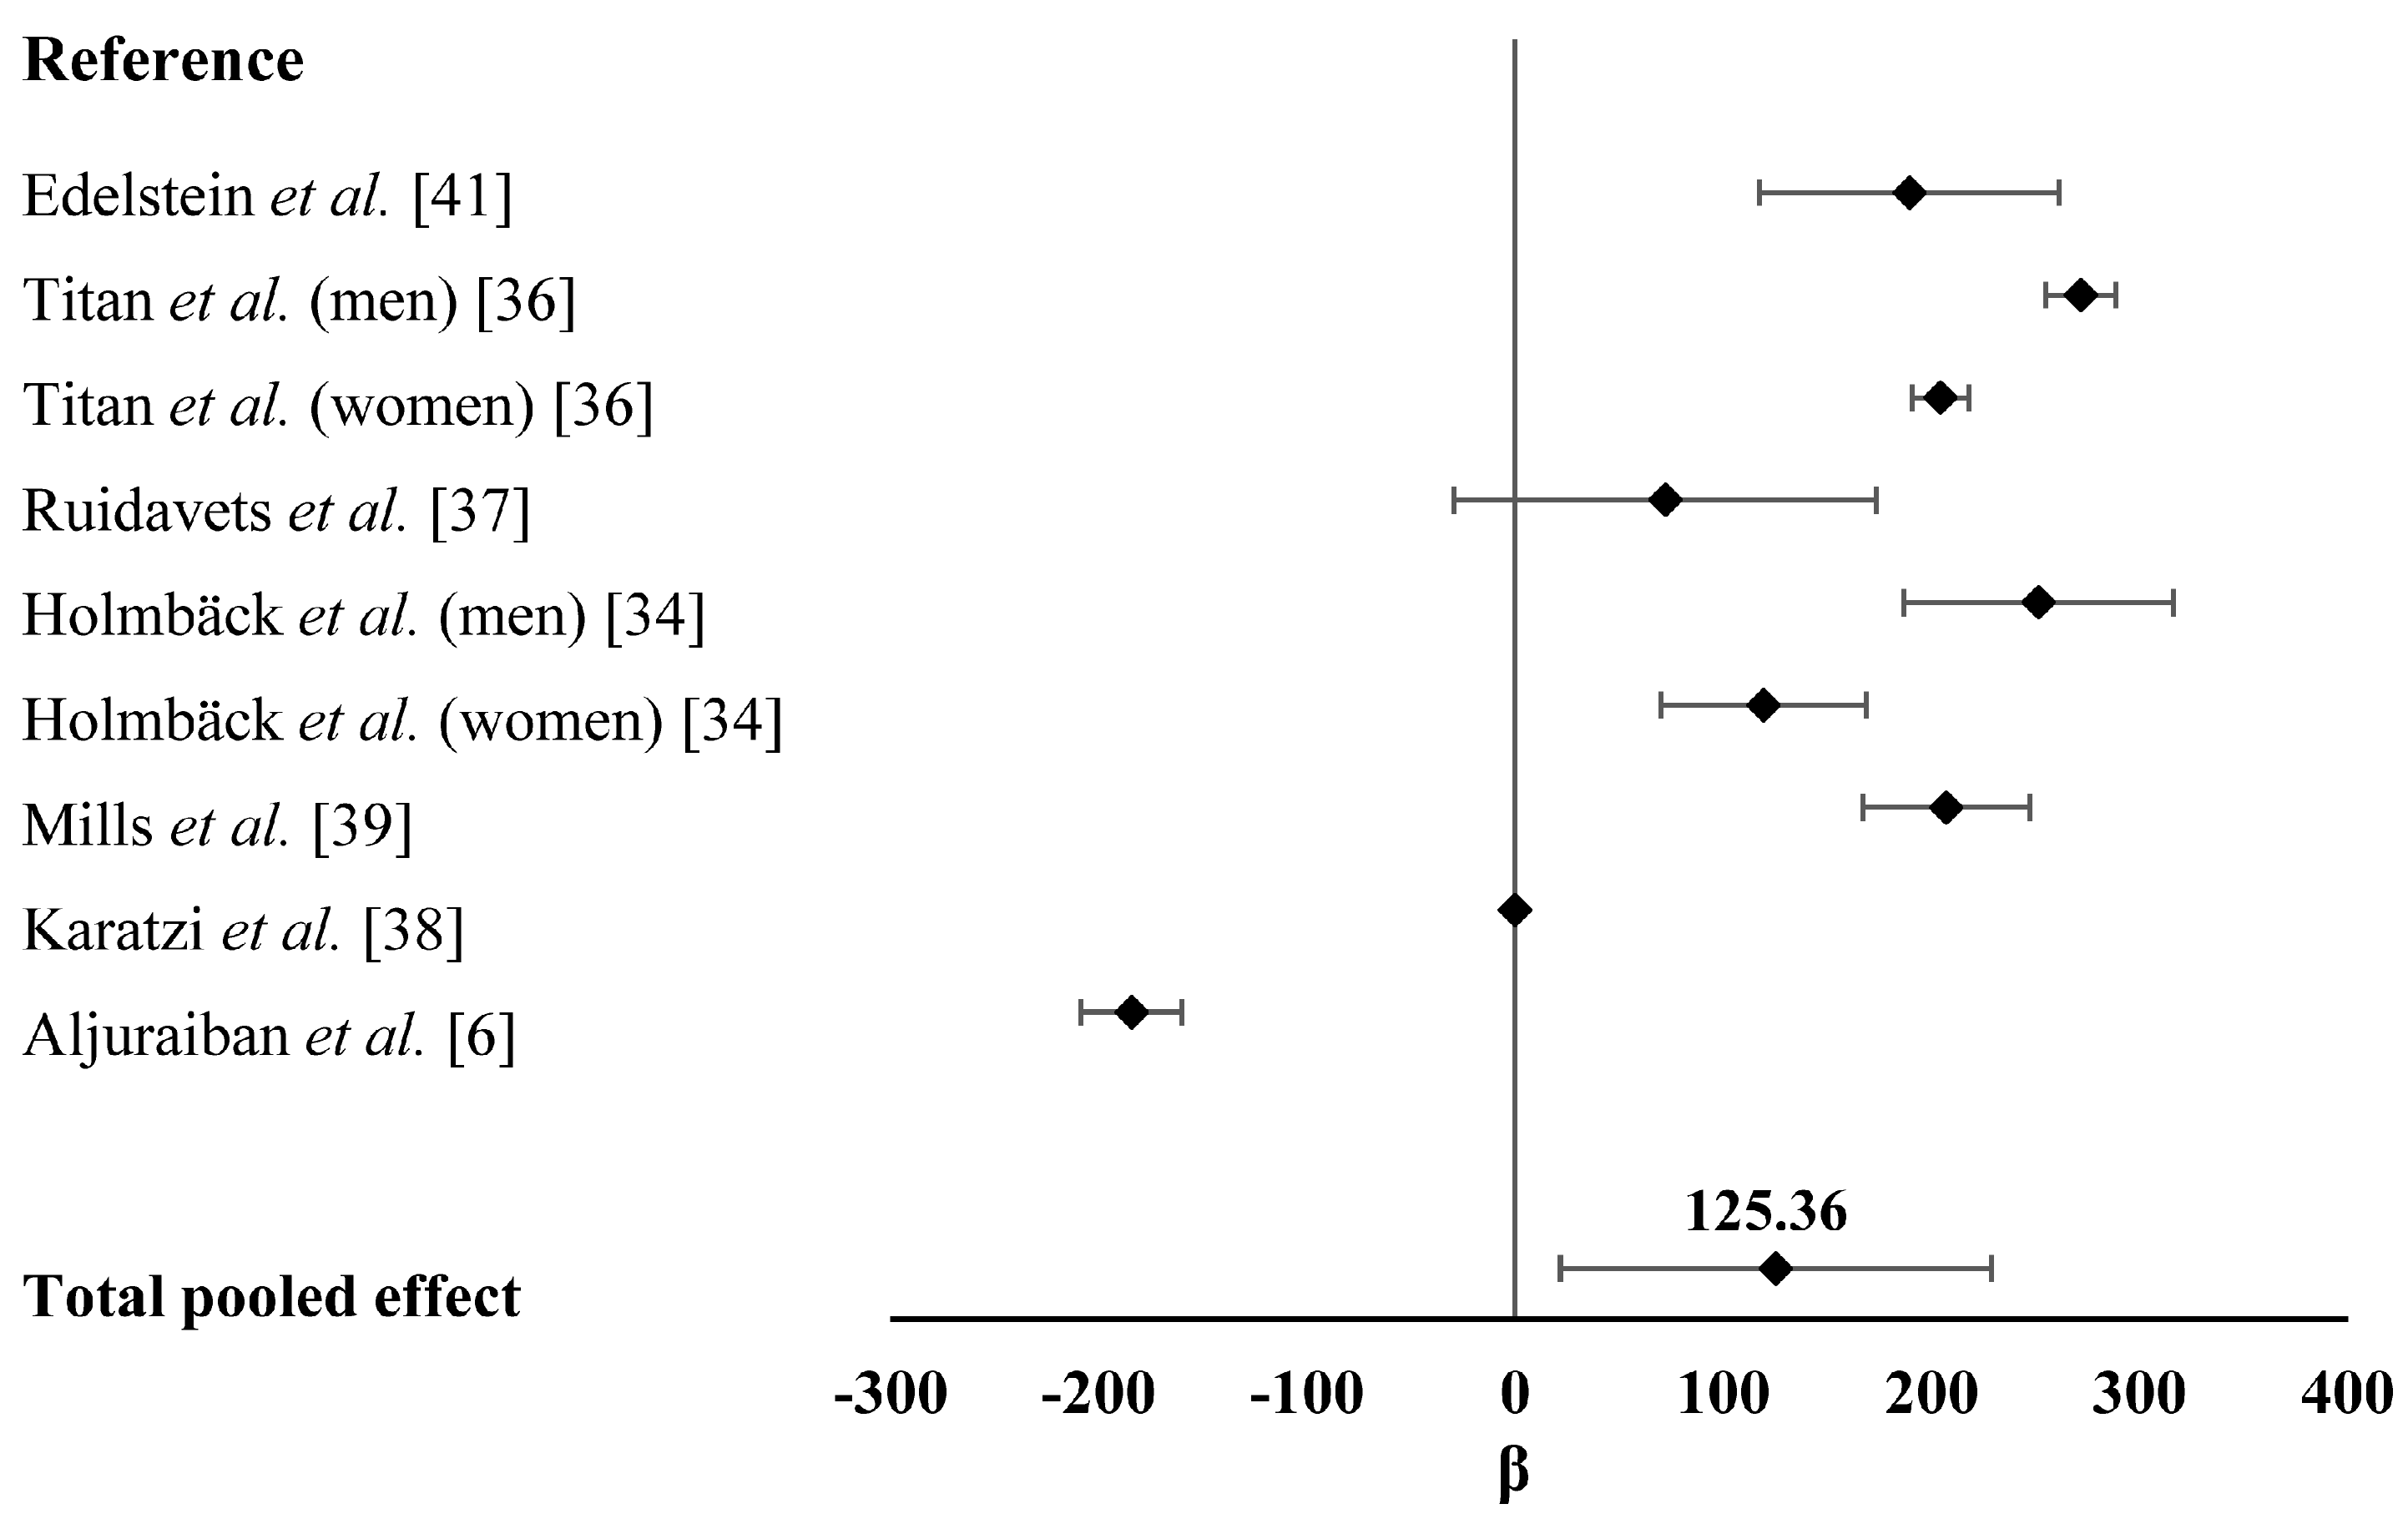
For studies investigating the relationship between EF and EI, the effect size was shown as the differences of EI among categories and their corresponding SEs. If the study reported EI in kilojoule or megajoule, we unified the unit as Kcal. In each study, we calculated the differences of EI among categories. For example, if the EF categories included ≤3; 4–5 and ≥6, we calculated the differences of EI between each two groups as well as their corresponding SEs, and computed the overall estimate from the difference of EI using the fixed-effect model. If SEs or SDs were not reported, SEs were computed from 95% CI following a standard methodology [27].
If a paper reported the results of different multivariate models, the most stringently controlled estimate were extracted. Statistical heterogeneity that was attributed to studies rather than to chance was assessed by visual inspection of forest plots as well as using Cochran’s Q and I2, and evaluated by performing the χ2 test (assessing the p value) [28]. If the p value was less than 0.10 and I2 exceeded 50%, indicating the presence of heterogeneity, a random-effects model (the DerSimonian and Laird method) was used [29]; otherwise, the fixed-effects model (the Mantel–Haenszel method) was used [
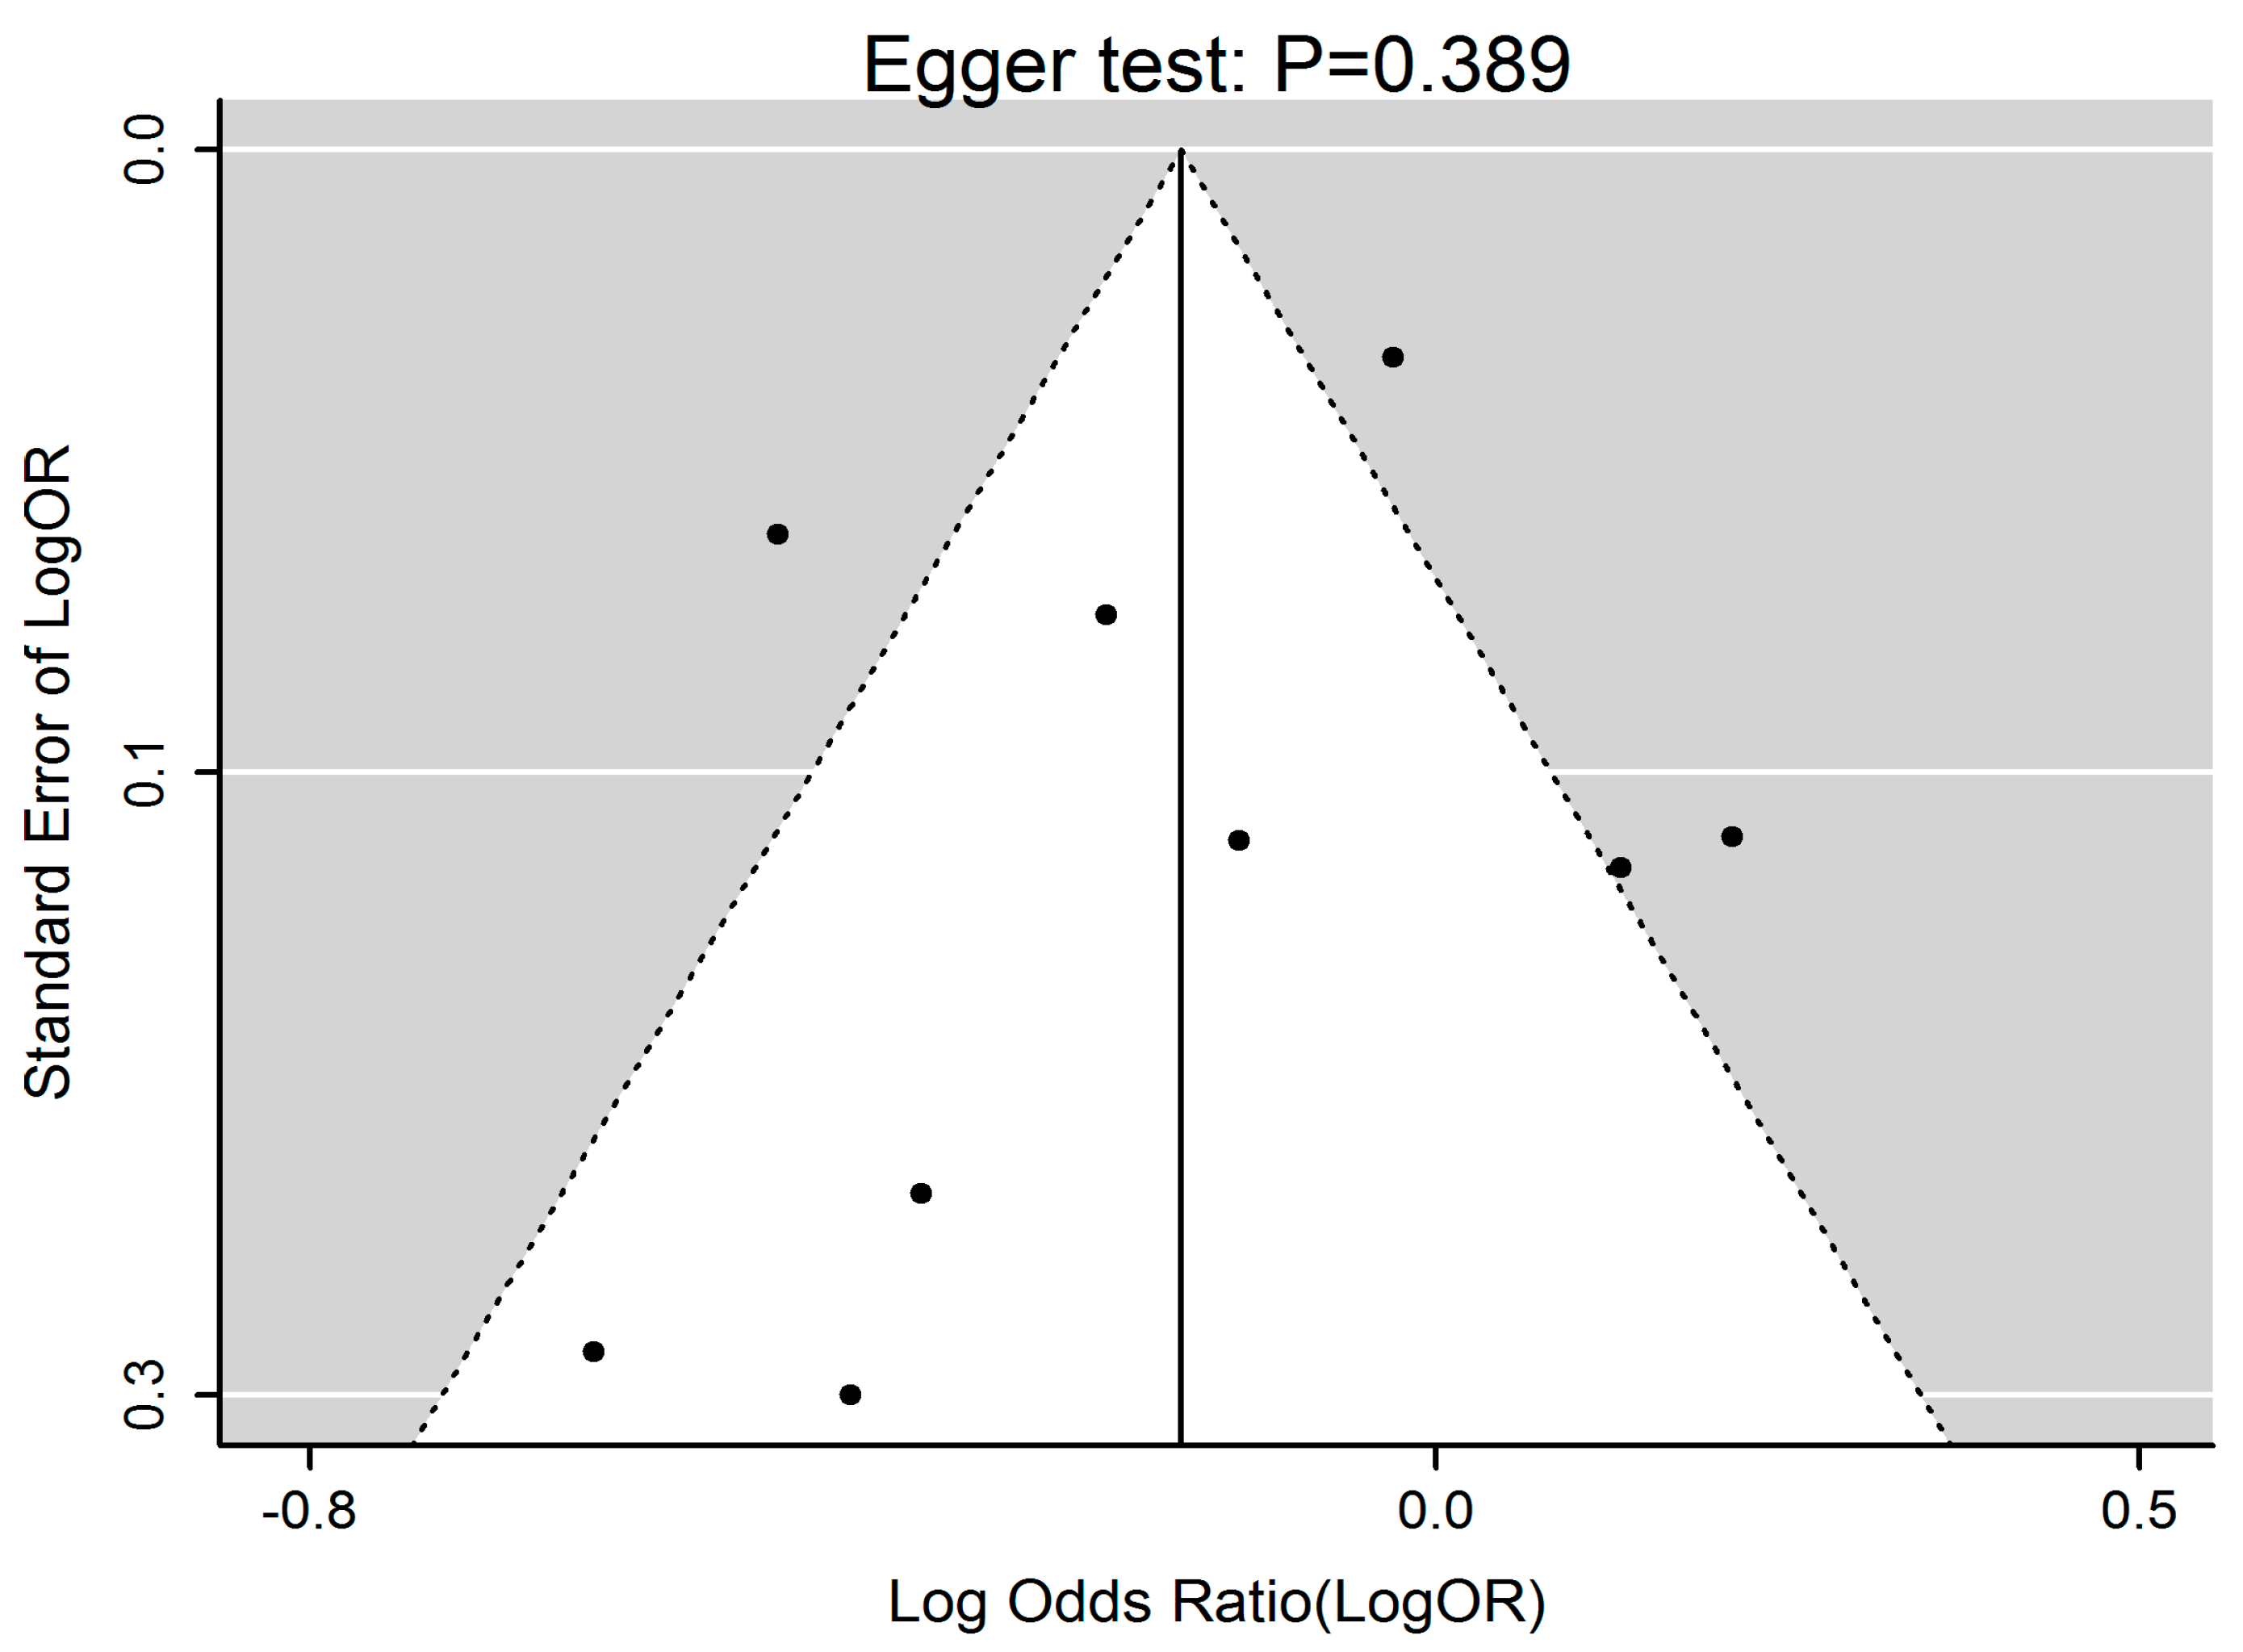
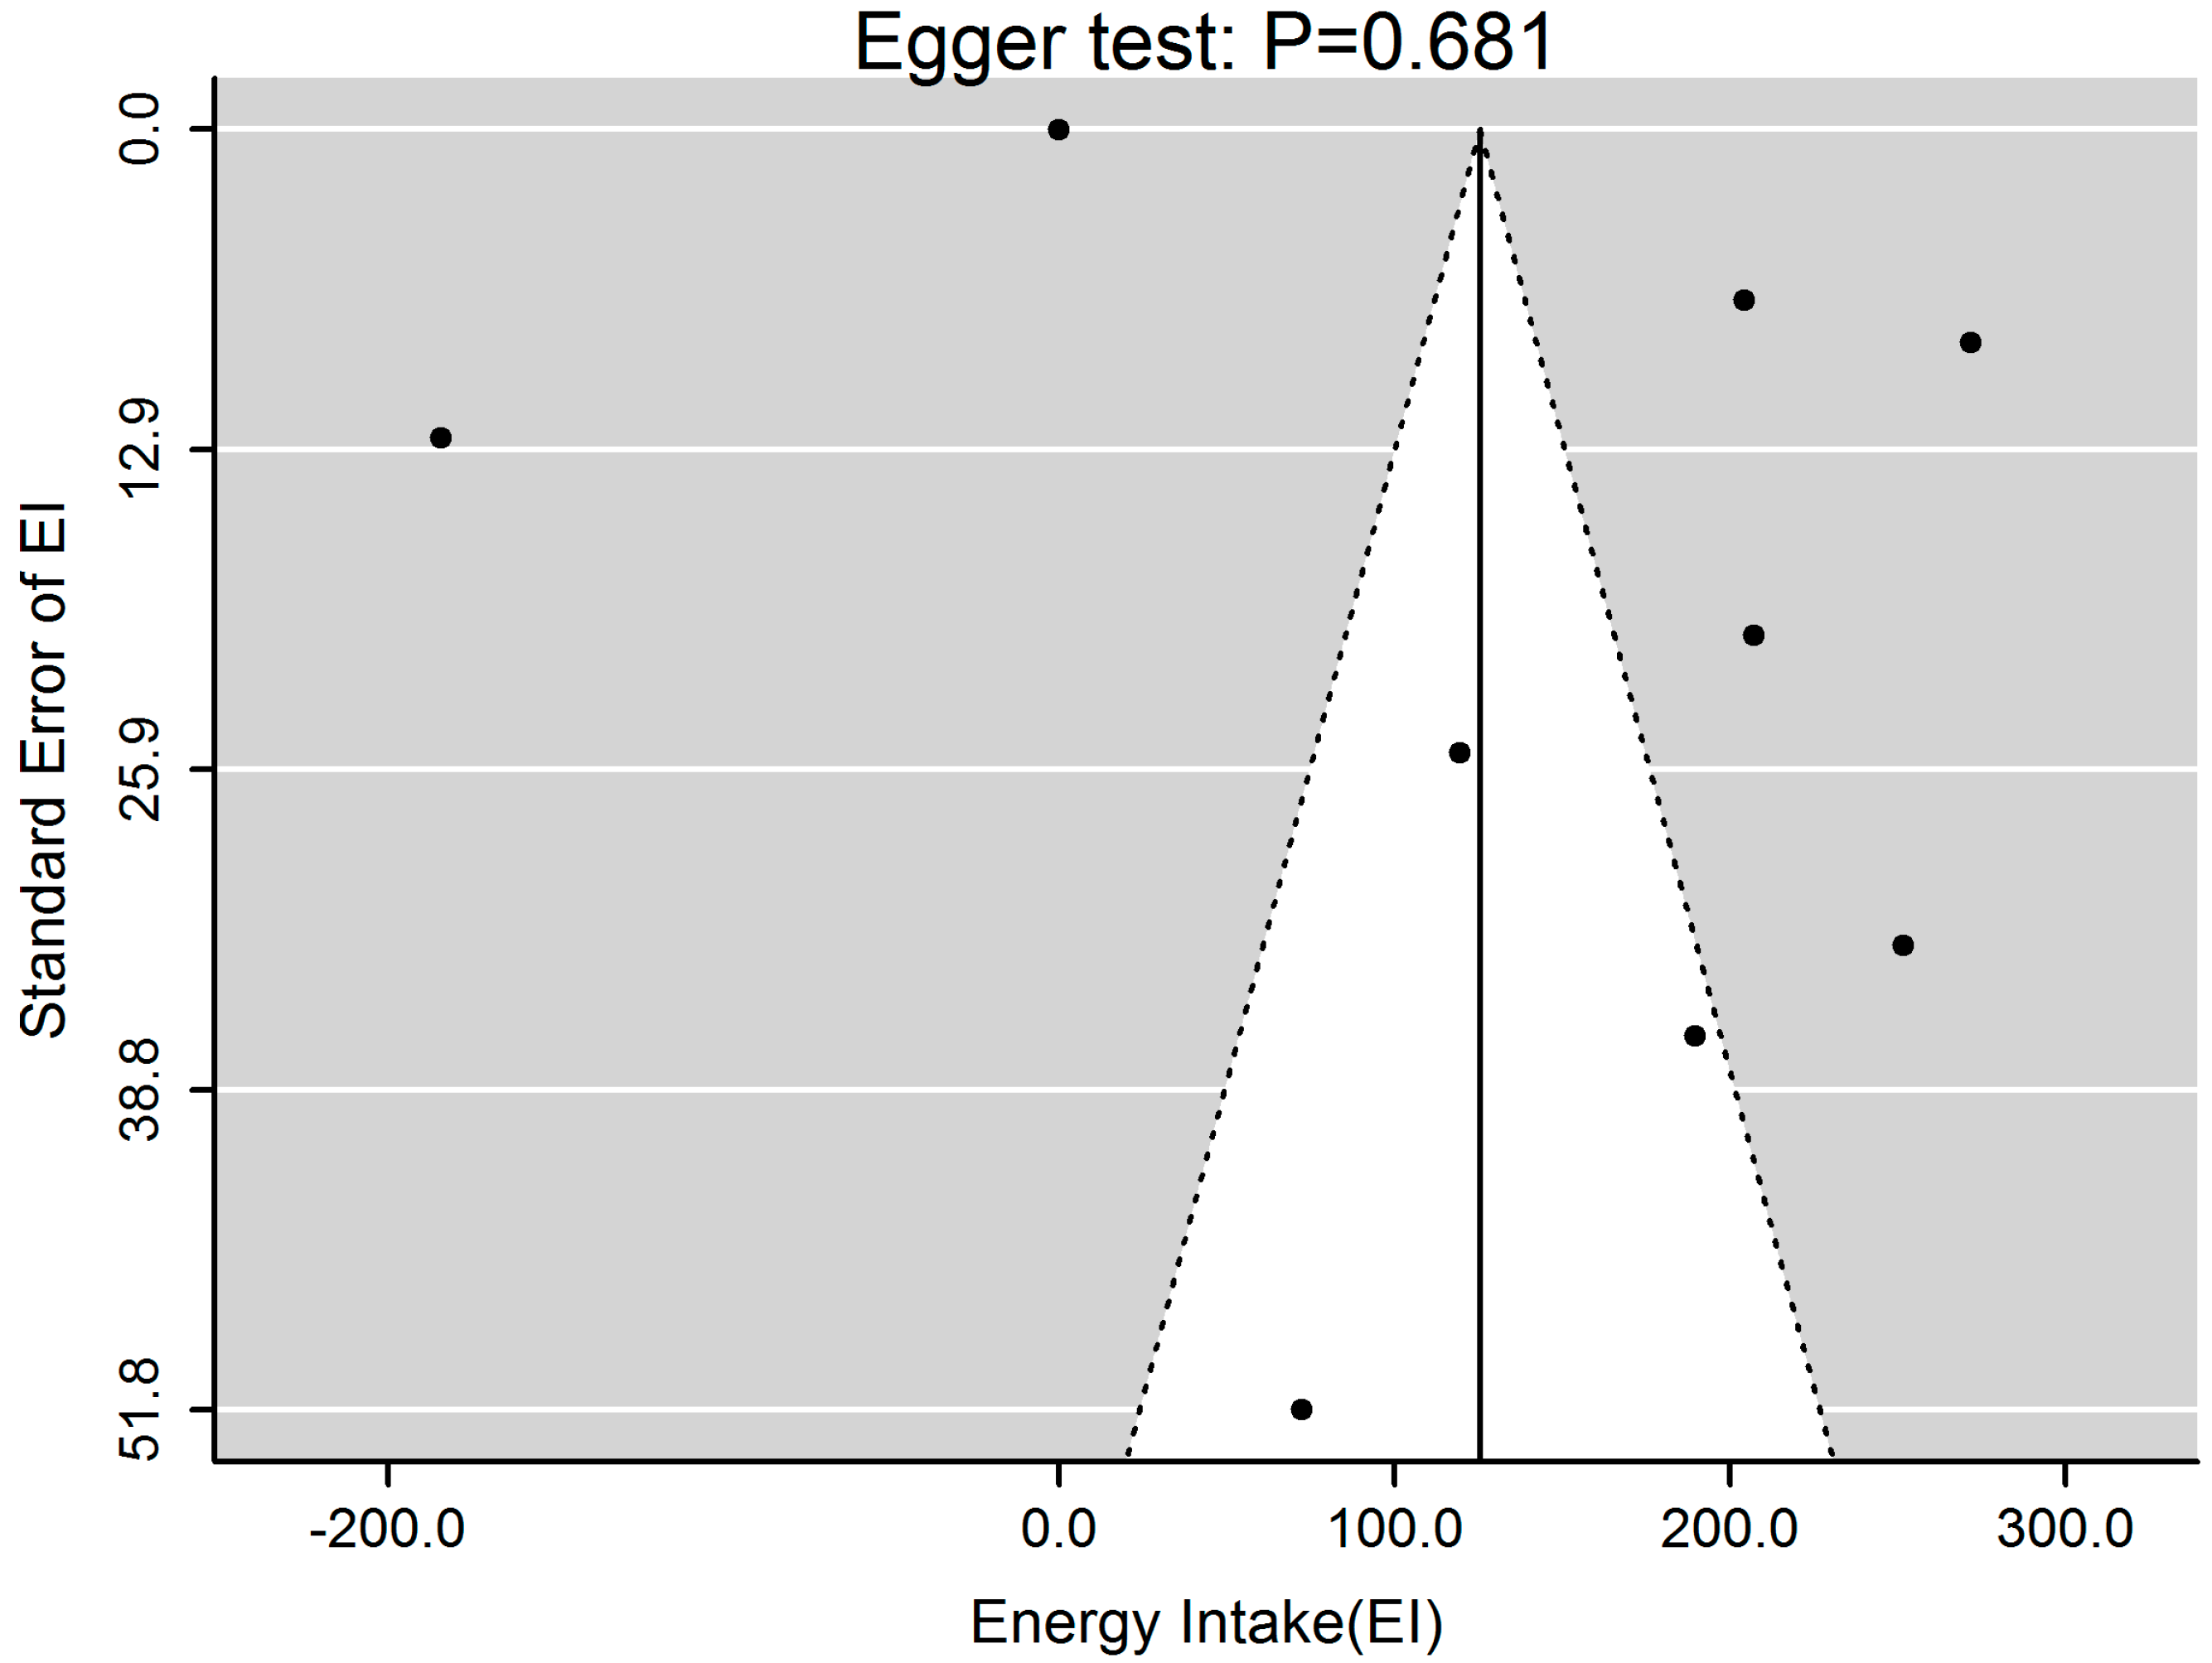
30]. The presence of publication bias was carried out by visual inspection of asymmetric plots, and tested with the Egger linear regression method of asymmetry [31,32,33]. All statistical calculations were performed in R software (R Foundation for Statistical Computing, Vienna, Austria).

3. Results

3.1. Study Selection

Figure 1 shows the results from the literature search and study-selection procedure. A total of 1905 studies were evaluated based on the search criteria. Ten cross-sectional studies that investigated the relationship between EF and obesity risk were identified according to the criteria. No new eligible study was yielded after a manual search of references cited in these articles. Among these 10 studies, five investigated the relationship between EF and obesity risk, and their results were presented as ORs and 95% CIs. Two studies separated results by gender [34,35] and one of these two [34] also separated results by overweight and obesity. Thus, a total of nine sub-studies were included while OR was considered as effect size. In addition, seven out of 10 selected studies investigated the relationship between EF and EI. The results were shown as the differences in the mean values of EI among EF categories.

3.2. Study Characteristics

Detailed characteristics of selected studies were presented in Table 1, and results of data extraction were shown in Table 2 and Table 3. For analysis of the association between EF and obesity risk, two studies took the highest EF category as reference group, thus we presented the reciprocal of reported ORs as original ORs in the present study. Also, these two studies had more than one comparisons, we therefore computed combined ORs using the fixed-effect model. [34,35]. For analysis of the association between EF and EI, the unit of EI in three studies was transformed to Kcal [34,36,37] and SE of one study was calculated from 95% CI [38]. All included studies had more than one comparison and we used fixed-effect model to perform the analyses. The overall working sample consisted of 65,742 participants aging from 20 to 89 years old. Ethnically, the subjects in the majority of these studies were Caucasian. No race-related difference was reported in two studies [39,40] involving different races. With regard to the geographical distribution, four studies included Mediterranean populations (Spain, Greece, and Sweden), three included American populations, two included West European populations (France and UK) and one was a cross-continent study (UK and USA). All included studies’ quality score was above 10.
In order to evaluate participants’ dietary behavior, five studies collected data by self-reported questionnaires [34,35,36,41,42], three by food records [37,38,39], and two by 24-h dietary recalls [6,40]. Participants’ weight and height were measured by trained technicians in all selected studies except the one conducted by Mills et al. [39]. To compute total EI, published food frequency questionnaires with approved validity and reproducibility were used. Additionally, physical activity level was considered as a potential confounder in the analyses of the relationship between EF and body composition [24]. In most studies, physical activity level was estimated as adjusted parameter. As mentioned in the Methods section, definitions of eating occasion among these cases differed. Three studies estimated EF by defining an eating occasion as any instance in which participants reported consumption of solid meals and snacks, with a minimum gap of 15 min between two eating episodes [6,38,40]. According to Ruidavets et al., however, the minimum gap between two eating episodes was an hour [37]. In four other studies, both meals and snacks were included to evaluate EF [34,36,39,42]; whereas Edelstein et al. [41] and Marín-Guerrero et al. [35] excluded snacks from their analyses. Four studies excluded drinks from their analyses [6,34,41,42] while others considered that drinks could contribute to EI [35,36,37,38,39,40].

3.3. EF and Obesity Risk in Adults

Figure 2 summarized the effect of EF on obesity in adults when considering ORs as effect size. Generally, increased EF was associated with 0.83 time lower risk of obesity (i.e., OR = 0.83, 95% CI 0.70–0.99, p = 0.040). A significant heterogeneity of the effect size of EF on obesity was revealed (p < 0.001, Q = 36.34, I2 = 77.98%). Publication bias test by visual inspection of asymmetric plot indicated potential presence of publication bias, while the Egger test revealed no publication bias (p = 0.389, Figure 3).

3.4. EF and Energy Intake in Adults

Analysis of the effect of EF on differences in participants’ EI was shown in Figure 4. We found that increased EF was associated with higher EI (β = 125.36, 95%CI 21.76–228.97, p = 0.017) with significant heterogeneity (p < 0.001, Q = 106.00, I2 = 91.51%), which was mainly caused by the studies conducted by Karatzi et al. [38] and Aljuraiban et al. [6]. They suggested an adverse correlation between EF and EI. Publication bias test by visual inspection of asymmetric plot indicated potential presence of publication bias, while the Egger test revealed no publication bias (p = 0.681, Figure 5).

3.5. Sensitivity Analysis and Subgroup Analysis

A sensitivity analysis was carried out for each model by conducting a stepwise exclusion of the results of each study. Data were not influenced excessively by omitting any single study, with the values of ORs ranging from 0.795 to 0.892 and βs of EI from 106.29 to 164.99.
Significant heterogeneity introduced a warning about the generalization of the results. Thus, we performed subgroup analyses in order to find out probable causes for the significant heterogeneity. For EF and obesity risk, we found that the results of each subgroup were robust (all ORs <1). All selected studies were adjusted for physical activity. As shown in Table 4, subgroup analysis performed on EF definition (both meals and snacks were included to evaluate EF) had an I2 value of 41.76%, suggesting that EF definition might be the cause of the significant heterogeneity. In addition, subgroup analyses performed on age (>40 years) and social economic status (adjusted) had lower I2 values of 53.39% and 53.39%, respectively, meaning that age and social economic status were likely to cause the heterogeneity.
As for EF and EI, we found that I2 of each subgroup was higher than 50%. Therefore, it was difficult to identify the causes for the significant heterogeneity, which was possibly due to the different study designs among selected articles (Table 5).

4. Discussion

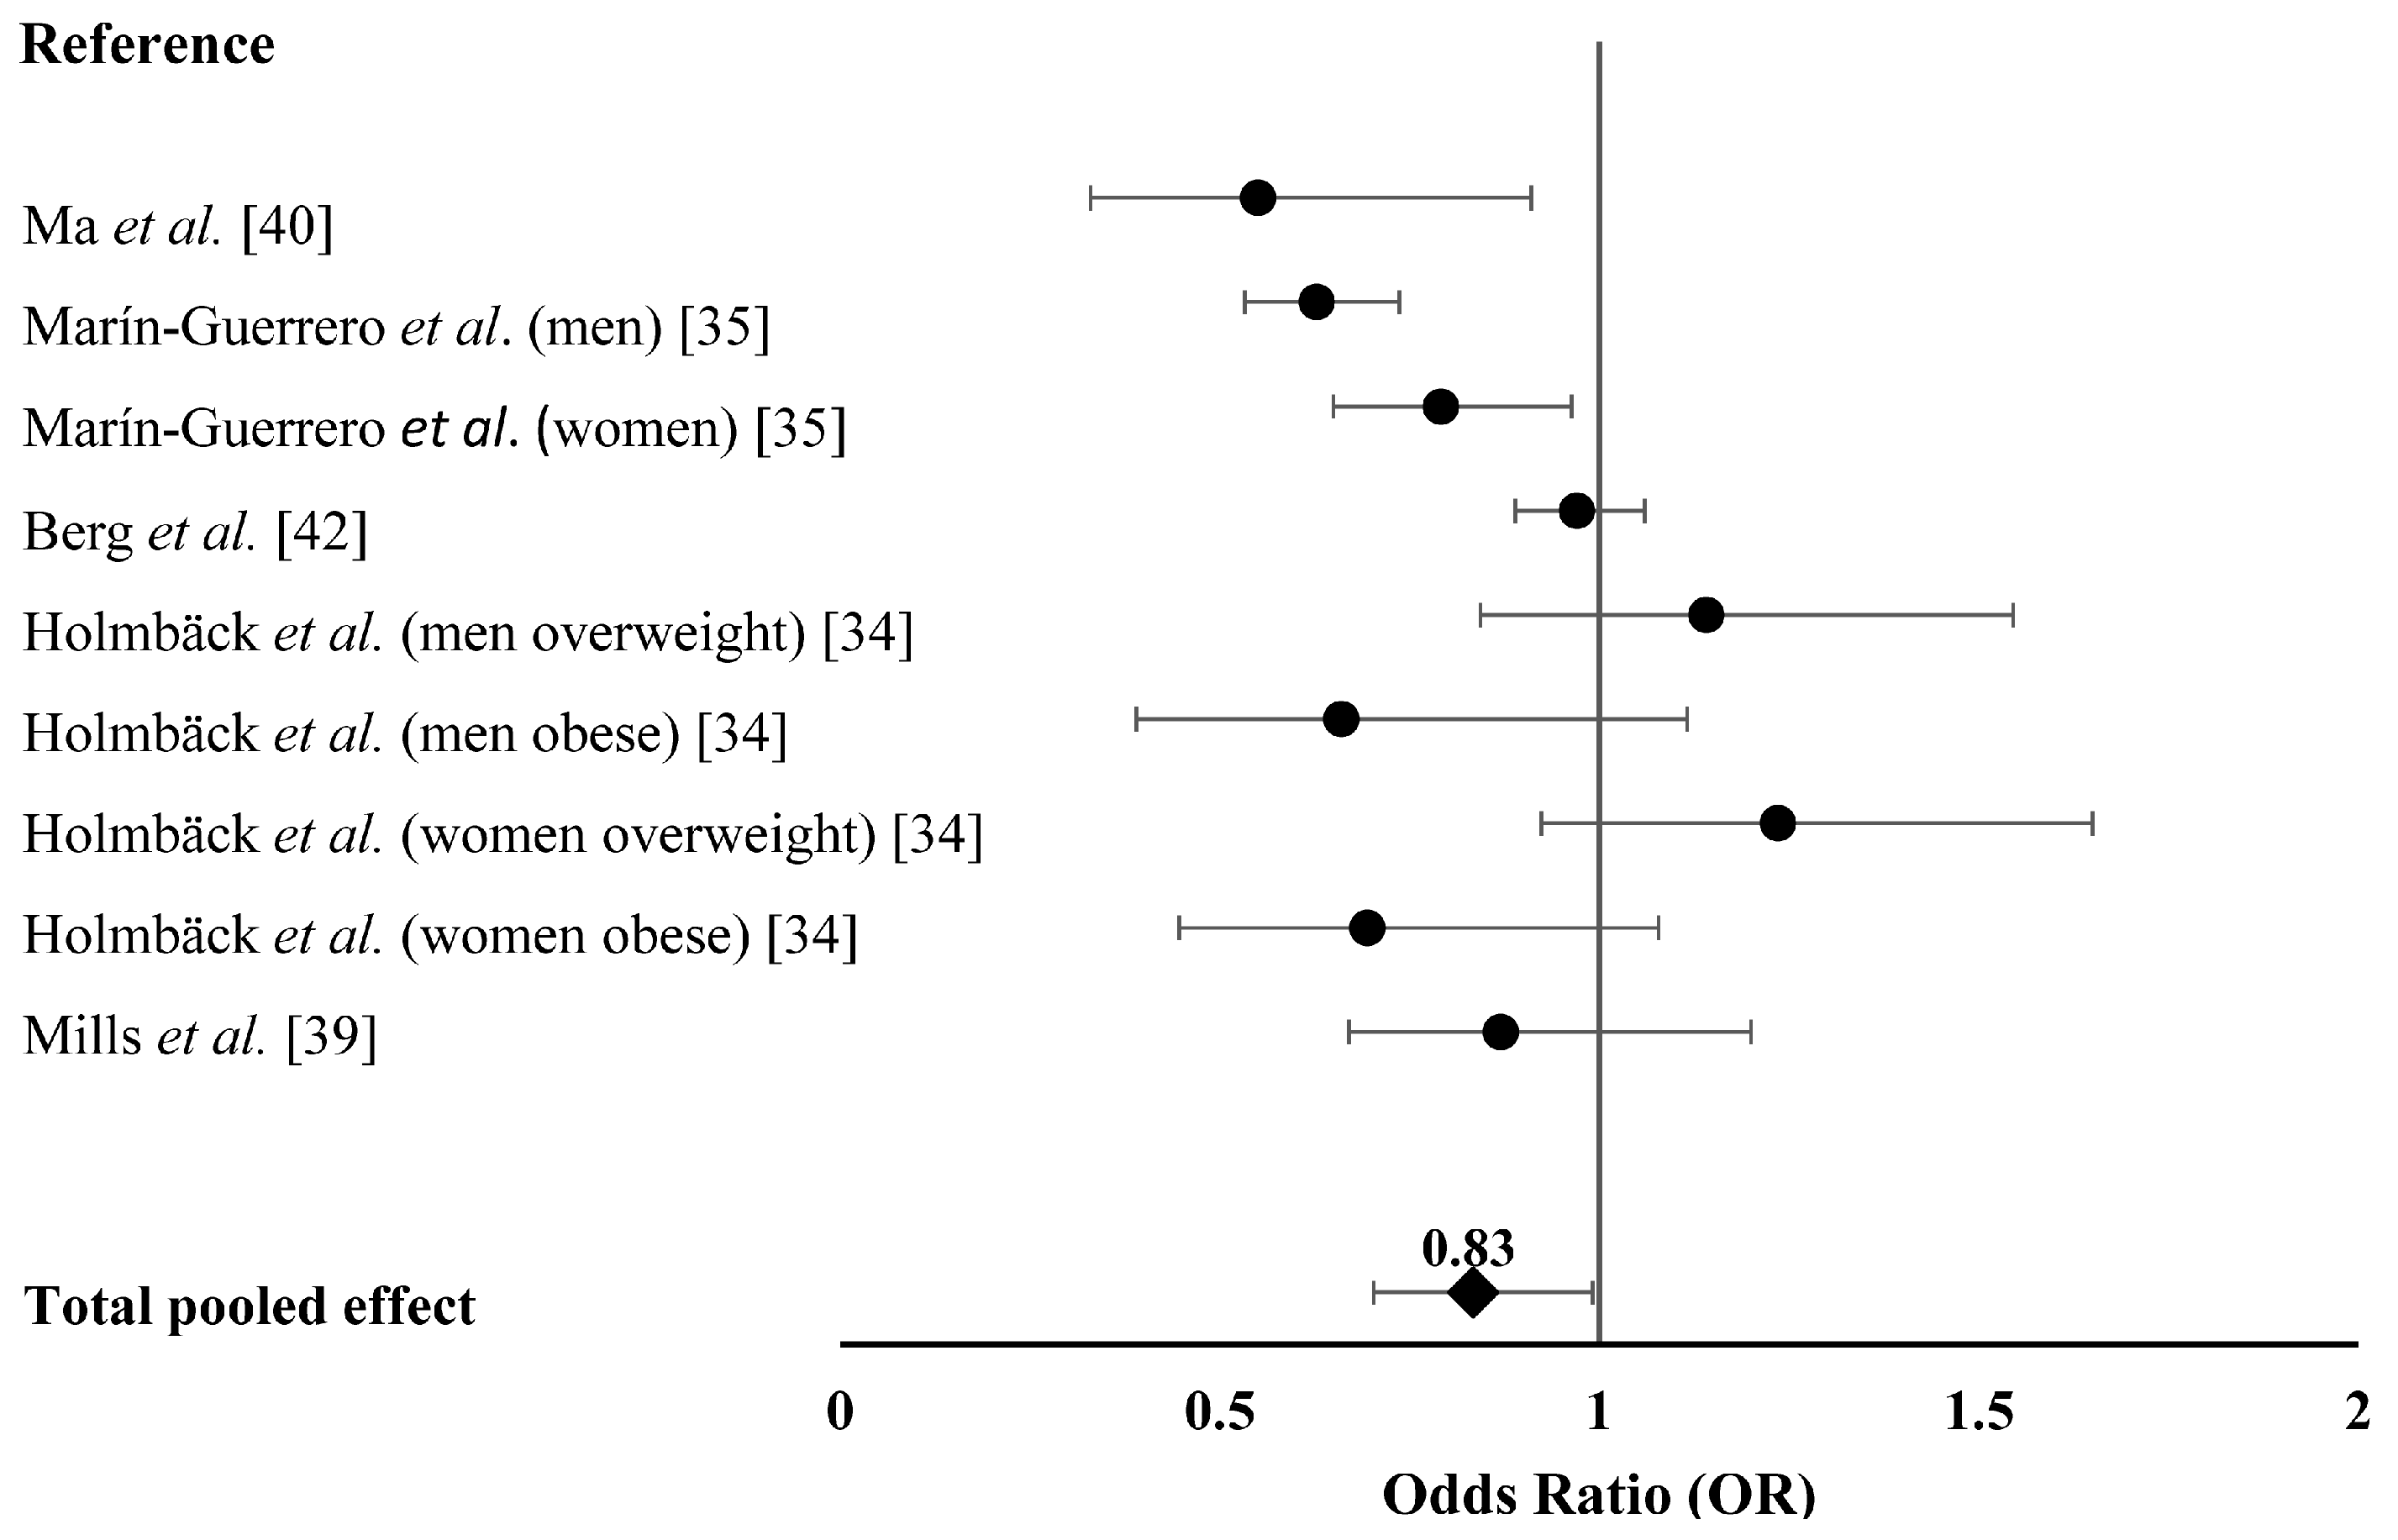
To the best of our knowledge, this is the first meta-analysis to assess the effect of EF on obesity risk and EI in adults without caloric restriction. We found a significant and inverse relationship between EF and obesity risk. Adults with high EF had 17% lower probabilities of getting overweight and obese. Our analysis also indicated a significant and positive association between EF and EI in adults.
Several theories have been proposed to explain the negative relationship between EF and obesity risk in adults. For instance, it has been reported that increased EF improves dietary quality and is associated with lower dietary energy density [6] and therefore lower BMI [43,44,45]. Dietary quality refers to the nutrition component of a diet and is measured by evaluating dietary patterns based on national dietary guidelines [46,47]. According to the Healthy Eating Index (HEI) that is developed to evaluate overall diet quality, high dietary quality requires 30% or less EI from fat, less than 10% EI from saturated fat and low protein intake [48]. High EF is usually associated with high EI from carbohydrates but low EI from protein and fat due to the increased consumption of healthy snacks like fruits [34,35,49]. Additionally, high EF may significantly increase the thermic effect of food, which is an important component of EE. Time of eating might be another cause of the negative association between EF and obesity. High EF is usually associated with more eating occasions occurring early in a day, which is more likely to promote EE. Therefore, higher EF may lead to lower obesity risk.
Increased EF may influence hormone secretion and nutrient metabolism, which play important roles in obesity. It has been suggested that increased EF is associated with a reduction in total insulin secretion and better blood glucose control [50]. Jenkins et al. found that during a high EF diet, the mean serum insulin level was decreased by approximately 28% [51]. Karatzi et al. recruited 164 healthy subjects, measured their plasma levels of insulin and glucose, and found that EF was inversely correlated with insulin concentration and postprandial glucose [38]. Additionally, increased EF may lead to lower serum lipid concentrations [34,51], lower concentrations of total cholesterol and low-density-lipoprotein cholesterol [6,41,52]. These evidence suggest that high EF has a positive effect on nutrient metabolism, which directly contribute to obesity risk.
Several epidemiological studies have suggested that the negative relationship between EF and obesity risk is attributed to reporting bias [20,53], considering that obese and elder individuals may under-report food consumption [14,54]. However, the same association was observed from researches excluding under-reporters [14,34].
It is worth noting that Drummond et al. reported this inverse relationship between EF and obesity in males, but not in females [14]. Similar results were obtained from a meta-analysis of the relationship between EF and obesity in children [17], indicating that gender difference should be considered as a cofounding factor in the analysis. However, due to the limited studies in this area, we were unable to analyze the differential effects of EF on obesity risk in males and females.
Our results support a positive relationship between EF and EI. One plausible explanation for the positive association between EF and EI is that higher EF may increase the probability of excessive energy consumption [39]. However, it has been reported that high EF promotes appetite control, and this may result in reduced EI [9,55,56]. Additionally, a recent study has shown that high EF has little influence on appetite control based on an 8-week intervention trial [57]. We speculated that another factor, portion size, might contribute to the reported differential relationships between EF and EI [58]. The portion size of foods, which is commercially available at supermarkets, family-type restaurants and fast food establishments, has been identified as an important factor to affect EI [59,60]. However, despite the effects of portion size should not be neglected, mechanistic evidence suggested that compensatory dietary response to increased EF was weaker than to larger portion size, making high EF a more sensitive factor for EI [61].
It is of interest to find that increased EF is associated with greater EI but lower obesity risk. Previous studies have reported that individuals with higher EF are likely to live a more active lifestyle, leading to higher EI and EE [34,38]. In addition, Duval et al. reported that physical activity EE was positively correlated with EF by using more objective measures [24]. This finding may partially explain the different effects of EF on obesity risk and EI. Regarding this discrepancy, an alternative explanation may be that errors commonly attributed to dietary assessment might have occurred during the assessment of these two outcomes. Additionally, difference in dietary quality may also play a role. For example, subjects involved in the studies with higher EF and EI may be eating a diet with relative low caloric content. Nevertheless, the underlying mechanism merits further investigation.
This meta-analysis has several potential limitations. First, only observational studies were included in the analysis and therefore casual inference was limited. For instance, increased EF could be both a cause and consequence of obesity, since obese individuals might increase EF to control body weight. Second, we could only identify cross-sectional studies based on our search strategy because very few studies investigated the associations between EF and obesity risk and/or EI in randomized clinical trials (RCTs). We realized that the evidence level of cross-sectional studies was not as convinced as RCTs and cohort studies; however, considering the current research in EF, it is difficult to perform a meta-analysis on RCTs or cohort studies due to the lack of those studies at the time of our analysis. Third, although we performed subgroup analyses, we were unable to assess the exact effect of every exposure on the observed relationship due to limited selected studies. Third, inconsistent definition for EF should be taken into account. Also, the validity and reliability of food frequency questionnaire and dietary recall to evaluate EF and EI need to be considered. However, this is a common limitation in reviews and meta-analysis evaluating dietary behaviors [62], since there is no general agreement on the appropriate definition and assessment strategy [63]. Finally, misinformation of EI and physical activity was not excluded in several selected studies.

5. Conclusions

Results of the present meta-analysis suggest that increased EF is associated with lower obesity risk but higher EI. Despite the aforementioned limitations, these results suggest that increasing EF may benefit body weight management. However, other cofounding factors need to be considered as well, such as portion size. Thus, rigorously designed trials are warranted to confirm these results and to assess the practical applicability.

Acknowledgments

This work was financially supported by National Natural Science Foundation of China (Grant No. 81402668), Planning Project of Innovation and Entrepreneurship Training of National Undergraduate of Wuhan University (No. 201610486114).

Author Contributions

Yue-Qiao Wang designed the study, made the literature search, selected studies, extracted data, drafted the manuscript; Yun-Quan Zhang made the statistical analysis; Fei Zhang selected studies, made the statistical analysis; Yi-Wen Zhang made the literature search, selected studies; Guo-Xun Chen designed the study, corrected the draft of the paper; Rui Li designed the study, corrected the draft of the paper, submitted the paper.

Conflicts of Interest

The authors declare no conflict of interest.

Abbreviations

The following abbreviations are used in this manuscript:
EFeating frequency
EIenergy intake
EEenergy expenditure
BMIbody mass index
SESsocial economic status
MedMediterranean
PAphysical activity
ORodd ratios
CIsconfidence intervals
SEsstandard errors

References

  1. WHO. Fact Sheet of Obesity and Overweight; WHO: Geneva, Switzerland, 2015. [Google Scholar]
  2. Chamieh, M.C.; Moore, H.J.; Summerbell, C.; Tamim, H.; Sibai, A.M.; Hwalla, N. Diet, physical activity and socio-economic disparities of obesity in lebanese adults: Findings from a national study. BMC Public Health 2015, 15, 279. [Google Scholar] [CrossRef] [PubMed] [Green Version]
  3. Broskey, N.T.; Johannsen, D.; Redman, L. Regulation of body weight in humans. In Endotext; De Groot, L.J., Beck-Peccoz, P., Chrousos, G., Dungan, K., Grossman, A., Hershman, J.M., Koch, C., McLachlan, R., New, M., Rebar, R., et al., Eds.; MDText.com, Inc.: South Dartmouth, MA, USA, 2000. [Google Scholar]
  4. Tracy, A.L.; Hazeltine, G.; Wee, C.J.M.; Benoit, S.C. Regulation of energy intake in humans. In Endotext; De Groot, L.J., Beck-Peccoz, P., Chrousos, G., Dungan, K., Grossman, A., Hershman, J.M., Koch, C., McLachlan, R., New, M., Rebar, R., et al., Eds.; MDText.com, Inc.: South Dartmouth, MA, USA, 2000. [Google Scholar]
  5. Bray, G.A. Prevention of obesity. In Endotext; De Groot, L.J., Beck-Peccoz, P., Chrousos, G., Dungan, K., Grossman, A., Hershman, J.M., Koch, C., McLachlan, R., New, M., Rebar, R., et al., Eds.; MDText.com, Inc.: South Dartmouth, MA, USA, 2000. [Google Scholar]
  6. Aljuraiban, G.S.; Chan, Q.; Griep, L.M.O.; Brown, I.J.; Daviglus, M.L.; Stamler, J.; Van Horn, L.; Elliott, P.; Frost, G.S.; Group, I.R. The impact of eating frequency and time of intake on nutrient quality and body mass index: The intermap study, a population-based study. J. Acad. Nutr. Diet. 2015, 115, 528–536. [Google Scholar] [CrossRef] [PubMed]
  7. Atalayer, D.; Rowland, N.E. Effects of meal frequency and snacking on food demand in mice. Appetite 2012, 58, 117–123. [Google Scholar] [CrossRef] [PubMed]
  8. House, B.T.; Shearrer, G.E.; Miller, S.J.; Pasch, K.E.; Goran, M.I.; Davis, J.N. Increased eating frequency linked to decreased obesity and improved metabolic outcomes. Int. J. Obes. 2015, 39, 136–141. [Google Scholar] [CrossRef] [PubMed]
  9. Speechly, D.P.; Buffenstein, R. Greater appetite control associated with an increased frequency of eating in lean males. Appetite 1999, 33, 285–297. [Google Scholar] [CrossRef] [PubMed]
  10. Leidy, H.J.; Campbell, W.W. The effect of eating frequency on appetite control and food intake: Brief synopsis of controlled feeding studies. J. Nutr. 2011, 141, 154–157. [Google Scholar] [CrossRef] [PubMed]
  11. Hill, J.O.; Anderson, J.C.; Lin, D.; Yakubu, F. Effects of meal frequency on energy utilization in rats. Am. J. Physiol. 1988, 255, R616–R621. [Google Scholar] [PubMed]
  12. Verbaeys, I.; Tolle, V.; Swennen, Q.; Zizzari, P.; Buyse, J.; Epelbaum, J.; Cokelaere, M. Scheduled feeding results in adipogenesis and increased acylated ghrelin. Am. J. Physiol. Endocrinol. Metab. 2011, 300, E1103–E1111. [Google Scholar] [CrossRef] [PubMed]
  13. Fabry, P.; Hejda, S.; Cerny, K.; Osancova, K.; Pechar, J. Effect of meal frequency in schoolchildren—Changes in weight-height proportion and skinfold thickness. Am. J. Clin. Nutr. 1966, 18, 358–361. [Google Scholar] [PubMed]
  14. Drummond, S.E.; Crombie, N.E.; Cursiter, M.C.; Kirk, T.R. Evidence that eating frequency is inversely related to body weight status in male, but not female, non-obese adults reporting valid dietary intakes. Int. J. Obes. Relat. Metab. Disord. 1998, 22, 105–112. [Google Scholar] [CrossRef] [PubMed]
  15. Yannakoulia, M.; Melistas, L.; Solomou, E.; Yiannakouris, N. Association of eating frequency with body fatness in pre- and postmenopausal women. Obesity 2007, 15, 100–106. [Google Scholar] [CrossRef] [PubMed]
  16. Fabry, P.; Hejl, Z.; Fodor, J.; Braun, T.; Zvolankova, K. The frequency of meals: Its relation to overweight, hypercholesterolaemia, and decreased glucose-tolerance. Lancet 1964, 2, 614–615. [Google Scholar] [CrossRef]
  17. Kaisari, P.; Yannakoulia, M.; Panagiotakos, D.B. Eating frequency and overweight and obesity in children and adolescents: A meta-analysis. Pediatrics 2013, 131, 958–967. [Google Scholar] [CrossRef] [PubMed]
  18. Schoenfeld, B.J.; Aragon, A.A.; Krieger, J.W. Effects of meal frequency on weight loss and body composition: A meta-analysis. Nutr. Rev. 2015, 73, 69–82. [Google Scholar] [CrossRef] [PubMed]
  19. Kant, A.K.; Schatzkin, A.; Graubard, B.I.; Ballard-Barbash, R. Frequency of eating occasions and weight change in the NHANES I epidemiologic follow-up study. Int. J. Obes. Relat. Metab. Disord. 1995, 19, 468–474. [Google Scholar] [PubMed]
  20. Summerbell, C.D.; Moody, R.C.; Shanks, J.; Stock, M.J.; Geissler, C. Relationship between feeding pattern and body mass index in 220 free-living people in four age groups. Eur. J. Clin. Nutr. 1996, 50, 513–519. [Google Scholar] [PubMed]
  21. Huang, T.T.; Howarth, N.C.; Lin, B.H.; Roberts, S.B.; McCrory, M.A. Energy intake and meal portions: Associations with BMI percentile in U.S. Children. Obes. Res. 2004, 12, 1875–1885. [Google Scholar] [CrossRef] [PubMed]
  22. Huang, T.T.; Roberts, S.B.; Howarth, N.C.; McCrory, M.A. Effect of screening out implausible energy intake reports on relationships between diet and BMI. Obes. Res. 2005, 13, 1205–1217. [Google Scholar] [CrossRef] [PubMed]
  23. Van der Heijden, A.A.; Hu, F.B.; Rimm, E.B.; van Dam, R.M. A prospective study of breakfast consumption and weight gain among U.S. Men. Obesity 2007, 15, 2463–2469. [Google Scholar] [CrossRef] [PubMed]
  24. Duval, K.; Strychar, I.; Cyr, M.J.; Prud’homme, D.; Rabasa-Lhoret, R.; Doucet, E. Physical activity is a confounding factor of the relation between eating frequency and body composition. Am. J. Clin. Nutr. 2008, 88, 1200–1205. [Google Scholar] [PubMed]
  25. Liberati, A.; Altman, D.G.; Tetzlaff, J.; Mulrow, C.; Gotzsche, P.C.; Ioannidis, J.P.; Clarke, M.; Devereaux, P.J.; Kleijnen, J.; Moher, D. The prisma statement for reporting systematic reviews and meta-analyses of studies that evaluate healthcare interventions: Explanation and elaboration. BMJ 2009, 339, e1000100. [Google Scholar] [CrossRef] [PubMed]
  26. Rostom, A.; Dubé, C.; Cranney, A.; Saloojee, N.; Sy, R.; Garritty, C.; Sampson, M.; Zhang, L.; Yazdi, F.; Mamaladze, V.; et al. Appendix D. Quality Assessment Forms; Evidence Reports/Technology Assessments, No. 104; Agency for Healthcare Research and Quality (US): Rockville, MD, USA, 2004.
  27. Deeks, J.J.; Higgins, J.P.; Altman, D.G. Analysing and presenting results. In Cochrane Handbook for Systematic Reviews of Interventions; Higgins, J.P., Green, S.E., Eds.; Wiley-Blackwell: Hoboken, NJ, USA, 2005. [Google Scholar]
  28. Higgins, J.P.; Thompson, S.G.; Deeks, J.J.; Altman, D.G. Measuring inconsistency in meta-analyses. BMJ 2003, 327, 557–560. [Google Scholar] [CrossRef] [PubMed] [Green Version]
  29. DerSimonian, R.; Laird, N. Meta-analysis in clinical trials. Control. Clin. Trials 1986, 7, 177–188. [Google Scholar] [CrossRef]
  30. Mantel, N.; Haenszel, W. Statistical aspects of the analysis of data from retrospective studies of disease. J. Natl. Cancer Inst. 1959, 22, 719–748. [Google Scholar] [PubMed]
  31. Higgins, J.P.; Thompson, S.G. Quantifying heterogeneity in a meta-analysis. Stat. Med. 2002, 21, 1539–1558. [Google Scholar] [CrossRef] [PubMed]
  32. Begg, C.B.; Mazumdar, M. Operating characteristics of a rank correlation test for publication bias. Biometrics 1994, 50, 1088–1101. [Google Scholar] [CrossRef] [PubMed]
  33. Egger, M.; Davey Smith, G.; Schneider, M.; Minder, C. Bias in meta-analysis detected by a simple, graphical test. BMJ 1997, 315, 629–634. [Google Scholar] [CrossRef] [PubMed]
  34. Holmback, I.; Ericson, U.; Gullberg, B.; Wirfalt, E. A high eating frequency is associated with an overall healthy lifestyle in middle-aged men and women and reduced likelihood of general and central obesity in men. Br. J. Nutr. 2010, 104, 1065–1073. [Google Scholar] [CrossRef] [PubMed]
  35. Marin-Guerrero, A.C.; Gutierrez-Fisac, J.L.; Guallar-Castillon, P.; Banegas, J.R.; Rodriguez-Artalejo, F. Eating behaviours and obesity in the adult population of spain. Br. J. Nutr. 2008, 100, 1142–1148. [Google Scholar] [CrossRef] [PubMed]
  36. Titan, S.M.; Bingham, S.; Welch, A.; Luben, R.; Oakes, S.; Day, N.; Khaw, K.T. Frequency of eating and concentrations of serum cholesterol in the norfolk population of the European prospective investigation into cancer (EPIC-Norfolk): Cross sectional study. BMJ 2001, 323. [Google Scholar] [CrossRef]
  37. Ruidavets, J.B.; Bongard, V.; Bataille, V.; Gourdy, P.; Ferrieres, J. Eating frequency and body fatness in middle-aged men. Int. J. Obes. 2002, 26, 1476–1483. [Google Scholar] [CrossRef] [PubMed]
  38. Karatzi, K.; Yannakoulia, M.; Psaltopoulou, T.; Voidonikola, P.; Kollias, G.; Sergentanis, T.N.; Retsas, T.; Alevizaki, M.; Papamichael, C.; Stamatelopoulos, K. Meal patterns in healthy adults: Inverse association of eating frequency with subclinical atherosclerosis indexes. Clin. Nutr. 2015, 34, 302–308. [Google Scholar] [CrossRef] [PubMed]
  39. Mills, J.P.; Perry, C.D.; Reicks, M. Eating frequency is associated with energy intake but not obesity in midlife women. Obesity 2011, 19, 552–559. [Google Scholar] [CrossRef] [PubMed]
  40. Ma, Y. Association between eating patterns and obesity in a free-living US adult population. Am. J. Epidemiol. 2003, 158, 85–92. [Google Scholar] [CrossRef] [PubMed]
  41. Edelstein, S.L.; Barrett-Connor, E.L.; Wingard, D.L.; Cohn, B.A. Increased meal frequency associated with decreased cholesterol concentrations; Rancho Bernardo, CA, 1984–1987. Am. J. Clin. Nutr. 1992, 55, 664–669. [Google Scholar] [PubMed]
  42. Berg, C.; Lappas, G.; Wolk, A.; Strandhagen, E.; Toren, K.; Rosengren, A.; Thelle, D.; Lissner, L. Eating patterns and portion size associated with obesity in a swedish population. Appetite 2009, 52, 21–26. [Google Scholar] [CrossRef] [PubMed]
  43. Fung, T.T.; Pan, A.; Hou, T.; Chiuve, S.E.; Tobias, D.K.; Mozaffarian, D.; Willett, W.C.; Hu, F.B. Long-term change in diet quality is associated with body weight change in men and women. J. Nutr. 2015, 145, 1850–1856. [Google Scholar] [CrossRef] [PubMed]
  44. Collins, C.E.; Young, A.F.; Hodge, A. Diet quality is associated with higher nutrient intake and self-rated health in mid-aged women. J. Am. Coll. Nutr. 2008, 27, 146–157. [Google Scholar] [CrossRef] [PubMed]
  45. De Oliveira, E.P.; Diegoli, A.C.M.; Corrente, J.E.; McLellan, K.C.P.; Burini, R.C. The increase of dairy intake is the main dietary factor associated with reduction of body weight in overweight adults after lifestyle change program. Nutr. Hosp. 2015, 32, 1042–1049. [Google Scholar] [CrossRef] [PubMed]
  46. Hutchesson, M.J.; Collins, C.E.; Morgan, P.J.; Watson, J.F.; Guest, M.; Callister, R. Changes to dietary intake during a 12-week commercial web-based weight loss program: A randomized controlled trial. Eur. J. Clin. Nutr. 2014, 68, 64–70. [Google Scholar] [CrossRef] [PubMed]
  47. Collins, C.E.; Morgan, P.J.; Jones, P.; Fletcher, K.; Martin, J.; Aguiar, E.J.; Lucas, A.; Neve, M.J.; Callister, R. A 12-week commercial web-based weight-loss program for overweight and obese adults: Randomized controlled trial comparing basic versus enhanced features. J. Med. Internet Res. 2012, 14, e57. [Google Scholar] [CrossRef] [PubMed]
  48. Kennedy, E.T.; Ohls, J.; Carlson, S.; Fleming, K. The healthy eating index. J. Am. Diet. Assoc. 1995, 95, 1103–1108. [Google Scholar] [CrossRef]
  49. Chapelot, D.; Marmonier, C.; Aubert, R.; Allegre, C.; Gausseres, N.; Fantino, M.; Louis-Sylvestre, J. Consequence of omitting or adding a meal in man on body composition, food intake, and metabolism. Obesity 2006, 14, 215–227. [Google Scholar] [CrossRef] [PubMed]
  50. Louis-Sylvestre, J.; Lluch, A.; Neant, F.; Blundell, J.E. Highlighting the positive impact of increasing feeding frequency on metabolism and weight management. Forum Nutr. 2003, 56, 126–128. [Google Scholar] [PubMed]
  51. Jenkins, D.J.; Wolever, T.M.; Vuksan, V.; Brighenti, F.; Cunnane, S.C.; Rao, A.V.; Jenkins, A.L.; Buckley, G.; Patten, R.; Singer, W.; et al. Nibbling versus gorging: Metabolic advantages of increased meal frequency. N. Engl. J. Med. 1989, 321, 929–934. [Google Scholar] [CrossRef] [PubMed]
  52. Jenkins, D.J.; Jenkins, A.L.; Wolever, T.M.; Vuksan, V.; Rao, A.V.; Thompson, L.U.; Josse, R.G. Low glycemic index: Lente carbohydrates and physiological effects of altered food frequency. Am. J. Clin. Nutr. 1994, 59, 706s–709s. [Google Scholar] [PubMed]
  53. Bellisle, F.; McDevitt, R.; Prentice, A.M. Meal frequency and energy balance. Br. J. Nutr. 1997, 77 (Suppl. S1), S57–S70. [Google Scholar] [CrossRef] [PubMed]
  54. Howarth, N.C.; Huang, T.T.; Roberts, S.B.; Lin, B.H.; McCrory, M.A. Eating patterns and dietary composition in relation to BMI in younger and older adults. Int. J. Obes. 2007, 31, 675–684. [Google Scholar] [CrossRef] [PubMed]
  55. Smith, K.J.; Blizzard, L.; McNaughton, S.A.; Gall, S.L.; Dwyer, T.; Venn, A.J. Daily eating frequency and cardiometabolic risk factors in young australian adults: Cross-sectional analyses. Br. J. Nutr. 2012, 108, 1086–1094. [Google Scholar] [CrossRef] [PubMed]
  56. Speechly, D.P.; Rogers, G.G.; Buffenstein, R. Acute appetite reduction associated with an increased frequency of eating in obese males. Int. J. Obes. Relat. Metab. Disord. 1999, 23, 1151–1159. [Google Scholar] [CrossRef] [PubMed]
  57. Cameron, J.D.; Cyr, M.J.; Doucet, E. Increased meal frequency does not promote greater weight loss in subjects who were prescribed an 8-week equi-energetic energy-restricted diet. Br. J. Nutr. 2010, 103, 1098–1101. [Google Scholar] [CrossRef] [PubMed]
  58. Fisher, J.O.; Arreola, A.; Birch, L.L.; Rolls, B.J. Portion size effects on daily energy intake in low-income Hispanic and African American children and their mothers. Am. J. Clin. Nutr. 2007, 86, 1709–1716. [Google Scholar] [PubMed]
  59. Kral, T.V. Effects on hunger and satiety, perceived portion size and pleasantness of taste of varying the portion size of foods: A brief review of selected studies. Appetite 2006, 46, 103–105. [Google Scholar] [CrossRef] [PubMed]
  60. Young, L.R.; Nestle, M. The contribution of expanding portion sizes to the us obesity epidemic. Am. J. Public Health 2002, 92, 246–249. [Google Scholar] [CrossRef] [PubMed]
  61. Mattes, R. Energy intake and obesity: Ingestive frequency outweighs portion size. Physiol. Behav. 2014, 134, 110–118. [Google Scholar] [CrossRef] [PubMed]
  62. Wang, Y.; Beydoun, M.A.; Li, J.; Liu, Y.; Moreno, L.A. Do children and their parents eat a similar diet? Resemblance in child and parental dietary intake: Systematic review and meta-analysis. J. Epidemiol. Community Health 2011, 65, 177–189. [Google Scholar] [CrossRef] [PubMed]
  63. Oltersdorf, U.; Schlettwein-gsell, D.; Winkler, G. Assessing eating patterns-an emerging research topic in nutritional sciences: Introduction to the symposium. Appetite 1999, 32, 1–7. [Google Scholar] [CrossRef] [PubMed]
Figure 1. Flow diagram of literature search. Results from the literature search and study-selection procedure are summarized.
Ijerph 13 00603 g001
Figure 2. The effect of EF on obesity risk in adults. Forest plot of studies that evaluated the effect of EF on obesity risk in adults (squares and diamonds represent effect size; extended lines show 95% CIs). Increased EF, as compared with the reference category, was inversely associated with obesity risk. EF, eating frequency.
Ijerph 13 00603 g002
Figure 3. Funnel plot of EF and obesity risk. Funnel plot for 9 studies indicated potential presence of publication bias, while the Egger test revealed no publication bias (p = 0.389). EF, eating frequency.
Ijerph 13 00603 g003
Figure 4. The effect of EF on EI in adults. Forest plot of studies that evaluated the effect of EF on EI in adults (squares and diamonds represent effect size; extended lines show SEs). Increased EF, as compared with the reference category, was positively associated with EI. EF, eating frequency; EI, energy intake.
Ijerph 13 00603 g004
Figure 5. Funnel plot of EF and EI. Funnel plot for 9 studies indicated potential presence of publication bias, while the Egger test revealed no publication bias (p = 0.681). EF, eating frequency; EI, energy intake.
Ijerph 13 00603 g005
Table 1. Basic characteristics of evaluated studies.
Study [Ref.]YearCountrySample, nEF (No. of Times per Day)Adjustment FactorsFindings
MaleFemaleAge
Edelstein et al. [41]1992USA203450–891–2; 3; ≥42BMI did not differ significantly by EF.
Titan et al. [36]2001UK6890777645–751–2; 3; 4; 5; ≥61,5–12BMI was negatively associated with EF in men but not in women.
Ruidavets et al. [37]2002France242045–641–2; 3; 4; ≥51,4Increase of EF is associated with lower body fatness.
Ma et al. [40]2003USA25124820–70≤3; ≥41,2,4,7,13A greater number of eating episodes each day was associated with a lower risk of obesity.
Marín-Guerrero et al. [35]2008Spain16,92918,04525–641; 2; 3–41,3,6,7,9,14,15,20Obesity was more prevalent in those having only two meals per day than in those having three or four meals in men and women.
Berg et al. [42]2009Sweden359125–771–81,2,6,7There was no significant association between obesity and EF due to methodological problems.
Holmbäck et al. [34]2010Sweden892102445–72≤3; 4–5; ≥61,4,6,7,9,11,13,16,17Men with a low EF showed an increased risk of general and central obesity and results for women showed similar but non-significant tendencies.
Mills et al. [39]2011USA0109940–601–3; 4; 5; 6; ≥71,3,4,13,16,18–21EF was not associated with overweight/obesity, but it was associated with energy intake.
Karatzi et al. [38]2014Greece6210246.8 ± 9.3continuous1,11–13,22,23EF was inversely associated with BMI.
Aljuraiban et al. [6]2015USA & UK1232115340–59<4; 4–5; 5–6; ≥61,2,6,7,13,24,25A larger number of small meals may be associated with improved diet quality and lower BMI.
Adjustment factors: 1: age; 2: gender; 3: race/ethnicity; 4: education; 5: obesity; 6: cigarette smoking; 7: physical activity; 8: intake of calories; 9: alcohol; 10: protein; 11: fat; 12: carbohydrate; 13: total energy intake; 14: health status; 15: lifestlye; 16: socio-economic status; 17: fibre intake; 18: other eating behaviors; 19: MET min/week; 20: marital status; 21: menopausal status; 22: HDL; 23: HOMA-IR; 24: dietary; 25: population sample. Ref.: reference; EF: eating frequency; BMI: body mass index.
Table 2. ORs and 95% CIs between EF and obesity.
Study [Ref.]YearEFOriginal ORCombined OR95% CI
Ma et al. [40]2003continuous0.550.550.33–0.91
Marín-Guerrero et al. [35] (Men)20083 or 40.70.630.47–1.06
20.61
Marín-Guerrero et al. [35] (Women)20083 or 40.90.790.56–1.41
20.77
Berg et al. [42]2009continuous0.970.970.89–1.06
Holmbäck et al. [34] (Men overweight)2010≥61.061.140.62–1.85
4~51.17
Holmbäck et al. [34] (Men obese)2010≥60.410.660.17–0.98
4~50.87
Holmbäck et al. [34] (Women overweight)2010≥61.321.240.64–2.70
4~51.22
Holmbäck et al. [34] (Women obese)2010≥60.390.690.14–1.08
4~50.79
Mills et al. [39]2011continuous0.870.870.49–1.30
Original OR: original OR was directly extracted from included studies using the lowest EF category as reference. If the original study used the highest EF category as reference group, we presented the reciprocal of reported ORs as the Original OR in the table. Ref.: reference; EF, eating frequency.
Table 3. βs and SEs (standard errors) for the differences in EI among EF categories.
Study [Ref.]YearEFEI (kcal)βSE
Edelstein et al. [41]19921–21962 ± 45.4189.4636.65
31792 ± 26.2
41658 ± 63
Titan et al. [36] (Men)20011–21965.8 ± 621.9271.828.61
32027 ± 552.5
42232.8 ± 616.4
52383.4 ± 641.5
≥62542.8 ± 692.9
Titan et al. [36] (Women)20011–21810.9 ± 571.2204.256.92
31786.3 ± 482.1
41925 ± 528.2
52054 ± 531.1
≥62213.7 ± 602.3
Ruidavets et al. [37]20021–22306.4 ± 645.372.2351.75
32380.5 ± 597.5
42414 ± 645.3
≥52485.7 ± 621.4
Holmbäck et al. [34] (Men)2010≤32557.4251.5232.99
4–52724.7
≥62963.7
Holmbäck et al. [34] (Women)2010≤31959.8119.5025.19
4–52103.3
≥62175
Mills et al. [39]2011≤31864 ± 583207.0120.47
42025 ± 627
52158 ± 765
62235 ± 630
≥72348 ± 730
Karatzi et al. [38]2014continuous0.030.030.01
Aljuraiban et al. [6]2015≤42472−184.2312.49
4–52402
5–62294
≥62129
EI, energy intake (kcal): transformed data were presented; Ref.: reference; EF, eating frequency.
Table 4. Subgroup analysis for EF and obesity risk.
ExposureSubgroupNumber of StudiesQp-ValueI2 (%)OR (95% CI)
Gendermale311.750.00382.99%0.78 (0.51,1.20)
female47.480.05859.92%0.89 (0.71,1.12)
mixed24.660.03178.58%0.77 (0.45,1.33)
Age>20425.56<0.000188.27%0.75 (0.57,0.97)
>4058.580.07253.39%0.94 (0.74,1.18)
CountryUSA22.360.12457.65%0.73 (0.47,1.13)
Med732.98<0.000181.81%0.86 (0.71,1.05)
Educationunadjusted322.53<0.000191.12%0.79 (0.59,1.04)
adjusted613.080.02361.77%0.87 (0.68,1.11)
Smokingunadjusted22.360.12457.65%0.73 (0.47,1.13)
adjusted732.98<0.000181.81%0.86 (0.71,1.05)
Alcoholunadjusted35.020.08160.20%0.85 (0.67,1.09)
adjusted623.340.000378.58%0.83 (0.65,1.07)
SESunadjusted425.57<0.000188.27%0.75 (0.57,0.97)
adjusted58.580.07253.39%0.94 (0.74,1.18)
Fiber Intakeunadjusted525.57<0.000184.36%0.77 (0.62,0.96)
adjusted47.770.05161.40%0.95 (0.70,1.28)
EF definition168.590.1341.76%0.96 (0.83,1.11)
223.220.072668.97%0.7 (0.56,0.88)
3101 0.55 (0.33,0.91)
Diet Assessmentself-report732.98<0.000181.81%0.86 (0.71,1.13)
food records101 0.87 (0.65,1.16)
dietary recalls101 0.55 (0.33,0.91)
Reference GroupEF = 123.220.072668.97%0.7 (0.56,0.88)
EF = 347.770.05161.4%0.95 (0.7,1.28)
EF was continuous35.030.081160.2%0.85 (0.67,1.09)
Total936.34<0.000177.98%0.83(0.70,0.99)
SES: social economic status; Med: Mediterranean; EF (eating frequency) definition: 1: both meals and snacks were included to evaluate EF; 2: excluded snacks to evaluate EF; 3: an eating occasion as any instance in which participants reported consumption of solid meals and snacks, with a minimum gap of 15 min between two eating episodes.
Table 5. Subgroup analysis for EF and EI.
ExposureSubgroupNumber of StudiesQp-ValueI2 (%)β (95% CI)
Gendermale314.660.00186.36%211.64 (121.28,301.99)
female310.690.00581.29%181.47 (136.54,226.39)
mixed3244.50<0.000199.18%−2.39 (−151.72,146.94)
Educationunadjusted52112.69<0.000199.81%95.52 (−44.97,236.01)
adjusted416.540.00181.86%168.69 (99.90,237.48)
Obesityunadjusted7429.35<0.000198.60%91.44 (−7.71,190.59)
adjusted237.43<0.000197.33%237.84 (171.63,304.05)
Smokingunadjusted4130.94<0.000197.71%116.86 (−19.31,253.03)
adjusted5978.60<0.000199.59%132.10 (−32.41,296.61)
Alcoholunadjusted5348.72<0.000198.85%54.18 (−64.21,172.57)
adjusted456.66<0.000194.71%213.13 (158.69,267.56)
PAunadjusted328.67<0.000193.02%84.44 (−45.45,214.33)
adjusted6982.47<0.000199.49%144.53 (1.66,287.41)
SESunadjusted52114.63<0.000199.76%91.91 (−36.71,220.54)
adjusted311.960.00383.28%190.89 (119.52,262.27)
EF definition1551.52<0.000193.05%212.11 (166.56,257.66)
22217.64<0.000199.54%−91.68 (−272.25,88.89)
3101 189.46 (117.63,261.29)
4101 72.23 (−29.2,173.66)
Diet Assessmentself-report557.67 93.06%209.42 (160.63,258.21)
food records3104.19 98.08%93.13 (−64.79,251.05)
dietary recalls101 −184.23 (−208.71,−159.75)
Reference GroupEF = 1–2338.67<0.000194.87%226.28 (170.14,282.43)
EF = 3313.100.001484.74%151.58 (49.92,253.23)
EF = 42266.31<0.000199.62%11.06 (−372.35,394.46)
EF was continuous101
Total92297.53<0.000199.65%125.36(21.76,228.97)
PA, physical activity; SES, social economic status; EF (eating frequency) definition: 1: both meals and snacks were included to evaluate EF; 2: an eating occasion as any instance in which participants reported consumption of solid meals and snacks, with a minimum gap of 15 min between two eating episodes; 3: excluded snacks to evaluate EF; 4: the minimum gap between two eating episodes was an hour.

