
Socio-Ecological Intervention to Promote Active Commuting to Work: Protocol and Baseline Findings of a Cluster Randomized Controlled Trial in Finland

 , , and
Abstract
:1. Introduction
2. Materials and Methods
2.1. Ethics
2.2. Participants
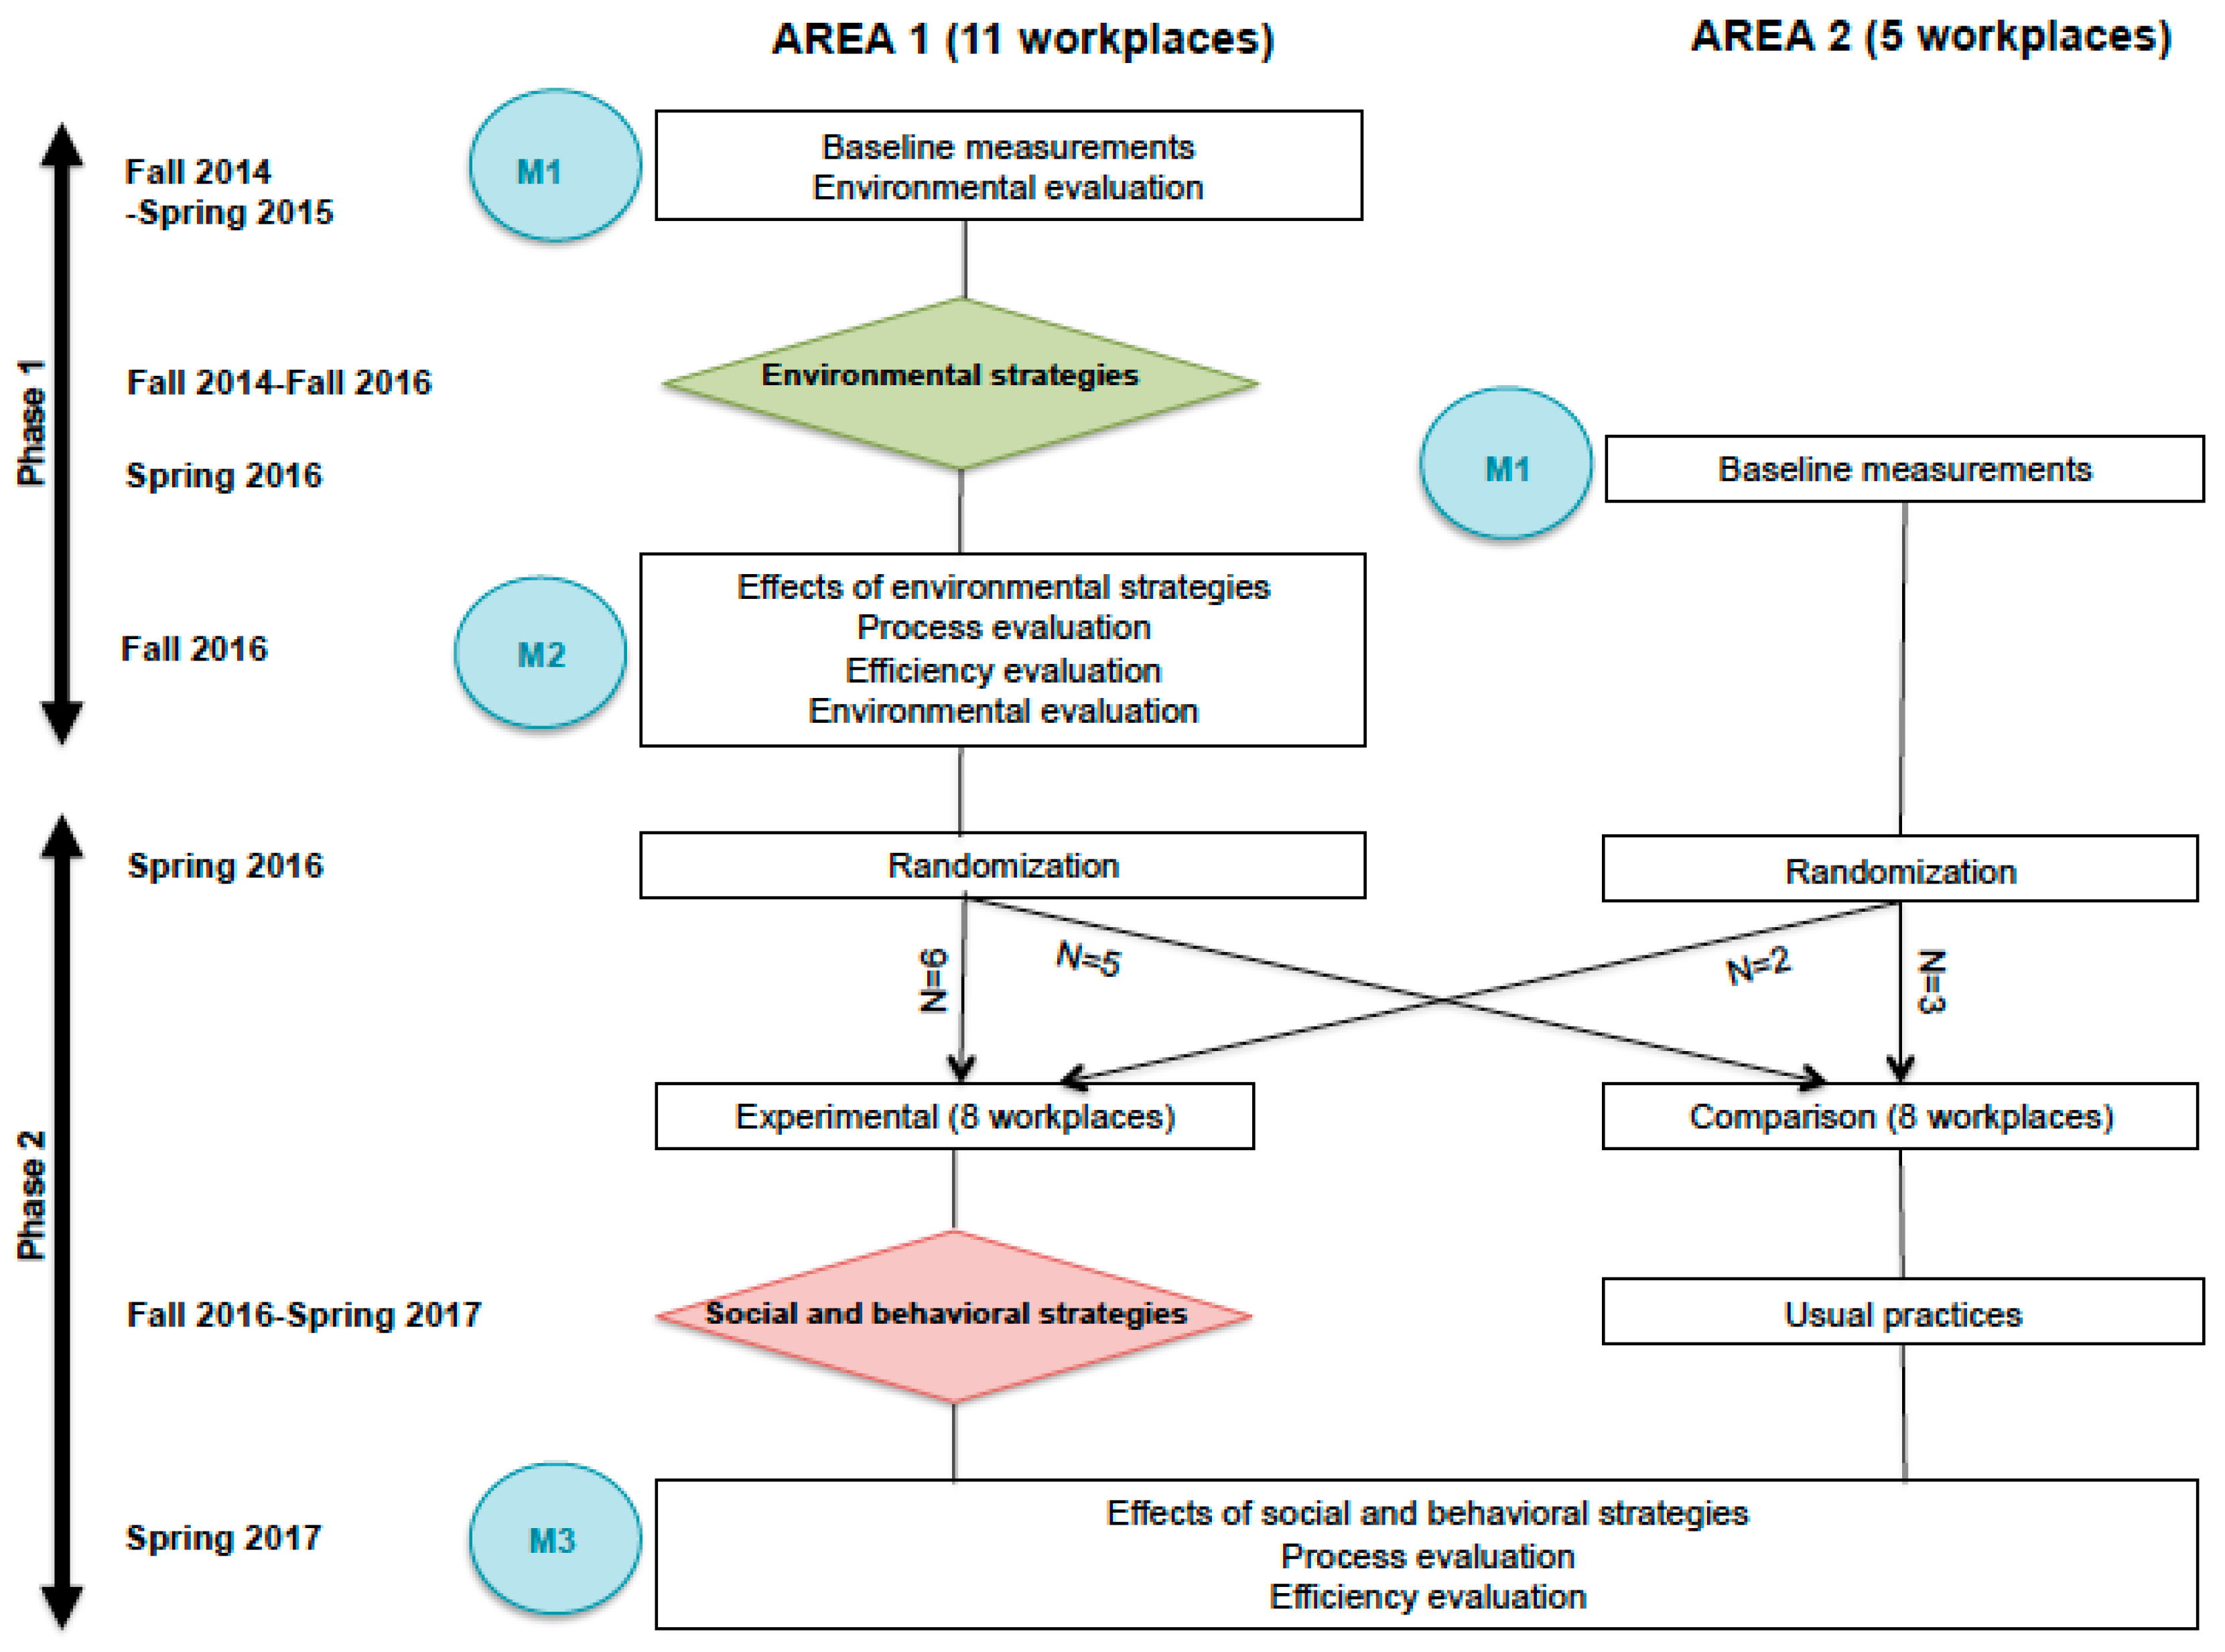
2.2.1. Workplaces
2.2.2. Employees
2.3. Intervention
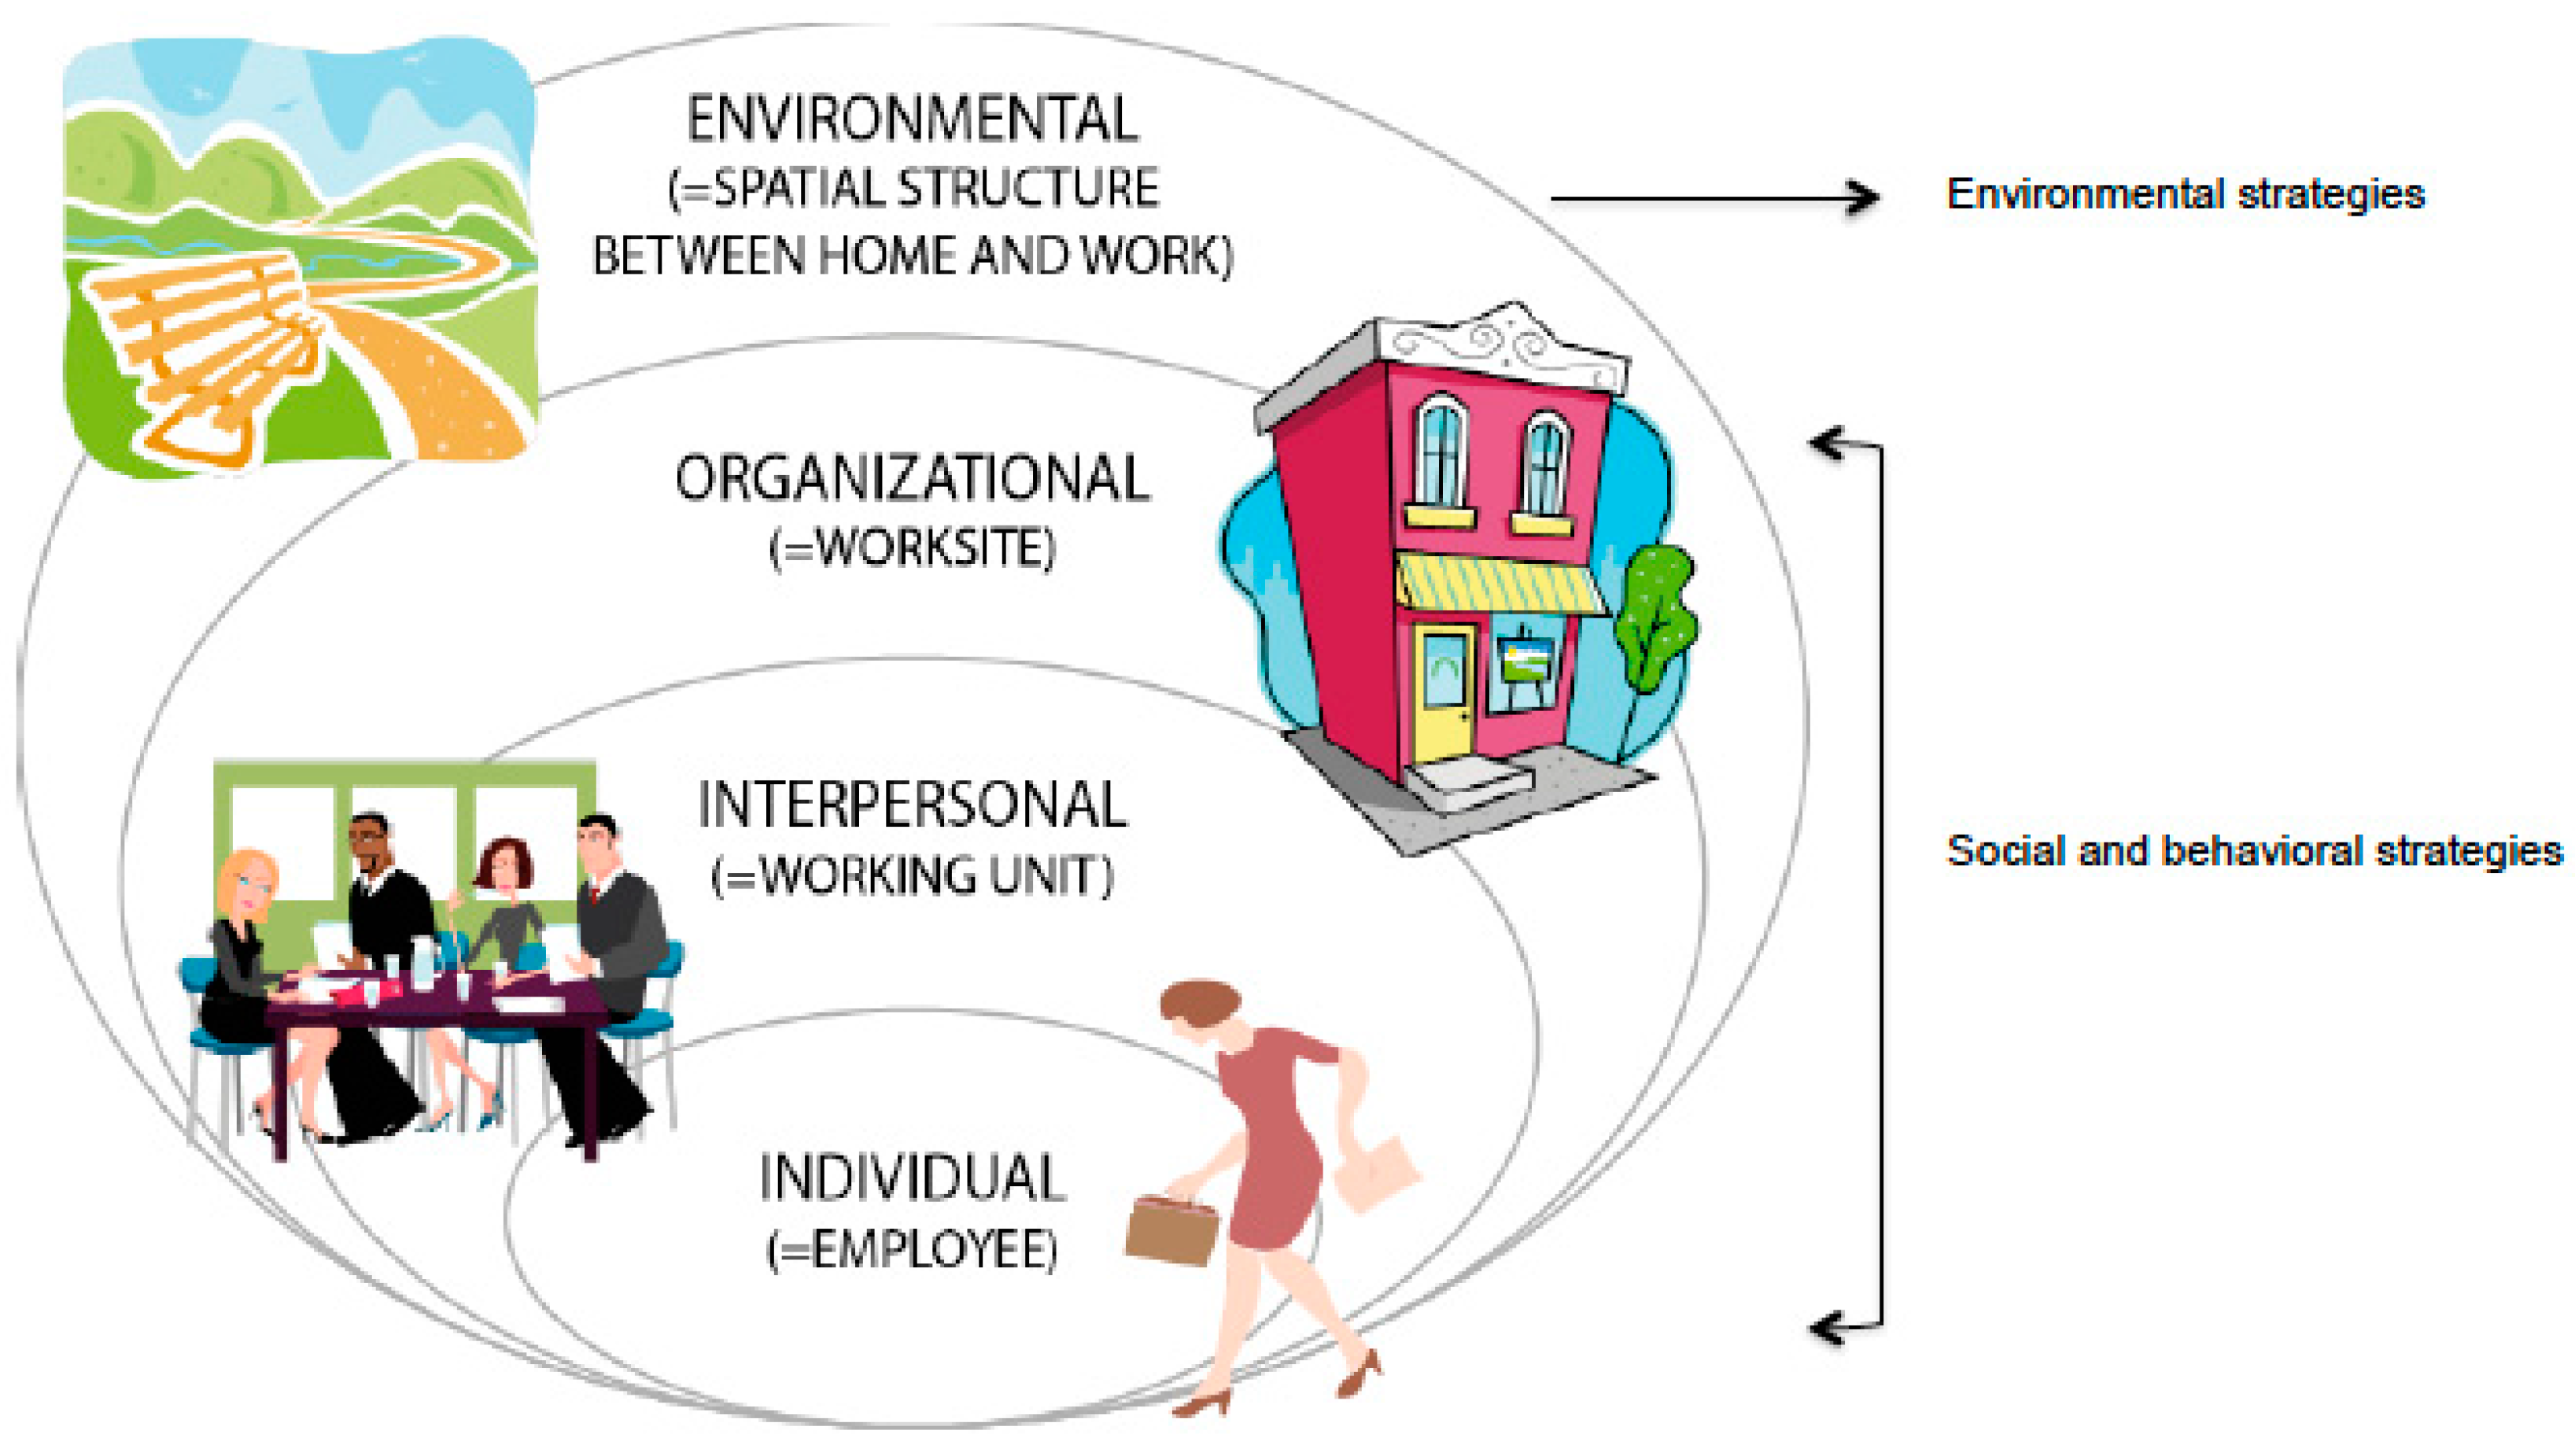
2.3.1. Framework
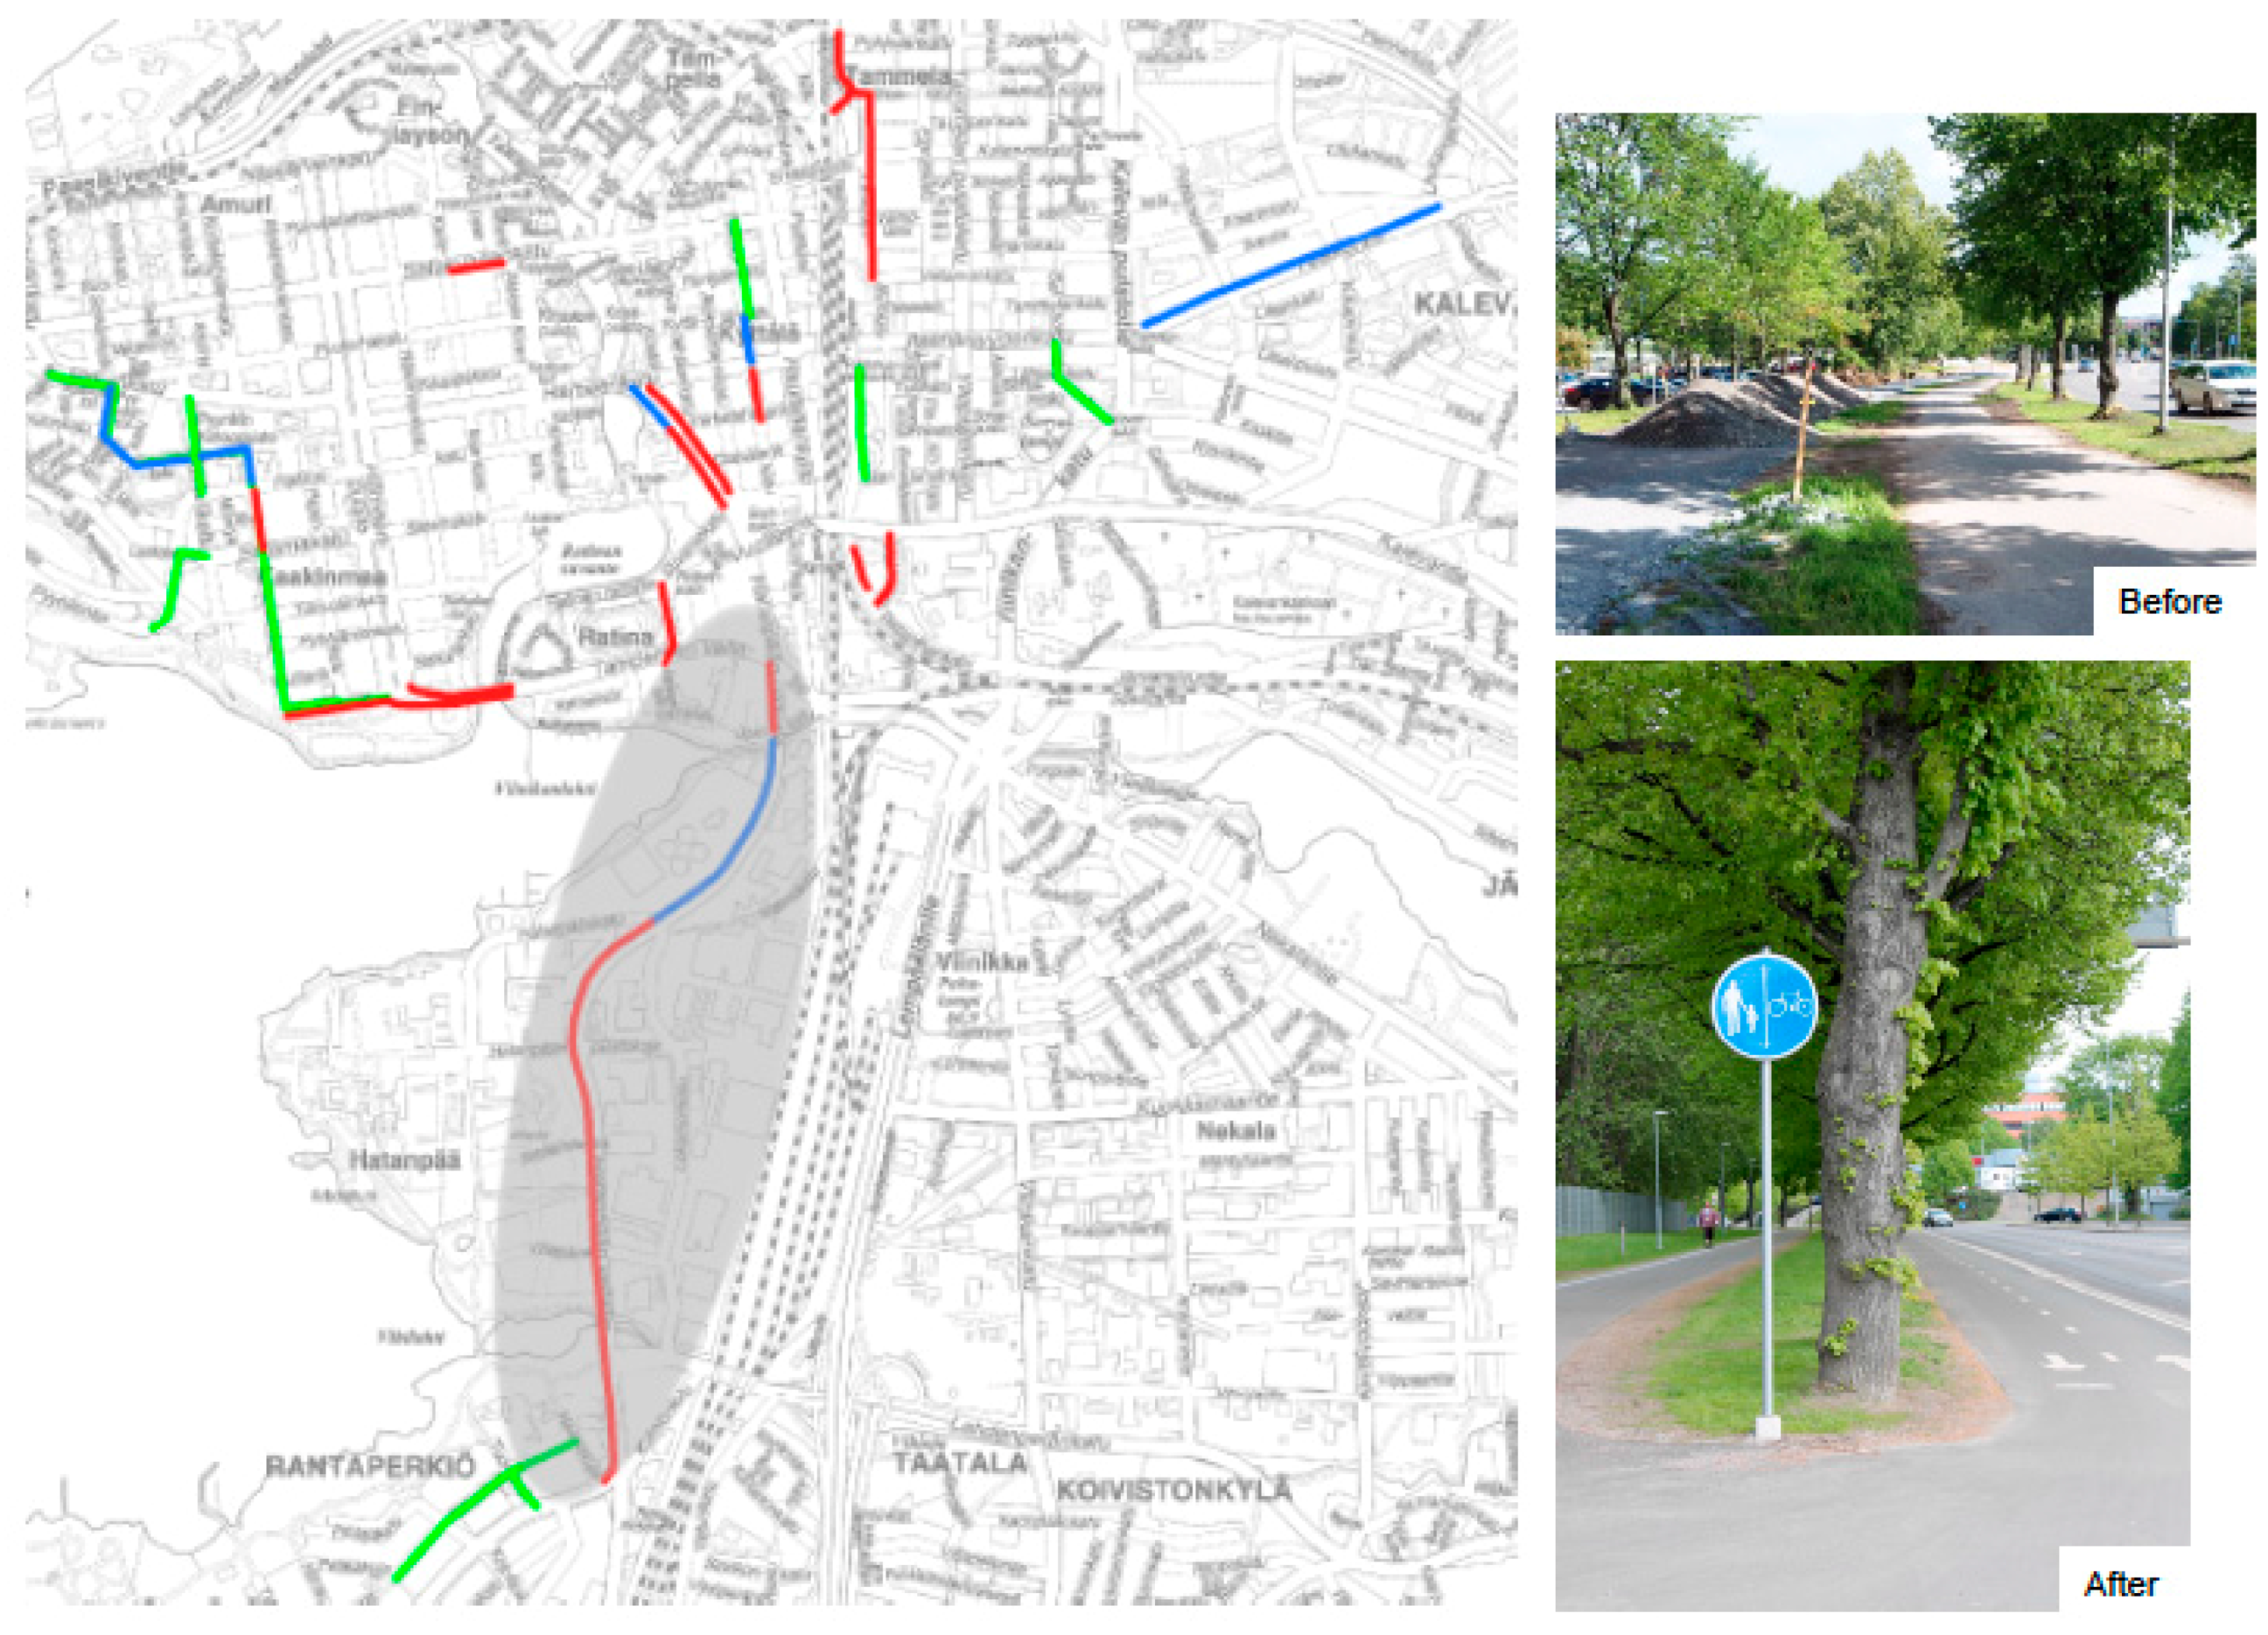
2.3.2. Environmental Strategies
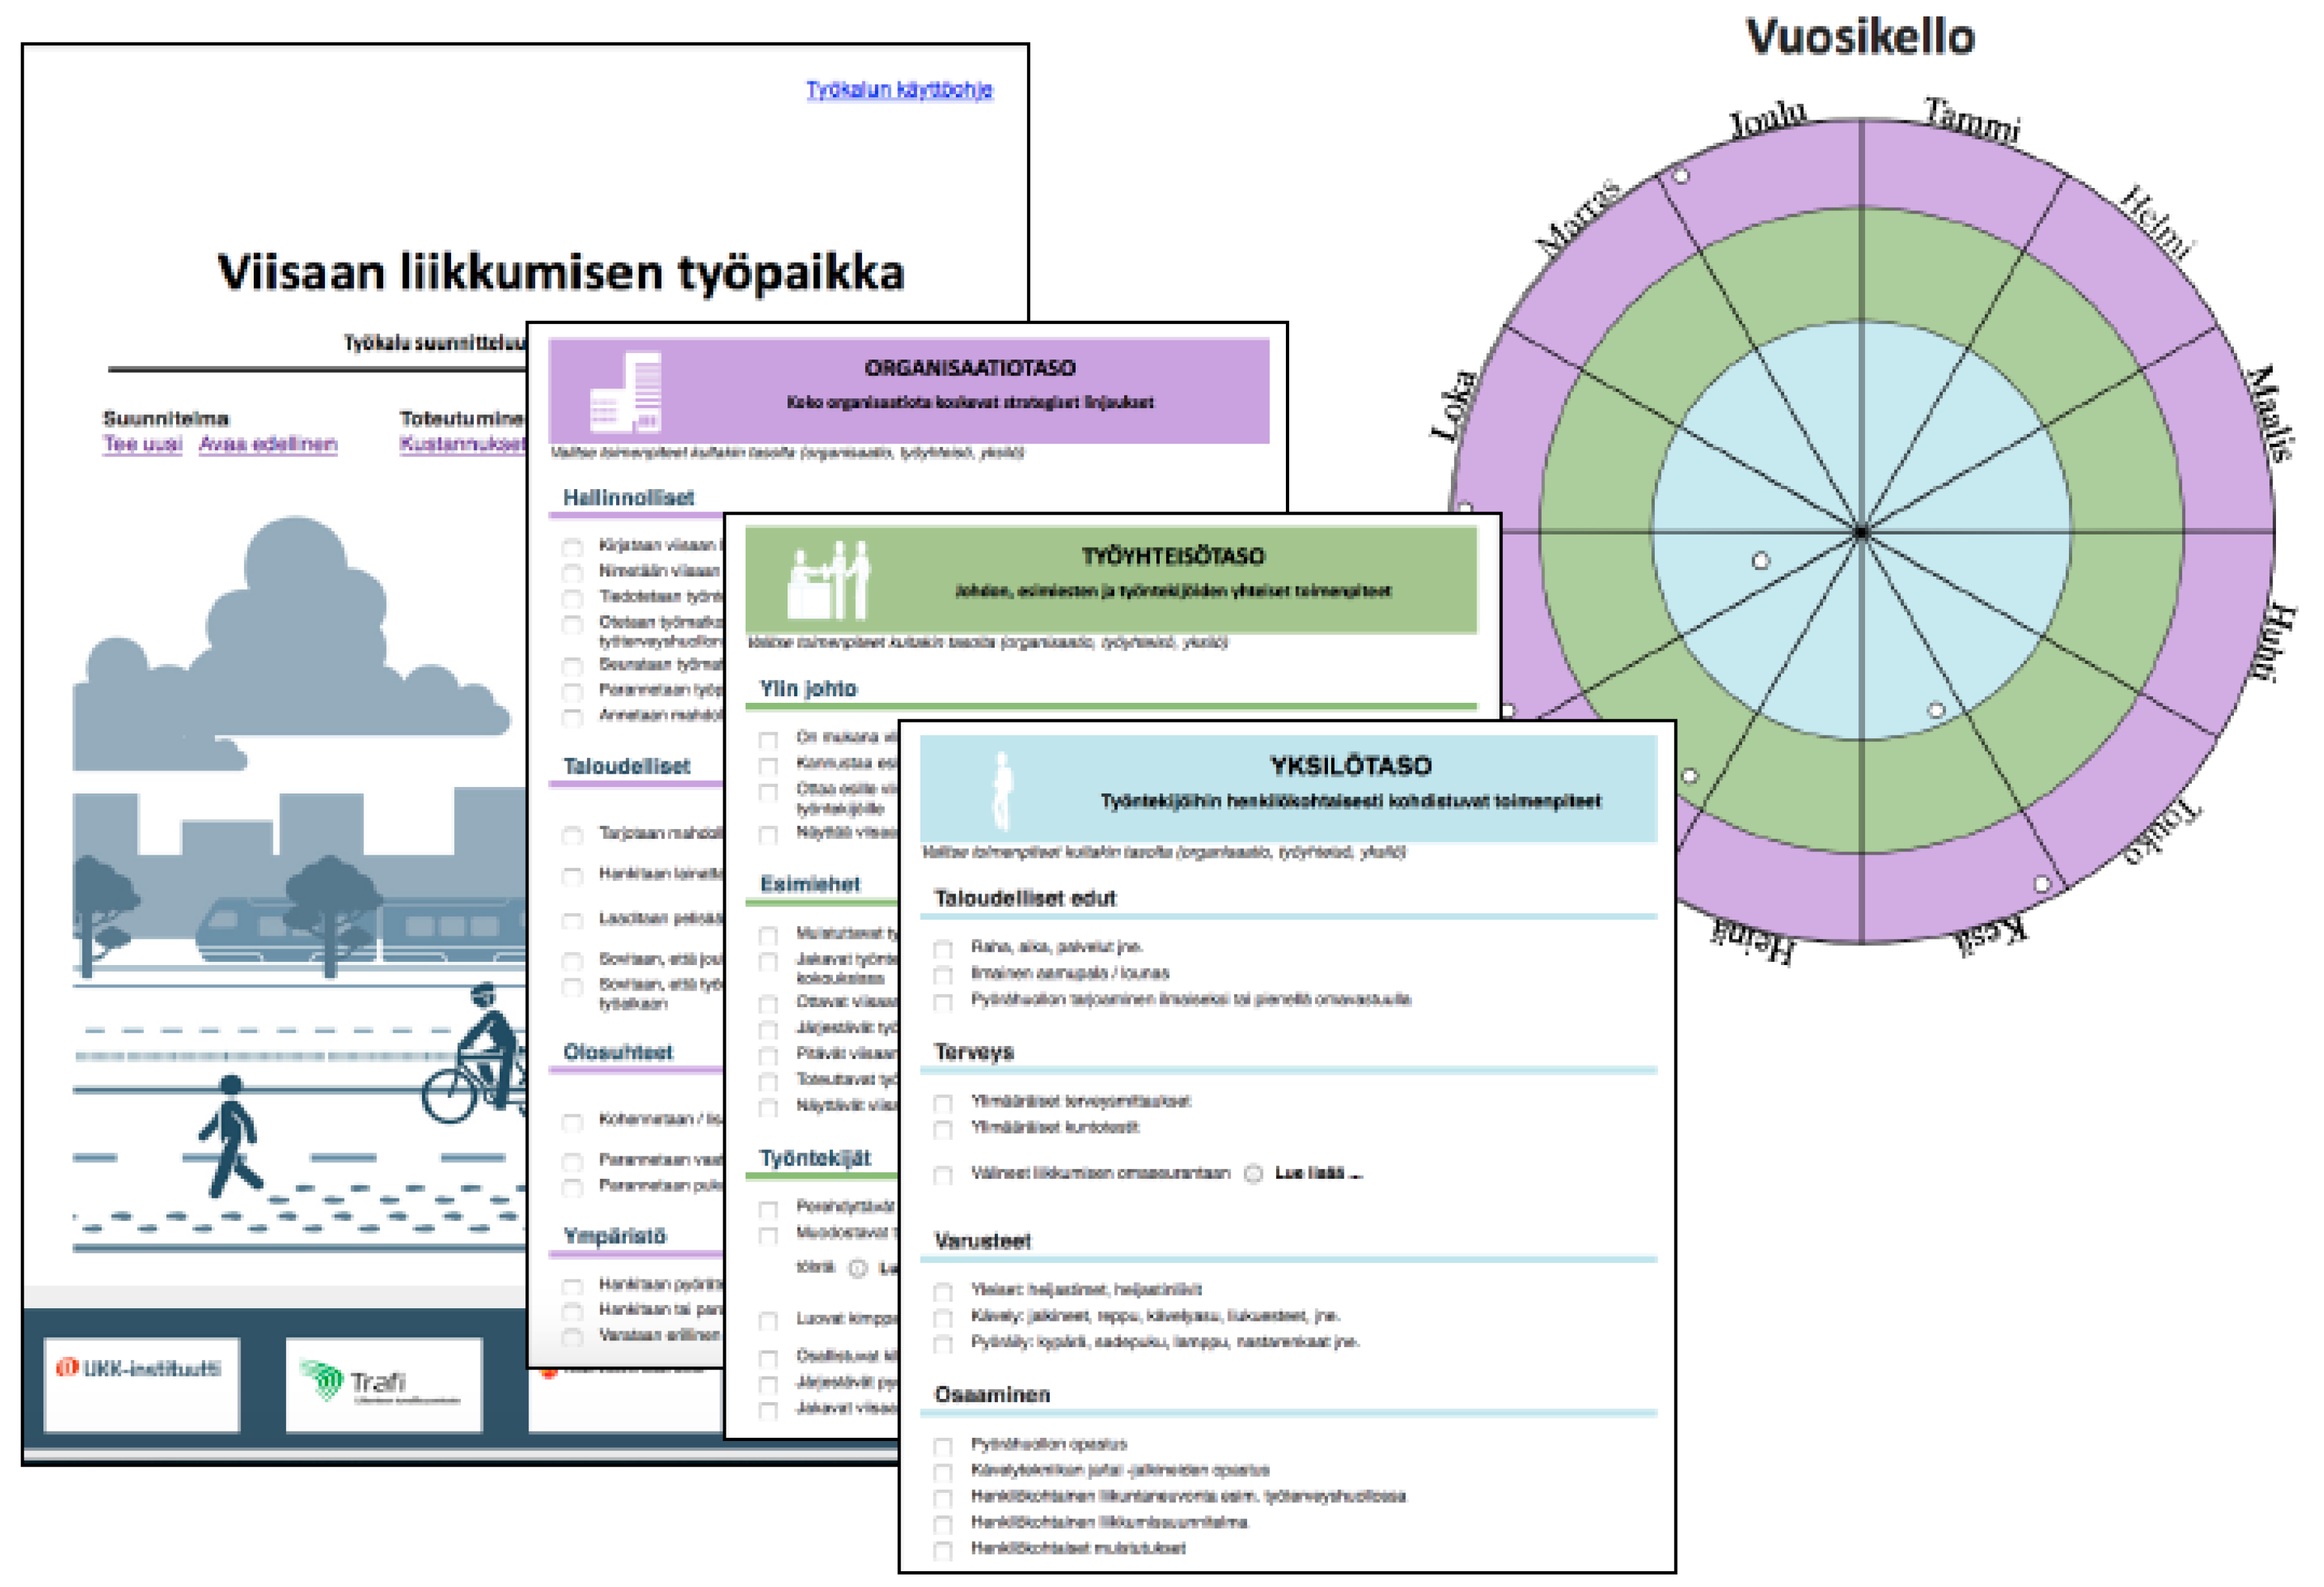
2.3.3. Social and Behavioral Strategies
2.4. Evaluation
2.4.1. Process Evaluation
2.4.2. Impact Evaluation
Primary Indicator
Secondary Indicators
2.4.3. Efficiency Evaluation
2.4.4. Environmental Evaluation
2.5. Statistics
3. Results
4. Discussion
4.1. Study Strengths
4.2. Study Limitations
4.3. Usability of the Findings
5. Conclusions
Acknowledgments
Author Contributions
Conflicts of Interest
References
- Ng, M.; Fleming, T.; Robinson, M.; Thomson, B.; Graetz, N.; Margono, C.; Mullany, E.C.; Biryukov, S.; Abbafati, C.; Abera, S.F.; et al. Global, regional, and national prevalence of overweight and obesity in children and adults during 1980–2013: A systematic analysis for the Global Burden of Disease Study 2013. Lancet 2014, 384, 766–781. [Google Scholar] [CrossRef]
- Lee, I.-M.; Shiroma, E.J.; Lobelo, F.; Puska, P.; Blair, S.N.; Kazmarzyk, P.T. for the Lancet Physical Activity Series Working Group. Effect of physical inactivity on major non-communicable diseases worldwide: An analysis of burden of disease and life expectancy. Lancet 2012, 380, 219–229. [Google Scholar] [CrossRef]
- Fogelholm, M. Physical activity, fitness and fatness: Relations to mortality, morbidity and disease risk factors. A systematic review. Obes. Rev. 2010, 11, 202–221. [Google Scholar] [CrossRef] [PubMed]
- Muka, T.; Imo, D.; Jaspers, L.; Colpani, V.; Chaker, L.; van der Lee, S.J.; Mendis, S.; Chowdhury, R.; Bramer, W.M.; Falla, A.; et al. The global impact of non-communicable diseases on healthcare spending and national income: A systematic review. Eur. J. Epidemiol. 2015, 30, 251–277. [Google Scholar] [CrossRef] [PubMed]
- Zadro, J.R.; Shirley, D.; Andrade, T.B.; Skurrah, K.J.; Bauman, A.; Ferreira, P.H. Physical Activity: Is it down to your genes? A systematic review and meta-analysis of twin and family studies. Sports Med. Open 2017, 3, 4. [Google Scholar] [CrossRef] [PubMed]
- WHO (World Health Organization). Global Health Risks: Mortality and Burden of Disease Attributable to Selected Major Risks; WHO: Geneva, Switzerland, 2009; Available online: http://www.who.int/healthinfo/global_burden_disease/GlobalHealthRisks_report_full.pdf (accessed on 25 September 2017).
- Foley, L.; Panter, J.; Heinen, E.; Prins, R.; Ogilvie, D. Changes in active commuting and changes in physical activity in adults: A cohort study. Int. J. Behav. Nutr. Phys. Act. 2015, 12, 161. [Google Scholar] [CrossRef] [PubMed]
- Sahlqvist, S.; Goodman, A.; Cooper, A.R.; Ogilvie, D. on behalf of the iConnect consortium. Change in active travel and changes in recreational and total physical activity in adults: Longitudinal findings from the iConnect study. Int. J. Behav. Nutr. Phys. Act. 2013, 10, 28. [Google Scholar] [CrossRef] [PubMed]
- Mueller, N.; Rojas-Rueda, D.; Cole-Hunter, T.; de Nazelle, A.; Dons, E.; Gerike, R.; Götschi, T.; Int Panis, L.; Kahlmeier, S.; Nieuwenhuijsen, M. Health impact assessment of active transportation: A systematic review. Prev. Med. 2015, 76, 103–114. [Google Scholar] [CrossRef] [PubMed]
- NICE. Walking and Cycling: Local Measures to Promote Walking and Cycling as Forms of Travel or Recreation. NICE Public Health Guidance 41. 2012. Available online: https://www.nice.org.uk/guidance/ph41/resources/physical-activity-walking-and-cycling-pdf-1996352901061 (accessed on 14 September 2017).
- Oja, P.; Titze, S.; Bauman, A.; de Geus, B.; Krenn, P.; Reger-Nash, B.; Kohlberger, T. Health benefits of cycling: A systematic review. Scand. J. Med. Sci. Sports 2011, 21, 496–509. [Google Scholar] [CrossRef] [PubMed]
- Saunders, L.E.; Green, J.M.; Petticrew, M.P.; Steinbach, R.; Roberts, H. What Are the Health Benefits of Active Travel? A systematic review of trials and cohort studies. PLoS ONE 2013, 8, e69912. [Google Scholar] [CrossRef] [PubMed]
- Martin, A.; Goryakin, Y.; Suhrcke, M. Does active commuting improve psychological wellbeing? Longitudinal evidence from eighteen waves of the British Household Panel Survey. Prev. Med. 2014, 69, 296–303. [Google Scholar] [CrossRef] [PubMed]
- Rissel, C.; Petrunoff, N.; Wen, L.M.; Crane, M. Travel to work and self-reported stress: Findings from a workplace survey in south west Sydney, Australia. J. Transp. Health 2014, 1, 50–53. [Google Scholar] [CrossRef]
- Giles-Corti, B.; Vernez-Moudon, A.; Reis, R.; Turrell, G.; Dannenberg, A.L.; Badland, H.; Foster, S.; Lowe, M.; Sallis, S.F.; Stevenson, M.; et al. City planning and population health: A global challenge. Lancet 2016, 388, 2912–2924. [Google Scholar] [CrossRef]
- Bauman, A.; Titze, S.; Rissel, C.; Oja, P. Changing gears: Bicycling as the panacea for physical inactivity? Br. J. Sports Med. 2011, 45, 761–762. [Google Scholar] [CrossRef] [PubMed]
- Koohsari, M.J.; Owen, N.; Cole, R.; Mavoa, S.; Oka, K.; Hanibuchi, T.; Sugiyama, T. Built environmental factors and adults’ travel behaviors: Role of street layout and local destinations. Prev. Med. 2017, 96, 124–128. [Google Scholar] [CrossRef] [PubMed]
- Panter, J.; Heinen, E.; Mackett, R.; Ogilvie, D. Impact of new transport infrastructure on walking, cycling, and physical activity. Am. J. Prev. Med. 2016, 50, e45–e53. [Google Scholar] [CrossRef] [PubMed]
- Adams, E.J.; Bull, F.C.; Foster, C.E. Are perceptions of the environment in the workplace “neighborhood” associated with commuter walking? J. Transp. Health 2016, 3, 479–484. [Google Scholar] [CrossRef] [Green Version]
- Prins, R.G.; Panter, J.; Heinen, E.; Griffin, S.J.; Ogilvie, D.B. Causal pathways linking environmental change with health behavior change: Natural experimental study of new transport infrastructure and cycling to work. Prev. Med. 2016, 87, 175–182. [Google Scholar] [CrossRef] [PubMed]
- Bopp, M.; Kaczynski, A.T.; Campbell, M.E. Social ecological influences on work-related active commuting among adults. Am. J. Health Behav. 2013, 37, 543–554. [Google Scholar] [CrossRef] [PubMed]
- Campbell, M.E.; Bopp, M. An examination of the relationship of interpersonal influences with walking and biking to work. J. Public Health Manag. Pract. 2013, 19, 521–524. [Google Scholar] [CrossRef] [PubMed]
- Feuillet, T.; Charreire, H.; Menai, M.; Salze, P.; Simon, C.; Dugas, J.; Hercberg, S.; Andreeva, V.A.; Enaux, C.; Weber, C.; et al. Spatial heterogeneity of the relationships between environmental characteristics and active commuting: Towards a locally varying social ecological model. Int. J. Health Geogr. 2015, 14, 12. [Google Scholar] [CrossRef] [PubMed]
- Panter, J.; Desousa, C.; Ogilvie, D. Incorporating walking or cycling into car journeys to and from work: The role of individual, workplace and environmental characteristics. Prev. Med. 2013, 56, 211–217. [Google Scholar] [CrossRef] [PubMed]
- McLeroy, K.R.; Bibeau, D.; Steckler, A.; Glanz, K. An ecological perspective on health promotion programs. Health Educ. Behav. 1988, 15, 351–377. [Google Scholar] [CrossRef]
- Stokols, D.; Allen, J.; Bellingham, R.L. The social ecology of health promotion: Implications for research and practice. Am. J. Health Promot. 1996, 10, 247–251. [Google Scholar] [CrossRef] [PubMed]
- Sallis, J.F.; Owen, N.; Fisher, E.B. Ecological models of health behavior. In Health Behavior and Health Education: Theory, Research, and Practice; Glanz, K., Rimer, B.K., Viswanath, K., Eds.; Wiley, Jossey-Bass: San Francisco, CA, USA, 2008; pp. 465–482. [Google Scholar]
- Golden, S.D.; Earp, J.A.L. Social ecological approaches to individuals and their contexts: Twenty years of Health Education & Behavior health promotion interventions. Health Educ. Behav. 2012, 39, 364–372. [Google Scholar] [PubMed]
- Arnott, B.; Rehackova, L.; Errington, L.; Sniehotta, F.F.; Roberts, J.; Araujo-Soares, V. Efficacy of behavioural interventions for transport behaviour change: Systematic review, meta-analysis and intervention coding. Int. J. Behav. Nutr. Phys. Act. 2014, 11, 133. [Google Scholar] [CrossRef] [PubMed]
- Götschi, T.; de Nazelle, A.; Brand, C.; Gerike, R. Towards a comprehensive conceptual framework of active travel behavior: A review and synthesis of published frameworks. Curr. Environ. Health Rep. 2017, 4, 286–295. [Google Scholar] [CrossRef] [PubMed]
- Aittasalo, M.; Livson, M.; Lusa, S.; Romo, A.; Vähä-Ypyä, H.; Tokola, K.; Sievänen, H.; Mänttäri, A.; Vasankari, T. Moving to business-changes in physical activity and sedentary behavior after multilevel intervention in small and medium sized workplaces. BMC Public Health 2017, 17, 319. [Google Scholar] [CrossRef] [PubMed]
- Vähä-Ypyä, H.; Vasankari, T.; Husu, P.; Suni, J.; Sievänen, H. A universal, accurate intensity-based classification of different physical activities using raw data of accelerometer. Clin. Physiol. Funct. Imaging 2015, 35, 64–70. [Google Scholar] [CrossRef] [PubMed]
- Vähä-Ypyä, H.; Vasankari, T.; Husu, P.; Mänttäri, A.; Vuorimaa, T.; Suni, J.; Sievänen, H. Validation of cut-points for evaluating the intensity of physical activity with accelerometry-based mean amplitude deviation (MAD). PLoS ONE 2015, 10, e0134813. [Google Scholar] [CrossRef] [PubMed]
- Lundberg, O.; Manderbacka, K. Assessing reliability of a measure of self-rated health. Scand. J. Soc. Med. 1996, 24, 218–224. [Google Scholar] [CrossRef] [PubMed]
- Martikainen, P.; Aromaa, A.; Heliövaara, M.; Klaukka, T.; Knekt, P.; Maatela, J.; Lahelma, E. Reliability of perceived health by sex and age. Soc. Sci. Med. 1999, 48, 1117–1122. [Google Scholar] [CrossRef]
- Baćak, V.; Ólafsdóttir, S. Gender and validity of self-rated health in nineteen European Countries. Scand. J. Public Health 2017, 45, 647–653. [Google Scholar] [CrossRef] [PubMed]
- Heistaro, S.; Jousilahti, P.; Lahelma, E.; Vartiainen, E.; Puska, P. Self rated health and mortality: A long term prospective study in eastern Finland. J. Epidemiol. Community Health 2001, 55, 227–232. [Google Scholar] [CrossRef] [PubMed]
- Tuomi, K.; Ilmarinen, J.; Eskelinen, L.; Järvinen, E.; Toikkanen, J.; Klockars, M. Prevalence and incidence rates of diseases and work ability in different work categories of municipal occupations. Scand. J. Work Environ. Health 1991, 17 (Suppl. 1), 67–74. [Google Scholar] [PubMed]
- Eskelinen, L.; Kohvakka, A.; Merisalo, T.; Hurru, H.; Wägar, G. Relationship between the self-assessment and clinical assessment of health status and work ability. Scand. J. Work Environ. Health 1991, 17 (Suppl. 1), 40–47. [Google Scholar] [PubMed]
- Reeuwijk, K.G.; Robroek, S.J.W.; Niessen, M.A.J.; Kraaijenhaagen, R.A.; Vergouwe, Y.; Burdorf, A. The prognostic value of the work ability index for sickness absence among office workers. PLoS ONE 2015, 10, e0126969. [Google Scholar] [CrossRef] [PubMed]
- Kinnunen, U.; Feldt, T.; Siltaloppi, M.; Sonnentag, S. Job-demands resources model in the context of recovery: Testing recovery experiences as mediators. Eur. J. Work Organ. Psychol. 2011, 20, 805–832. [Google Scholar] [CrossRef]
- PRESTO Cycling Policy Guide. Cycling Infrastructure. Available online: https://ec.europa.eu/energy/intelligent/projects/sites/iee-projects/files/projects/documents/presto_policy_guide_cycling_infrastructure_en.pdf (accessed on 28 September 2017).
- Cycling-Inclusive Policy Development. A Handbook. Available online: http://www.fietsberaad.nl/library/repository/bestanden/Cycling-handbook_secure.pdf (accessed on 28 September 2017).
- Stinson, M.; Bhat, C. Frequency of bicycle commuting: Internet-based survey analysis. Transp. Res. Board 2004, 1878, 122130. [Google Scholar] [CrossRef]
- Bernardi, S.; Rupi, F. An analysis of bicycle travel speed and disturbances on off-street and on-street facilities. Transp. Res. Procedia 2015, 5, 82–94. [Google Scholar] [CrossRef]
- Hoffmann, M.; Mock, M.; May, M. Road-quality classification and bump detection with bicycle-mounted smartphones. In Proceedings of the 23rd International Joint Conference on Artificial Intelligence, Beijing, China, 3–9 August 2013; Available online: http://ceur-ws.org/Vol-1088/ProceedingsUDMIJCAI2013.pdf#page=44 (accessed on 28 September 2017).
- Carmona, M.; Heath, T.; Oc, T.; Tiesdell, S. Public Places-Urban Spaces. The Dimensions of Urban Design; Architectural Press: Oxford, UK, 2003; pp. 61–86. [Google Scholar]
- Boone-Heinonen, J.; Evenson, K.R.; Song, Y.; Gordon-Larsen, P. Built and socioeconomic environments: Patterning and associations with physical activity in U.S. adolescents. Int. J. Behav. Nutr. Phys. Act. 2010, 7, 45. [Google Scholar] [CrossRef] [PubMed]
- Robroek, S.J.W.; van Lenthe, F.J.; van Empelen, P.; Burdorf, A. Determinants of participation in worksite health promotion programmes: A systematic review. Int. J. Behav. Nutr. Phys. Act. 2009. [Google Scholar] [CrossRef] [PubMed]
- Helldán, A.; Helakorpi, S. Health Behaviour and Health among the Finnish Adult Population, Spring 2014. Available online: http://www.julkari.fi/bitstream/handle/10024/126023/URN_ISBN_978-952-302-447-2.pdf?sequence=1 (accessed on 25 September 2017).


| Evaluation Questions/Indicators | Measurement Points 1 | Measures | ||
|---|---|---|---|---|
| M1 | M2 | M3 | ||
| Process evaluation | ||||
| What percentage of potentially eligible employees took part and how representative were they? | X | X | X | Employee questionnaire |
| What percentage of workplaces volunteered and how representative were they? | X | X | X | Documentation during the recruitment |
| Management questionnaire | ||||
| To what extent did the environmental strategies succeed as intended in Area 1? | X | Monitoring and supervision by the authorities of City of Tampere | ||
| To what extent did the employees in Area 1 pay attention to the environmental strategies? | X | Employee questionnaire | ||
| To what extent were the social and behavioral strategies planned and delivered as intended? | X | Researchers’ visits to the workplaces | ||
| Workbooks completed by the workplaces | ||||
| Employee questionnaire | ||||
| Impact evaluation | ||||
| Primary indicator | ||||
| X | X | X | Employee questionnaire, accelerometer, travel diary |
| Secondary indicators | ||||
| X | X | X | Employee questionnaire |
| X | X | X | |
| X | X | ||
| X | X | X | |
| X | X | X | |
| X | X | X | Traffic calculations |
| X | X | Auditing: cycling with GPS | |
| Efficiency evaluation | ||||
| X | X | Cost-effectiveness ratio | |
| X | X | Health Economic Assessment Tool for walking and cycling (HEAT) | |
| Environmental mediators and moderators | ||||
| What urban environmental variables and types promote active commuting to work? | X | X | Employee questionnaire, Smartphone App, Map-based questionnaire | |
| Which urban environmental variables and types mediate and moderate the effects of environmental strategies? | X | |||
| Workplace | Field of Activity | Employees n (% of Area’s Subtotal) | Respondents n (% of Employees) | Accelerometer n (% of Employees) | |
|---|---|---|---|---|---|
| Area 1 | |||||
| 1 | Infrastructure | 54 (3.0) | 34 (63.0) | 27 (50.0) | |
| 2 | Engineering & consulting | 44 (2.4) | 27 (61.4) | 18 (40.9) | |
| 3 | Technology industries | 359 (19.7) | 206 (57.4) | 54 (15.0) | |
| 4 | Mobile networks | 276 (15.1) | 109 (39.5) | 78 (28.3) | |
| 5 | Public administration | 323 (17.7) | 204 (63.2) | 101 (31.3) | |
| 6 | Health care | 138 (7.6) | 97 (70.3) | 100 (72.5) | |
| 7 | Social services | 171 (9.4) | 56 (32.7) | 63 (36.8) | |
| 8 | Information technology | 117 (6.4) | 50 (42.7) | 50 (42.7) | |
| 9 | Forest industries | 100 (5.5) | 53 (53.0) | 54 (54.0) | |
| 10 | Telecommunication | 213 (11.7) | 60 (28.2) | 61 (28.6) | |
| 11 | Mobile software | 28 (1.5) | 14 (50.0) | 19 (67.9) | |
| Subtotal | 1823 (100) | 910 (49.9) | 724 (39.7) | ||
| Area 2 | |||||
| 1 | Technical research | 251 (30.4) | 70 (27.9) | 43 (17.1) | |
| 2 | Technology university | 175 (21.2) | 26 (14.9) | 30 (17.1) | |
| 3 | Vocational school | 177 (21.4) | 38 (21.5) | 26 (14.7) | |
| 4 | Software development | 63 (7.6) | 33 (52.4) | 36 (57.1) | |
| 5 | College | 160 (19.4) | 63 (39.4) | 59 (36.9) | |
| Subtotal | 826 (100) | 230 (27.8) | 194 (23.5) | ||
| Total | 2652 | 1144 (43.1) | 918 (34.6) | ||
| Baseline Characteristics of the Employees | Area 1 (n = 910) | Area 2 (n = 230) |
|---|---|---|
| Age in years, mean (SD) | 44.5 (32.3) | 44.1 (11.4) |
| Age-group, n (%) | ||
| 111 (12.4) | 32 (14.0) |
| 397 (44.4) | 90 (39.9) |
| 221 (24.7) | 60 (26.2) |
| 165 (18.5) | 47 (20.5) |
| Women, n (%) | 476 (52.7) | 125 (54.3) |
| Married, n (%) | 715 (79.2) | 166 (72.8) |
| Caretaker to children under 18 years of age, n (%) | 388 (43.7) | 81 (35.8) |
| Education, n (%) | ||
| 57 (6.3) | 10 (4.3) |
| 455 (50.3) | 70 (30.4) |
| 388 (42.9) | 150 (65.2) |
| 4 (0.4) | 0 |
| Working hours, n (%) | ||
| 800 (88.8) | 200 (87.3) |
| 33 (3.7) | 5 (2.2) |
| 11 (1.2) | 7 (3.1) |
| 34 (3.8) | 11 (4.8) |
| 23 (2.6) | 6 (2.6) |
| Type of work, n (%) | ||
| 760 (84.1) | 200 (87.0) |
| 79 (8.7) | 22 (9.6) |
| 49 (5.4) | 7 (3.0) |
| 15 (1.7) | 1 (0.4) |
| Body mass index (kg/m2), mean (SD) | 25.6 (3.9) | 25.1 (4.3) |
| Body mass index > 25, n (%) | 439 (49.1) | 91 (40.8) |
| Smoking; yes, n (%) | 68 (7.6) | 12 (5.3) |
| Baseline Information on the Primary Indicator | Area 1 | Area 2 |
|---|---|---|
| Employee questionnaire | n = 909 | n = 230 |
| Kilometers from home to work, mean (SD) | 14.7 (17.3) | 13.3 (20.8) |
| Primary mean of transportation to work, n (%) | ||
| 545 (60.0) | 118 (51.8) |
| 123 (13.5) | 26 (11.4) |
| 3 (0.3) | 2 (0.9) |
| 9 (1.0) | 0 |
| 53 (5.8) | 32 (14.0) |
| 174 (19.1) | 47 (20.6) |
| 2 (0.2) | 3 (1.3) |
| Primary mean of transportation from work, n (%) | ||
| 536 (59.2) | 117 (51.1) |
| 121 (13.4) | 27 (11.8) |
| 4 (0.4) | 2 (0.9) |
| 9 (1.0) | 0 |
| 58 (6.4) | 34 (14.8) |
| 176 (19.4) | 47 (20.5) |
| 2 (0.2) | 2 (0.9) |
| Number of days per week actively commuting the whole journey to and from work, mean (SD) | ||
| 0.4 (1.1) | 0.8 (1.7) |
| 1.0 (1.7) | 1.0 (1.7) |
| Number of days per week walking part of the journey to work, mean (SD) | 0.9 (1.7) | 1.3 (2.0) |
| 0.8 (1.4) | 0.6 (1.3) |
| 7.5 (12.1) | 5.8 (9.6) |
| Number of days per week bicycling part of the journey to work, mean (SD) | 0.9 (1.7) | 1.0 (1.7) |
| 2.5 (4.2) | 2.1 (4.1) |
| 8.8 (12.8) | 7.3 (13.4) |
| Number of days per week walking part of the journey from work, mean (SD) | 0.9 (1.7) | 1.3 (2.0) |
| 0.8 (1.4) | 0.7 (1.3) |
| 8.2 (13.0) | 6.1 (10.0) |
| Number of days per week bicycling part of the journey from work, mean (SD) | 1.0 (1.8) | 1.0 (1.7) |
| 2.5 (4.2) | 2.1 (4.2) |
| 9.4 (13.6) | 7.2 (13.5) |
| Accelerometer and travel diary 1 | n = 240 (to) n = 267 (from) | n = 87 (to) n = 103 (from) |
| Daily minutes of active commuting to work, mean (SD) | 11.6 (9.7) | 11.3 (9.6) |
| Daily minutes of active commuting from work, mean (SD) | 26.3 (15.8) | 25.0 (18.3) |
| Baseline Information on the Secondary Indicators | Area 1 | Area 2 | |
|---|---|---|---|
| Employee questionnaire | n = 909 | n = 230 | |
| Self-rated health; fairly good or good, n (%) | 678 (75.6) | 183 (79.6) | |
| Subjective wellbeing at work | |||
| 8.6 (1.1) | 8.5 (1.2) | |
| 769 (85.0) | 202 (88.2) | |
| 774 (85.6) | 190 (83.3) | |
| 856 (94.8) | 212 (92.6) | |
| 63 (7.0) | 12 (5.2) | |
| 698 (77.3) | 170 (74.9) | |
| Number of factors restricting or preventing active commuting to work somewhat or completely, mean (SD) | |||
| 3.4 (2.5) | 3.2 (2.6) | |
| 1.7 (1.9) | 1.1 (1.7) | |
| 2.0 (1.9) | 2.5 (2.1) | |
| 5.4 (3.6) | 5.5 (3.7) | |
| Motivation for active commuting to work | |||
| 352 (43.2) | 91 (49.5) | |
| 528 (61.8) | 137 (71.7) | |
| 540 (61.5) | 116 (59.5) | |
| 567 (65.2) | 126 (64.3) | |
| 1.4 (1.8) | 2.1 (1.9) | |
| 1.7 (1.9) | 2.0 (1.7) | |
| Number of employees reporting injuries due to active work commuting, mean (SD) | 18 (2.0) | 8 (3.6) | |
| Traffic calculations (Area 1 only) | |||
| Number of pedestrians (Ped) and cyclists (Cyc) trespassing the main walking and cycling trail during the afternoon peak hour | Ped | Cyc | - |
| 78 | 186 | - |
| 34 | 160 | - |
| 133 | 166 | - |
| 64 | 134 | - |
| Auditing | |||
| |||
| 14.3 | 14.8 | |
| 0.97 | 0.85 | |
| 0.07 | 0.15 | |
© 2017 by the authors. Licensee MDPI, Basel, Switzerland. This article is an open access article distributed under the terms and conditions of the Creative Commons Attribution (CC BY) license (http://creativecommons.org/licenses/by/4.0/).
Share and Cite
Aittasalo, M.; Tiilikainen, J.; Tokola, K.; Seimelä, T.; Sarjala, S.-M.; Metsäpuro, P.; Hynynen, A.; Suni, J.; Sievänen, H.; Vähä-Ypyä, H.; et al. Socio-Ecological Intervention to Promote Active Commuting to Work: Protocol and Baseline Findings of a Cluster Randomized Controlled Trial in Finland. Int. J. Environ. Res. Public Health 2017, 14, 1257. https://0-doi-org.brum.beds.ac.uk/10.3390/ijerph14101257
Aittasalo M, Tiilikainen J, Tokola K, Seimelä T, Sarjala S-M, Metsäpuro P, Hynynen A, Suni J, Sievänen H, Vähä-Ypyä H, et al. Socio-Ecological Intervention to Promote Active Commuting to Work: Protocol and Baseline Findings of a Cluster Randomized Controlled Trial in Finland. International Journal of Environmental Research and Public Health. 2017; 14(10):1257. https://0-doi-org.brum.beds.ac.uk/10.3390/ijerph14101257
Chicago/Turabian StyleAittasalo, Minna, Johanna Tiilikainen, Kari Tokola, Timo Seimelä, Satu-Maaria Sarjala, Pasi Metsäpuro, Ari Hynynen, Jaana Suni, Harri Sievänen, Henri Vähä-Ypyä, and et al. 2017. "Socio-Ecological Intervention to Promote Active Commuting to Work: Protocol and Baseline Findings of a Cluster Randomized Controlled Trial in Finland" International Journal of Environmental Research and Public Health 14, no. 10: 1257. https://0-doi-org.brum.beds.ac.uk/10.3390/ijerph14101257