Exposure to Night-Time Traffic Noise, Melatonin-Regulating Gene Variants and Change in Glycemia in Adults

 , , , , , ,

Abstract
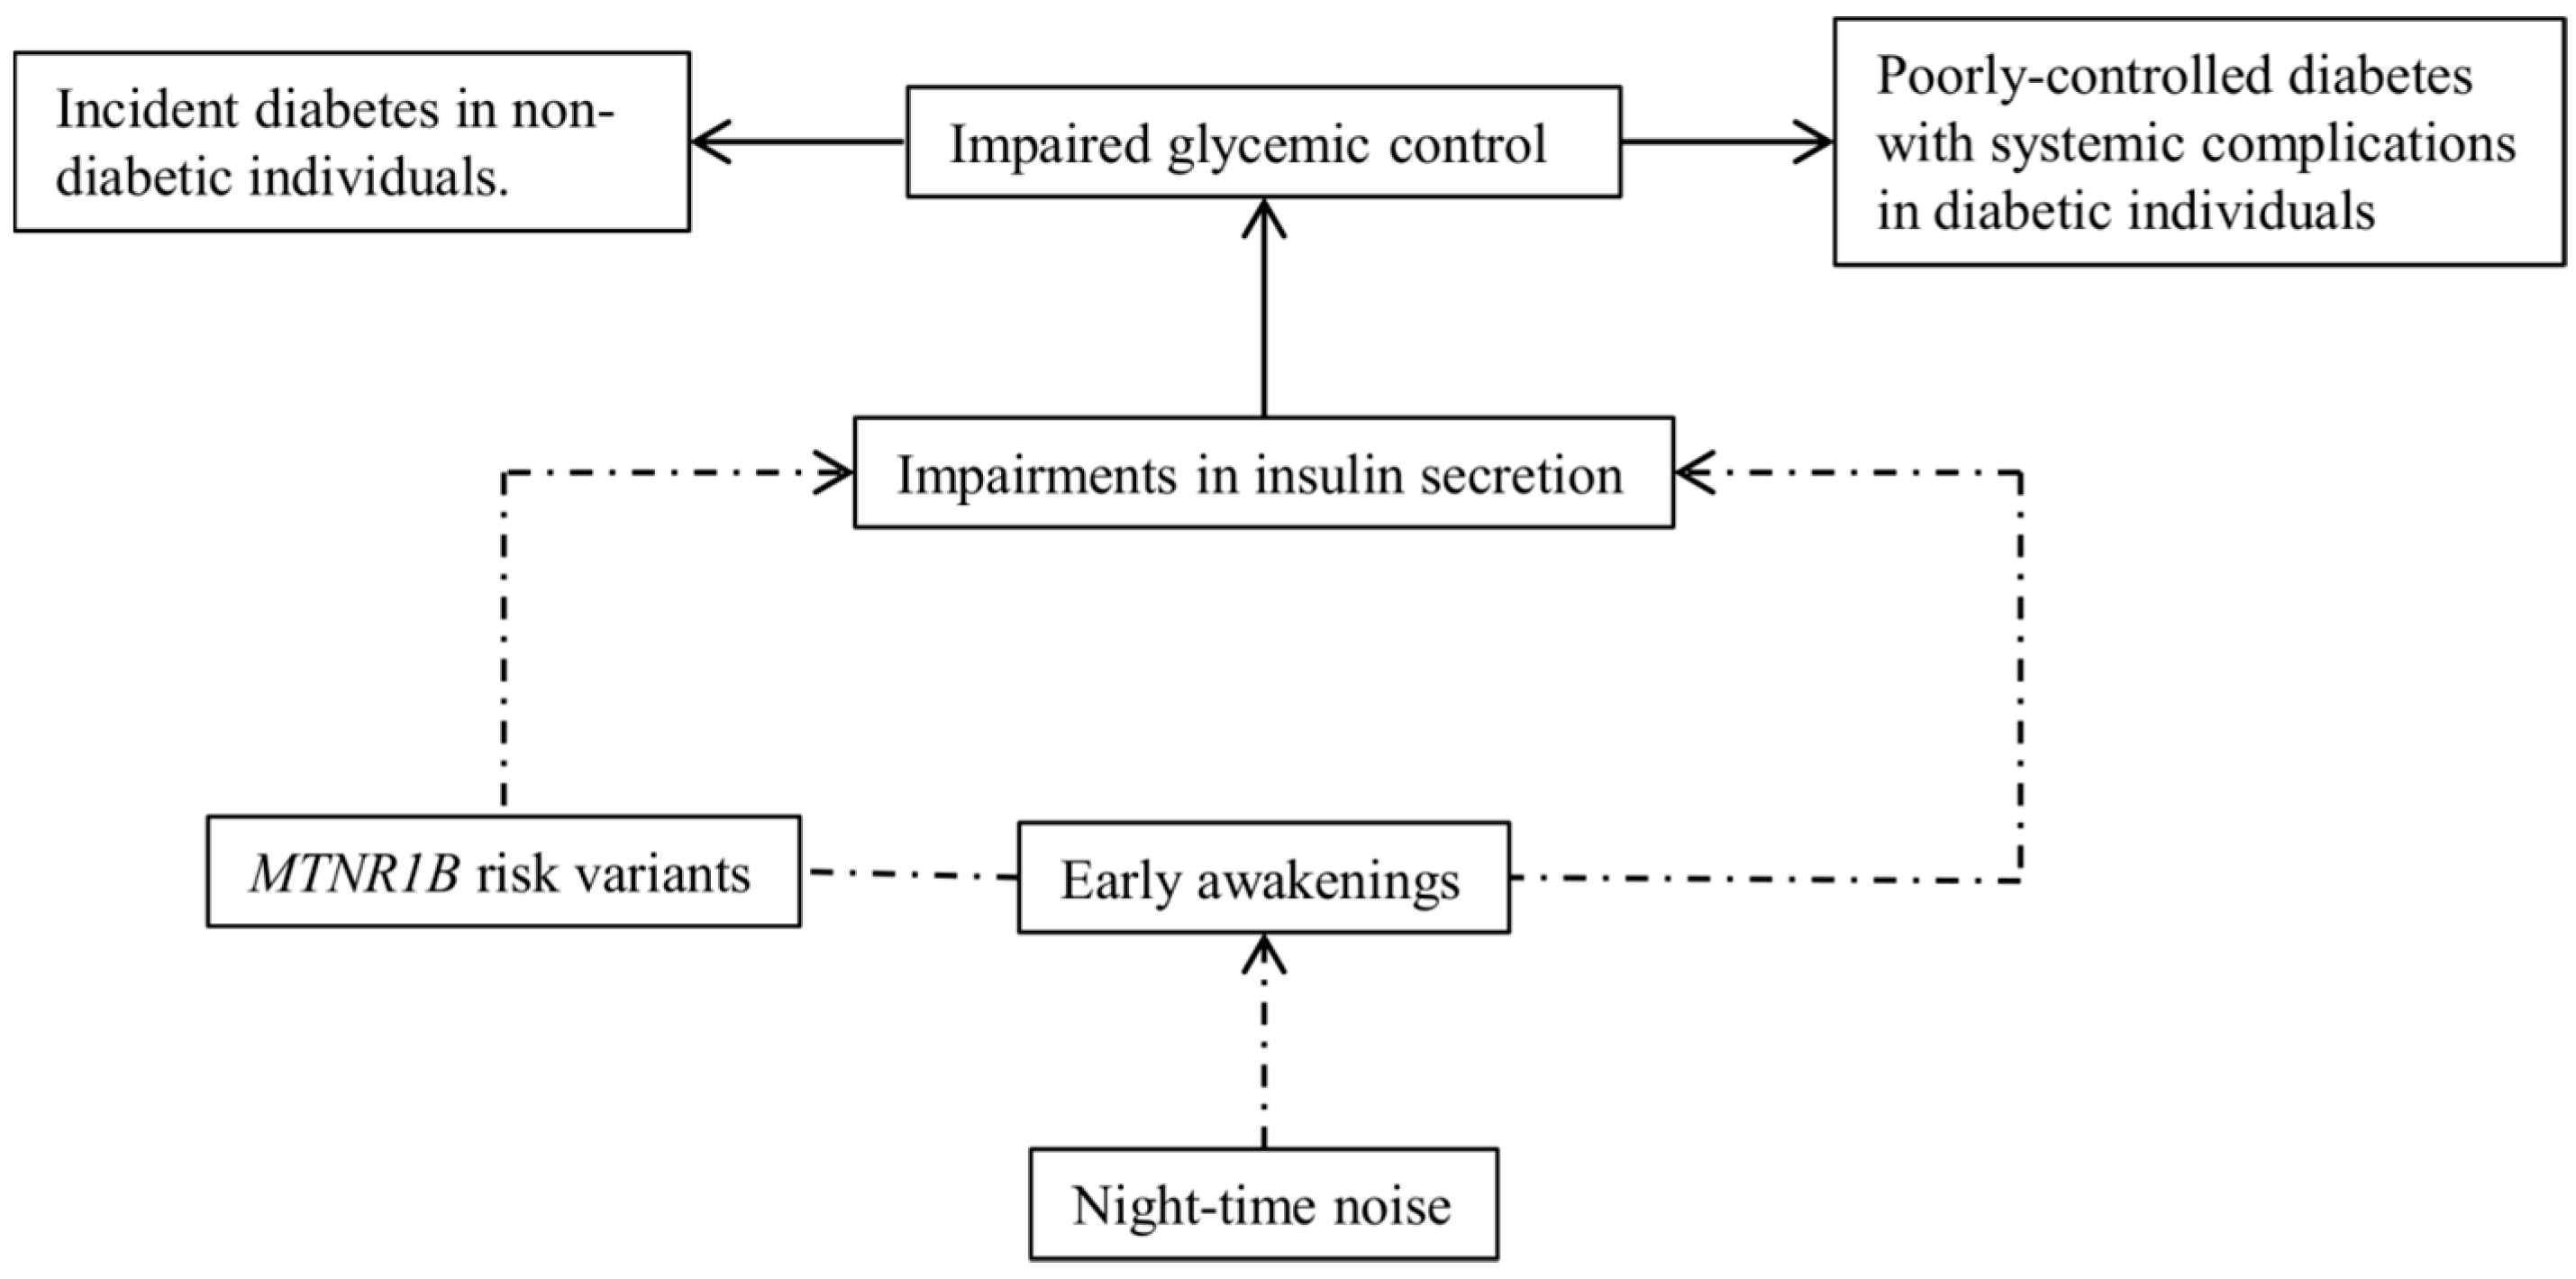
:1. Introduction
2. Materials and Methods
2.1. Study Population
2.2. Measurement of HbA1c and Identification of Diabetes Cases
2.3. Exposures
2.4. Potential Confounders
2.5. MTNR1B Gene Score
2.6. Statistical Analyses
3. Results
3.1. Characteristics of Participants
3.2. Associations between RTN and ΔHbA1c
3.3. Associations between MGRS and ΔHbA1c
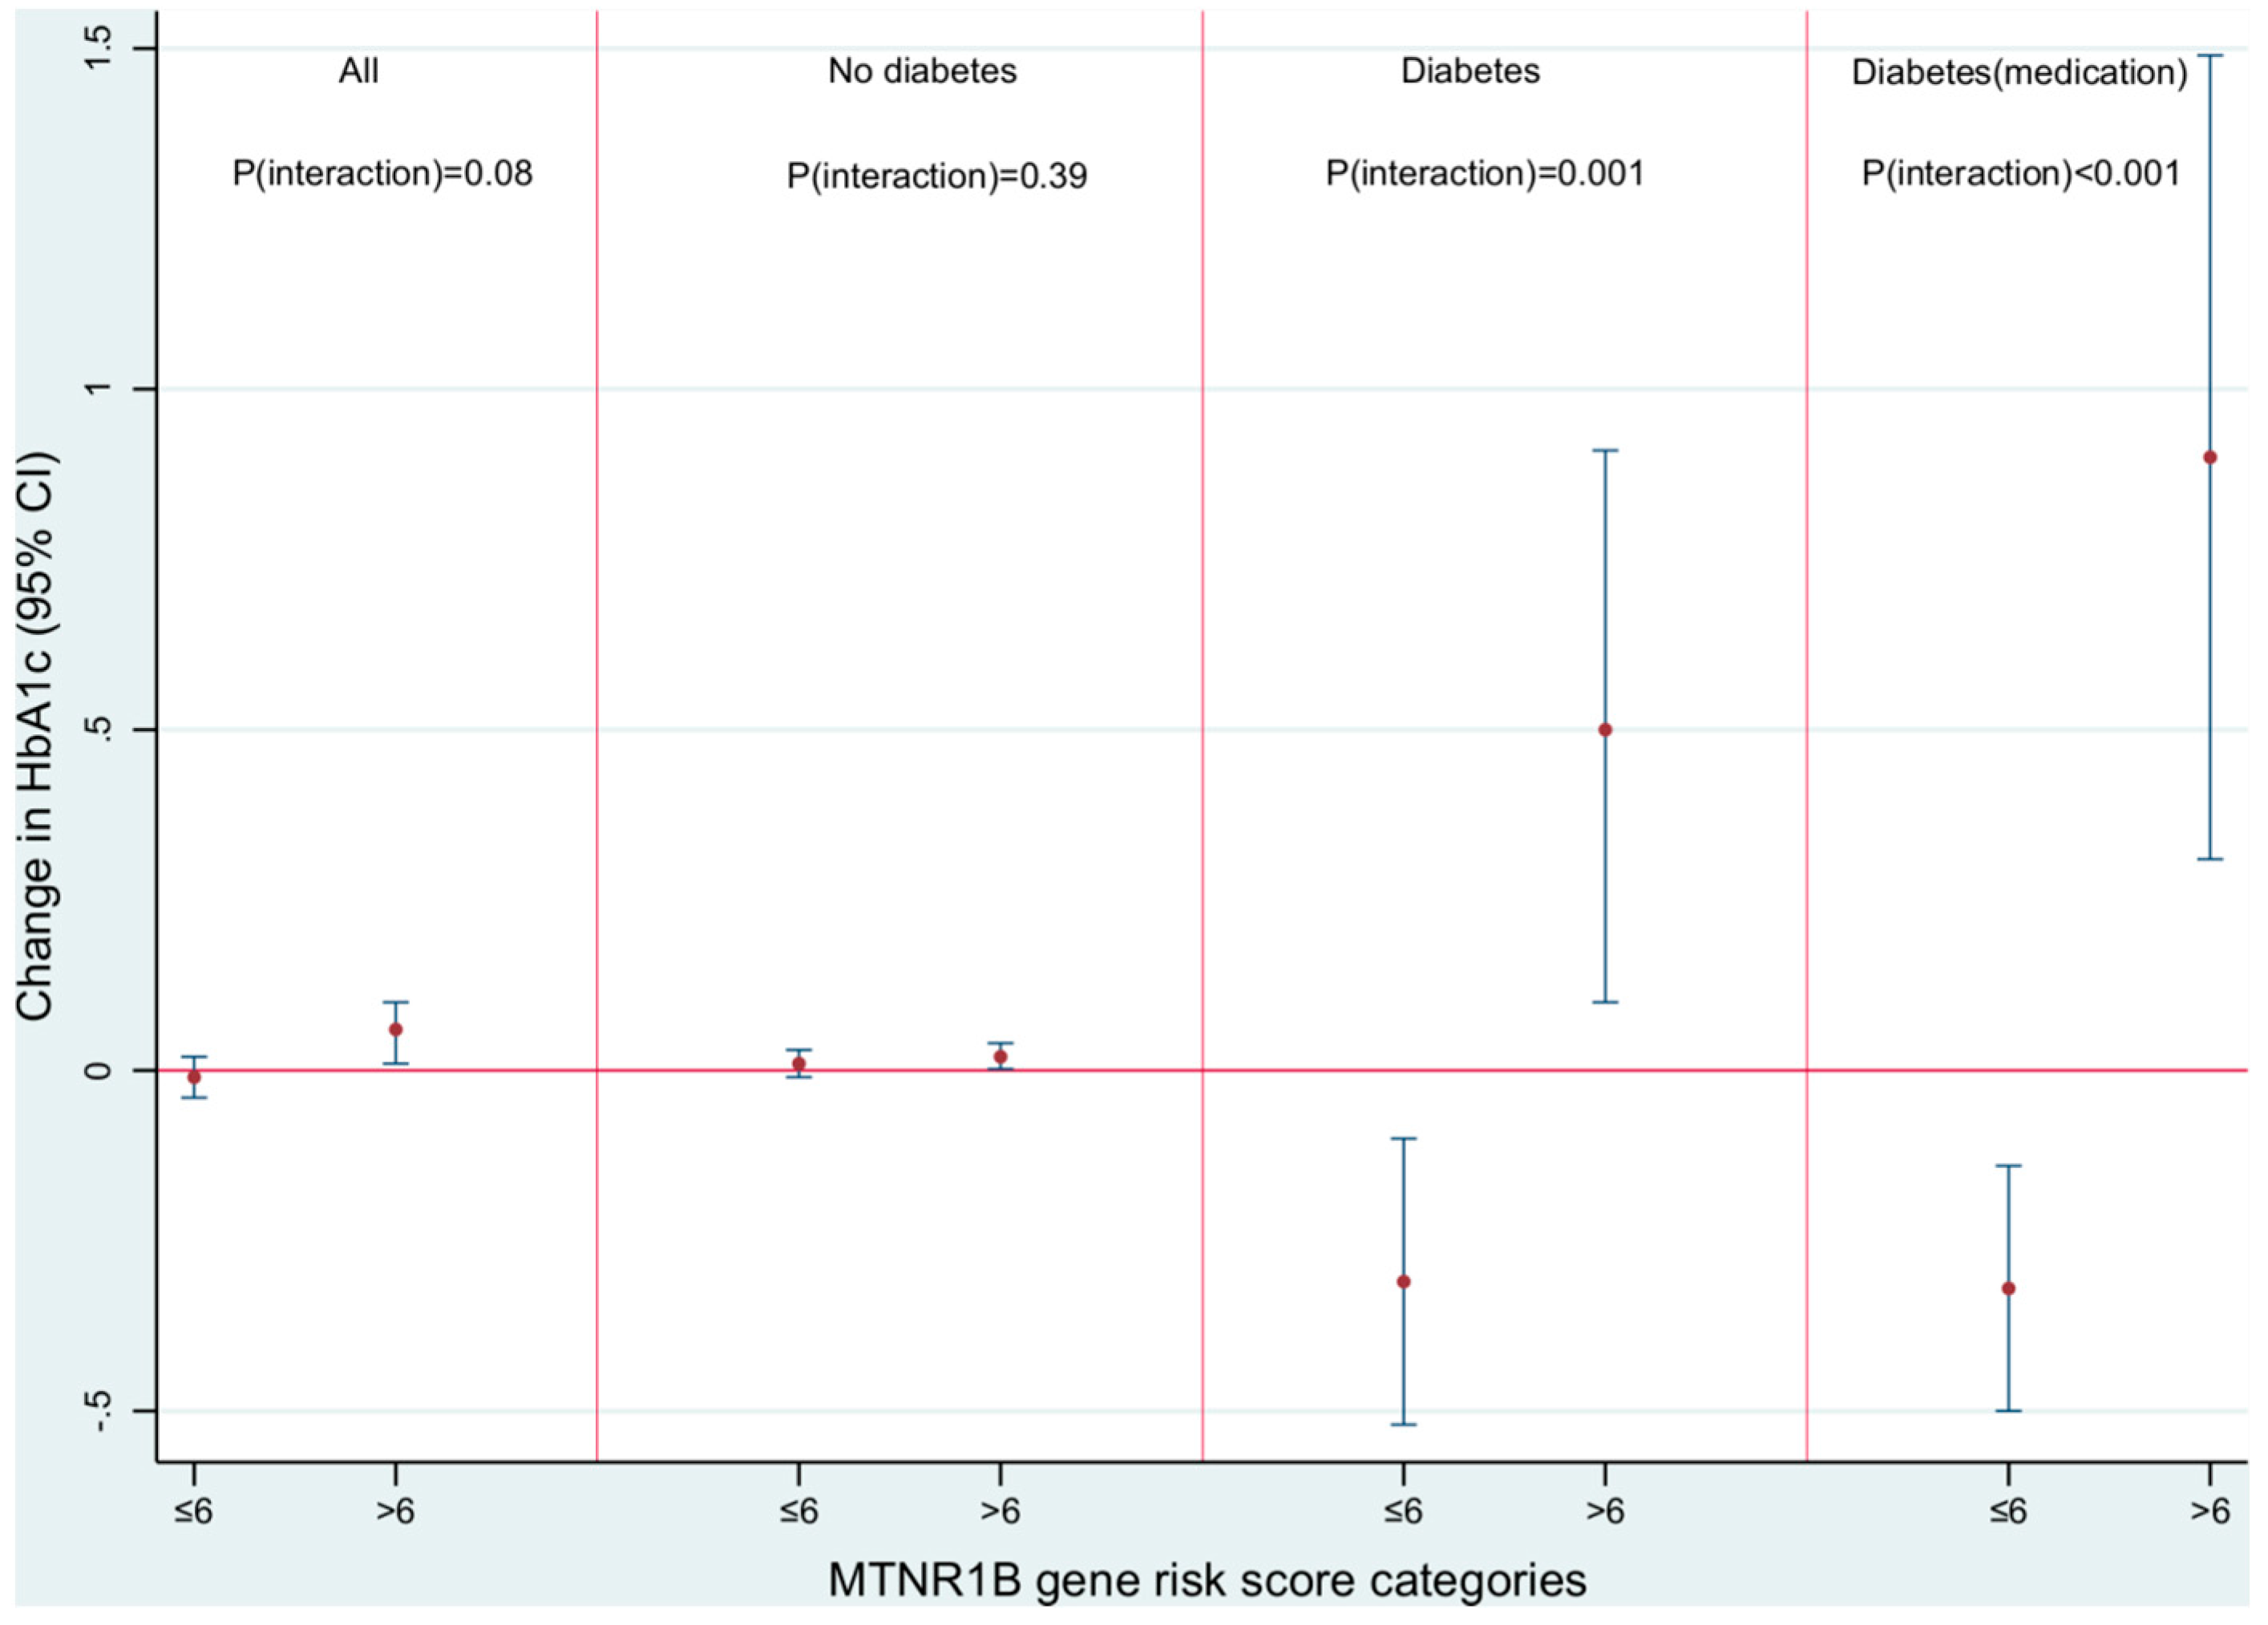
3.4. Modification of RTN-ΔHbA1c Association by MGRS
3.5. Sensitivity Analyses
4. Discussion
5. Conclusions
Supplementary Materials
Acknowledgments
Author Contributions
Conflicts of Interest
References
- Derr, R.; Garrett, E.; Stacy, G.A.; Saudek, C.D. Is hba(1c) affected by glycemic instability? Diabetes Care 2003, 26, 2728–2733. [Google Scholar] [CrossRef] [PubMed]
- Moss, S.E.; Klein, R.; Klein, B.E.; Meuer, S.M. The association of glycemia and cause-specific mortality in a diabetic population. Arch. Intern. Med. 1994, 154, 2473–2479. [Google Scholar] [CrossRef] [PubMed]
- Florkowski, C. Hba1c as a diagnostic test for diabetes mellitus—Reviewing the evidence. Clin. Biochem. Rev. 2013, 34, 75–83. [Google Scholar] [PubMed]
- Lipska, K.J.; Yao, X.; Herrin, J.; McCoy, R.G.; Ross, J.S.; Steinman, M.A.; Inzucchi, S.E.; Gill, T.M.; Krumholz, H.M.; Shah, N.D. Trends in drug utilization, glycemic control, and rates of severe hypoglycemia, 2006–2013. Diabetes Care 2016, 40, 468–475. [Google Scholar] [CrossRef] [PubMed]
- Munzel, T.; Sorensen, M.; Gori, T.; Schmidt, F.P.; Rao, X.; Brook, F.R.; Chen, L.C.; Brook, R.D.; Rajagopalan, S. Environmental stressors and cardio-metabolic disease: Part II-mechanistic insights. Eur. Heart J. 2016, 38, 557–564. [Google Scholar] [CrossRef] [PubMed]
- Snell-Bergeon, J.K.; Wadwa, R.P. Hypoglycemia, diabetes, and cardiovascular disease. Diabetes Technol. Ther. 2012, 14. [Google Scholar] [CrossRef] [PubMed]
- Davidson, J.A.; Parkin, C.G. Is hyperglycemia a causal factor in cardiovascular disease? Does proving this relationship really matter? Yes. Diabetes Care 2009, 32, S331–S333. [Google Scholar] [CrossRef] [PubMed]
- Vitelli, L.L.; Shahar, E.; Heiss, G.; McGovern, P.G.; Brancati, F.L.; Eckfeldt, J.H.; Folsom, A.R. Glycosylated hemoglobin level and carotid intimal-medial thickening in nondiabetic individuals. The atherosclerosis risk in communities study. Diabetes Care 1997, 20, 1454–1458. [Google Scholar] [CrossRef] [PubMed]
- Hanninen, O.; Knol, A.B.; Jantunen, M.; Lim, T.A.; Conrad, A.; Rappolder, M.; Carrer, P.; Fanetti, A.C.; Kim, R.; Buekers, J.; et al. Environmental burden of disease in europe: Assessing nine risk factors in six countries. Environ. Health Perspect. 2014, 122, 439–446. [Google Scholar] [CrossRef] [PubMed]
- Dzhambov, A.M. Long-term noise exposure and the risk for type 2 diabetes: A meta-analysis. Noise Health 2015, 17, 23–33. [Google Scholar] [CrossRef] [PubMed]
- Sorensen, M.; Andersen, Z.J.; Nordsborg, R.B.; Becker, T.; Tjonneland, A.; Overvad, K.; Raaschou-Nielsen, O. Long-term exposure to road traffic noise and incident diabetes: A cohort study. Environ. Health Perspect. 2013, 121, 217–222. [Google Scholar] [PubMed]
- Eze, I.C.; Foraster, M.; Schaffner, E.; Vienneau, D.; Heritier, H.; Rudzik, F.; Thiesse, L.; Pieren, R.; Imboden, M.; von Eckardstein, A.; et al. Long-term exposure to transportation noise and air pollution in relation to incident diabetes in the sapaldia study. Int. J. Epidemiol. 2017, 46, 1115–1125. [Google Scholar] [CrossRef] [PubMed]
- Roswall, N.; Raaschou-Nielsen, O.; Jensen, S.S.; Tjonneland, A.; Sorensen, M. Long-term exposure to residential railway and road traffic noise and risk for diabetes in a danish cohort. Environ. Res. 2017, 160, 292–297. [Google Scholar] [CrossRef] [PubMed]
- Clark, C.; Sbihi, H.; Tamburic, L.; Brauer, M.; Frank, L.D.; Davies, H.W. Association of long-term exposure to transportation noise and traffic-related air pollution with the incidence of diabetes: A prospective cohort study. Environ. Health Perspect. 2017, 125. [Google Scholar] [CrossRef] [PubMed]
- Barcelo, M.A.; Varga, D.; Tobias, A.; Diaz, J.; Linares, C.; Saez, M. Long term effects of traffic noise on mortality in the city of Barcelona, 2004–2007. Environ. Res. 2016, 147, 193–206. [Google Scholar] [CrossRef] [PubMed]
- Cui, B.; Gai, Z.; She, X.; Wang, R.; Xi, Z. Effects of chronic noise on glucose metabolism and gut microbiota-host inflammatory homeostasis in rats. Sci. Rep. 2016, 6, 36693. [Google Scholar] [CrossRef] [PubMed]
- Cajochen, C.; Krauchi, K.; Wirz-Justice, A. Role of melatonin in the regulation of human circadian rhythms and sleep. J. Neuroendocrinol. 2003, 15, 432–437. [Google Scholar] [CrossRef] [PubMed]
- Boden, G.; Ruiz, J.; Urbain, J.L.; Chen, X. Evidence for a circadian rhythm of insulin secretion. Am. J. Physiol. 1996, 271, E246–E252. [Google Scholar] [PubMed]
- Cajochen, C.; Krauchi, K.; Danilenko, K.V.; Wirz-Justice, A. Evening administration of melatonin and bright light: Interactions on the eeg during sleep and wakefulness. J. Sleep Res. 1998, 7, 145–157. [Google Scholar] [CrossRef] [PubMed]
- Rubio-Sastre, P.; Scheer, F.A.; Gomez-Abellan, P.; Madrid, J.A.; Garaulet, M. Acute melatonin administration in humans impairs glucose tolerance in both the morning and evening. Sleep 2014, 37, 1715–1719. [Google Scholar] [CrossRef] [PubMed]
- Mussig, K.; Staiger, H.; Machicao, F.; Haring, H.U.; Fritsche, A. Genetic variants in MTNR1b affecting insulin secretion. Ann. Med. 2010, 42, 387–393. [Google Scholar] [CrossRef] [PubMed]
- Lane, J.M.; Chang, A.M.; Bjonnes, A.C.; Aeschbach, D.; Anderson, C.; Cade, B.E.; Cain, S.W.; Czeisler, C.A.; Gharib, S.A.; Gooley, J.J.; et al. Impact of common diabetes risk variant in mtnr1b on sleep, circadian, and melatonin physiology. Diabetes 2016, 65, 1741–1751. [Google Scholar] [CrossRef] [PubMed]
- Anothaisintawee, T.; Lertrattananon, D.; Thamakaison, S.; Knutson, K.L.; Thakkinstian, A.; Reutrakul, S. Later chronotype is associated with higher hemoglobin a1c in prediabetes patients. Chronobiol. Int. 2017, 34, 393–402. [Google Scholar] [CrossRef] [PubMed]
- Bonnefond, A.; Froguel, P. Disentangling the role of melatonin and its receptor mtnr1b in type 2 diabetes: Still a long way to go? Curr. Diabetes Rep. 2017, 17. [Google Scholar] [CrossRef] [PubMed]
- Eze, I.C.; Imboden, M.; Kumar, A.; von Eckardstein, A.; Stolz, D.; Gerbase, M.W.; Kunzli, N.; Pons, M.; Kronenberg, F.; Schindler, C.; et al. Air pollution and diabetes association: Modification by type 2 diabetes genetic risk score. Environ. Int. 2016, 94, 263–271. [Google Scholar] [CrossRef] [PubMed] [Green Version]
- Talmud, P.J.; Cooper, J.A.; Morris, R.W.; Dudbridge, F.; Shah, T.; Engmann, J.; Dale, C.; White, J.; McLachlan, S.; Zabaneh, D.; et al. Sixty-five common genetic variants and prediction of type 2 diabetes. Diabetes 2015, 64, 1830–1840. [Google Scholar] [CrossRef] [PubMed]
- Martin, B.W.; Ackermann-Liebrich, U.; Leuenberger, P.; Kunzli, N.; Stutz, E.Z.; Keller, R.; Zellweger, J.P.; Wuthrich, B.; Monn, C.; Blaser, K.; et al. Sapaldia: Methods and participation in the cross-sectional part of the swiss study on air pollution and lung diseases in adults. Soz. Praventivmed. 1997, 42, 67–84. [Google Scholar] [CrossRef] [PubMed]
- Weykamp, C.; Visser-Dekkers, W.; Kemna, E.; Siebelder, C. Effects of hemoglobin d and e on the measurement of hba1c with the modified menarini/arkray adams a1c ha-8180v analyser. Clin. Chim. Acta 2012, 414, 44–45. [Google Scholar] [CrossRef] [PubMed]
- Sacks, D.B. Global harmonization of hemoglobin a1c. Clin. Chem. 2005, 51, 681–683. [Google Scholar] [CrossRef] [PubMed]
- Karipidis, I.; Vienneau, D.; Habermacher, M.; Köpflii, M.; Brink, M.; Probst-Hensch, N.; Röösli, M.; Wunderli, J.-M. Reconstruction of historical noise exposure data for environmental epidemiology in switzerland within the sirene project. Noise Map. 2014, 1. [Google Scholar] [CrossRef]
- Panczak, R.; Galobardes, B.; Voorpostel, M.; Spoerri, A.; Zwahlen, M.; Egger, M. A swiss neighbourhood index of socioeconomic position: Development and association with mortality. J. Epidemiol. Community Health 2012, 66, 1129–1136. [Google Scholar] [CrossRef] [PubMed]
- Ware, J.E.; Kosinski, M. Sf-36 Physical & Mental Health Summary Scales: A Manual for Users of Version 1; Quality Metric: Montreal, QC, Canada, 2001. [Google Scholar]
- Tetreault, L.F.; Perron, S.; Smargiassi, A. Cardiovascular health, traffic-related air pollution and noise: Are associations mutually confounded? A systematic review. Int. J. Public Health 2013, 58, 649–666. [Google Scholar] [CrossRef] [PubMed]
- Liu, L.-J.S.; Tsai, M.-Y.; Keidel, D.; Gemperli, A.; Ineichen, A.; Hazenkamp-von Arx, M.; Bayer-Oglesby, L.; Rochat, T.; Künzli, N.; Ackermann-Liebrich, U. Long-term exposure models for traffic related NO2 across geographically diverse areas over separate years. Atmos. Environ. 2012, 46, 460–471. [Google Scholar]
- Moffatt, M.F.; Gut, I.G.; Demenais, F.; Strachan, D.P.; Bouzigon, E.; Heath, S.; von Mutius, E.; Farrall, M.; Lathrop, M.; Cookson, W.O. A large-scale, consortium-based genomewide association study of asthma. N. Engl. J. Med. 2010, 363, 1211–1221. [Google Scholar] [CrossRef] [PubMed]
- Delaneau, O.; Zagury, J.F.; Marchini, J. Improved whole-chromosome phasing for disease and population genetic studies. Nat. Methods 2013, 10, 5–6. [Google Scholar] [CrossRef] [PubMed]
- Fuchsberger, C.; Abecasis, G.R.; Hinds, D.A. Minimac2: Faster genotype imputation. Bioinformatics 2015, 31, 782–784. [Google Scholar] [CrossRef] [PubMed]
- Bouatia-Naji, N.; Bonnefond, A.; Cavalcanti-Proenca, C.; Sparso, T.; Holmkvist, J.; Marchand, M.; Delplanque, J.; Lobbens, S.; Rocheleau, G.; Durand, E.; et al. A variant near mtnr1b is associated with increased fasting plasma glucose levels and type 2 diabetes risk. Nat. Genet. 2009, 41, 89–94. [Google Scholar] [CrossRef] [PubMed]
- Staiger, H.; Machicao, F.; Schafer, S.A.; Kirchhoff, K.; Kantartzis, K.; Guthoff, M.; Silbernagel, G.; Stefan, N.; Haring, H.U.; Fritsche, A. Polymorphisms within the novel type 2 diabetes risk locus mtnr1b determine beta-cell function. PLoS ONE 2008, 3, e3962. [Google Scholar] [CrossRef] [PubMed]
- Andersson, E.A.; Holst, B.; Sparso, T.; Grarup, N.; Banasik, K.; Holmkvist, J.; Jorgensen, T.; Borch-Johnsen, K.; Egerod, K.L.; Lauritzen, T.; et al. Mtnr1b g24e variant associates with bmi and fasting plasma glucose in the general population in studies of 22,142 europeans. Diabetes 2010, 59, 1539–1548. [Google Scholar] [CrossRef] [PubMed] [Green Version]
- Prokopenko, I.; Langenberg, C.; Florez, J.C.; Saxena, R.; Soranzo, N.; Thorleifsson, G.; Loos, R.J.; Manning, A.K.; Jackson, A.U.; Aulchenko, Y.; et al. Variants in mtnr1b influence fasting glucose levels. Nat. Genet. 2009, 41, 77–81. [Google Scholar] [CrossRef] [PubMed] [Green Version]
- Lyssenko, V.; Nagorny, C.L.; Erdos, M.R.; Wierup, N.; Jonsson, A.; Spegel, P.; Bugliani, M.; Saxena, R.; Fex, M.; Pulizzi, N.; et al. Common variant in mtnr1b associated with increased risk of type 2 diabetes and impaired early insulin secretion. Nat. Genet. 2009, 41, 82–88. [Google Scholar] [CrossRef] [PubMed]
- Ronn, T.; Wen, J.; Yang, Z.; Lu, B.; Du, Y.; Groop, L.; Hu, R.; Ling, C. A common variant in mtnr1b, encoding melatonin receptor 1b, is associated with type 2 diabetes and fasting plasma glucose in han chinese individuals. Diabetologia 2009, 52, 830–833. [Google Scholar] [CrossRef] [PubMed]
- Sparso, T.; Bonnefond, A.; Andersson, E.; Bouatia-Naji, N.; Holmkvist, J.; Wegner, L.; Grarup, N.; Gjesing, A.P.; Banasik, K.; Cavalcanti-Proenca, C.; et al. G-allele of intronic rs10830963 in mtnr1b confers increased risk of impaired fasting glycemia and type 2 diabetes through an impaired glucose-stimulated insulin release: Studies involving 19,605 europeans. Diabetes 2009, 58, 1450–1456. [Google Scholar] [CrossRef] [PubMed] [Green Version]
- Langenberg, C.; Pascoe, L.; Mari, A.; Tura, A.; Laakso, M.; Frayling, T.M.; Barroso, I.; Loos, R.J.; Wareham, N.J.; Walker, M. Common genetic variation in the melatonin receptor 1b gene (mtnr1b) is associated with decreased early-phase insulin response. Diabetologia 2009, 52, 1537–1542. [Google Scholar] [CrossRef] [PubMed]
- Ingelsson, E.; Langenberg, C.; Hivert, M.F.; Prokopenko, I.; Lyssenko, V.; Dupuis, J.; Magi, R.; Sharp, S.; Jackson, A.U.; Assimes, T.L.; et al. Detailed physiologic characterization reveals diverse mechanisms for novel genetic loci regulating glucose and insulin metabolism in humans. Diabetes 2010, 59, 1266–1275. [Google Scholar] [CrossRef] [PubMed]
- Reiling, E.; van’t Riet, E.; Groenewoud, M.J.; Welschen, L.M.; van Hove, E.C.; Nijpels, G.; Maassen, J.A.; Dekker, J.M.; ’t Hart, L.M. Combined effects of single-nucleotide polymorphisms in GCK, GCKR, G6PC2 and MTNR1B On fasting plasma glucose and type 2 diabetes risk. Diabetologia 2009, 52, 1866–1870. [Google Scholar] [CrossRef] [PubMed]
- Dimas, A.S.; Lagou, V.; Barker, A.; Knowles, J.W.; Magi, R.; Hivert, M.F.; Benazzo, A.; Rybin, D.; Jackson, A.U.; Stringham, H.M.; et al. Impact of type 2 diabetes susceptibility variants on quantitative glycemic traits reveals mechanistic heterogeneity. Diabetes 2014, 63, 2158–2171. [Google Scholar] [CrossRef] [PubMed]
- Scott, R.A.; Lagou, V.; Welch, R.P.; Wheeler, E.; Montasser, M.E.; Luan, J.; Magi, R.; Strawbridge, R.J.; Rehnberg, E.; Gustafsson, S.; et al. Large-scale association analyses identify new loci influencing glycemic traits and provide insight into the underlying biological pathways. Nat. Genet. 2012, 44, 991–1005. [Google Scholar] [CrossRef] [PubMed] [Green Version]
- Ward, L.D.; Kellis, M. Haploreg: A resource for exploring chromatin states, conservation, and regulatory motif alterations within sets of genetically linked variants. Nucleic Acids Res. 2012, 40. [Google Scholar] [CrossRef] [PubMed]
- Walther, D.; Curjuric, I.; Dratva, J.; Schaffner, E.; Quinto, C.; Schmidt-Trucksass, A.; Eze, I.C.; Burdet, L.; Pons, M.; Gerbase, M.W.; et al. Hypertension, diabetes and lifestyle in the long-term—Results from a swiss population-based cohort. Prev. Med. 2017, 97, 56–61. [Google Scholar] [CrossRef] [PubMed]
- Laposky, A.D.; Bass, J.; Kohsaka, A.; Turek, F.W. Sleep and circadian rhythms: Key components in the regulation of energy metabolism. FEBS Lett. 2008, 582, 142–151. [Google Scholar] [CrossRef] [PubMed]
- Sartori, C.; Dessen, P.; Mathieu, C.; Monney, A.; Bloch, J.; Nicod, P.; Scherrer, U.; Duplain, H. Melatonin improves glucose homeostasis and endothelial vascular function in high-fat diet-fed insulin-resistant mice. Endocrinology 2009, 150, 5311–5317. [Google Scholar] [CrossRef] [PubMed]
- Halperin, D. Environmental noise and sleep disturbances: A threat to health? Sleep Sci. 2014, 7, 209–212. [Google Scholar] [CrossRef] [PubMed]
- Reutrakul, S.; Hood, M.M.; Crowley, S.J.; Morgan, M.K.; Teodori, M.; Knutson, K.L.; Van Cauter, E. Chronotype is independently associated with glycemic control in type 2 diabetes. Diabetes Care 2013, 36, 2523–2529. [Google Scholar] [CrossRef] [PubMed]
- O’Neill, M.S.; Veves, A.; Zanobetti, A.; Sarnat, J.A.; Gold, D.R.; Economides, P.A.; Horton, E.S.; Schwartz, J. Diabetes enhances vulnerability to particulate air pollution-associated impairment in vascular reactivity and endothelial function. Circulation 2005, 111, 2913–2920. [Google Scholar] [CrossRef] [PubMed]
- Raaschou-Nielsen, O.; Sorensen, M.; Ketzel, M.; Hertel, O.; Loft, S.; Tjonneland, A.; Overvad, K.; Andersen, Z.J. Long-term exposure to traffic-related air pollution and diabetes-associated mortality: A cohort study. Diabetologia 2013, 56, 36–46. [Google Scholar] [CrossRef] [PubMed]
- Rioux, C.L.; Tucker, K.L.; Brugge, D.; Mwamburi, M. Medication type modifies inflammatory response to traffic exposure in a population with type 2 diabetes. Environ. Pollut. 2015, 202, 58–65. [Google Scholar] [CrossRef] [PubMed]
- Nakanishi-Minami, T.; Kishida, K.; Funahashi, T.; Shimomura, I. Sleep-wake cycle irregularities in type 2 diabetics. Diabetol. Metabol. Syndr. 2012, 4, 18. [Google Scholar] [CrossRef] [PubMed]
- Khandelwal, D.; Dutta, D.; Chittawar, S.; Kalra, S. Sleep disorders in type 2 diabetes. Ind. J. Endocrinol. Metab. 2017, 21, 758–761. [Google Scholar]
- Babisch, W. Stress hormones in the research on cardiovascular effects of noise. Noise Health 2003, 5, 1–11. [Google Scholar] [PubMed]
- Roohafza, H.; Kabir, A.; Sadeghi, M.; Shokouh, P.; Ahmadzad-Asl, M.; Khadem-Maboudi, A.A.; Sarrafzadegan, N. Stress as a risk factor for noncompliance with treatment regimens in patients with diabetes and hypertension. ARYA Atheroscler. 2016, 12, 166–171. [Google Scholar] [PubMed]
- Gonzalez, J.S.; Kane, N.S.; Binko, D.H.; Shapira, A.; Hoogendoorn, C.J. Tangled up in blue: Unraveling the links between emotional distress and treatment adherence in type 2 diabetes. Diabetes Care 2016, 39, 2182–2189. [Google Scholar] [CrossRef] [PubMed]
- Liu, C.; Wu, Y.; Li, H.; Qi, Q.; Langenberg, C.; Loos, R.J.; Lin, X. Mtnr1b rs10830963 is associated with fasting plasma glucose, hba1c and impaired beta-cell function in chinese hans from shanghai. BMC Med. Genet. 2010, 11, 59. [Google Scholar] [CrossRef] [PubMed]


| Categorical Variables | (%) |
| Females at SAP2 | 48 |
| Formal education at SAP2: ≤9 years | 4 |
| 10–13 years | 64 |
| >13 years | 32 |
| Ever-smoker at SAP2 | 55 |
| Exposure to passive smoke at SAP2 | 23 |
| Alcohol consumption >once/day at SAP2 | 40 |
| Sleep insufficiency at SAP2 | 28 |
| Diabetes status at SAP2 | 3 |
| Diabetes status at SAP3 | 7 |
| Diabetes medication at SAP2 | 3 |
| Diabetes medication at SAP3 | 5 |
| Change of residence (movers) between SAP2 and SAP3 | 36 |
| Continuous Variables (Units) | Mean (SD) |
| Age at SAP2 (years) | 51 (11) |
| Body mass index at SAP2 (kg/m2) | 25.6 (4) |
| Neighborhood socio-economic index at SAP2 (%) | 64 (10) |
| SF-36 mental health score at SAP2 (%) a | 76 (15) |
| Lnight, road at SAP2 (dB) | 45.8 (8) |
| Lnight, railway at SAP2 (dB) | 28.3 (10) |
| Lnight, aircraft at SAP2 (dB) | 22.7 (6) |
| Nitrogen dioxide at SAP2 (μg/m3) | 22.4 (10) |
| Green space within 2 km radius at SAP2 (km2) | 0.3 (0.4) |
| MTNR1B variants at SAP2: rs1387153, T allele | 0.6 (0.6) |
| rs10830962, G allele | 0.8 (0.7) |
| rs4753426, C allele | 1.0 (0.7) |
| rs8192552, G allele | 1.9 (0.4) |
| rs10830963, G allele | 0.6 (0.6) |
| rs37816938, G allele | 1.1 (0.7) |
| MTNR1B genetic risk score at SAP2 | 6 (3) |
| Glycosylated hemoglobin, HbA1c at SAP2 (%) | 5.2 (0.4) |
| HbA1c at SAP3 (%) | 5.3 (0.5) |
| Change in HbA1c between SAP2 and SAP3 (%): All | 0.04 (0.4) |
| Non-diabetic participants | 0.03 (0.3) |
| Diabetic participants | 0.17 (1.1) |
| Diabetic participants on medication | 0.12 (1.2) |
| All Participants | Source | Model | All N = 3350 | No Diabetes N = 3098 | Diabetes N = 251 | Diabetes on Medication N = 168 |
| β (95% CI) | β (95% CI) | β (95% CI) | β (95% CI) | |||
| Road | Crude | 0.01 (−0.01, 0.03) | 0.01 (0.002, 0.02) * | −0.02 (−0.22, 0.18) | −0.03 (−0.25, 0.18) | |
| Adjusted | 0.01 (−0.02, 0.03) | 0.01 (−0.0004, 0.02) † | −0.07 (−0.26, 0.11) | −0.13 (−0.36, 0.10) | ||
| Adjusted+BMI | 0.01 (−0.02, 0.03) | 0.01 (−0.001, 0.02) † | −0.08 (−0.27, 0.11) | −0.11 (−0.35, 0.15) | ||
| Railway | Crude | 0.004 (−0.01, 0.02) | 0.003 (−0.01, 0.01) | 0.03 (−0.06, 0.12) | 0.03 (−0.11, 0.16) | |
| Adjusted | 0.001 (−0.01, 0.02) | 0.001 (−0.01, 0.01) | 0.01 (−0.05, 0.08) | 0.05 (−0.05, 0.13) | ||
| Adjusted+BMI | 0.002 (−0.01, 0.02) | 0.001 (−0.01, 0.01) | 0.02 (−0.05, 0.08) | 0.04 (−0.04, 0.12) | ||
| Aircraft | Crude | −0.0003 (−0.01, 0.01) | −0.01 (−0.03, 0.01) | 0.24 (−0.08, 0.55) | 0.26 (0.05, 0.47) * | |
| Adjusted | 0.005 (−0.02, 0.03) | −0.004 (−0.03, 0.02) | 0.34 (0.12, 0.55) † | 0.34 (0.13, 0.54) † | ||
| Adjusted+BMI | 0.01 (−0.01, 0.02) | −0.003 (−0.02, 0.02) | 0.35 (0.08, 0.62) † | 0.31 (0.03, 0.60) † | ||
| Non-movers | Source | Model | All N = 2142 | No Diabetes N = 1960 | Diabetes N = 179 | Diabetes on Medication N = 117 |
| Road | Crude | 0.02 (0, 0.04) * | 0.01 (0.0004, 0.03) * | 0.06 (−0.21, 0.33) | 0.07 (−0.26, 0.39) | |
| Adjusted | 0.02 (0.003, 0.04) * | 0.01 (0, 0.03) * | 0.04 (−0.16, 0.24) | 0.10 (−0.13, 0.33) | ||
| Adjusted+BMI | 0.02 (0.003, 0.04) * | 0.01 (0, 0.03) * | 0.03 (−0.14, 0.19) | 0.10 (−0.09, 0.29) | ||
| Railway | Crude | 0.001 (−0.03, 0.03) | −0.01 (−0.02, 0.01) | 0.06 (−0.15, 0.26) | 0.05 (−0.31, 0.41) | |
| Adjusted | −0.001 (−0.03, 0.03) | −0.01 (−0.02, 0.01) | 0.02 (−0.29, 0.31) | −0.03 (−0.53, 0.47) | ||
| Adjusted+BMI | −0.001 (−0.03, 0.03) | −0.01 (−0.02, 0.01) | 0.02 (−0.24, 0.29) | −0.03 (−0.46, 0.40) | ||
| Aircraft | Crude | 0.03 (0.01, 0.05) | 0.01 (−0.01, 0.03) | 0.24 (−0.04, 0.53) † | 0.22 (−0.03, 0.47) † | |
| Adjusted | 0.04 (0.01, 0.07) † | 0.02 (−0.002, 0.03) † | 0.30 (−0.15, 0.74) | 0.14 (−0.44, 0.71) | ||
| Adjusted+BMI | 0.04 (0.01, 0.07) † | 0.02 (0, 0.03) * | 0.32 (−0.22, 0.86) | 0.13 (−0.49, 0.74) |
| MTNR1B Variant | Risk/Other Allele | Risk Allele Frequency | All N = 2142 | No Diabetes N = 1960 | Diabetes N = 179 | Diabetes on Medication N = 117 |
|---|---|---|---|---|---|---|
| β Interaction Term (95% CI) | β Interaction Term (95% CI) | β Interaction Term (95% CI) | β Interaction Term (95% CI) | |||
| rs1387153 a | T/C | 0.30 | 0.04 (−0.02, 0.10) | 0.01 (−0.01, 0.02) | 0.66 (0.17, 1.15) * | 0.92 (0.45, 1.39) † |
| rs1387153 b | T/C | 0.30 | 0.04 (−0.02, 0.10) | 0.01 (−0.01, 0.02) | 0.67 (0.17, 1.18) * | 0.92 (0.44, 1.40) † |
| rs10830962 a | G/C | 0.42 | 0.03 (−0.02, 0.09) | −0.003 (−0.02, 0.01) | 0.56 (0.18, 0.95) * | 0.83 (0.26, 1.39) * |
| rs10830962 b | G/C | 0.42 | 0.03 (−0.02, 0.09) | −0.003 (−0.02, 0.01) | 0.57 (0.18, 0.96) * | 0.83 (0.21, 1.46) * |
| rs4753426 a | C/T | 0.49 | 0.01 (−0.05, 0.07) | −0.01 (−0.04, 0.02) | 0.30 (−0.19, 0.80) | 0.42 (−0.01, 0.85) ‡ |
| rs4753426 b | C/T | 0.49 | 0.01 (−0.05, 0.07) | −0.01 (−0.04, 0.02) | 0.31 (−0.18, 0.80) | 0.42 (0.01, 0.83) * |
| rs8192552 a | G/A | 0.93 | −0.001 (−0.06, 0.05) | −0.02 (−0.05, 0.02) | 0.31 (−0.52, 1.15) | 0.28 (−0.41, 0.98) |
| rs8192552 b | G/A | 0.93 | −0.001 (−0.05, 0.05) | −0.02 (−0.05, 0.02) | 0.31 (−0.52, 1.14) | 0.28 (−0.45, 1.01) |
| rs10830963 a | G/C | 0.29 | 0.04 (−0.03, 0.10) | −0.004 (−0.02, 0.02) | 0.80 (0.16, 1.45) * | 1.21 (0.62, 1.78) † |
| rs10830963 b | G/C | 0.29 | 0.04 (−0.03, 0.10) | −0.004 (−0.02, 0.02) | 0.80 (0.14, 1.47) * | 1.21 (0.59, 1.83) † |
| rs3781638 a | T/G | 0.55 | 0.01 (−0.06, 0.07) | −0.002 (−0.04, 0.03) | 0.18 (−0.17, 0.54) | 0.32 (−0.08, 0.71) ‡ |
| rs3781638 b | T/G | 0.55 | 0.01 (−0.05, 0.07) | −0.002 (−0.04, 0.03) | 0.18 (−0.17, 0.54) | 0.31 (−0.06, 0.69) ‡ |
| MTNR1B score a | 0.01 (−0.01, 0.02) | −0.001 (−0.01, 0.004) | 0.15 (0.01, 0.30) * | 0.23 (0.10, 0.36) * | ||
| MTNR1B score b | 0.01 (−0.01, 0.02) | −0.001 (−0.01, 0.004) | 0.15 (0.01, 0.30) * | 0.23 (0.10, 0.37) * | ||
| MTNR1B score >6 vs. ≤6 § a | 0.07 (−0.01, 0.15) ‡ | 0.01 (−0.01, 0.03) | 0.87 (0.38, 1.36) † | 1.25 (0.70, 1.80) † | ||
| MTNR1B score >6 vs. ≤6 § b | 0.07 (−0.01, 0.15) ‡ | 0.01 (−0.02, 0.04) | 0.87 (0.38, 1.37) † | 1.25 (0.68, 1.83) † | ||
| § + Short Form-36 mental health || a | 0.07 (−0.01, 0.15) ‡ | 0.02 (−0.02, 0.06) | 0.82 (0.36, 1.28) † | 1.11 (0.76, 1.46) † | ||
| § + Short Form-36 mental health || b | 0.07 (−0.01, 0.15) ‡ | 0.02 (−0.02, 0.06) | 0.81 (0.36, 1.27) † | 1.12 (0.74, 1.49) † |
| Model | Categories | All N = 2142 | No Diabetes N = 1960 | Diabetes N = 179 | Diabetes on Medication N = 117 |
|---|---|---|---|---|---|
| β (95% CI) | β (95% CI) | β (95% CI) | β (95% CI) | ||
| Main model corrected for potential selection bias | NA | 0.02 (0.003, 0.04) * | 0.01 (0, 0.03) * | 0.03 (−0.14, 0.19) | 0.10 (−0.09, 0.29) |
| Complete case analyses: Adjusted model | NA | 0.02 (−0.002, 0.05) † | 0.02 (0, 0.04) * | 0.03 (−0.21, 0.28) | 0.05 (−0.28, 0.37) |
| Complete case analyses: Stratification by MTNR1B score | ≤6 | −0.01 (−0.04, 0.03) | 0.01 (−0.01, 0.04) | −0.34 (−0.64, −0.04) * | −0.40 (−0.76, −0.05) * |
| >6 | 0.06 (0.02, 0.09) * | 0.03 (0.001, 0.05) * | 0.49 (0.16, 0.82) * | 0.81 (0.37, 1.26) ‡ | |
| P-value of interaction | <0.01 | 0.48 | <0.001 | <0.001 | |
| Main model excluding participants whose bedrooms did not face the street: Stratification by MTNR1B score | ≤6 | 0.01 (−0.03, 0.04) | 0.02 (−0.01, 0.05) | −0.19 (−0.39, −0.003) * | −0.02 (−0.38, 0.34) |
| >6 | 0.07 (0.01, 0.13) * | 0.03 (−0.001, 0.06) | 0.49 (0.08, 0.90) * | 0.85 (0.23, 1.47) ‡ | |
| P-value of interaction | 0.14 | 0.42 | <0.001 | <0.001 | |
| Main model excluding asthma cases: Stratification by MTNR1B score | ≤6 | −0.01 (−0.03, 0.02) | 0.004 (−0.02, 0.03) | −0.26 (−0.48, −0.03) * | −0.30 (−0.53, −0.07) * |
| >6 | 0.06 (−0.003, 0.11) * | 0.02 (−0.004, 0.05) * | 0.50 (0.07, 0.92) * | 0.98 (0.35, 1.61) * | |
| P-value of interaction | 0.07 | 0.39 | 0.001 | <0.001 | |
| Main model: Stratification by self-reported insufficient sleep | No | −0.002 (−0.03, 0.02) | −0.001 (−0.02, 0.02) | −0.08 (−0.28, 0.15) | −0.11 (−0.36, 0.14) |
| Yes | 0.07 (0.02, 0.14) * | 0.05 (0.004, 0.09) * | 0.28 (−0.13, 0.69) | 0.67 (0.11, 1.23) * | |
| P-value of interaction | 0.092 | 0.059 | 0.2 | 0.029 |
© 2017 by the authors. Licensee MDPI, Basel, Switzerland. This article is an open access article distributed under the terms and conditions of the Creative Commons Attribution (CC BY) license (http://creativecommons.org/licenses/by/4.0/).
Share and Cite
Eze, I.C.; Imboden, M.; Foraster, M.; Schaffner, E.; Kumar, A.; Vienneau, D.; Héritier, H.; Rudzik, F.; Thiesse, L.; Pieren, R.; et al. Exposure to Night-Time Traffic Noise, Melatonin-Regulating Gene Variants and Change in Glycemia in Adults. Int. J. Environ. Res. Public Health 2017, 14, 1492. https://0-doi-org.brum.beds.ac.uk/10.3390/ijerph14121492
Eze IC, Imboden M, Foraster M, Schaffner E, Kumar A, Vienneau D, Héritier H, Rudzik F, Thiesse L, Pieren R, et al. Exposure to Night-Time Traffic Noise, Melatonin-Regulating Gene Variants and Change in Glycemia in Adults. International Journal of Environmental Research and Public Health. 2017; 14(12):1492. https://0-doi-org.brum.beds.ac.uk/10.3390/ijerph14121492
Chicago/Turabian StyleEze, Ikenna C., Medea Imboden, Maria Foraster, Emmanuel Schaffner, Ashish Kumar, Danielle Vienneau, Harris Héritier, Franziska Rudzik, Laurie Thiesse, Reto Pieren, and et al. 2017. "Exposure to Night-Time Traffic Noise, Melatonin-Regulating Gene Variants and Change in Glycemia in Adults" International Journal of Environmental Research and Public Health 14, no. 12: 1492. https://0-doi-org.brum.beds.ac.uk/10.3390/ijerph14121492