Gene-by-Psychosocial Factor Interactions Influence Diastolic Blood Pressure in European and African Ancestry Populations: Meta-Analysis of Four Cohort Studies

 , , ,
, , ,
Abstract
:1. Introduction
2. Materials and Methods
2.1. Study Cohorts
2.2. Blood Pressure
2.3. Socioeconomic and Psychosocial Factors
2.3.1. Outward/Trait Anger
2.3.2. Depressive Symptoms
2.3.3. Chronic Burden
2.4. Genomic Regions Associated with Blood Pressure
2.5. Adjustment Covariates
2.6. Statistical Modeling
3. Results
3.1. Descriptive Statistics
3.2. Association between Socioeconomic/Psychosocial Factors and BP
3.3. Association between Genomic Regions and BP
3.4. Interaction between Socioeconomic/Psychosocial Factors and Genomic Regions on BP
4. Discussion
5. Conclusions
Supplementary Materials
Acknowledgments
Author Contributions
Conflicts of Interest
References
- Writing Group Members; Mozaffarian, D.; Benjamin, E.J.; Go, A.S.; Arnett, D.K.; Blaha, M.J.; Cushman, M.; Das, S.R.; de Ferranti, S.; Despres, J.P.; et al. Executive Summary: Heart Disease and Stroke Statistics—2016 Update: A Report from the American Heart Association. Circulation 2016, 133, 447–454. [Google Scholar] [CrossRef]
- Ehret, G.B.; Caulfield, M.J. Genes for Blood Pressure: An Opportunity to Understand Hypertension. Eur. Heart J. 2013, 34, 951–961. [Google Scholar] [CrossRef] [PubMed]
- Skodova, Z.; Nagyova, I.; van Dijk, J.P.; Sudzinova, A.; Vargova, H.; Studencan, M.; Reijneveld, S. Socioeconomic Differences in Psychosocial Factors Contributing to Coronary Heart Disease: A Review. J. Clin. Psychol. Med. Settings 2008, 15, 204–213. [Google Scholar] [CrossRef] [PubMed]
- Cuffee, Y.; Ogedegbe, C.; Williams, N.J.; Ogedegbe, G.; Schoenthaler, A. Psychosocial Risk Factors for Hypertension: An Update of the Literature. Curr. Hypertens. Rep. 2014, 16, 1–11. [Google Scholar] [CrossRef] [PubMed]
- International Consortium for Blood Pressure Genome-Wide Association Studies; Ehret, G.B.; Munroe, P.B.; Rice, K.M.; Bochud, M.; Johnson, A.D.; Chasman, D.I.; Smith, A.V.; Tobin, M.D.; Verwoert, G.C.; et al. Genetic Variants in Novel Pathways Influence Blood Pressure and Cardiovascular Disease Risk. Nature 2011, 478, 103–109. [Google Scholar] [CrossRef] [Green Version]
- Franceschini, N.; Fox, E.; Zhang, Z.; Edwards, T.L.; Nalls, M.A.; Sung, Y.J.; Tayo, B.O.; Sun, Y.V.; Gottesman, O.; Adeyemo, A.; et al. Genome-Wide Association Analysis of Blood-Pressure Traits in African-Ancestry Individuals Reveals Common Associated Genes in African and Non-African Populations. Am. J. Hum. Genet. 2013, 93, 545–554. [Google Scholar] [CrossRef] [PubMed]
- Kato, N.; Loh, M.; Takeuchi, F.; Verweij, N.; Wang, X.; Zhang, W.; Kelly, T.N.; Saleheen, D.; Lehne, B.; Leach, I.M.; et al. Trans-Ancestry Genome-Wide Association Study Identifies 12 Genetic Loci Influencing Blood Pressure and Implicates a Role for DNA Methylation. Nat. Genet. 2015, 47, 1282–1293. [Google Scholar] [CrossRef] [PubMed]
- Ehret, G.B.; Ferreira, T.; Chasman, D.I.; Jackson, A.U.; Schmidt, E.M.; Johnson, T.; Thorleifsson, G.; Luan, J.; Donnelly, L.A.; Kanoni, S.; et al. The Genetics of Blood Pressure Regulation and Its Target Organs from Association Studies in 342,415 Individuals. Nat. Genet. 2016, 48, 1171–1184. [Google Scholar] [CrossRef] [PubMed]
- Warren, H.R.; Evangelou, E.; Cabrera, C.P.; Gao, H.; Ren, M.; Mifsud, B.; Ntalla, I.; Surendran, P.; Liu, C.; Cook, J.P.; et al. Genome-Wide Association Analysis Identifies Novel Blood Pressure Loci and Offers Biological Insights into Cardiovascular Risk. Nat. Genet. 2017, 49, 403–415. [Google Scholar] [CrossRef] [PubMed]
- Hoffmann, T.J.; Ehret, G.B.; Nandakumar, P.; Ranatunga, D.; Schaefer, C.; Kwok, P.Y.; Iribarren, C.; Chakravarti, A.; Risch, N. Genome-Wide Association Analyses using Electronic Health Records Identify New Loci Influencing Blood Pressure Variation. Nat. Genet. 2017, 49, 54–64. [Google Scholar] [CrossRef] [PubMed]
- Pande, J.; Mallhi, K.K.; Sawh, A.; Szewczyk, M.M.; Simpson, F.; Grover, A.K. Aortic Smooth Muscle and Endothelial Plasma Membrane Ca2+ Pump Isoforms are Inhibited Differently by the Extracellular Inhibitor Caloxin 1b1. Am. J. Physiol. Cell Physiol. 2006, 290, C1341–C1349. [Google Scholar] [CrossRef] [PubMed]
- Bogeski, I.; Kappl, R.; Kummerow, C.; Gulaboski, R.; Hoth, M.; Niemeyer, B.A. Redox Regulation of Calcium Ion Channels: Chemical and Physiological Aspects. Cell Calcium 2011, 50, 407–423. [Google Scholar] [CrossRef] [PubMed]
- Liu, S.X.; Hou, F.F.; Guo, Z.J.; Nagai, R.; Zhang, W.R.; Liu, Z.Q.; Zhou, Z.M.; Zhou, M.; Xie, D.; Wang, G.B.; et al. Advanced Oxidation Protein Products Accelerate Atherosclerosis through Promoting Oxidative Stress and Inflammation. Arterioscler. Thromb. Vasc. Biol. 2006, 26, 1156–1162. [Google Scholar] [CrossRef] [PubMed]
- Black, C.N.; Bot, M.; Scheffer, P.G.; Penninx, B.W. Sociodemographic and Lifestyle Determinants of Plasma Oxidative Stress Markers 8-OHdG and F2-Isoprostanes and Associations with Metabolic Syndrome. Oxid. Med. Cell. Longev. 2016, 2016. [Google Scholar] [CrossRef] [PubMed]
- Manna, P.; Jain, S.K. Obesity, Oxidative Stress, Adipose Tissue Dysfunction and the Associated Health Risks: Causes and Therapeutic Strategies. Metab. Syndr. Relat. Disord. 2015, 13, 423–444. [Google Scholar] [CrossRef] [PubMed]
- Moller, P.; Wallin, H.; Knudsen, L.E. Oxidative Stress Associated with Exercise, Psychological Stress and Life-Style Factors. Chem. Biol. Interact. 1996, 10, 17–36. [Google Scholar] [CrossRef]
- Wirtz, P.H.; von Kanel, R. Psychological Stress, Inflammation and Coronary Heart Disease. Curr. Cardiol. Rep. 2017, 19, 111. [Google Scholar] [CrossRef] [PubMed]
- Mujahid, M.S.; Roux, A.V.D.; Cooper, R.C.; Shea, S.; Williams, D.R. Neighborhood Stressors and race/ethnic Differences in Hypertension Prevalence (the Multi-Ethnic Study of Atherosclerosis). Am. J. Hypertens. 2011, 24, 187–193. [Google Scholar] [CrossRef] [PubMed]
- Diez Roux, A.V.; Chambless, L.; Merkin, S.S.; Arnett, D.; Eigenbrodt, M.; Nieto, F.J.; Szklo, M.; Sorlie, P. Socioeconomic Disadvantage and Change in Blood Pressure Associated with Aging. Circulation 2002, 106, 703–710. [Google Scholar] [CrossRef] [PubMed]
- Player, M.S.; King, D.E.; Mainous, A.G.; Geesey, M.E. Psychosocial Factors and Progression from Prehypertension to Hypertension or Coronary Heart Disease. Ann. Fam. Med. 2007, 5, 403–411. [Google Scholar] [CrossRef] [PubMed]
- Smith, T.W.; Glazer, K.; Ruiz, J.M.; Gallo, L.C. Hostility, Anger, Aggressiveness and Coronary Heart Disease: An Interpersonal Perspective on Personality, Emotion and Health. J. Personal. 2004, 72, 1217–1270. [Google Scholar] [CrossRef] [PubMed]
- Delaney, J.A.; Oddson, B.E.; Kramer, H.; Shea, S.; Psaty, B.M.; McClelland, R.L. Baseline Depressive Symptoms are Not Associated with Clinically Important Levels of Incident Hypertension during Two Years of Follow-Up the Multi-Ethnic Study of Atherosclerosis. Hypertension 2010, 55, 408–414. [Google Scholar] [CrossRef] [PubMed]
- Shinagawa, M.; Otsuka, K.; Murakami, S.; Kubo, Y.; Cornelissen, G.; Matsubayashi, K.; Yano, S.; Mitsutake, G.; Yasaka, K.; Halberg, F. Seven-Day (24-h) Ambulatory Blood Pressure Monitoring, Self-Reported Depression and Quality of Life Scores. Blood Press. Monit. 2002, 7, 69–76. [Google Scholar] [CrossRef] [PubMed]
- Jonas, B.S.; Franks, P.; Ingram, D.D. Are Symptoms of Anxiety and Depression Risk Factors for Hypertension? Longitudinal Evidence from the National Health and Nutrition Examination Survey I Epidemiologic Follow-Up Study. Arch. Fam. Med. 1997, 6, 43–49. [Google Scholar] [CrossRef] [PubMed]
- Ford, C.D.; Sims, M.; Higginbotham, J.C.; Crowther, M.R.; Wyatt, S.B.; Musani, S.K.; Payne, T.J.; Fox, E.R.; Parton, J.M. Psychosocial Factors are Associated with Blood Pressure Progression among African Americans in the Jackson Heart Study. Am. J. Hypertens. 2016, 29, 913–924. [Google Scholar] [CrossRef] [PubMed]
- Thomas, D. Gene-Environment-Wide Association Studies: Emerging Approaches. Nat. Rev. Genet. 2010, 11, 259–272. [Google Scholar] [CrossRef] [PubMed]
- Waken, R.J.; de Las Fuentes, L.; Rao, D.C. A Review of the Genetics of Hypertension with a Focus on Gene-Environment Interactions. Curr. Hypertens. Rep. 2017, 19, 23. [Google Scholar] [CrossRef] [PubMed]
- He, Z.; Zhang, M.; Lee, S.; Smith, J.A.; Kardia, S.L.R.; Diez Roux, A.V.; Mukherjee, B. Set-Based Tests for Gene-Environment Interaction in Longitudinal Studies. J. Am. Stat. Assoc. 2017, 112, 966–978. [Google Scholar] [CrossRef]
- Chiu, Y.F.; Justice, A.E.; Melton, P.E. Longitudinal Analytical Approaches to Genetic Data. BMC Genet. 2016, 17 (Suppl. 2), 4. [Google Scholar] [CrossRef] [PubMed]
- Kerner, B.; North, K.E.; Fallin, M.D. Use of Longitudinal Data in Genetic Studies in the Genome-Wide Association Studies Era: Summary of Group 14. Genet. Epidemiol. 2009, 33 (Suppl. 1), S93–S98. [Google Scholar] [CrossRef] [PubMed]
- The ARIC Investigators. The Atherosclerosis Risk in Communities (ARIC) Study: Design and Objectives. Am. J. Epidemiol. 1989, 129, 687–702. [Google Scholar]
- Sonnega, A.; Faul, J.D.; Ofstedal, M.B.; Langa, K.M.; Phillips, J.W.; Weir, D.R. Cohort Profile: The Health and Retirement Study (HRS). Int. J. Epidemiol. 2014, 43, 576–585. [Google Scholar] [CrossRef] [PubMed]
- Taylor, H.A., Jr.; Wilson, J.G.; Jones, D.W.; Sarpong, D.F.; Srinivasan, A.; Garrison, R.J.; Nelson, C.; Wyatt, S.B. Toward Resolution of Cardiovascular Health Disparities in African Americans: Design and Methods of the Jackson Heart Study. Ethn. Dis. 2005, 15, S6-4–S6-17. [Google Scholar] [PubMed]
- Wilson, J.G.; Rotimi, C.N.; Ekunwe, L.; Royal, C.D.; Crump, M.E.; Wyatt, S.B.; Steffes, M.W.; Adeyemo, A.; Zhou, J.; Taylor, H.A., Jr.; et al. Study Design for Genetic Analysis in the Jackson Heart Study. Ethn. Dis. 2005, 15, S6-30–S6-37. [Google Scholar] [PubMed]
- Bild, D.E.; Bluemke, D.A.; Burke, G.L.; Detrano, R.; Diez Roux, A.V.; Folsom, A.R.; Greenland, P.; Jacob, D.R., Jr.; Kronmal, R.; Liu, K.; et al. Multi-Ethnic Study of Atherosclerosis: Objectives and Design. Am. J. Epidemiol. 2002, 156, 871–881. [Google Scholar] [CrossRef] [PubMed]
- Tobin, M.D.; Sheehan, N.A.; Scurrah, K.J.; Burton, P.R. Adjusting for Treatment Effects in Studies of Quantitative Traits: Antihypertensive Therapy and Systolic Blood Pressure. Stat. Med. 2005, 24, 2911–2935. [Google Scholar] [CrossRef] [PubMed]
- Forgays, D.K.; Spielberger, C.D.; Ottaway, S.A.; Forgays, D.G. Factor Structure of the State-Trait Anger Expression Inventory for Middle-Aged Men and Women. Assessment 1998, 5, 141–155. [Google Scholar] [CrossRef] [PubMed]
- Radloff, S. The CES-D Scale: A Self Report Depression Scale for Research in the General Population. Appl. Psychol. Meas. 1977, 1, 385–401. [Google Scholar] [CrossRef]
- Appels, A.; Hoppener, P.; Mulder, P. A Questionnaire to Assess Premonitory Symptoms of Myocardial Infarction. Int. J. Cardiol. 1987, 17, 15–24. [Google Scholar] [CrossRef]
- Wojciechowski, F.L.; Strik, J.J.; Falger, P.; Lousberg, R.; Honig, A. The Relationship between Depressive and Vital Exhaustion Symptomatology Post-Myocardial Infarction. Acta Psychiatr. Scand. 2000, 102, 359–365. [Google Scholar] [CrossRef] [PubMed]
- Kopp, M.S.; Falger, P.R.; Appels, A.; Szedmak, S. Depressive Symptomatology and Vital Exhaustion are Differentially Related to Behavioral Risk Factors for Coronary Artery Disease. Psychosom. Med. 1998, 60, 752–758. [Google Scholar] [CrossRef] [PubMed]
- Wattanakit, K.; Williams, J.E.; Schreiner, P.J.; Hirsch, A.T.; Folsom, A.R. Association of Anger Proneness, Depression and Low Social Support with Peripheral Arterial Disease: The Atherosclerosis Risk in Communities Study. Vasc. Med. 2005, 10, 199–206. [Google Scholar] [CrossRef] [PubMed]
- Hek, K.; Demirkan, A.; Lahti, J.; Terracciano, A.; Teumer, A.; Cornelis, M.C.; Amin, N.; Bakshis, E.; Baumert, J.; Ding, J.; et al. A Genome-Wide Association Study of Depressive Symptoms. Biol. Psychiatry 2013, 73, 667–678. [Google Scholar] [CrossRef] [PubMed] [Green Version]
- IGSR: The International Genome Sample Resource. Available online: http://www.internationalgenome.org (accessed on 6 January 2017).
- GENCODE. Available online: www.gencodegenes.org (accessed on 6 January 2017).
- Liang, K.Y.; Zeger, S.L. Longitudinal Data Analysis using Generalized Linear Models. Biometrika 1986, 73, 13–22. [Google Scholar] [CrossRef]
- R Core Team. R: A Language and Environment for Statistical Computing; R Foundation for Statistical Computing: Vienna, Austria, 2013; Available online: http://www.R-project.org/ (accessed on 30 June 2017).
- Fisher, R.A. Statistical Methods for Research Workers; Oliver and Boyd: Edinburgh, Scotland, 1932. [Google Scholar]
- Kooperberg, C.; Leblanc, M. Increasing the Power of Identifying Gene x Gene Interactions in Genome-Wide Association Studies. Genet. Epidemiol. 2008, 32, 255–263. [Google Scholar] [CrossRef] [PubMed]
- Dai, J.Y.; Kooperberg, C.; Leblanc, M.; Prentice, R.L. Two-Stage Testing Procedures with Independent Filtering for Genome-Wide Gene-Environment Interaction. Biometrika 2012, 99, 929–944. [Google Scholar] [CrossRef] [PubMed]
- Benjamini, Y.; Hochberg, Y. Controlling the False Discovery Rate—A Practical and Powerful Approach to Multiple Testing. J. R. Stat. Soc. B Met. 1995, 57, 289–300. [Google Scholar]
- Willer, C.J.; Li, Y.; Abecasis, G.R. METAL: Fast and Efficient Meta-Analysis of Genomewide Association Scans. Bioinformatics 2010, 26, 2190–2191. [Google Scholar] [CrossRef] [PubMed]
- Colhoun, H.M.; Hemingway, H.; Poulter, N.R. Socio-Economic Status and Blood Pressure: An Overview Analysis. J. Hum. Hypertens. 1998, 12, 91–110. [Google Scholar] [CrossRef] [PubMed]
- Manolio, T.A.; Collins, F.S.; Cox, N.J.; Goldstein, D.B.; Hindorff, L.A.; Hunter, D.J.; McCarthy, M.I.; Ramos, E.M.; Cardon, L.R.; Chakravarti, A.; et al. Finding the Missing Heritability of Complex Diseases. Nature 2009, 461, 747–753. [Google Scholar] [CrossRef] [PubMed]
- Loucks, E.B.; Abrahamowicz, M.; Xiao, Y.; Lynch, J.W. Associations of Education with 30 Year Life Course Blood Pressure Trajectories: Framingham Offspring Study. BMC Public Health 2011, 11, 139. [Google Scholar] [CrossRef] [PubMed]
- Yan, L.L.; Liu, K.; Matthews, K.A.; Daviglus, M.L.; Ferguson, T.F.; Kiefe, C.I. Psychosocial Factors and Risk of Hypertension: The Coronary Artery Risk Development in Young Adults (CARDIA) Study. JAMA 2003, 290, 2138–2148. [Google Scholar] [CrossRef] [PubMed]
- Meng, L.; Chen, D.; Yang, Y.; Zheng, Y.; Hui, R. Depression Increases the Risk of Hypertension Incidence: A Meta-Analysis of Prospective Cohort Studies. J. Hypertens. 2012, 30, 842–851. [Google Scholar] [CrossRef] [PubMed]
- Nabi, H.; Chastang, J.F.; Lefevre, T.; Dugravot, A.; Melchior, M.; Marmot, M.G.; Shipley, M.J.; Kivimaki, M.; Singh-Manoux, A. Trajectories of Depressive Episodes and Hypertension Over 24 Years: The Whitehall II Prospective Cohort Study. Hypertension 2011, 57, 710–716. [Google Scholar] [CrossRef] [PubMed]
- Hildrum, B.; Romild, U.; Holmen, J. Anxiety and Depression Lowers Blood Pressure: 22-Year Follow-Up of the Population Based HUNT Study, Norway. BMC Public Health 2011, 11, 601. [Google Scholar] [CrossRef] [PubMed] [Green Version]
- Cohen, B.E.; Edmondson, D.; Kronish, I.M. State of the Art Review: Depression, Stress, Anxiety and Cardiovascular Disease. Am. J. Hypertens. 2015, 28, 1295–1302. [Google Scholar] [CrossRef] [PubMed]
- Parnell, L.D.; Blokker, B.A.; Dashti, H.S.; Nesbeth, P.D.; Cooper, B.E.; Ma, Y.; Lee, Y.C.; Hou, R.; Lai, C.Q.; Richardson, K.; et al. CardioGxE, a Catalog of Gene-Environment Interactions for Cardiometabolic Traits. BioData Min. 2014, 7, 21. [Google Scholar] [CrossRef] [PubMed]
- Simino, J.; Sung, Y.J.; Kume, R.; Schwander, K.; Rao, D.C. Gene-Alcohol Interactions Identify several Novel Blood Pressure Loci Including a Promising Locus Near SLC16A9. Front. Genet. 2013, 4, 277. [Google Scholar] [CrossRef] [PubMed]
- Sung, Y.J.; de Las Fuentes, L.; Schwander, K.L.; Simino, J.; Rao, D.C. Gene-Smoking Interactions Identify several Novel Blood Pressure Loci in the Framingham Heart Study. Am. J. Hypertens. 2015, 28, 343–354. [Google Scholar] [CrossRef] [PubMed]
- Basson, J.; Sung, Y.J.; de las Fuentes, L.; Schwander, K.; Cupples, L.A.; Rao, D.C. Influence of Smoking Status and Intensity on Discovery of Blood Pressure Loci through Gene-Smoking Interactions. Genet. Epidemiol. 2015, 39, 480–488. [Google Scholar] [CrossRef] [PubMed]
- Montasser, M.E.; Shimmin, L.C.; Hanis, C.L.; Boerwinkle, E.; Hixson, J.E. Gene by Smoking Interaction in Hypertension: Identification of a Major Quantitative Trait Locus on Chromosome 15q for Systolic Blood Pressure in Mexican-Americans. J. Hypertens. 2009, 27, 491–501. [Google Scholar] [CrossRef] [PubMed]
- Li, C.; He, J.; Chen, J.; Zhao, J.; Gu, D.; Hixson, J.E.; Rao, D.C.; Jaquish, C.E.; Gu, C.C.; Chen, J.; et al. Genome-Wide Gene-Sodium Interaction Analyses on Blood Pressure: The Genetic Epidemiology Network of Salt-Sensitivity Study. Hypertension 2016, 68, 348–355. [Google Scholar] [CrossRef] [PubMed]
- Simino, J.; Shi, G.; Bis, J.C.; Chasman, D.I.; Ehret, G.B.; Gu, X.; Guo, X.; Hwang, S.J.; Sijbrands, E.; Smith, A.V.; et al. Gene-Age Interactions in Blood Pressure Regulation: A Large-Scale Investigation with the CHARGE, Global BPgen and ICBP Consortia. Am. J. Hum. Genet. 2014, 95, 24–38. [Google Scholar] [CrossRef] [PubMed]
- Kim, Y.K.; Kim, Y.; Hwang, M.Y.; Shimokawa, K.; Won, S.; Kato, N.; Tabara, Y.; Yokota, M.; Han, B.G.; Lee, J.H.; et al. Identification of a Genetic Variant at 2q12.1 Associated with Blood Pressure in East Asians by Genome-Wide Scan Including Gene-Environment Interactions. BMC Med. Genet. 2014, 15, 65. [Google Scholar] [CrossRef] [PubMed]
- Basson, J.; Sung, Y.J.; Schwander, K.; Kume, R.; Simino, J.; de las Fuentes, L.; Rao, D. Gene-Education Interactions Identify Novel Blood Pressure Loci in the Framingham Heart Study. Am. J. Hypertens. 2014, 27, 431–444. [Google Scholar] [CrossRef] [PubMed]
- Coulon, S.M.; Wilson, D.K.; Van Horn, M.L.; Hand, G.A.; Kresovich, S. The Association of Neighborhood Gene-Environment Susceptibility with Cortisol and Blood Pressure in African-American Adults. Ann. Behav. Med. 2016, 50, 98–107. [Google Scholar] [CrossRef] [PubMed]
- Kawashima, A.; Kigoshi, T.; Katoh, Y.; Ishikawa, Y.; Shawki, H.H.; Inoue, N.; Tamba, M.; Matsuda, M.; Okamura, N. CABCOCO1, a Novel Coiled-Coil Protein with Calcium-Binding Activity, is Localized in the Sperm Flagellum. Mol. Reprod. Dev. 2016, 83, 912–926. [Google Scholar] [CrossRef] [PubMed]
- GTEx Portal. Available online: www.gtexportal.org (accessed on 7 July 2017).
- Hentze, M.W.; Muckenthaler, M.U.; Galy, B.; Camaschella, C. Two to Tango: Regulation of Mammalian Iron Metabolism. Cell 2010, 142, 24–38. [Google Scholar] [CrossRef] [PubMed]
- Reuben, A.; Chung, J.W.; Lapointe, R.; Santos, M.M. The Hemochromatosis Protein HFE 20 Years Later: An Emerging Role in Antigen Presentation and in the Immune System. Immun. Inflamm. Dis. 2017, 5, 218–232. [Google Scholar] [CrossRef] [PubMed]
- Feder, J.N.; Gnirke, A.; Thomas, W.; Tsuchihashi, Z.; Ruddy, D.A.; Basava, A.; Dormishian, F.; Domingo, R., Jr.; Ellis, M.C.; Fullan, A.; et al. A Novel MHC Class I-Like Gene is Mutated in Patients with Hereditary Haemochromatosis. Nat. Genet. 1996, 13, 399–408. [Google Scholar] [CrossRef] [PubMed]
- Piperno, A.; Trombini, P.; Gelosa, M.; Mauri, V.; Pecci, V.; Vergani, A.; Salvioni, A.; Mariani, R.; Mancia, G. Increased Serum Ferritin is Common in Men with Essential Hypertension. J. Hypertens. 2002, 20, 1513–1518. [Google Scholar] [CrossRef] [PubMed]
- Ellervik, C.; Tybjaerg-Hansen, A.; Appleyard, M.; Ibsen, H.; Nordestgaard, B.G. Haemochromatosis Genotype and Iron Overload: Association with Hypertension and Left Ventricular Hypertrophy. J. Intern. Med. 2010, 268, 252–264. [Google Scholar] [CrossRef] [PubMed]
- Pietrangelo, A. Hereditary Hemochromatosis: Pathogenesis, Diagnosis and Treatment. Gastroenterology 2010, 139, 393–408. [Google Scholar] [CrossRef] [PubMed]
- Rao, D.C.; Sung, Y.J.; Winkler, T.W.; Schwander, K.; Borecki, I.; Cupples, L.A.; Gauderman, W.J.; Rice, K.; Munroe, P.B.; Psaty, B.M.; et al. Multiancestry Study of Gene-Lifestyle Interactions for Cardiovascular Traits in 610 475 Individuals from 124 Cohorts: Design and Rationale. Circ. Cardiovasc. Genet. 2017, 10, e001649. [Google Scholar] [CrossRef] [PubMed]
- Bookman, E.B.; McAllister, K.; Gillanders, E.; Wanke, K.; Balshaw, D.; Rutter, J.; Reedy, J.; Shaughnessy, D.; Agurs-Collins, T.; Paltoo, D.; et al. Gene-Environment Interplay in Common Complex Diseases: Forging an Integrative Model-Recommendations from an NIH Workshop. Genet. Epidemiol. 2011, 35, 217–225. [Google Scholar] [CrossRef] [PubMed]


| ARIC | HRS | JHS | MESA | |||||
|---|---|---|---|---|---|---|---|---|
| Total N b | Mean (SD) or N (%) | Total N b | Mean (SD) or N (%) | Total N b | Mean (SD) or N (%) | Total N b | Mean (SD) or N (%) | |
| European Ancestry | ||||||||
| Gender (Male) | 9274 | 4379 (47) | 9441 | 4037 (43) | -- | -- | 2518 | 1205 (48) |
| Age, years | 9274 | 54.3 (5.7) | 9441 | 67.3 (10.9) | -- | -- | 2518 | 62.7 (10.2) |
| BMI, kg/m2 | 9274 | 26.9 (4.7) | 9441 | 28.9 (5.6) | -- | -- | 2518 | 27.7 (5.0) |
| SBP, mmHg c | 9265 | 122.0 (19.3) | 9440 | 136.8 (22.5) | -- | -- | 2516 | 128.4 (23.0) |
| DBP, mmHg c | 9266 | 74.1 (11.4) | 9434 | 83.7 (12.3) | -- | -- | 2518 | 73.5 (11.3) |
| Lower Adult SES d | 9262 | 4826 (52) | 9420 | 4704 (50) | -- | -- | 2510 | 549 (22) |
| Lower Childhood SES e | 7338 | 3877 (53%) | 8462 | 3204 (38%) | -- | -- | 2359 | 677 (29) |
| Outward/Trait Anger Score | 8920 | 1.6 (0.4) | 8574 | 1.5 (0.5) | -- | -- | 2509 | 1.5 (0.3) |
| Depressive Symptom Score | 8924 | 0.2 (0.2) | 9441 | 0.2 (0.2) | -- | -- | 2507 | 0.1 (0.1) |
| Chronic Burden Score | -- | -- | 5167 | 1.7 (1.3) | -- | -- | 2510 | 1.1 (1.1) |
| African Ancestry | ||||||||
| Gender (Male) | 3155 | 1182 (38) | 2060 | 770 (37) | 2117 | 836 (40) | 1608 | 743 (46) |
| Age, years | 3155 | 53.4 (5.8) | 2060 | 63.2 (10.5) | 2117 | 50.4 (12.0) | 1608 | 62.3 (10.1) |
| BMI, kg/m2 | 3155 | 29.5 (5.8) | 2060 | 30.6 (6.5) | 2117 | 32.1 (7.3) | 1608 | 30.1 (5.8) |
| SBP, mmHg c | 3146 | 134.6 (22.4) | 2060 | 144.1 (24.3) | 2115 | 131.7 (19.5) | 1606 | 139.1 (24.5) |
| DBP, mmHg c | 3153 | 84.1 (13.4) | 2059 | 88.8 (13.7) | 2117 | 80.8 (10.3) | 1607 | 79.5 (11.7) |
| Lower Adult SES d | 3148 | 1931 (61) | 2055 | 1294 (63) | 2113 | 637 (30) | 1595 | 497 (31) |
| Lower Childhood SES e | 2014 | 1541 (77%) | 1759 | 1025 (58%) | 1824 | 855 (47) | 1412 | 623 (44) |
| Outward/Trait Anger Score | 2885 | 1.6 (0.4) | 1502 | 1.5 (0.5) | 1380 | 1.6 (0.4) | 1593 | 1.4 (0.3) |
| Depressive Symptom Score | 2887 | 0.3 (0.2) | 2058 | 0.2 (0.3) | 1429 | 0.2 (0.2) | 1590 | 0.1 (0.1) |
| Chronic Burden Score | -- | -- | 982 | 2.2 (1.4) | 1506 | 0.9 (1.2) | 1593 | 1.2 (1.2) |
| SBP | DBP | |||
|---|---|---|---|---|
| Beta | p-Value | Beta | p-Value | |
| European Ancestry | ||||
| Lower Adult SES a | 2.83 | <5 × 10⁻⁶ | 0.52 | 3.6 × 10⁻⁴ |
| Lower Childhood SES b | 1.83 | <5 × 10⁻⁶ | 0.12 | 0.431 |
| Outward/Trait Anger Score | 0.42 | 0.097 | 0.13 | 0.375 |
| Depressive Symptom Score | 0.32 | 0.566 | −0.24 | 0.459 |
| Chronic Burden Score | −0.02 | 0.871 | −0.03 | 0.629 |
| African Ancestry | ||||
| Lower Adult SES a | 2.77 | <5 × 10⁻⁶ | 1.10 | <5 × 10⁻⁶ |
| Lower Childhood SES b | 0.52 | 0.268 | −0.04 | 0.887 |
| Outward/Trait Anger Score | 0.95 | 0.027 | 0.57 | 0.019 |
| Depressive Symptom Score | 1.36 | 0.186 | 1.80 | 0.002 |
| Chronic Burden Score | 0.64 | 0.002 | 0.25 | 0.020 |
| European Ancestry + African Ancestry | ||||
| Lower Adult SES a | 2.81 | <5 × 10⁻⁶ | 0.68 | <5 × 10⁻⁶ |
| Lower Childhood SES b | 1.49 | <5 × 10⁻⁶ | 0.08 | 0.545 |
| Outward/Trait Anger Score | 0.56 | 0.011 | 0.24 | 0.050 |
| Depressive Symptom Score | 0.56 | 0.255 | 0.25 | 0.377 |
| Chronic Burden Score | 0.16 | 0.142 | 0.05 | 0.408 |
| SBP | DBP | |||||
|---|---|---|---|---|---|---|
| Genomic Region | EA | AA | EA + AA | EA | AA | EA + AA |
| p-Value | p-Value | p-Value | p-Value | p-Value | p-Value | |
| ARHGAP42 | 0.1157 | 0.9122 | 0.4840 | 0.7648 | 0.6353 | 0.8013 |
| ATP2B1 | <5 × 10⁻⁶ | 0.9550 | <5 × 10⁻⁶ * | 0.0001 * | 0.6745 | 0.0015 * |
| BAG6 | 0.5830 | 0.6999 | 0.7427 | 0.6535 | 0.5613 | 0.6999 |
| C10orf107 | 0.2420 | 0.7852 | 0.5516 | 0.0094 * | 0.0462 | 0.0032 * |
| CACNB2 | 0.0032 * | 0.6633 | 0.0297 | 0.1055 | 0.4553 | 0.1948 |
| CSK | 0.0002 * | 0.1863 | 0.0006 * | 0.0015 * | 0.5212 | 0.0115 * |
| FES | 0.0057 * | 0.9461 | 0.1008 | 0.0049 * | 0.5335 | 0.0289 |
| GOSR2 | 0.0005 * | 0.2659 | 0.0019 * | 0.0413 | 0.1341 | 0.0298 |
| GUCY1A3 | 0.2639 | 0.0055 | 0.0093 * | 0.6453 | 0.0645 | 0.1662 |
| HFE | 0.0549 | 0.0242 | 0.0077 * | 0.0355 | 0.1282 | 0.0254 |
| MECOM | 0.0043 * | 0.3570 | 0.0155 | 0.0001 * | 0.1986 | 0.0003 * |
| MTHFR | 0.0236 | 0.8904 | 0.1973 | 0.0003 * | 0.9941 | 0.0191 |
| NT5C2 | 0.0111 * | 0.0478 | 0.0038* | 0.0025* | 0.6324 | 0.0228 |
| PLCE1 | 0.6174 | 0.0817 | 0.1873 | 0.3960 | 0.3966 | 0.4036 |
| PLEKHA7 | 0.1594 | 0.1885 | 0.1151 | 0.2518 | 0.2767 | 0.2230 |
| PLEKHG1 | 0.0256 | 0.6792 | 0.1270 | 0.0044 * | 0.3302 | 0.0142 |
| rs10850411 | 0.3666 | 0.2214 | 0.2460 | 0.0688 | 0.5504 | 0.1816 |
| rs1173771 | 0.2511 | 0.5098 | 0.3729 | 0.7050 | 0.6744 | 0.7945 |
| rs11953630 | 0.3041 | 0.4429 | 0.3722 | 0.0352 | 0.4752 | 0.0984 |
| rs13082711 | 0.0082 * | 0.7951 | 0.0798 | 0.0654 | 0.2571 | 0.0794 |
| rs13209747 | 0.5173 | 0.1037 | 0.1869 | 0.0171 | 0.5513 | 0.0725 |
| rs1327235 | 0.0445 | 0.0356 | 0.0092 | 0.0037 * | 0.0613 | 0.0019 * |
| rs1458038 | 0.0083 * | 0.3549 | 0.0249 | 0.0235 | 0.4374 | 0.0677 |
| rs17428471 | 0.0007 * | 0.0022 | 1.7 × 10⁻⁵ * | 0.0435 | 0.0690 | 0.0166 |
| rs2932538 | 0.0704 | 0.8772 | 0.3506 | 0.4944 | 0.9010 | 0.8393 |
| rs4373814 | 0.0160 * | 0.4816 | 0.0582 | 0.2120 | 0.5541 | 0.3639 |
| rs7129220 | 0.4061 | 0.8965 | 0.7845 | 0.4627 | 0.6577 | 0.6413 |
| SH2B3 | 0.0581 | 0.1463 | 0.0423 | 0.0048 * | 0.2540 | 0.0111 * |
| SLC39A8 | 0.2630 | 0.4592 | 0.3505 | 0.4093 | 0.3212 | 0.3527 |
| SOX6 | 0.0024 * | 0.7271 | 0.0289 | 0.0574 | 0.0306 | 0.0099 * |
| ULK4 | 0.3536 | 0.6047 | 0.5235 | 0.2123 | 0.0626 | 0.0571 |
| ZNF652 | 0.7850 | 0.0840 | 0.2508 | 0.2715 | 0.0047 | 0.0085 * |
| ZNF831 | 0.1331 | 0.8755 | 0.4803 | 0.1674 | 0.4666 | 0.2681 |
| Number of genes with p < 0.2 | 21 | 11 | 21 | 21 | 10 | 23 |
| Number of genes with FDR q < 0.05 | 12 | 0 | 7 | 10 | 0 | 8 |
| Ancestry | Psychosocial Factor | Genomic Region | Number of SNPs a | ARIC p-Value | HRS p-Value | JHS p-Value | MESA p-Value | Meta-Analysis p-Value (FDR q) b |
|---|---|---|---|---|---|---|---|---|
| EA | Outward/Trait Anger Score | C10orf107 | 365–400 | 0.801 | 0.085 | N/A | 0.0004 | 0.0019 (0.049) |
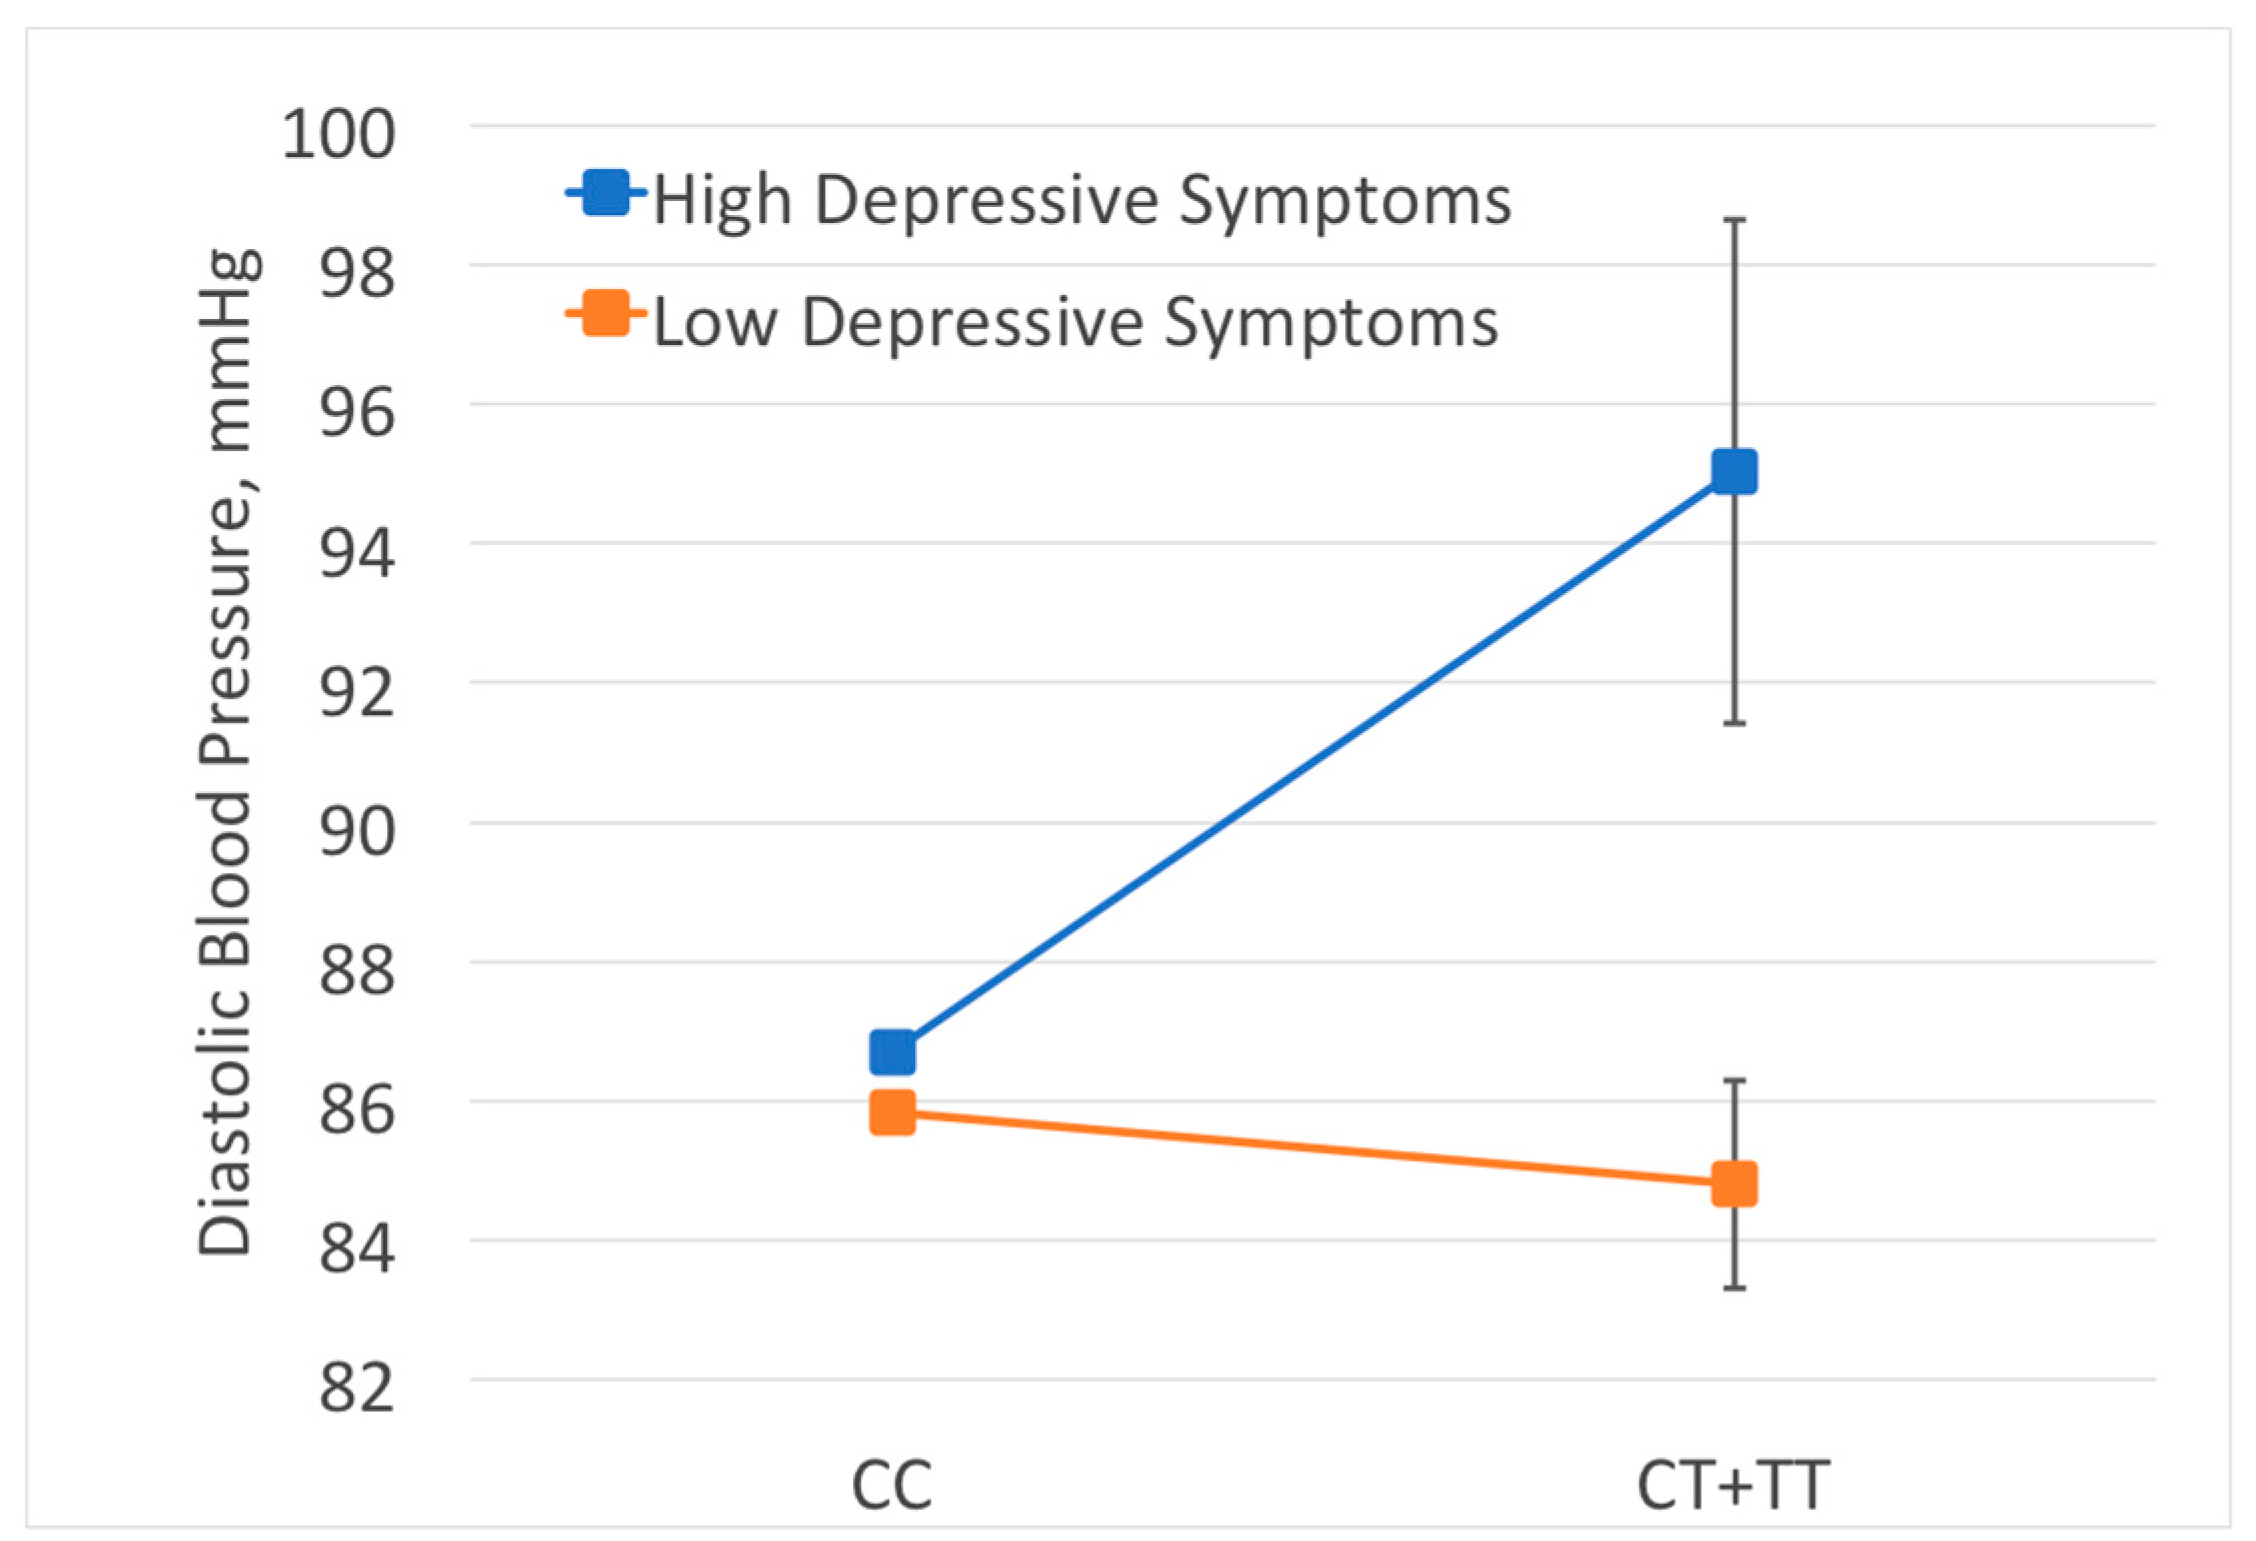
| AA | Depressive Symptom Score | HFE | 46–84 | 0.006 | 0.162 | 0.550 | 0.031 | 0.0048 (0.048) |
© 2017 by the authors. Licensee MDPI, Basel, Switzerland. This article is an open access article distributed under the terms and conditions of the Creative Commons Attribution (CC BY) license (http://creativecommons.org/licenses/by/4.0/).
Share and Cite
Smith, J.A.; Zhao, W.; Yasutake, K.; August, C.; Ratliff, S.M.; Faul, J.D.; Boerwinkle, E.; Chakravarti, A.; Diez Roux, A.V.; Gao, Y.; et al. Gene-by-Psychosocial Factor Interactions Influence Diastolic Blood Pressure in European and African Ancestry Populations: Meta-Analysis of Four Cohort Studies. Int. J. Environ. Res. Public Health 2017, 14, 1596. https://0-doi-org.brum.beds.ac.uk/10.3390/ijerph14121596
Smith JA, Zhao W, Yasutake K, August C, Ratliff SM, Faul JD, Boerwinkle E, Chakravarti A, Diez Roux AV, Gao Y, et al. Gene-by-Psychosocial Factor Interactions Influence Diastolic Blood Pressure in European and African Ancestry Populations: Meta-Analysis of Four Cohort Studies. International Journal of Environmental Research and Public Health. 2017; 14(12):1596. https://0-doi-org.brum.beds.ac.uk/10.3390/ijerph14121596
Chicago/Turabian StyleSmith, Jennifer A., Wei Zhao, Kalyn Yasutake, Carmella August, Scott M. Ratliff, Jessica D. Faul, Eric Boerwinkle, Aravinda Chakravarti, Ana V. Diez Roux, Yan Gao, and et al. 2017. "Gene-by-Psychosocial Factor Interactions Influence Diastolic Blood Pressure in European and African Ancestry Populations: Meta-Analysis of Four Cohort Studies" International Journal of Environmental Research and Public Health 14, no. 12: 1596. https://0-doi-org.brum.beds.ac.uk/10.3390/ijerph14121596