Policy, Research and Residents’ Perspectives on Built Environments Implicated in Heart Disease: A Concept Mapping Approach


Abstract
:1. Introduction
2. Study Context
3. Methods
3.1. Recruitment
3.2. Data Collection Procedure
3.2.1. Preparation
3.2.2. Brainstorming
3.2.3. Rating
3.2.4. Sorting
3.3. Analysis
3.4. Interpretation of Maps
4. Results
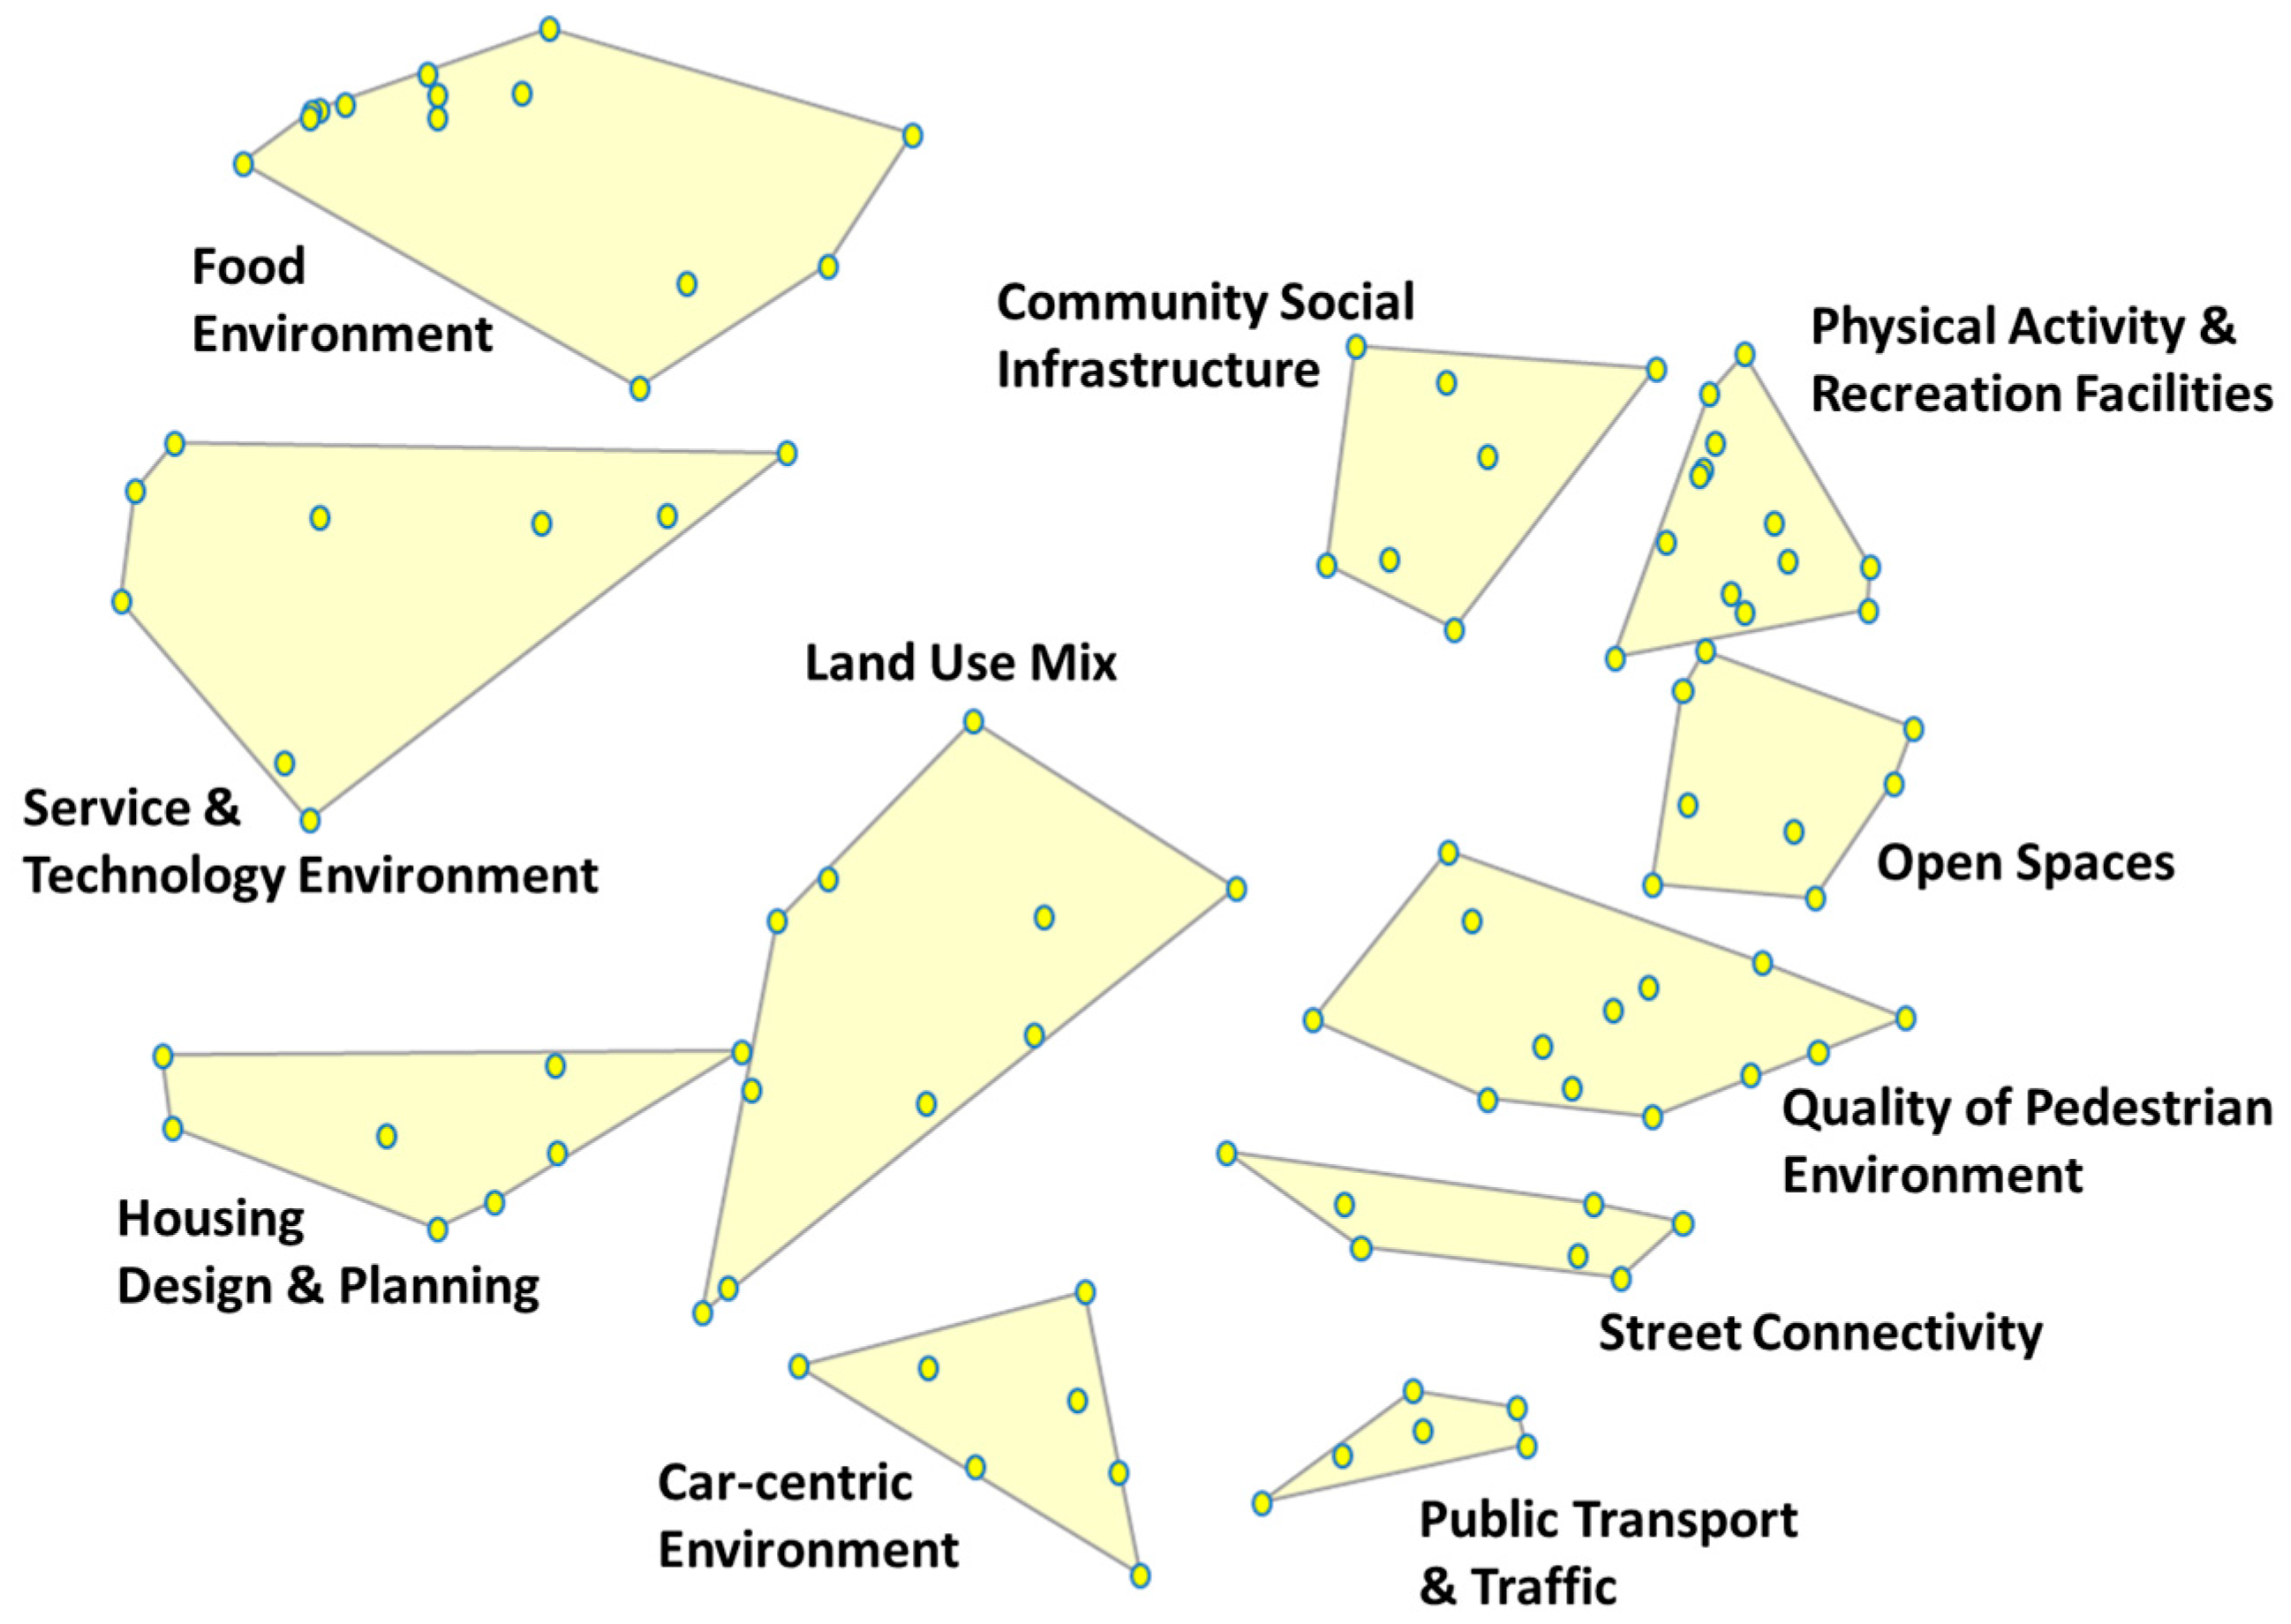
4.1. Sorting
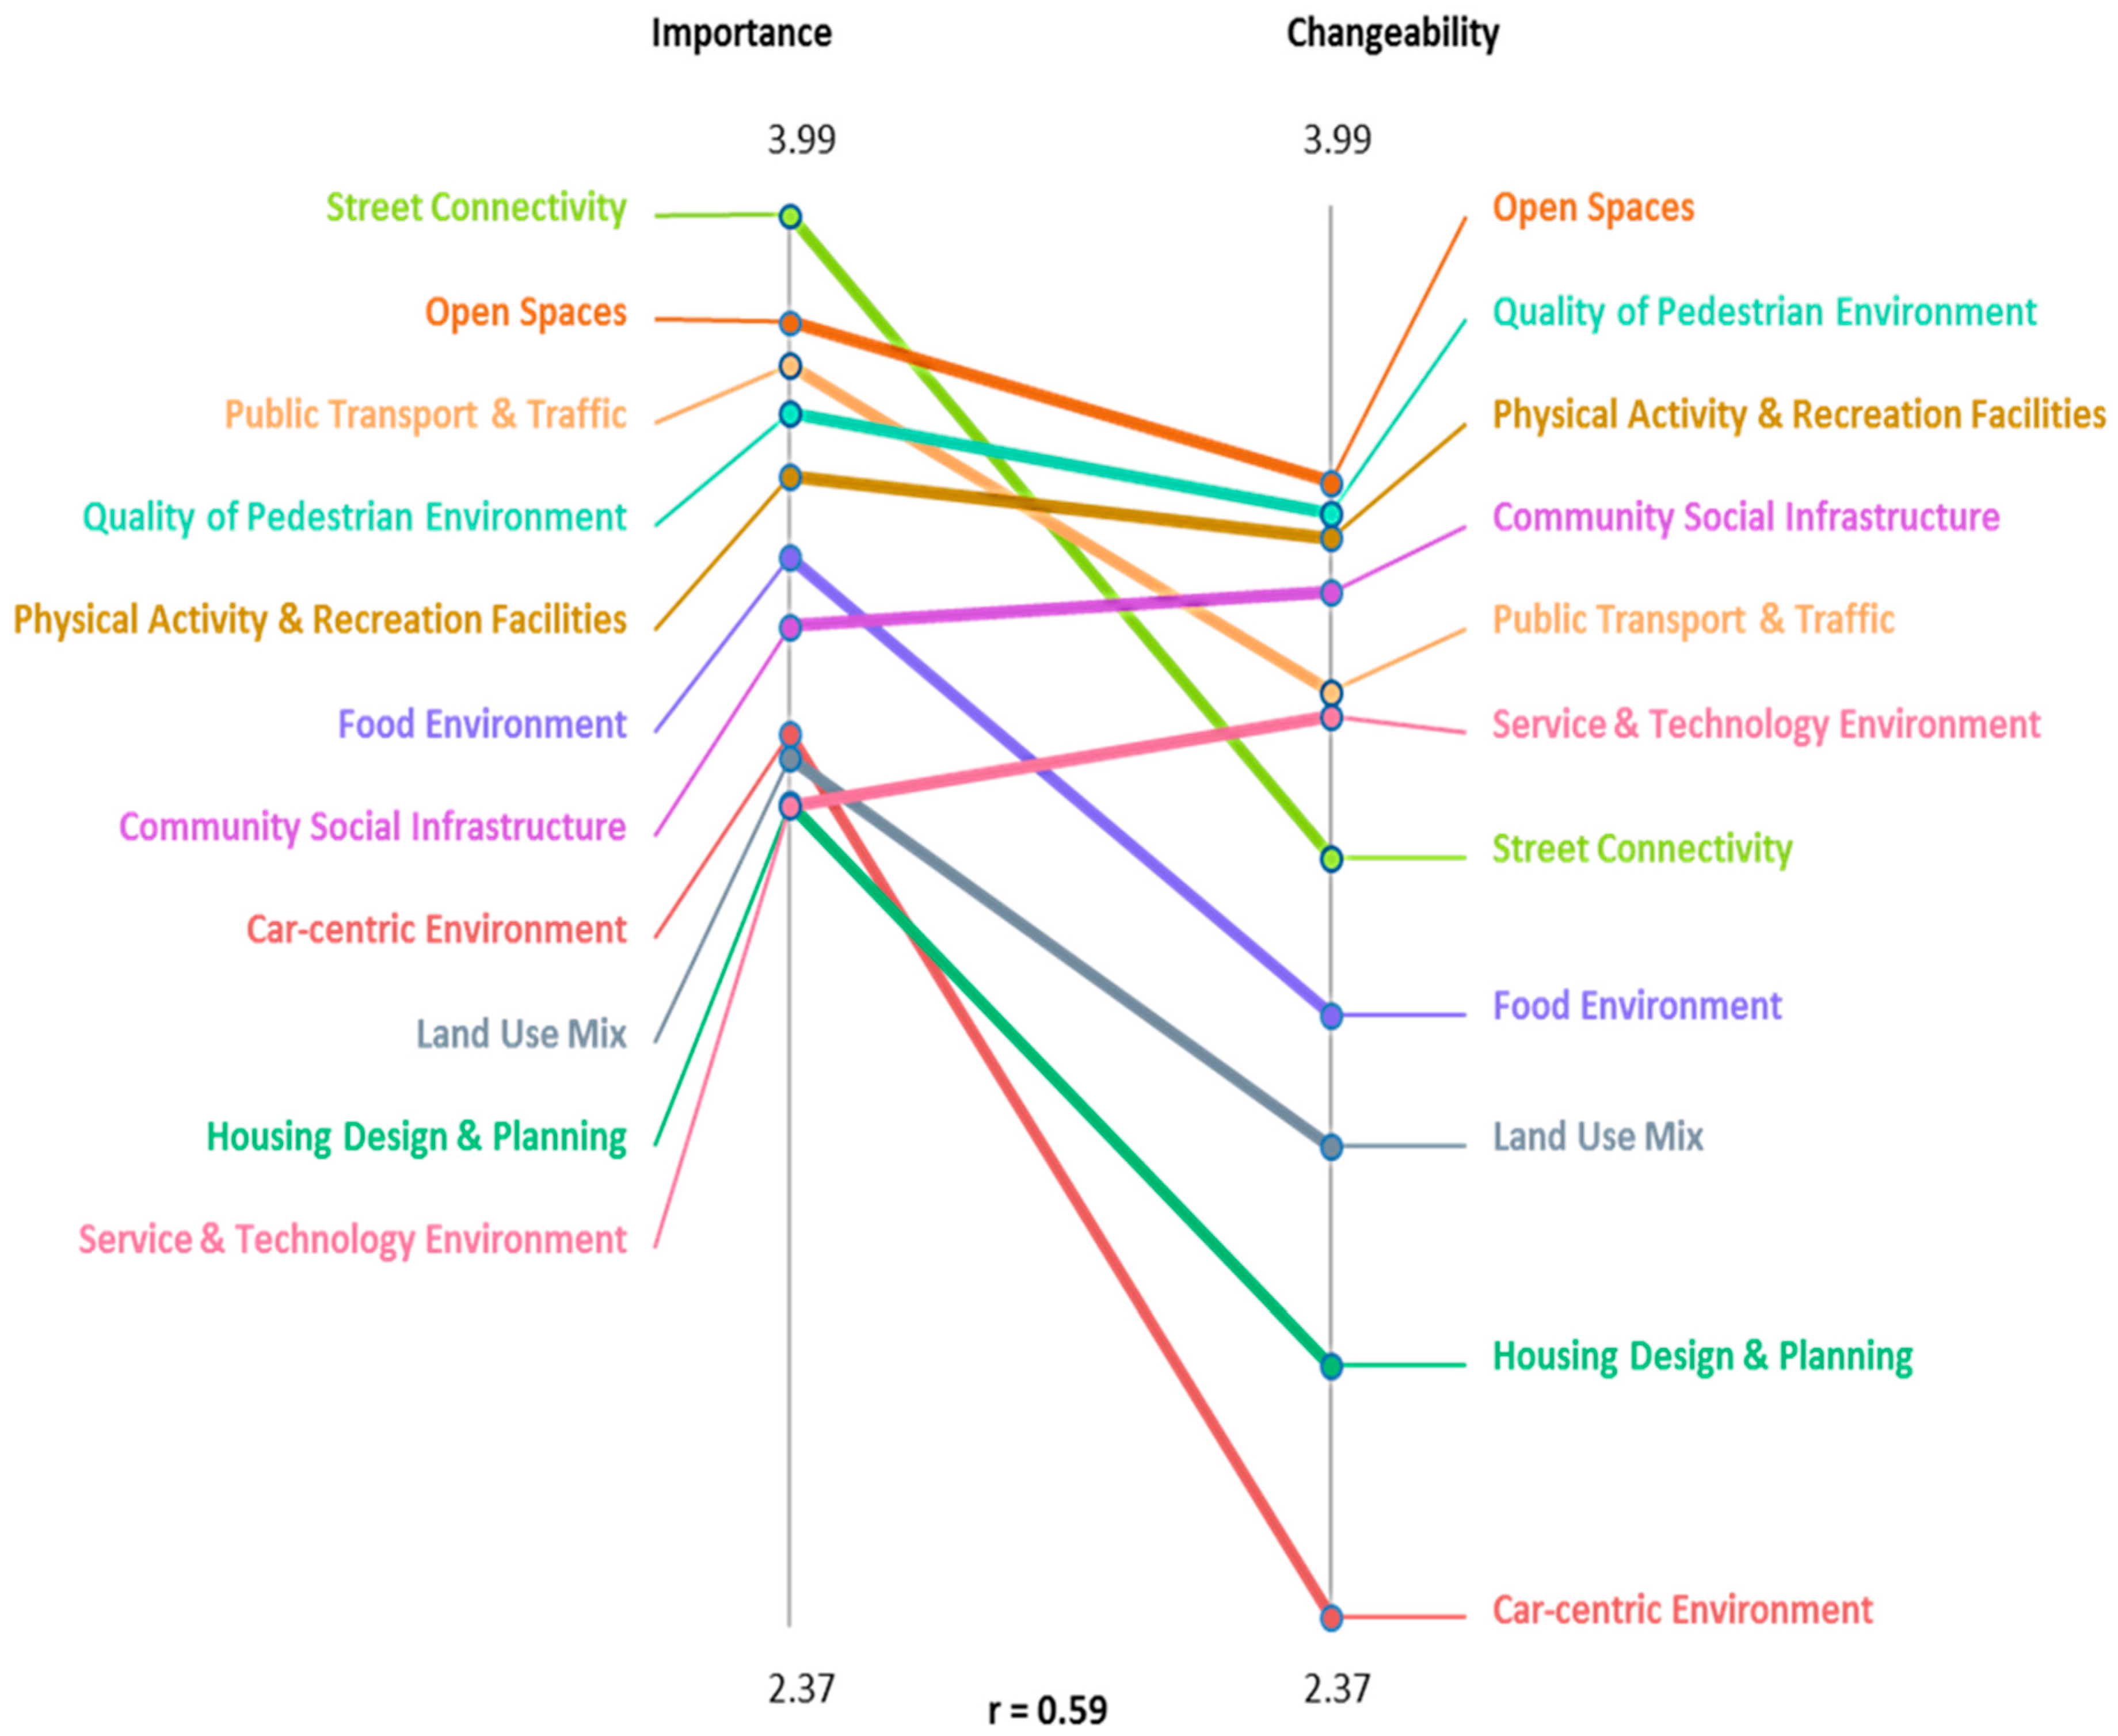
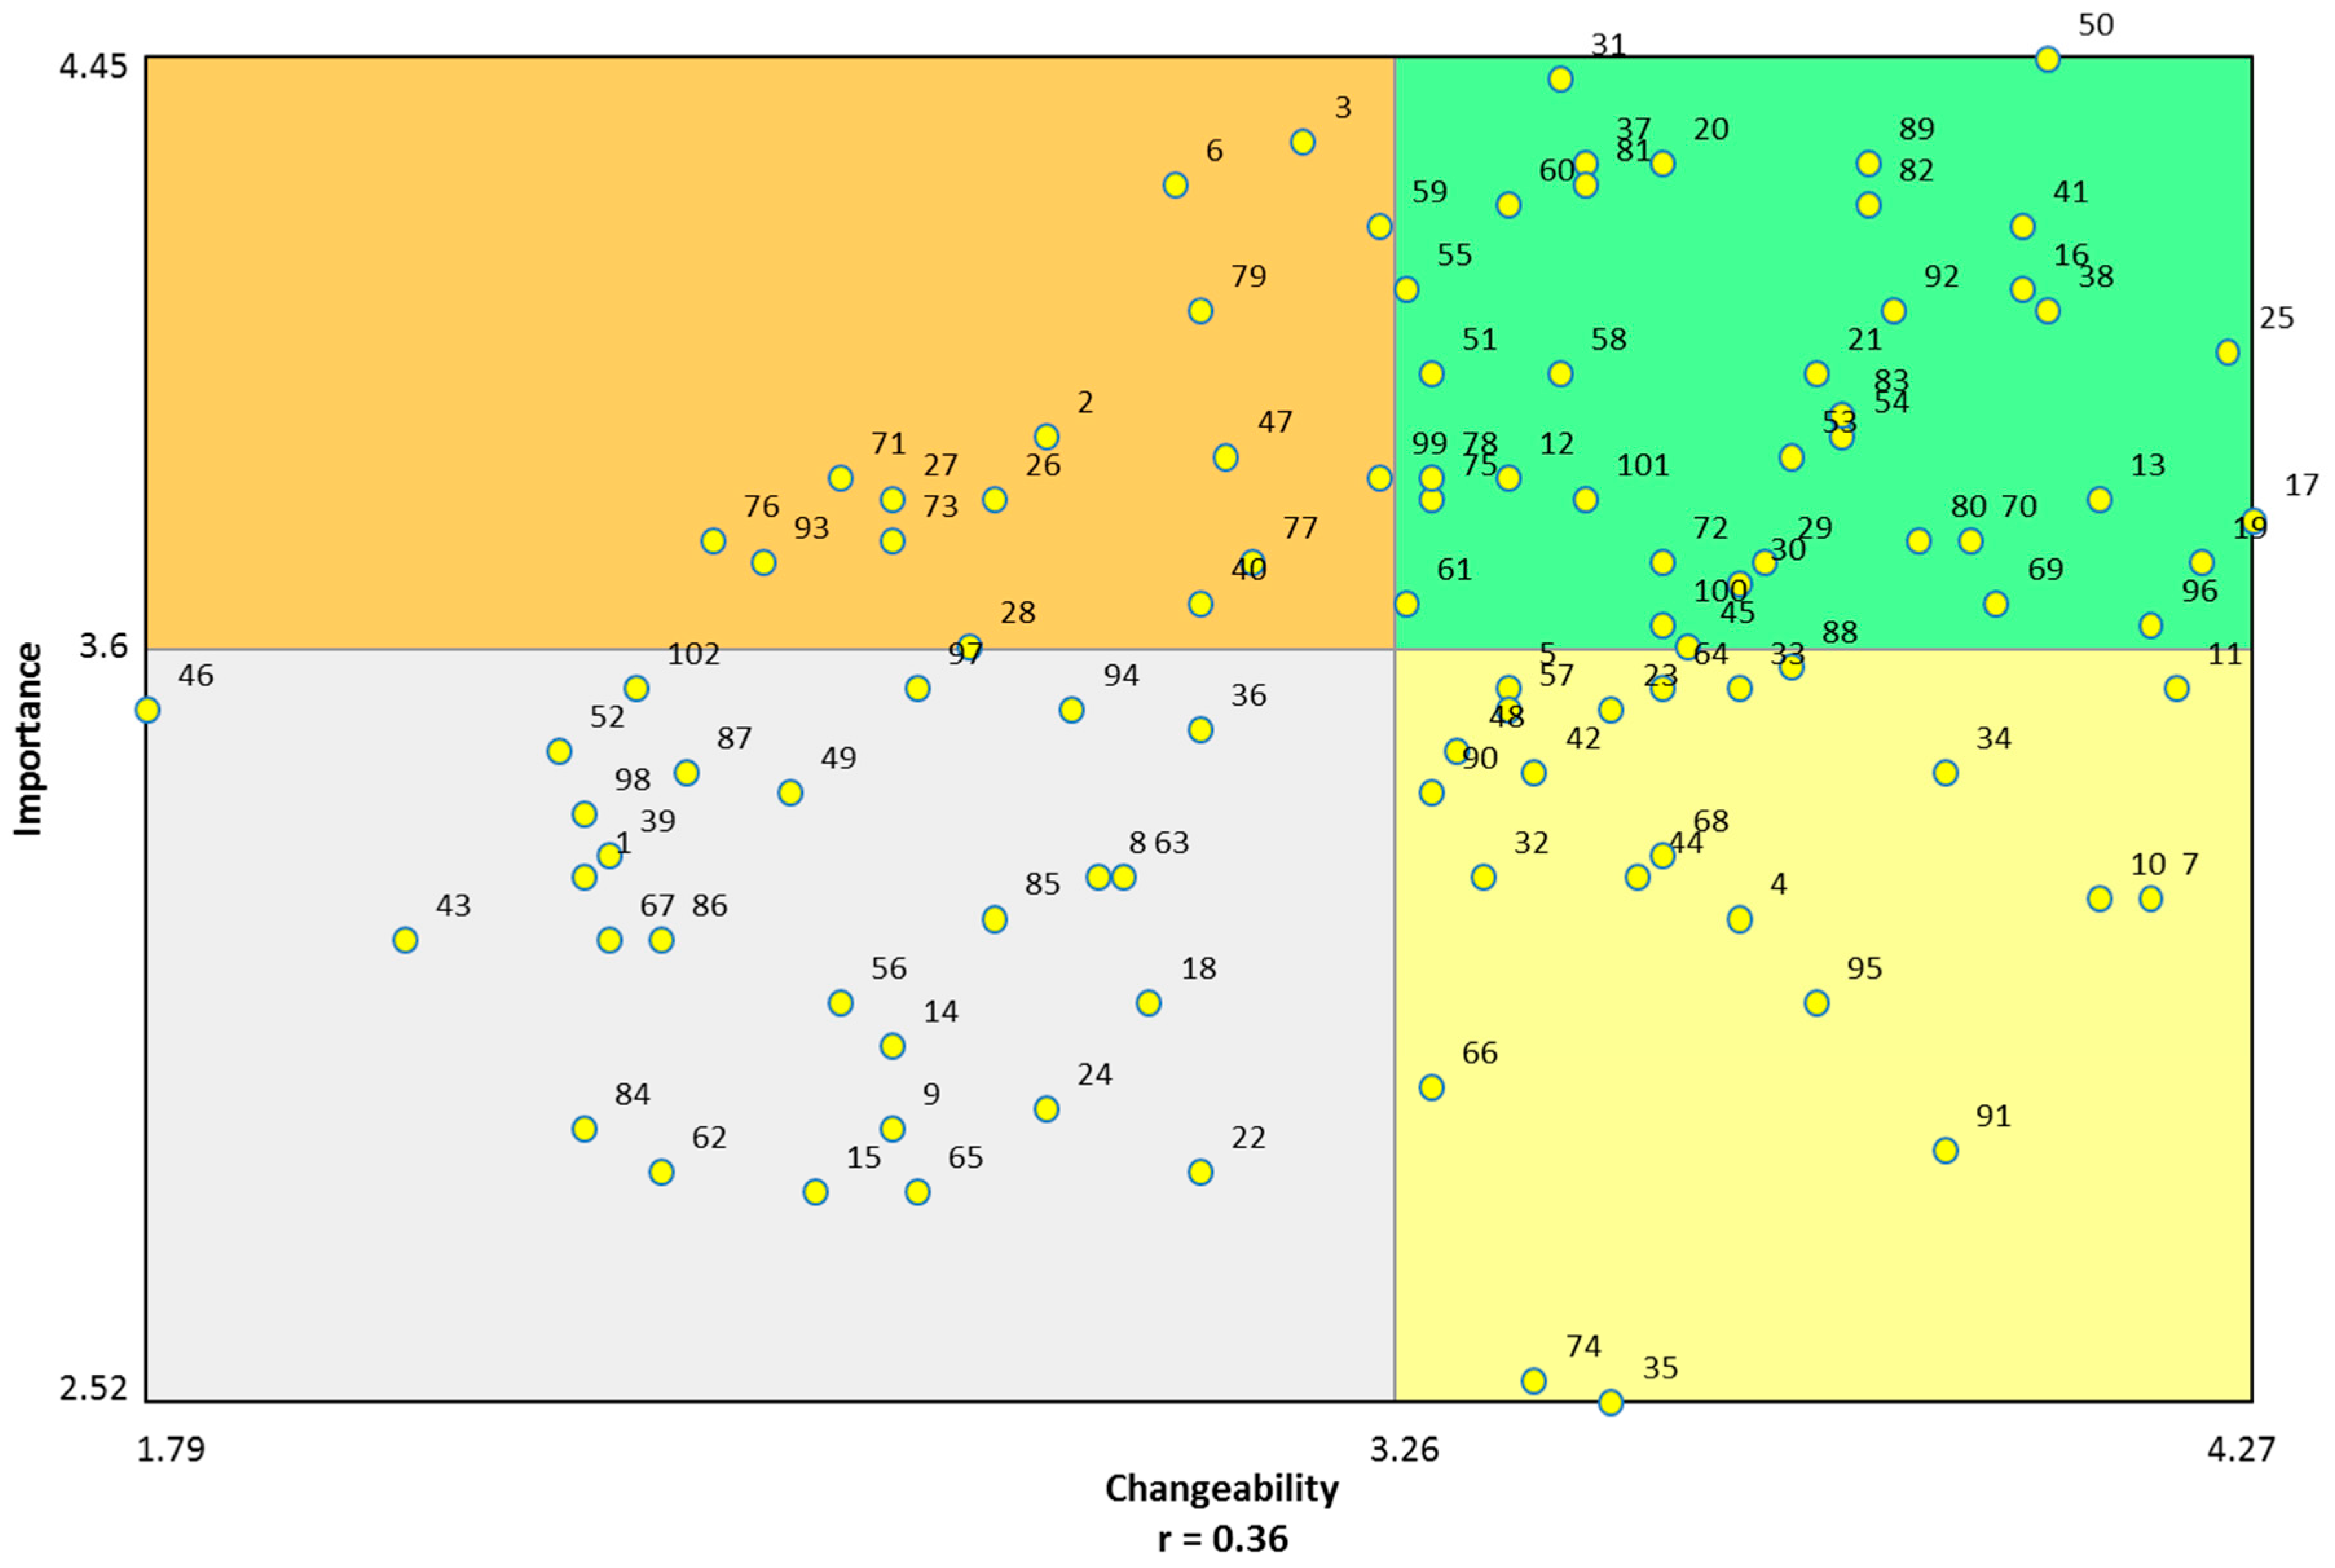
4.2. Rating
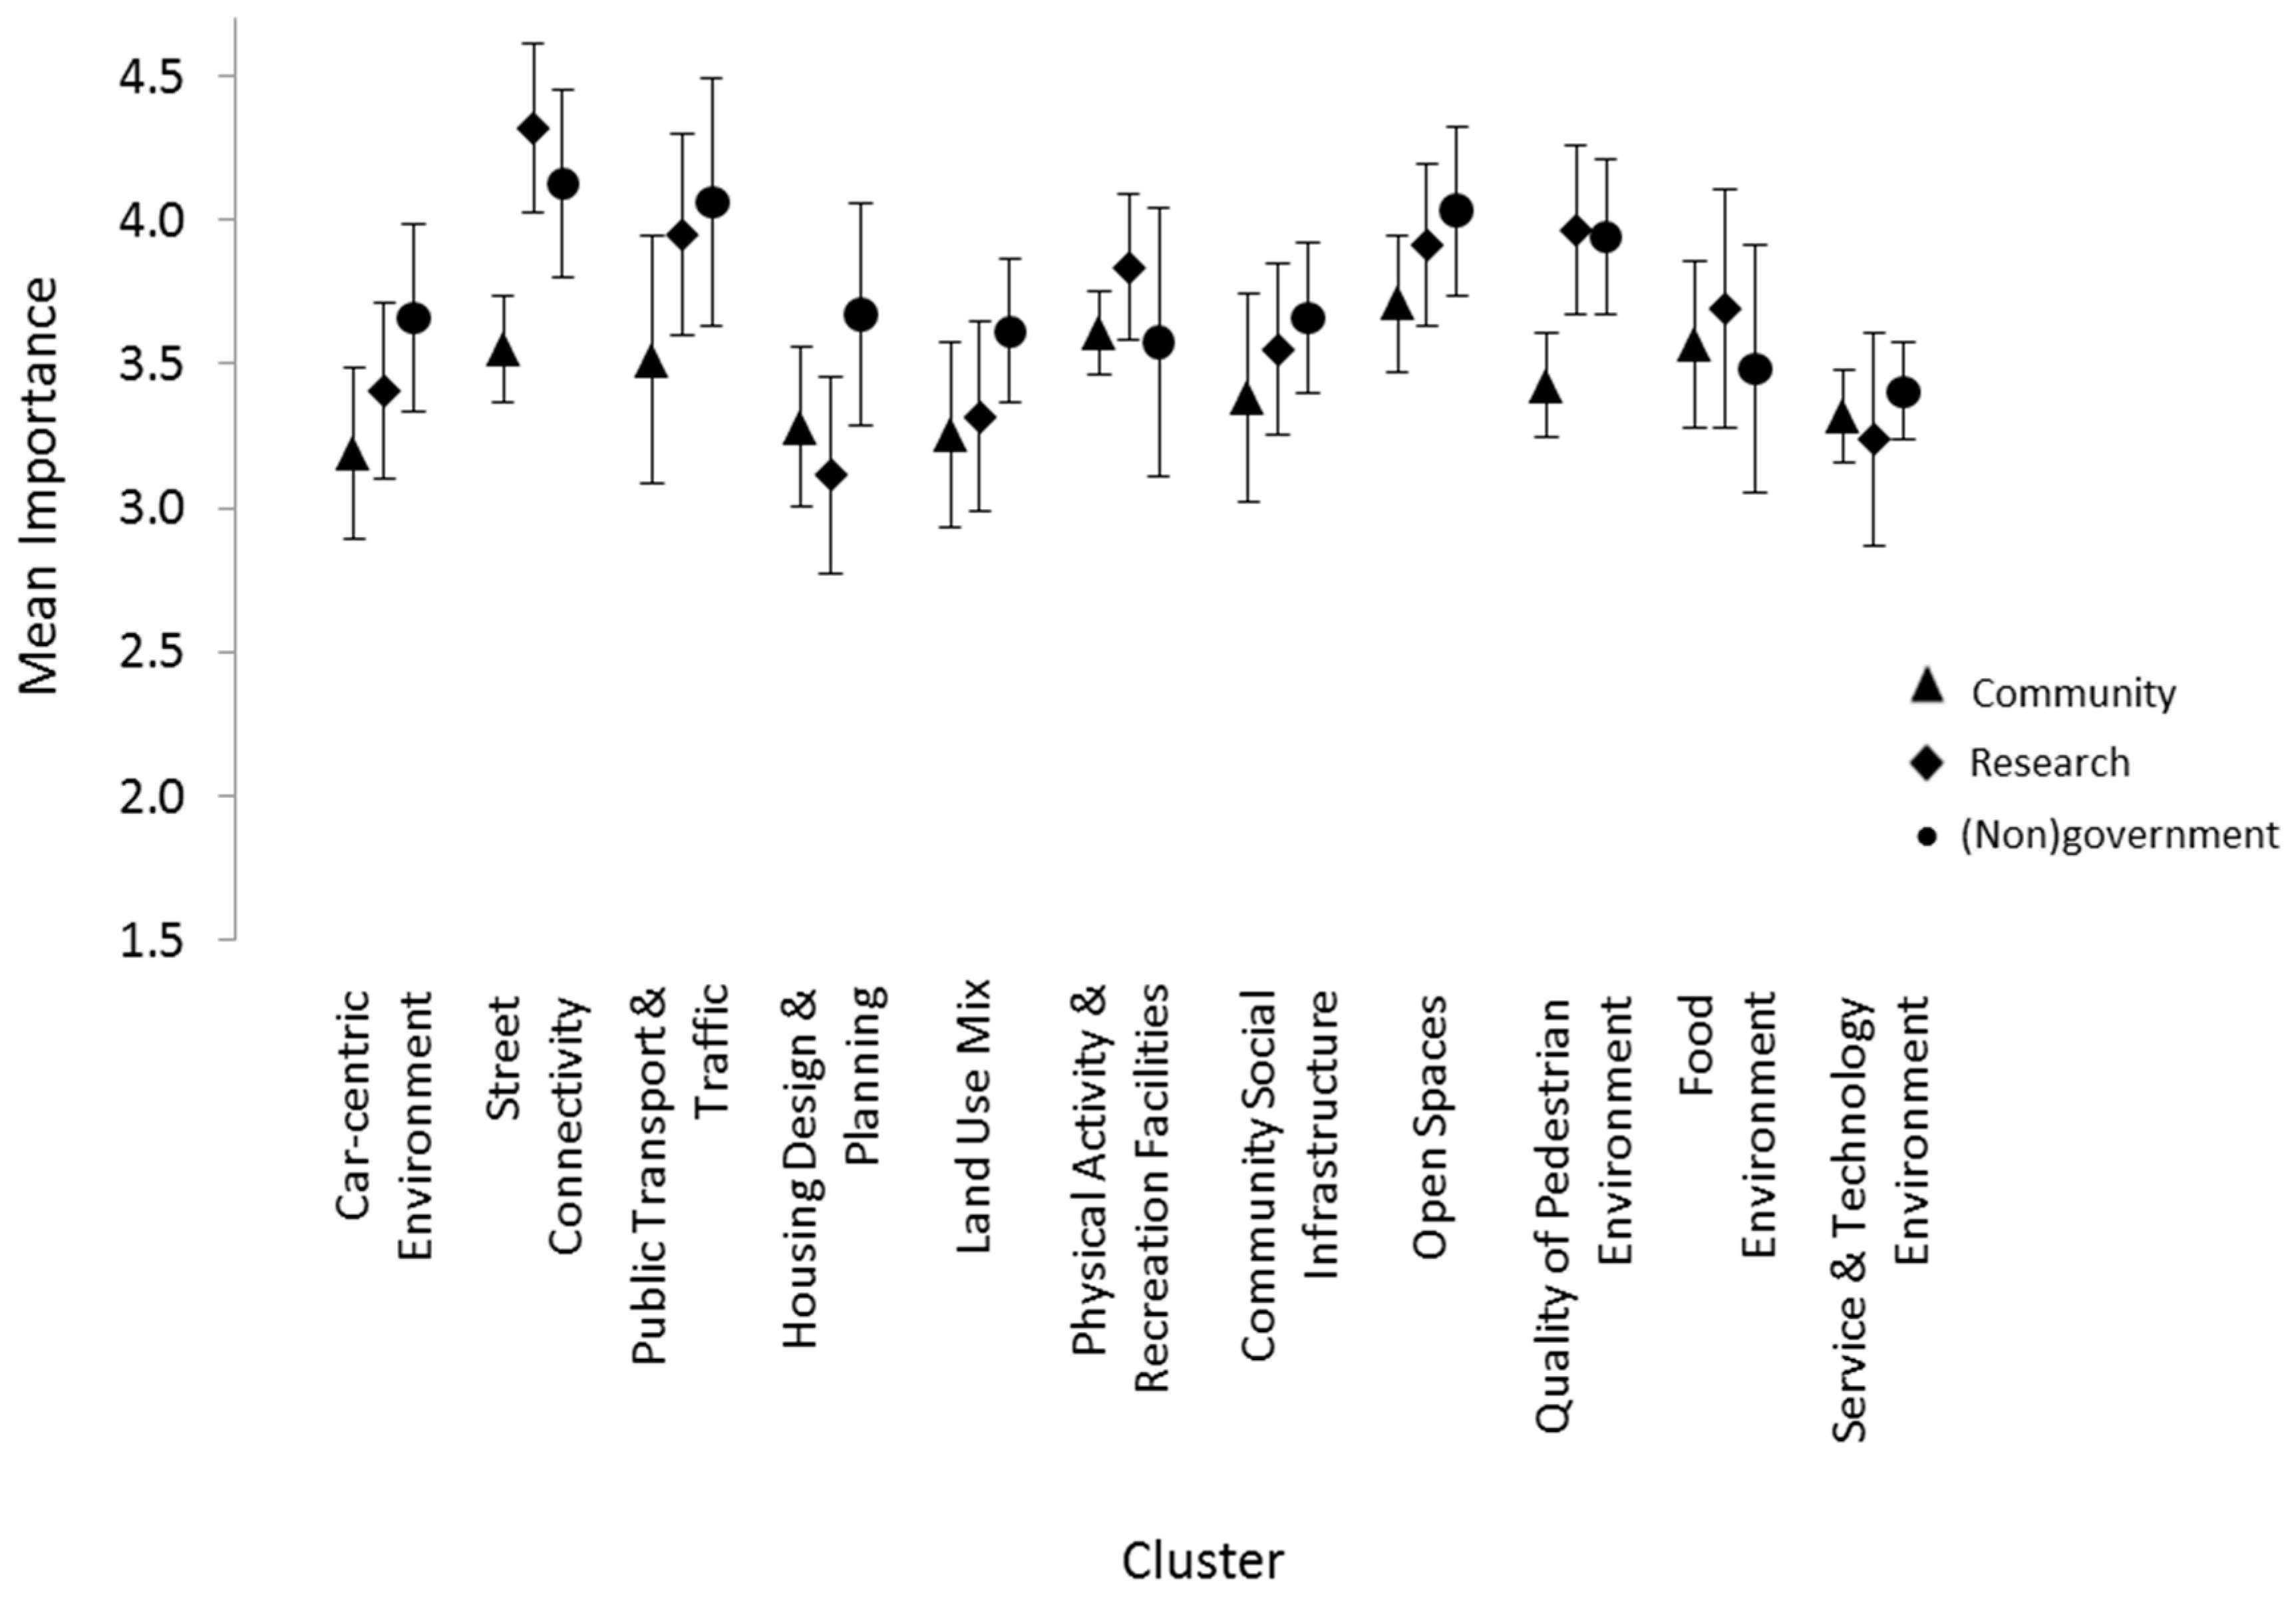
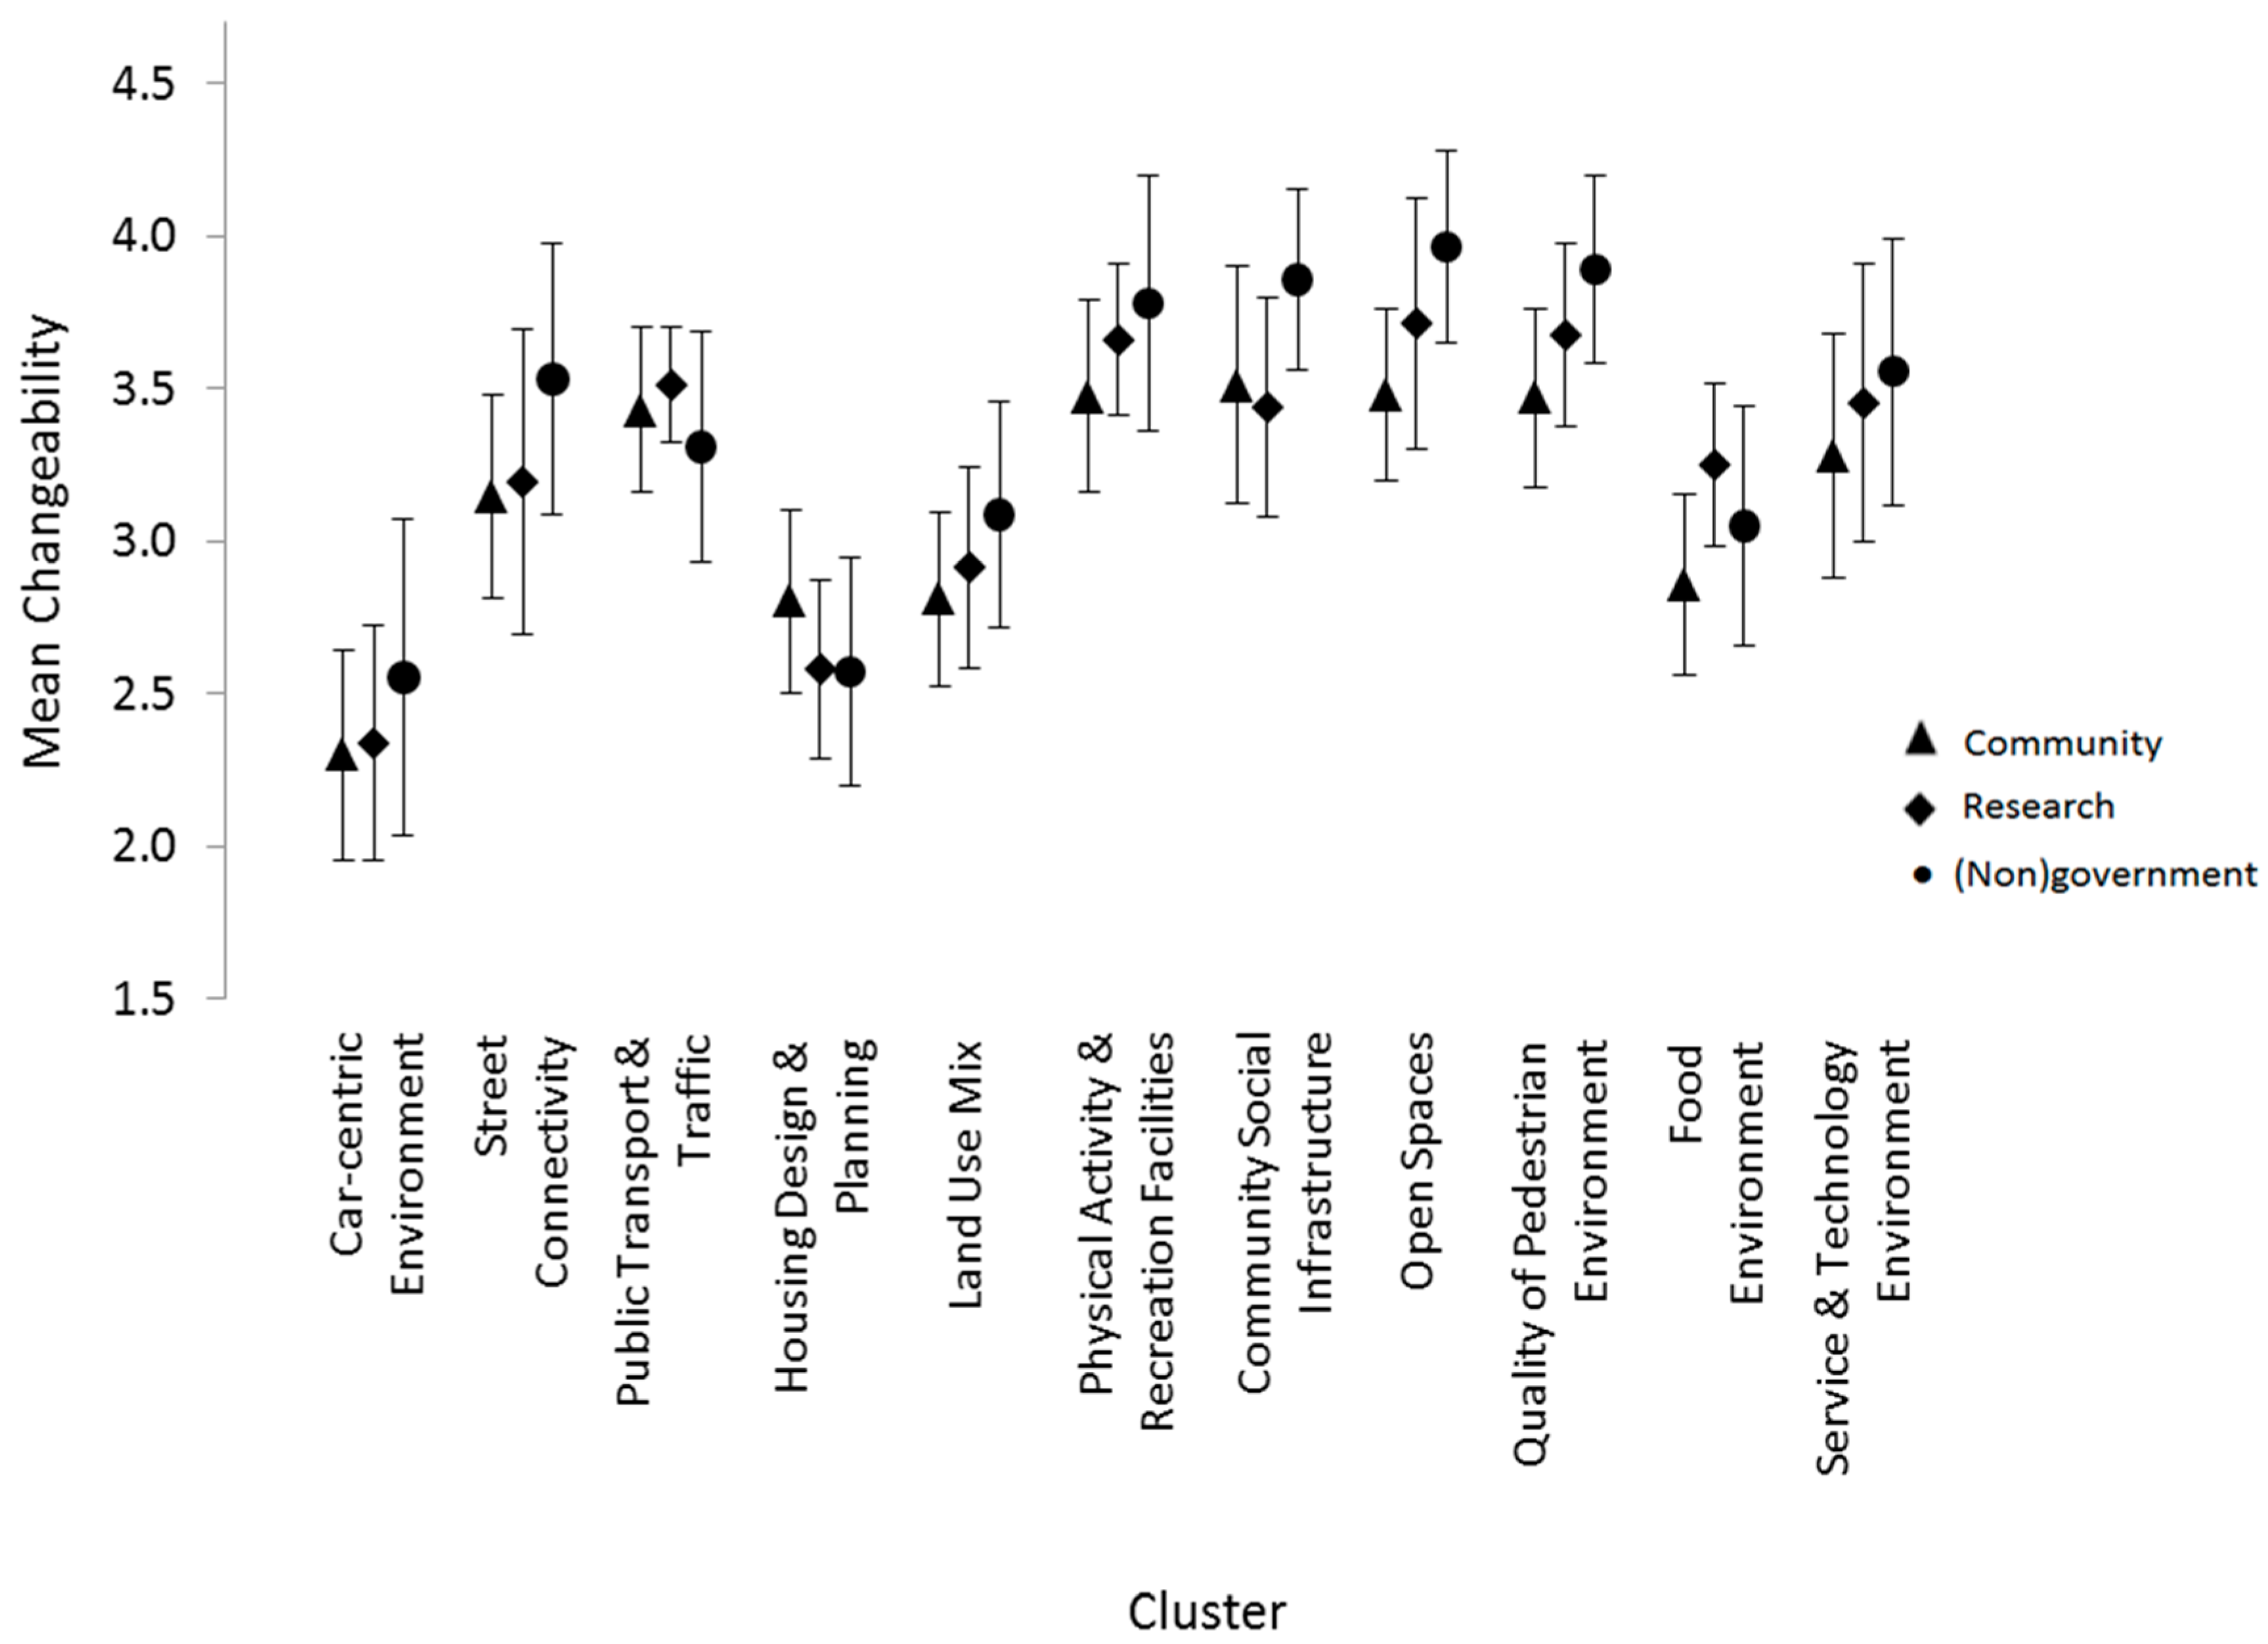
Differences by Participant Group
5. Discussion
6. Conclusions
Supplementary Materials
Acknowledgments
Author Contributions
Conflicts of Interest
References
- Australian Institute of Health and Welfare (AIHW). Diabetes Prevalence in Australia: Detailed Estimates for 2007–2008. Diabetes Series No. 17. Cat No. CVD 56; AIHW: Canberra, Australia, 2011.
- Australian Institute of Health and Welfare (AIHW). Cardiovascular Disease: Australian Facts 2011; AIHW: Canberra, Australia, 2011.
- Nichols, M.; Townsend, N.; Scarborough, P.; Rayner, M.; Leal, J.; Luengo-Fernandez, R.; Gray, A. European Cardiovascular Disease Statistics 2012; European Health Network: Brussels, Belgium, 2012. [Google Scholar]
- Miller, Y.D.; Dunstan, D.W. The effectiveness of physical activity interventions for the treatment of overweight and obesity and type 2 diabetes. JSMS 2004, 7, 52–59. [Google Scholar] [CrossRef]
- Nilsson, P.; Berglund, G. Prevention of cardiovascular disease and diabetes: lessons from the Malmö Preventive Project. J. Intern. Med. 2000, 248, 455–462. [Google Scholar] [CrossRef] [PubMed]
- Pickett, K.E.; Pearl, M. Multilevel analyses of neighbourhood socioeconomic context and health outcomes: A critical review. J. Epidemiol. Community Health 2001, 55, 111–122. [Google Scholar] [CrossRef] [PubMed]
- Sampson, R.J.; Morenoff, J.D.; Gannon-Rowley, T. Assessing “neighborhood effects”: Social processes and new directions in research. Annu. Rev. Sociol. 2002, 28, 443–478. [Google Scholar] [CrossRef]
- Diez-Roux, A.V. Multilevel analysis in public health research. Annu. Rev. Public Health 2000, 21, 171–192. [Google Scholar] [CrossRef] [PubMed]
- Kaplan, G.; Everson, S.A.; Lynch, J.W. The contribution of social and behavioral research to an understanding of the distribution of disease: A multilevel approach. In Promoting Health: Intervention Strategies from Social and Behavioral Research, 2nd ed.; Smedley, B.D., Syme, S.L., Eds.; National Academy Press: Washington, DC, USA, 2000; pp. 31–55. [Google Scholar]
- Chaix, B. Geographic life environments and coronary heart disease: A literature review, theoretical contributions, methodological updates, and a research agenda. Annu. Rev. Public Health 2009, 30, 81–105. [Google Scholar] [CrossRef] [PubMed]
- Heneghan, C. Considerable uncertainty remains in the evidence for primary prevention of cardiovascular disease. Cochrane Database Syst. Rev. 2011. [Google Scholar] [CrossRef]
- Northridge, M.E.; Sclar, E.D.; Biswas, P. Sorting out the connections between the built environment and health: A conceptual framework for navigating pathways and planning healthy cities. J. Urban Health 2003, 80, 556–568. [Google Scholar] [CrossRef] [PubMed]
- Leal, C.; Chaix, B. The influence of geographic life environments on cardiometabolic risk factors: A systematic review, a methodological assessment and a research agenda. Obes. Rev. 2011, 12, 217–230. [Google Scholar] [CrossRef] [PubMed]
- Sarkar, C.; Gallacher, J.; Webster, C. Built environment configuration and change in body mass index: The Caerphilly Prospective Study (CaPS). Health Place 2013, 19, 33–44. [Google Scholar] [CrossRef] [PubMed]
- Mair, C.A.; Cutchin, M.P.; Peek, M.K. Allostatic load in an environmental riskscape: The role of stressors and gender. Health Place 2011, 17, 978–987. [Google Scholar] [CrossRef] [PubMed]
- Leyden, K.M. Social capital and the built environment: The importance of walkable neighborhoods. AJPH 2003, 93, 1546–1551. [Google Scholar] [CrossRef]
- Darcy, M.; Gwyther, G. Recasting Research on “Neighbourhood effects”: A Collaborative, Participatory, Trans-National Approach. In Neighbourhood Effects Research: New Perspectives; van Ham, M., Manley, D., Bailey, N., Simpson, L., Maclennan, D., Eds.; Springer: Dordrecht, The Netherlands, 2012; pp. 249–266. [Google Scholar]
- Sterman, J.D. Learning from Evidence in a Complex World. AJPH 2006, 96, 505–514. [Google Scholar] [CrossRef] [PubMed]
- Murphy, K.; Fafard, P. Knowledge Translation and Social Epidemiology: Taking Power, Politics and Values Seriously. In Rethinking Social Epidemiology; O’Campo, P., Dunn, J.R., Eds.; Springer: Dordrecht, The Netherlands, 2012; pp. 267–283. [Google Scholar]
- World Health Organisation The Ottawa Charter for Health Promotion. Available online: http://www.who.int/healthpromotion/conferences/previous/ottawa/en/ (accessed on 4 March 2016).
- Minkler, M.; Wallerstein, N. Community-Based Participatory Research for Health: From Process to Outcomes; Wiley: New York, NY, USA, 2008; p. 544. [Google Scholar]
- Israel, B.A.; Schulz, A.J.; Parker, E.A.; Becker, A.B. Review of community-based research: Assessing partnership approaches to improve public health. Annu. Rev. Public Health 1998, 19, 173–202. [Google Scholar] [CrossRef] [PubMed]
- Corburn, J. Confronting the Challenges in Reconnecting Urban Planning and Public Health. AJPH 2004, 94, 541–546. [Google Scholar] [CrossRef]
- Sterman, J. Business Dynamics: Systems Thinking and Modeling for a Complex World; McGraw-Hill Education: New York, NY, USA, 2000. [Google Scholar]
- Tillotson, J.E. America’s obesity: Conflicting public policies, industrial economic development, and unintended human consequences. Annu. Rev. Nutr. 2004, 24, 617–643. [Google Scholar] [CrossRef] [PubMed]
- Dharmasena, S.; Capps, O. Intended and unintended consequences of a proposed national tax on sugar-sweetened beverages to combat the U.S. obesity problem. Health Econ. 2012, 21, 669–694. [Google Scholar] [PubMed]
- Wilson, B.M.; Stolarz-Fantino, S.; Fantino, E. Regulating the way to obesity: Unintended consequences of limiting sugary drink sizes. PLoS ONE 2013, 8, e61081. [Google Scholar] [CrossRef] [PubMed]
- Bridgewater, K.; Peterson, S.; McDevitt, J.; Hemenway, D.; Bass, J.; Bothwell, P.; Everdell, R. A community-based systems learning approach to understanding youth violence in boston. PCHP 2011, 5, 67–75. [Google Scholar] [CrossRef] [PubMed]
- O’Campo, P.; Salmon, C.; Burke, J. Neighbourhoods and mental well-being: What are the pathways? Health Place 2009, 15, 56–68. [Google Scholar] [CrossRef] [PubMed]
- Dawson, A.P.; Cargo, M.; Stewart, H.; Chong, A.; Daniel, M. Identifying multi-level culturally appropriate smoking cessation strategies for Aboriginal health staff: A concept mapping approach. Health Educ. Res. 2013, 28, 31–45. [Google Scholar] [CrossRef] [PubMed]
- Mehdipanah, R.; Malmusi, D.; Muntaner, C.; Borrell, C. An evaluation of an urban renewal program and its effects on neighborhood resident’s overall wellbeing using concept mapping. Health Place 2013, 23, 9–17. [Google Scholar] [CrossRef] [PubMed]
- Burke, J.G.; O’Campo, P.; Peak, G.L.; Gielen, A.C.; McDonnell, K.A.; Trochim, W.M.K. An introduction to concept mapping as a participatory public health research method. Qual. Health Res. 2005, 15, 1392–1410. [Google Scholar] [CrossRef] [PubMed]
- Daniel, M.; Hugo, G.; Paquet, C.; Taylor, A.W.; Adams, R.J. Testing the Behavioural and Psychosocial Mechanisms Underlying Spatial Variation in Metabolic Syndrome (#631917); University of South Australia; National Health and Medical Research Council of Australia—Project Grant: Adelaide, Australia, 2010. [Google Scholar]
- Daniel, M.; Hugo, G.; Paquet, C.; Taylor, A.W.; Cargo, M.; Adams, R.J. Linking Place to Metabolic Syndrome via Behavioural and Psychosocial Antecedents: Levers for Public Health Intervention (#570150); University of South Australia; National Health and Medical Research Council of Australia—Project Grant: Adelaide, Australia, 2010. [Google Scholar]
- Government of South Australia. The South Australian Approach to Health in All Policies: Background and Practical Guide; South Australian Department for Health and Ageing: Adelaide, Australia, 2011.
- Government of South Australia. South Australian Public Health Act; Attorney-General’s Department, Ed.; Government of South Australia: Adelaide, Australia, 2011; pp. 1–78.
- Australian Bureau of Statistics. South Australia (SSC), Usual Resident Profile: Table UO1 Usual Resident Characteristics; Australian Bureau of Statistics: Canberra, Australia, 2001.
- Hetzel, D.; Page, A.; Glover, J.; Tennant, S. Inequality in South Australia: Key Determinants of Wellbeing. Volume 1: The Evidence; The University of Adelaide: Adelaide, Australia, 2004. [Google Scholar]
- The University of Adelaide. North West Adelaide Health Study Risk Factors: High Blood Pressure. Stage 3 Epidemiological Series Report # 2011–2017; The University of Adelaide: Adelaide, Australia, 2011. [Google Scholar]
- The University of Adelaide. North West Adelaide Health Study Risk Factors: Obesity—Body Mass Index. Stage 3 Epidemiological Series Report # 2011–2018; The University of Adelaide: Adelaide, Australia, 2011. [Google Scholar]
- The University of Adelaide. North West Adelaide Health Study Risk Factors: High Cholesterol. Stage 3 Epidemiological Series Report # 2011–2019; The University of Adelaide: Adelaide, Australia, 2011. [Google Scholar]
- Government of South Australia. South Australia: A Better Place to Live. Promoting and Protecting Our Community’s Health and Wellbeing; SA Health: Adelaide, Australia, 2013; pp. 1–112.
- Trochim, W.M.K.; Kane, M. Concept mapping: An introduction to structured conceptualization in health care. Int. J. Qual. Health Care 2005, 17, 187–191. [Google Scholar] [CrossRef] [PubMed]
- Trochim, W.M.K.; Milstein, B.; Wood, B.J.; Jackson, S.; Pressler, V. Setting objectives for community and systems change: An application of concept mapping for planning a statewide health improvement initiative. Health Promot. Pract. 2004, 5, 8–19. [Google Scholar] [CrossRef] [PubMed]
- Trochim, W.M.K. An introduction to concept mapping for planning and evaluation. Eval. Program Plan. 1989, 12, 1–16. [Google Scholar] [CrossRef]
- Trochim, W.M.; Cabrera, D. The complexity of concept mapping for policy analysis. E:CO 2005, 7, 11–22. [Google Scholar]
- Rosas, S.R.; Kane, M. Quality and rigor of the concept mapping methodology: A pooled study analysis. Eval. Program Plan. 2012, 35, 236–245. [Google Scholar] [CrossRef] [PubMed]
- Kane, M.; Trochim, W.M.K. Concept Mapping for Planning and Evaluation; SAGE Publications: Thousand Oaks, CA, USA, 2007; Volume 50, p. 216. [Google Scholar]
- Concept Systems Incorporated. The Concept System® Global MAX Web-Based Platform, 4.0; Concept Systems Incorporated: Ithaca, NY, USA, 2016. [Google Scholar]
- Romney, A.K.; Weller, S.C. Systematic Data Collection; SAGE: Newbury Park, CA, USA, 1988; Volume 10, p. 96. [Google Scholar]
- Davison, M.L. Multidimensional Scaling; Wiley: New York, NY, USA, 1983; p. 242. [Google Scholar]
- Kruskal, J.B.; Wish, M. Multidimensional Scaling, 6th ed.; SAGE University Paper: Newbury Park, CA, USA, 1978. [Google Scholar]
- Anderberg, M.R. Cluster Analysis for Applications; Academic Press: New York, NY, USA, 1973; Volume 19, p. 359. [Google Scholar]
- Everitt, B.S.; Landau, S.; Leese, M. Cluster Analysis, 4th ed.; John Wiley & Sons: New York, NY, USA, 2009; p. 256. [Google Scholar]
- Hair, J.F.; Anderson, R.E.; Tatham, R.L.; Black, W. Multivariate Data Analysis, 5th ed.; Prentice Hall: New York, NY, USA, 1998; p. 730. [Google Scholar]
- Trochim, W.M.K. Pattern matching, validity, and conceptualization in program evaluation. Eval. Rev. 1985, 9, 575–604. [Google Scholar] [CrossRef]
- Auchincloss, A.H.; Diez Roux, A.V.; Mujahid, M.S.; Shen, M.; Bertoni, A.G.; Carnethon, M.R. Neighborhood resources for physical activity and healthy foods and incidence of type 2 diabetes mellitus: The Multi-Ethnic study of Atherosclerosis. Arch. Intern. Med. 2009, 169, 1698–1704. [Google Scholar] [CrossRef] [PubMed]
- Xu, H.; Short, S.E.; Liu, T. Dynamic relations between fast-food restaurant and body weight status: A longitudinal and multilevel analysis of Chinese adults. J. Epidemiol. Community Health 2013, 67, 271–279. [Google Scholar] [CrossRef] [PubMed]
- Sturm, R.; Datar, A. Body mass index in elementary school children, metropolitan area food prices and food outlet density. Public Health 2005, 119, 1059–1068. [Google Scholar] [CrossRef] [PubMed]
- Morland, K.; Diez Roux, A.V.; Wing, S. Supermarkets, Other Food Stores, and Obesity: The Atherosclerosis Risk in Communities Study. Am. J. Prev. Med. 2006, 30, 333–339. [Google Scholar] [CrossRef] [PubMed]
- Bell, J.F.; Wilson, J.S.; Liu, G.C. Neighborhood greenness and 2-year changes in body mass index of children and youth. Am. J. Prev. Med. 2008, 35, 547–553. [Google Scholar] [CrossRef] [PubMed]
- Paquet, C.; Coffee, N.T.; Haren, M.T.; Howard, N.J.; Adams, R.J.; Taylor, A.W.; Daniel, M. Food environment, walkability, and public open spaces are associated with incident development of cardio-metabolic risk factors in a biomedical cohort. Health Place 2014, 28, 173–176. [Google Scholar] [CrossRef] [PubMed]
- Muller-Riemenschneider, F.; Pereira, G.; Villanueva, K.; Christian, H.; Knuiman, M.; Giles-Corti, B.; Bull, F. Neighborhood walkability and cardiometabolic risk factors in Australian adults: An observational study. BMC Public Health 2013, 13, 755. [Google Scholar] [CrossRef] [PubMed]
- Coffee, N.T.; Howard, N.; Paquet, C.; Hugo, G.; Daniel, M. Is Walkability associated with a lower cardiometabolic risk? Health Place 2013, 21, 163–169. [Google Scholar] [CrossRef] [PubMed]
- McCormack, G.R.; Shiell, A. In search of causality: A systematic review of the relationship between the built environment and physical activity among adults. IJBNPA 2011, 8, 1479–5868. [Google Scholar] [CrossRef] [PubMed]
- Lee, R.E.; Mama, S.K.; Adamus-Leach, H.J. Neighborhood street scale elements, sedentary time and cardiometabolic risk factors in inactive ethnic minority women. PLoS ONE 2012, 7, e51081. [Google Scholar] [CrossRef] [PubMed]
- Duncan, D.T.; Castro, M.C.; Gortmaker, S.L.; Aldstadt, J.; Melly, S.J.; Bennett, G.G. Racial differences in the built environment—Body mass index relationship? A geospatial analysis of adolescents in urban neighborhoods. Int. J. Health Geogr. 2012, 11, 11. [Google Scholar] [PubMed]
- Government of South Australia. South Australian Health in All Policies Initiative: Case Study; Department of Planning and Local Government: Adelaide, Australia, 2013; pp. 1–14.
- Government of South Australia. The 30-Year Plan for Greater Adelaide; Department of Planning and Local Government: Adelaide, Australia, 2010.
- Government of South Australia. The Integrated Transport and Land Use Plan; Government of South Australia: Adelaide, Australia, 2015.
- Butland, B.; Jebb, S.; Kopelman, P.; McPherson, K.; Thomas, S.; Mardell, J.; Parry, V. Foresight. Tackling Obesities: Future Choices. Project Report; Government Office for Science: London, UK, 2007; pp. 1–162.
- Jayasinghe, S. Conceptualising population health: from mechanistic thinking to complexity science. Emerg. Themes Epidemiol. 2011, 8. [Google Scholar] [CrossRef] [PubMed]
- Lich, K.H.; Ginexi, E.M.; Osgood, N.D.; Mabry, P.L. A call to address complexity in prevention science research. Prev. Sci. 2013, 13, 279–289. [Google Scholar] [CrossRef] [PubMed]


| Categories | Brainstorming (n = 43) | Sorting (n = 32) | Rating (n = 34) | |||
|---|---|---|---|---|---|---|
| Stakeholder type | ||||||
| Researcher | 18 | (41.9%) | 12 | (37.5%) | 14 | (41.2%) |
| (Non)government stakeholder | 13 | (30.2%) | 8 | (25.0%) | 8 | (23.5%) |
| Community member | 12 | (27.9%) | 12 | (37.5%) | 12 | (35.3%) |
| Gender | ||||||
| Female | 23 | (53.5%) | 21 | (65.6%) | 23 | (67.7%) |
| Male | 12 | (27.9%) | 10 | (31.3%) | 10 | (29.4%) |
| No response | 8 | (18.6%) | 1 | (3.1%) | 1 | (2.9%) |
| Ancestry | ||||||
| United Kingdom | 12 | (27.9%) | 10 | (31.3%) | 10 | (29.4%) |
| Australian | 16 | (37.2%) | 13 | (40.6%) | 14 | (41.2%) |
| European | 2 | (4.7%) | 3 | (9.4%) | 3 | (8.8%) |
| Other | 5 | (11.6%) | 5 | (15.6%) | 6 | (17.7%) |
| No response | 8 | (18.6%) | 1 | (3.1%) | 1 | (2.9%) |
| Highest qualification attained | ||||||
| Postgraduate degree | 17 | (39.5%) | 16 | (50%) | 18 | (52.9%) |
| Bachelor degree | 11 | (25.6%) | 12 | (37.5%) | 12 | (35.3%) |
| Vocational education | 3 | (7.0%) | 2 | (6.3%) | 2 | (5.9%) |
| Year 12 or below | 2 | (4.7%) | 1 | (3.1%) | 1 | (2.9%) |
| Other | 2 | (4.7%) | 0 | 0 | ||
| No response | 8 | (18.6%) | 1 | (3.1%) | 1 | (2.9%) |
© 2017 by the authors. Licensee MDPI, Basel, Switzerland. This article is an open access article distributed under the terms and conditions of the Creative Commons Attribution (CC BY) license ( http://creativecommons.org/licenses/by/4.0/).
Share and Cite
Stankov, I.; Howard, N.J.; Daniel, M.; Cargo, M. Policy, Research and Residents’ Perspectives on Built Environments Implicated in Heart Disease: A Concept Mapping Approach. Int. J. Environ. Res. Public Health 2017, 14, 170. https://0-doi-org.brum.beds.ac.uk/10.3390/ijerph14020170
Stankov I, Howard NJ, Daniel M, Cargo M. Policy, Research and Residents’ Perspectives on Built Environments Implicated in Heart Disease: A Concept Mapping Approach. International Journal of Environmental Research and Public Health. 2017; 14(2):170. https://0-doi-org.brum.beds.ac.uk/10.3390/ijerph14020170
Chicago/Turabian StyleStankov, Ivana, Natasha J. Howard, Mark Daniel, and Margaret Cargo. 2017. "Policy, Research and Residents’ Perspectives on Built Environments Implicated in Heart Disease: A Concept Mapping Approach" International Journal of Environmental Research and Public Health 14, no. 2: 170. https://0-doi-org.brum.beds.ac.uk/10.3390/ijerph14020170