
Fine Particulate Matter Concentrations in Urban Chinese Cities, 2005–2016: A Systematic Review

Abstract
:1. Background
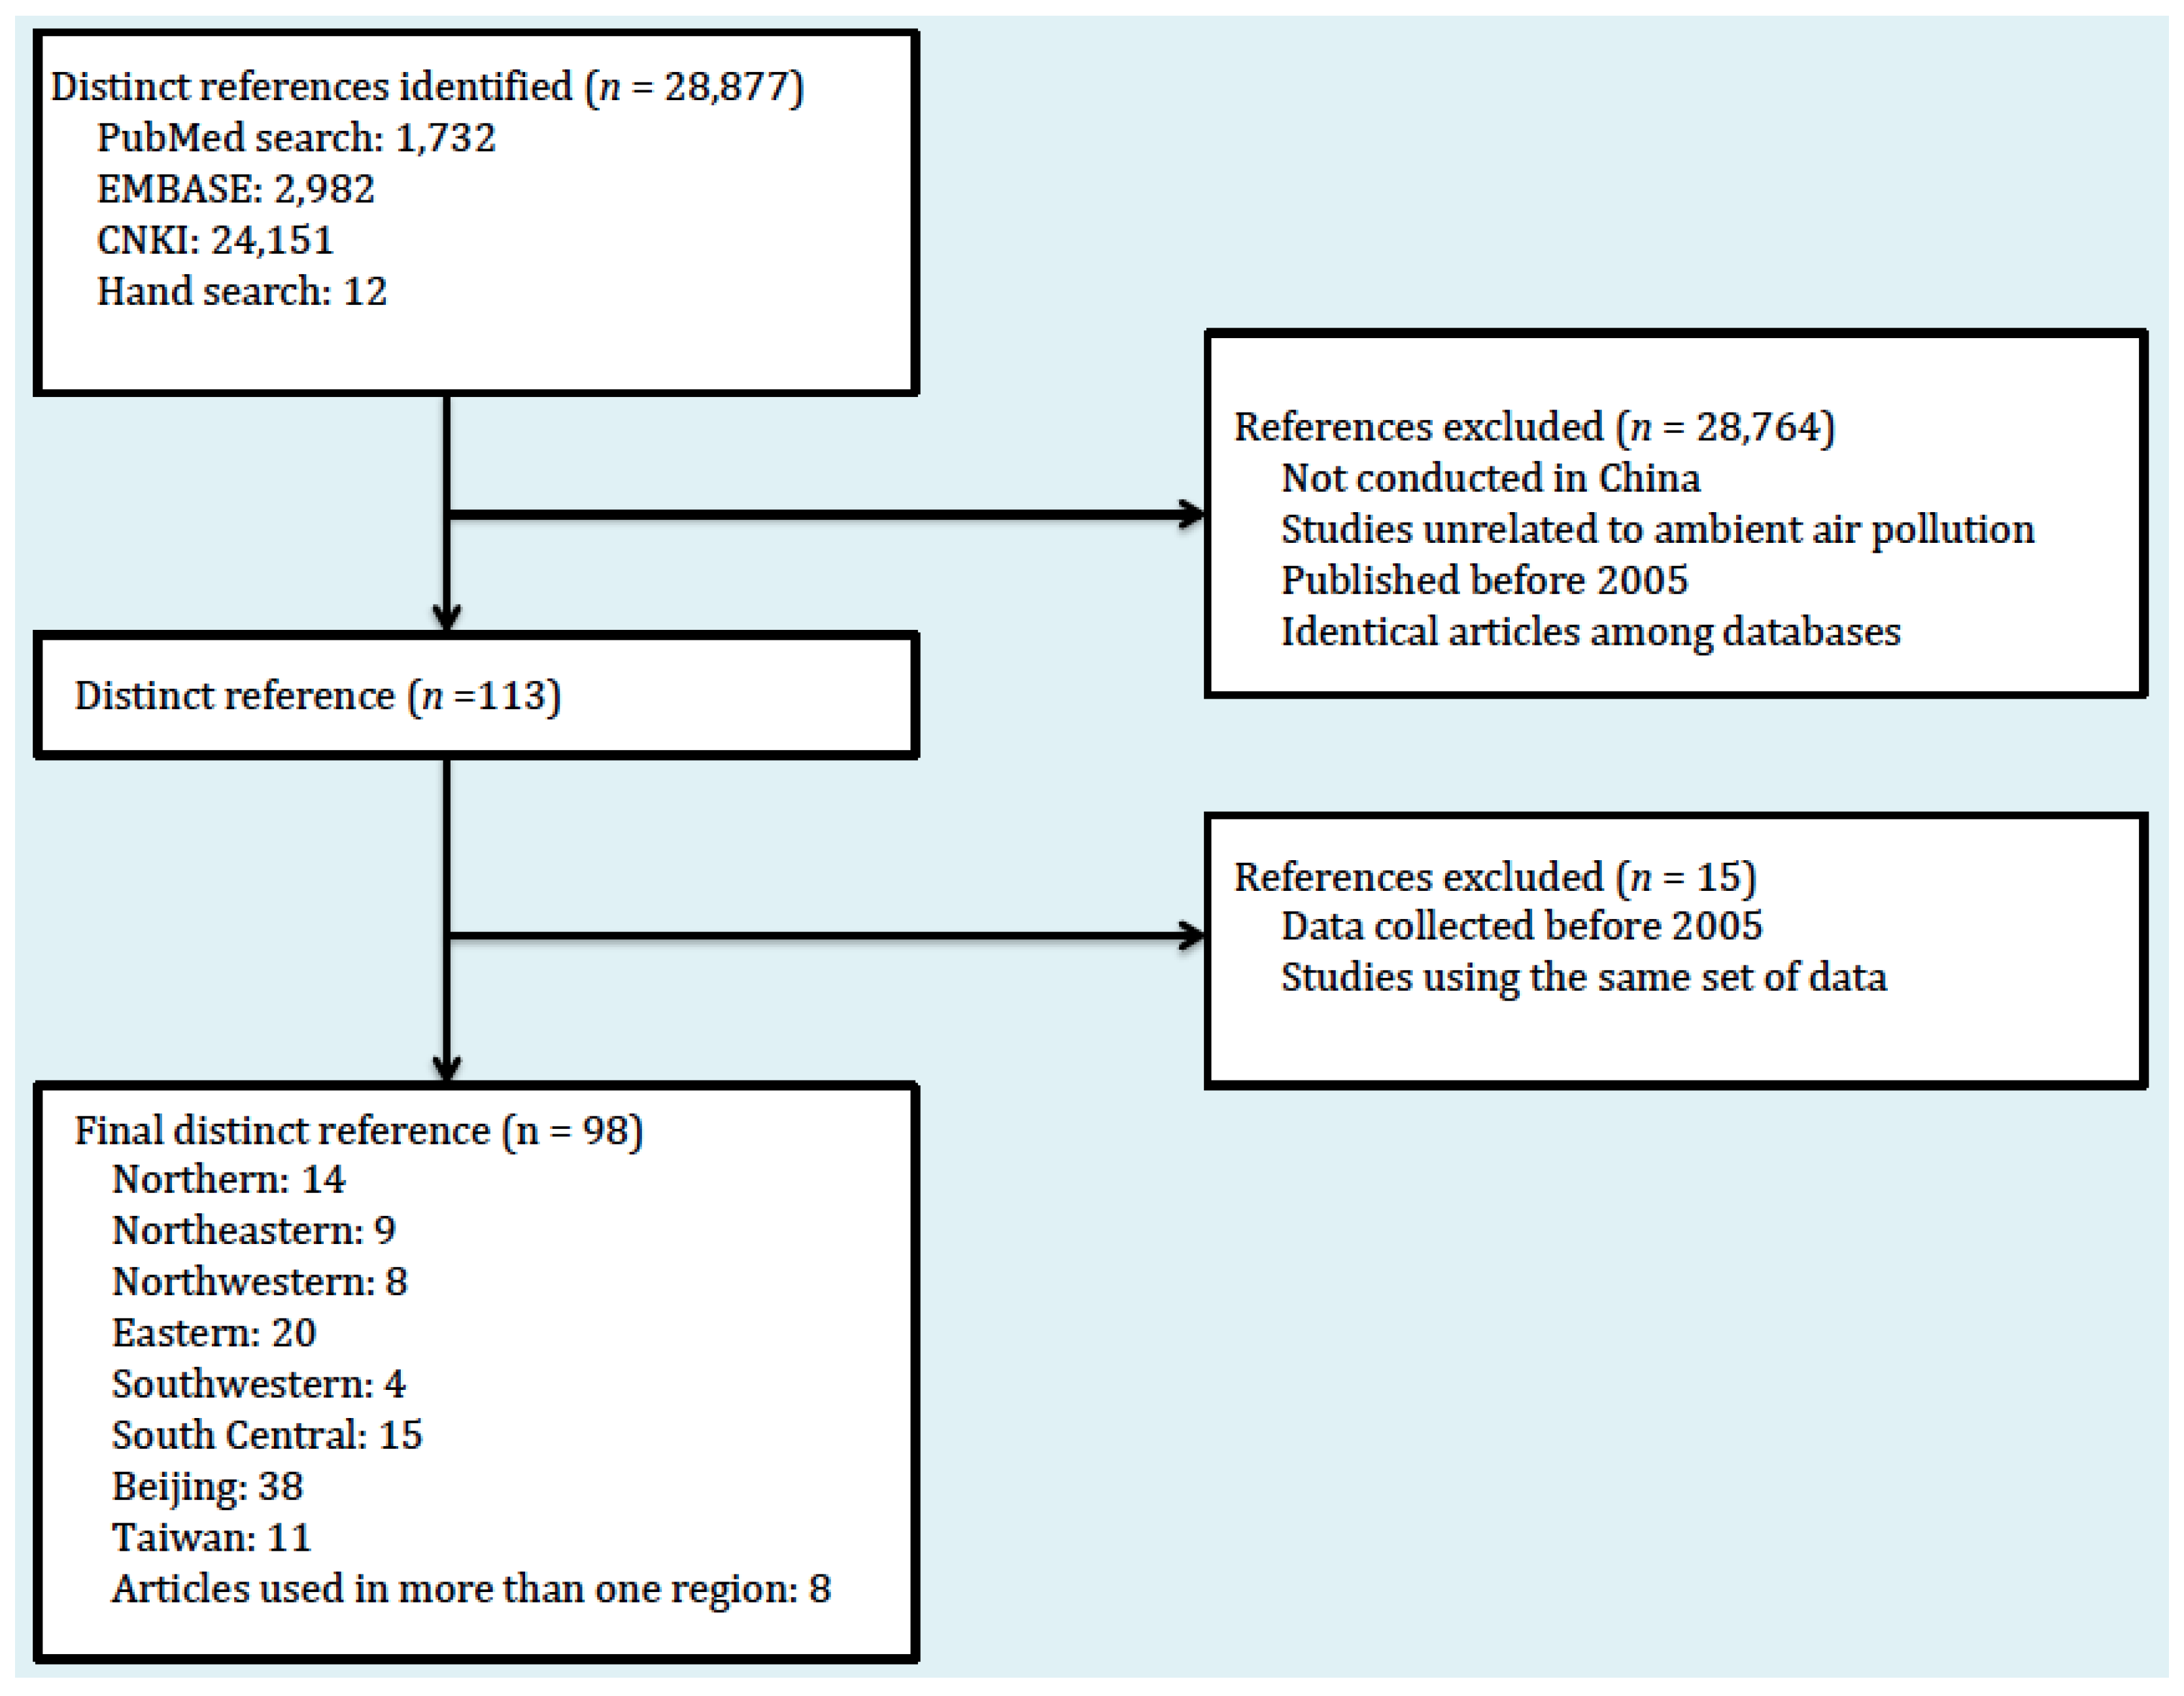
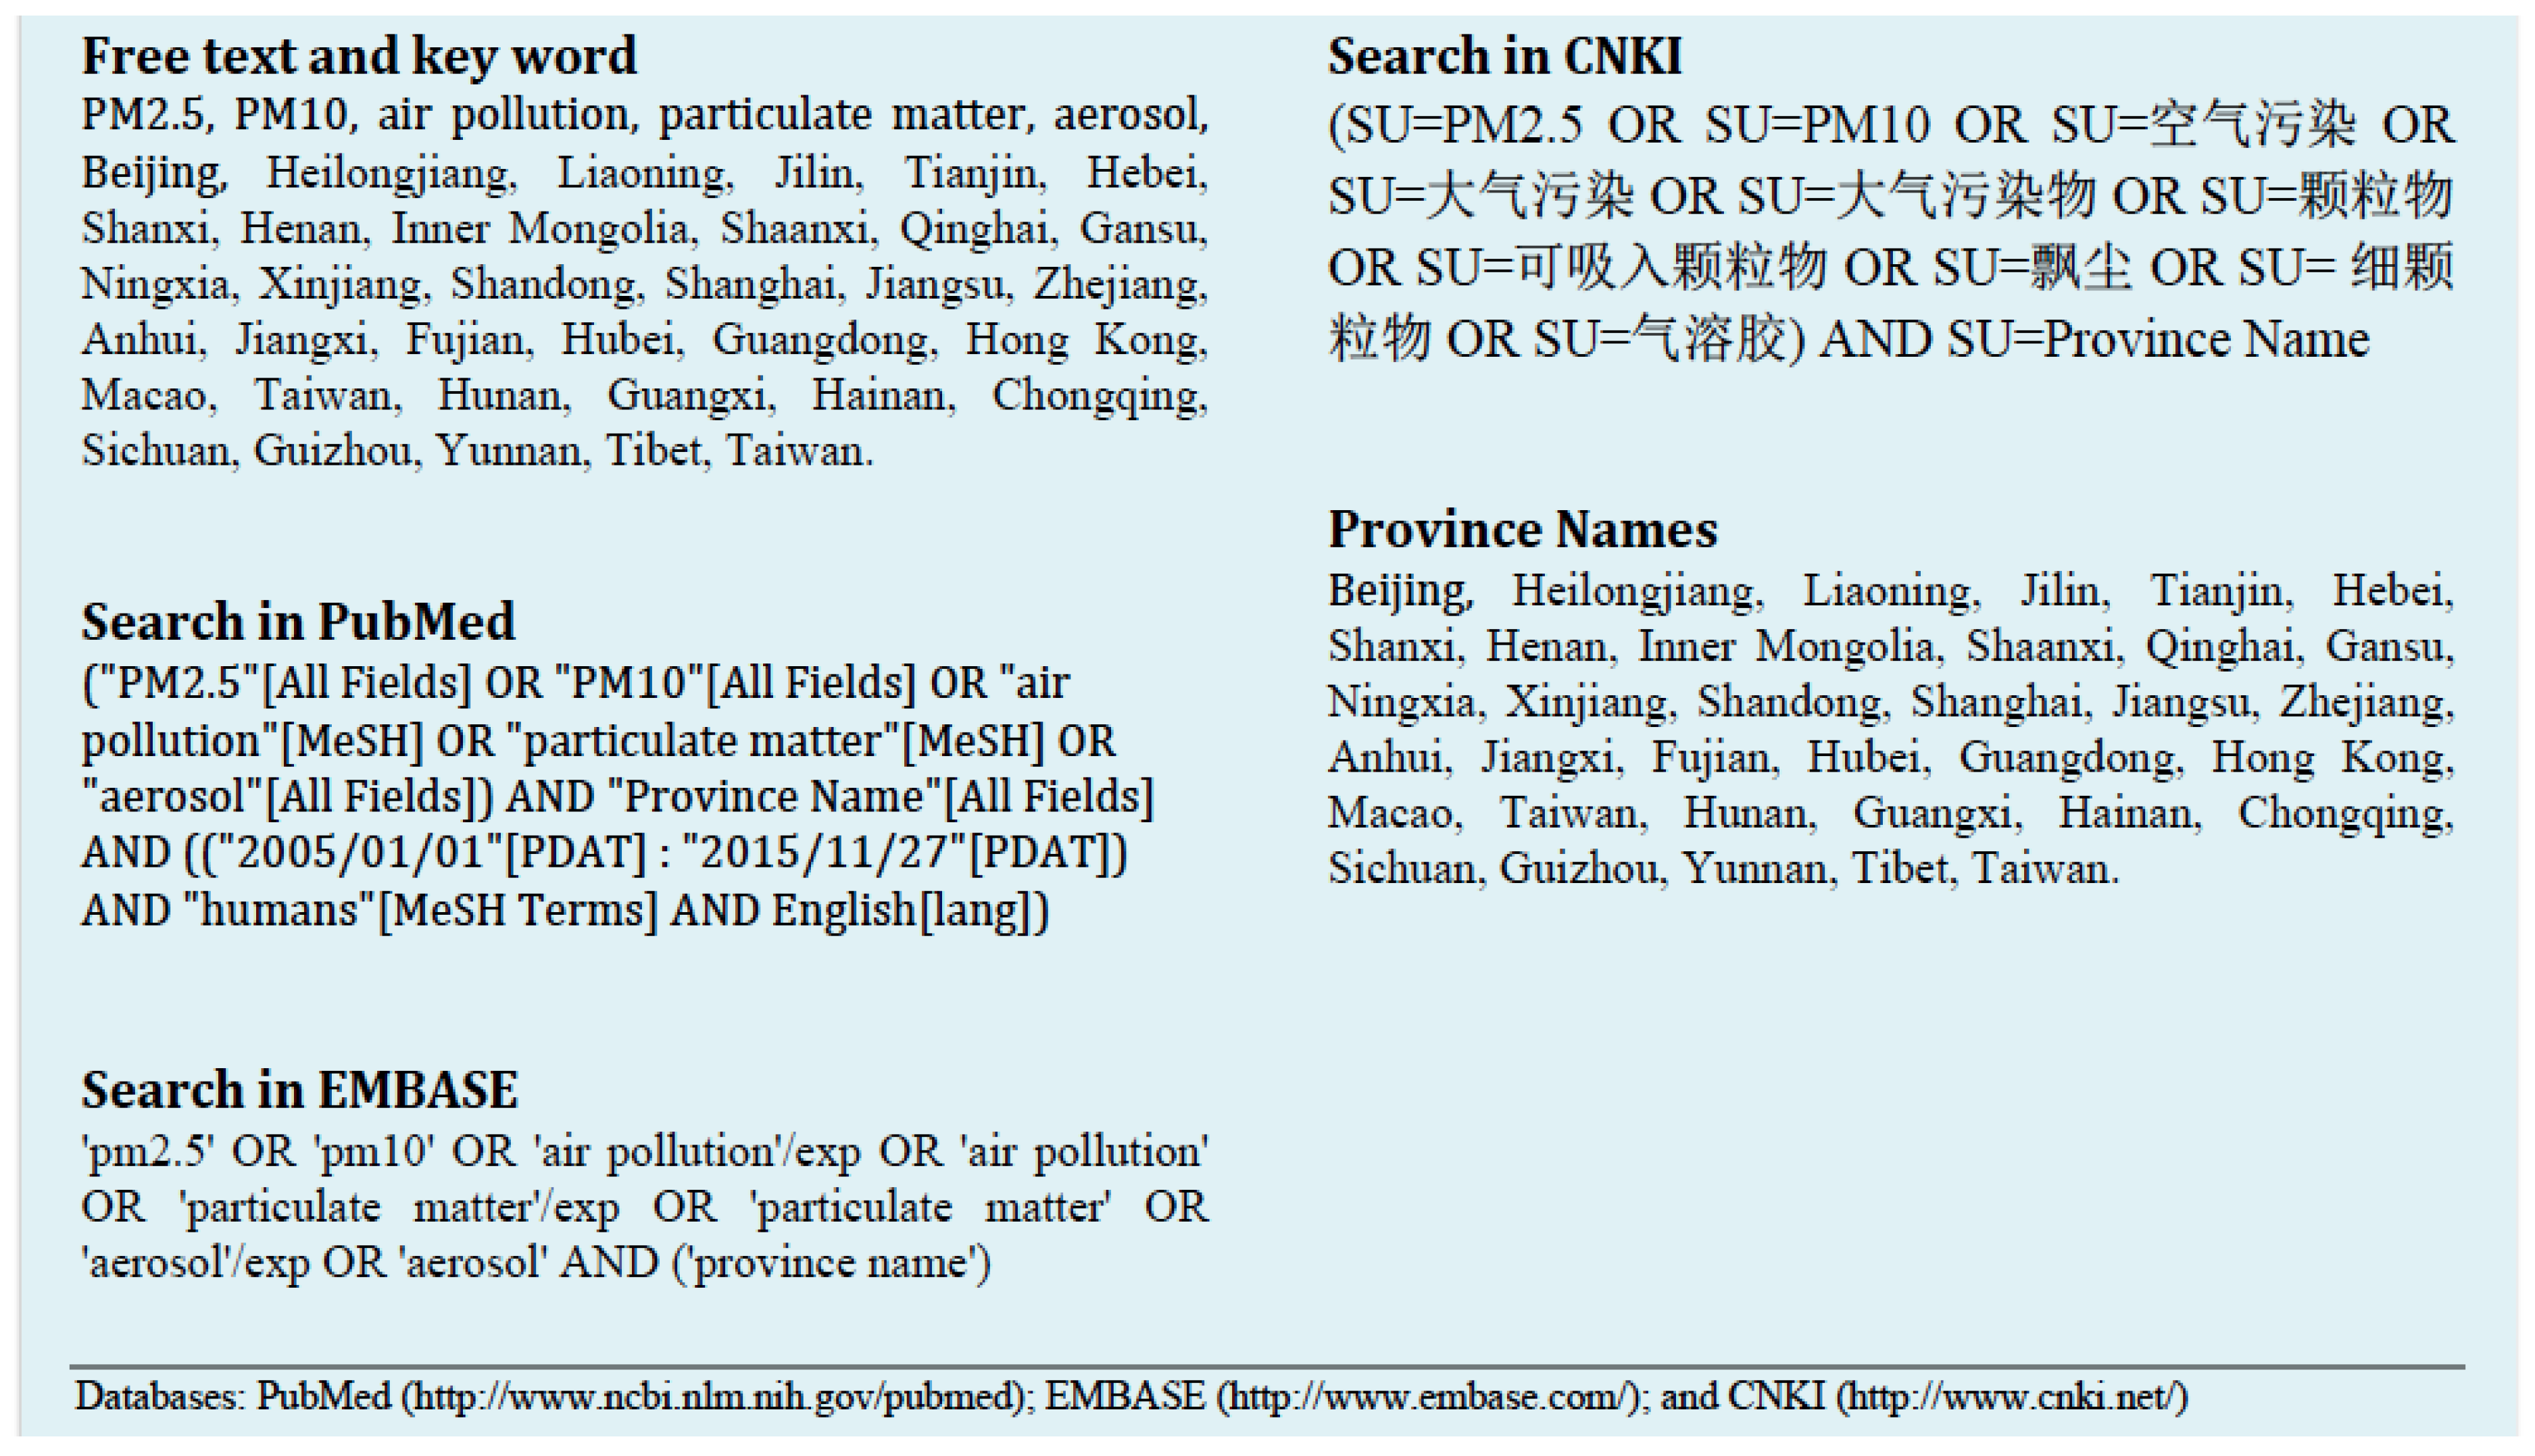
2. Methods
3. Results
4. Discussion
4.1. Comments on Findings
4.2. Applications to Current Literature
4.3. Limitations
5. Conclusions
Supplementary Materials
Acknowledgments
Author Contributions
Conflicts of Interest
References
- United States Environmental Protection Agency. Particulate Matter (PM) Pollution US EPA. Available online: https://www.epa.gov/pm-pollution (accessed on 5 February 2017).
- Friis, R.H. Essentials of Environmental Health, 2nd ed.; Jones & Bartlett Learning: Sudbury, MA, USA, 2012. [Google Scholar]
- Pope, C.A., III; Dockery, D.W. Health Effects of Fine Particulate Air Pollution: Lines that Connect. J. Air Waste Manag. Assoc. 2006, 56, 709–742. [Google Scholar] [CrossRef] [PubMed]
- You, M. Addition of PM2.5 into the National Ambient Air Quality Standards of China and the Contribution to Air Pollution Control: The Case Study of Wuhan, China. Sci. World J. 2014, 2014, 1–10. [Google Scholar]
- Yao, L.; Lu, N. Particulate matter pollution and population exposure assessment over mainland China in 2010 with remote sensing. Int. J. Environ. Res. Public Health 2014, 11, 5241–5250. [Google Scholar] [CrossRef] [PubMed]
- Ma, Z.; Hu, X.; Sayer, A.M.; Levy, R.; Zhang, Q.; Xue, Y.; Tong, S.; Bi, J.; Huang, L.; Liu, Y. Satellite-Based Spatiotemporal Trends in PM Concentrations: China, 2004–2013. Environ. Health Perspect. 2016, 124, 184–192. [Google Scholar] [PubMed]
- The Ministry of Environmental Protection of China. The State Council Issues Action Plan on Prevention and Control of Air Pollution Introducing Ten Measures to Improve Air Quality. Available online: http://english.mep.gov.cn/News_service/infocus/201309/t20130924_260707.htm (accessed on 13 January 2017).
- The Ministry of Environmental Protection of China. Ambient Air Quality Standards; The Ministry of Environmental Protection of China: Beijing, China, 2012.
- Han, B.; Kong, S.; Bai, Z.; Du, G.; Bi, T.; Li, X.; Shi, G.; Hu, Y. Characterization of Elemental Species in PM2.5 Samples Collected in Four Cities of Northeast China. Water Air Soil Pollut. 2009, 209, 15–28. [Google Scholar] [CrossRef]
- Chen, R.; Li, Y.; Ma, Y.; Pan, G.; Zeng, G.; Xu, X.; Chen, B.; Kan, H. Coarse particles and mortality in three Chinese cities: The China Air Pollution and Health Effects Study (CAPES). Sci. Total Environ. 2011, 409, 4934–4938. [Google Scholar] [CrossRef] [PubMed]
- Ma, Y.; Chen, R.; Pan, G.; Xu, X.; Song, W.; Chen, B.; Kan, H. Fine particulate air pollution and daily mortality in Shenyang, China. Sci. Total Environ. 2011, 409, 2473–2477. [Google Scholar] [CrossRef] [PubMed]
- Cui, G.; Kang, Z.; Lu, S.; Li, H.; Li, S.; Liu, X.; Zhu, L.; Yang, C.; Yuan, H. Concentration and effect of PM2.5 on respiratory diseases in residents of Harbin City. Chin. J. Public Health 2013, 29, 1046–1048. [Google Scholar]
- Li, S.; Lu, H.; Hu, G.; Qiu, H.; Wang, J.; Sha, J.; Liu, F.; Sun, G. Characteristics of polycyclic aromatic hydrocarbons in PM2.5 and health risk assessment in winter in suburb of Jiamusi, Heilongjiang. J. Environ. Health 2013, 30, 794–796. [Google Scholar]
- Wang, X.; Chen, J.; Sun, J.; Li, W.; Yang, L.; Wen, L.; Wang, W.; Wang, X.; Collett, J.L.; Shi, Y.; et al. Science of the Total Environment Severe haze episodes and seriously polluted fog water in Jinan, China. Sci. Total Environ. 2014, 493, 133–137. [Google Scholar] [CrossRef] [PubMed]
- Zhou, Q.; Pan, Y.; Wang, J.; Liu, Z.; Ji, D.; Chen, W.; Wang, Y. Pollution characteristics of PM2.5 and gaseous pollutants in winter and spring at agricultural region of Hailun city. China Environ. Sci. 2014, 34, 844–851. [Google Scholar]
- Ma, M.; Li, S.; Jin, H.; Zhang, Y.; Xu, J.; Chen, D.; Kuimin, C.; Yuan, Z.; Xiao, C. Characteristics and oxidative stress on rats and traffic policemen of ambient fine particulate matter from Shenyang. Sci. Total Environ. 2015, 526, 110–115. [Google Scholar] [CrossRef] [PubMed]
- Rohde, R.A.; Muller, R.A. Air Pollution in China: Mapping of Concentrations and Sources. PLoS ONE 2015, 10, e0135749. [Google Scholar] [CrossRef] [PubMed]
- Shen, Z.; Cao, J.; Li, X.; Wang, Y.; Jie, D.; Zhang, X. Chemical characteristics of aerosol particles (PM2.5) at a site of Horqin Sand-land in northeast China. J. Environ. Sci. 2006, 18, 701–707. [Google Scholar]
- Bae, S.; Pan, X.-C.; Kim, S.-Y.; Park, K.; Kim, Y.-H.; Kim, H.; Hong, Y.-C. Exposures to Particulate Matter and Polycyclic Aromatic Hydrocarbons and Oxidative Stress in Schoolchildren. Environ. Health Perspect. 2009, 118, 579–583. [Google Scholar] [CrossRef] [PubMed]
- Li, W.; Bai, Z.; Liu, A.; Chen, J.; Chen, L. Characteristics of Major PM2.5 Components during Winter in Tianjin, China. Aerosol Air Qual. Res. 2009, 9, 105–119. [Google Scholar] [CrossRef]
- Gu, J.; Bai, Z.; Li, W.; Wu, L.; Liu, A.; Dong, H.; Xie, Y. Chemical composition of PM2.5 during winter in Tianjin, China. Particuology 2011, 9, 215–221. [Google Scholar] [CrossRef]
- Sun, Y.; Pan, Y.; Li, X.; Zhu, R.; Wang, Y. Chemical composition and mass closure of particulate matter in Beijing, Tianjin and Hebei megacities, Northern China. Environ. Sci. 2011, 32, 2732–2740. [Google Scholar]
- Qiu, Y.; Zhang, Z.; Xu, J.; Liu, J.; Zhao, Y. Air pollution of PM2.5 at traffic crossroad before and in heating period in Taiyuan city. Chin. J. Public Health 2012, 28, 1289–1291. [Google Scholar]
- Wang, Z.; Wu, T.; Shi, G.; Fu, X.; Tian, Y.; Feng, Y.; Wu, X.; Wu, G.; Bai, Z.; Zhang, W. Potential Source Analysis for PM10 and PM2.5 in Autumn in a Northern City in China. Aerosol Air Qual. Res. 2012, 12, 39–48. [Google Scholar] [CrossRef]
- Dong, H.; Bian, W.; Chen, K. Study of chemical composition and pollution level of fine aerosol in Tianjin City. J. Anhui Agric. 2013, 41, 2193–2196. [Google Scholar] [CrossRef]
- Cao, L.; Geng, H.; Yao, C.; Zhao, L.; Duan, P.; Xuan, Y.; Li, H. Investigation of chemical compositions of atmospheric fine particles during a wintertime haze episode in Taiyuan city. China Environ. Sci. 2014, 34, 837–843. [Google Scholar]
- Chen, G.; Zhang, W.; Hou, L.; Yang, H.; Yan, B.; Tong, L.; Sun, Y. Pollution characteristics and influence factors of PM2.5 in summer in Jixian County of Tianjin. J. Tianjin Univ. 2015, 48, 95–102. [Google Scholar]
- Wu, L.; Kong, D.; Sun, K.; Liu, X.; Xian, S.; Zeng, D.; Mo, X.; Ou, M.; Deng, Q. Characteristics of water-soluble inorganic ions of PM2.5 in summer at Xianghe. China Environ. Sci. 2015, 35, 2925–2933. [Google Scholar]
- Zhou, M.; He, G.; Fan, M.; Wang, Z.; Liu, Y.; Ma, J.; Ma, Z.; Liu, J.; Liu, Y.; Wang, L.; et al. Smog episodes, fine particulate pollution and mortality in China. Environ. Res. 2015, 136, 396–404. [Google Scholar] [CrossRef] [PubMed]
- Pathak, R.K.; Wang, T.; Ho, K.F.; Lee, S.C. Characteristics of summertime PM2.5 organic and elemental carbon in four major Chinese cities: Implications of high acidity for water-soluble organic carbon (WSOC). Atmos. Environ. 2011, 45, 318–325. [Google Scholar] [CrossRef]
- Huang, W.; Cao, J.; Tao, Y.; Dai, L.; Lu, S.-E.; Hou, B.; Wang, Z.; Zhu, T. Seasonal variation of chemical species associated with short-term mortality effects of PM(2.5) in Xi’an, a Central City in China. Am. J. Epidemiol. 2012, 175, 556–566. [Google Scholar] [CrossRef] [PubMed]
- Niu, J.; Liberda, E.N.; Qu, S.; Guo, X.; Li, X.; Zhang, J.; Meng, J.; Yan, B.; Li, N.; Zhong, M.; et al. The role of metal components in the cardiovascular effects of PM2.5. PLoS ONE 2013, 8, e83782. [Google Scholar] [CrossRef] [PubMed]
- Leung, P.Y.; Wan, H.T.; Billah, M.B.; Cao, J.J.; Ho, K.F.; Wong, C.K.C. Chemical and biological characterization of air particulate matter 2.5, collected from five cities in China. Environ. Pollut. 2014, 194, 188–195. [Google Scholar] [CrossRef] [PubMed]
- Zhang, L.; Wu, J.; Bao, Y.; Xu, R.; Xu, K. The analysis of pollution level of particles PM10 and PM2.5 in Wuhan and Xi’an. Environ. Eng. 2014, 73–76. [Google Scholar]
- Akefu, R.; Talifu, D.; Zhang, Y.; Wang, X.; Mailidezhati, M. Meteorological Variations of PM2.5/PM2.5–10 Concentrations and Particle-associated Polycyclic Aromatic Hydrocarbons in the Atmospheric Environment of South Urumqi. Environ. Sci. Technol. 2015, 38, 235–240. [Google Scholar] [CrossRef]
- Wang, Y.; Zhuang, G.; Zhang, X.; Huang, K.; Xu, C.; Tang, A.; Chen, J.; An, Z. The ion chemistry, seasonal cycle, and sources of PM2.5 and TSP aerosol in Shanghai. Atmos. Environ. 2006, 40, 2935–2952. [Google Scholar] [CrossRef]
- Yang, X.; Shi, J.; Shen, X. Analysis on the situation of air pollution of PM10 and PM2.5 in Baoshan district, Shanghai. Shanghai J. Prev. Med. 2009, 21, 262–263. [Google Scholar]
- Wang, Y.; Dong, Y.; Feng, J.; Guan, J.; Zhao, W.; Li, H. Characteristics and Influencing Factors of Carbonaceous Aerosols in PM2.5 in Shanghai, China. Environ. Sci. 2010, 31, 1755–1761. [Google Scholar] [CrossRef]
- Yang, W.; Yin, Y.; Wei, Y.; Chen, K. Characteristics and sources of metal elements in PM2.5 during hazy days in Nanjing. China Environ. Sci. 2010, 30, 12–17. [Google Scholar]
- Yan, X. Characters of Submicron Particles PM2.5 in Baoshan District Shanghai. Guangzhou Chem. Eng. 2011, 39, 130–132. [Google Scholar]
- Xu, L.; Chen, X.; Chen, J.; Zhang, F.; He, C.; Zhao, J.; Yin, L. Seasonal variations and chemical compositions of PM2.5 aerosol in the urban area of Fuzhou, China. Atmos. Res. 2012, 104–105, 264–272. [Google Scholar] [CrossRef]
- Chen, R.; Wang, X.; Meng, X.; Hua, J.; Zhou, Z.; Chen, B.; Kan, H. Communicating air pollution-related health risks to the public: An application of the Air Quality Health Index in Shanghai, China. Environ. Int. 2013, 51, 168–173. [Google Scholar] [CrossRef] [PubMed]
- Fu, W.; Zheng, Y.; Dong, J. Diurnal Change of Air Particulate Concentration in 3 Types of Land in Winter Campus. J. Chin. Urban For. 2013, 11, 15–18. [Google Scholar]
- Hua, J.; Yin, Y.; Peng, L.; Du, L.; Geng, F.; Zhu, L. Acute effects of black carbon and PM2.5 on children asthma admissions: A time-series study in a Chinese city. Sci. Total Environ. 2014, 481, 433–438. [Google Scholar] [CrossRef] [PubMed]
- Qiao, L.; Cai, J.; Wang, H.; Wang, W.; Zhou, M.; Lou, S.; Chen, R.; Dai, H.; Chen, C.; Kan, H. PM2.5 constituents and hospital emergency-room visits in Shanghai, China. Environ. Sci. Technol. 2014, 48, 10406–10414. [Google Scholar] [CrossRef] [PubMed]
- Yang, L.; Gao, X.; Wang, X.; Nie, W.; Wang, J.; Gao, R.; Xu, P.; Shou, Y.; Zhang, Q.; Wang, W. Impacts of firecracker burning on aerosol chemical characteristics and human health risk levels during the Chinese New Year Celebration in Jinan, China. Sci. Total Environ. 2014, 476–477, 57–64. [Google Scholar] [CrossRef] [PubMed]
- Hu, M.; Zhang, Y.; Zhao, Q. Characteristics and sources of inorganic elements in PM2.5 during wintertime in Shanghai. Acta Sci. Circumst. 2015, 35, 1993–1999. [Google Scholar] [CrossRef]
- Li, H.; Wang, J.; Wang, Q.; Qian, X.; Qian, Y.; Yang, M.; Li, F.; Lu, H.; Wang, C. Chemical fractionation of arsenic and heavy metals in fine particle matter and its implications for risk assessment: A case study in Nanjing, China. Atmos. Environ. 2015, 103, 339–346. [Google Scholar] [CrossRef]
- Liu, G.; Li, J.; Wu, D.; Xu, H. Chemical composition and source apportionment of the ambient PM2.5 in Hangzhou, China. Particuology 2015, 18, 135–143. [Google Scholar] [CrossRef]
- Xu, M.; Zhang, Y.; Gao, X.; Cheng, W.; Zhou, X.; Zhang, L.; Ye, Y.; Yang, L. Distribution Characteristics of Polycyclic Aromatic Hydrocarbons in Fine Particulate Matters in Proximity of a Large Chemical Industrial Park in Shanghai. J. Environ. Occup. Med. 2015, 32, 749–752. [Google Scholar]
- Zou, Y.; Jin, C.; Shu, J.; Xu, S.; Lai, Y.; Sun, X. Characterization of Water-soluble Ions in PM2.5 and PM1.0 of Shanghai during Spring. Res. Explor. Lab. 2015, 34, 44–47. [Google Scholar]
- Tao, J.; Zhang, R.; Dong, L.; Zhang, T.; Zhu, L.; Han, J.; Xu, Z. Characterization of Water-soluble Inorganic Ions in PM2.5 and PM1.0 in Summer in Guangzhou. Environ. Sci. 2010, 31, 1417–1424. [Google Scholar]
- Xie, P.; Liu, X.; Liu, Z.; Li, T.; Zhong, L.; Xiang, Y. Human Health Impact of Exposure to Airborne Particulate Matter in Pearl River Delta, China. Water Air Soil Pollut. 2010, 215, 349–363. [Google Scholar] [CrossRef]
- Yang, C.; Peng, X.; Huang, W.; Chen, R.; Xu, Z.; Chen, B.; Kan, H. A time-stratified case-crossover study of fine particulate matter air pollution and mortality in Guangzhou, China. Int. Arch. Occup. Environ. Health 2011, 85, 579–585. [Google Scholar] [CrossRef] [PubMed]
- Ma, L.; Yin, F.; Song, Y.; He, M.; Shima, M.; Tamura, K. Indoor and Outdoor Pollutant Characteristics of Particulate matter and OC, EC in Autumn and Winter in Wuhan. Urban Environ. Urban Ecol. 2011, 24, 25–32. [Google Scholar]
- Dai, W.; Gao, J.Q.; Cao, G.; Ouyang, F. Characterization of atmospheric PM2.5 in the suburb of Shenzhen. Environ. Sci. 2012, 33, 1952–1957. [Google Scholar]
- Wang, J.; Lai, S.; Ke, Z.; Zhang, Y.; Yin, S.; Zheng, J. Exposure assessment, chemical characterization and source identification of PM2.5 for school children and industrial downwind residents in Guangzhou, China. Environ. Geochem. Health 2013, 36, 385–397. [Google Scholar] [CrossRef] [PubMed]
- Qiu, H.; Tian, L.W.; Pun, V.C.; Ho, K.F.; Wong, T.W.; Yu, I.T.S. Coarse particulate matter associated with increased risk of emergency hospital admissions for pneumonia in Hong Kong. Thorax 2014, 69, 1027–1033. [Google Scholar] [CrossRef] [PubMed]
- Wang, J.; Geng, N.B.; Xu, Y.F.; Zhang, W.D.; Tang, X.Y.; Zhang, R.Q. PAHs in PM2.5 in Zhengzhou: concentration, carcinogenic risk analysis, and source apportionment. Environ. Monit. Assess. 2014, 186, 7461–7473. [Google Scholar] [CrossRef] [PubMed]
- Zhu, Y.; Fu, P.; Long, J.; Xu, X.; Wang, J.; Ge, F. Pollution characteristics and meteorological factors of PM10 and PM2.5 in Changsha city. Nat. Sci. J. Xiangtan Univ. 2014, 36, 96–100. [Google Scholar] [CrossRef]
- Sun, J.L.; Jing, X.; Chang, W.J.; Chen, Z.X.; Zeng, H. Cumulative health risk assessment of halogenated and parent polycyclic aromatic hydrocarbons associated with particulate matters in urban air. Ecotoxicol. Environ. Saf. 2015, 113, 31–37. [Google Scholar] [CrossRef] [PubMed]
- Tam, W.W.S.; Wong, T.W.; Wong, A.H. Association between air pollution and daily mortality and hospital admission due to Ischaemic heart diseases in Hong Kong. Atmos. Environ. 2015, 120, 360–368. [Google Scholar] [CrossRef]
- Gao, X.; Yu, Q.; Gu, Q.; Chen, Y.; Ding, K.; Zhu, J.; Chen, L. Indoor air pollution from solid biomass fuels combustion in rural agricultural area of Tibet, China. Indoor Air 2009, 19, 198–205. [Google Scholar] [CrossRef] [PubMed]
- Li, S.; Deng, B.; Shao, J.; Xu, H.; Li, L. Study on characteristics of urban and rural PM2.5 concentrations alternation and main influencing factors using GIS in Guiyang. Ecol. Environ. Sci. 2014, 23, 1298–1304. [Google Scholar]
- Zhu, X.; Ma, F.; Luan, H.; Wu, D.; Wang, T. Evaluation and Comparison of Measurement Methods for Personal Exposure to Fine Particles in Beijing, China. Bull. Environ. Contam. Toxicol. 2009, 84, 29–33. [Google Scholar] [CrossRef] [PubMed]
- Du, X.; Kong, Q.; Ge, W.; Zhang, S.; Fu, L. Characterization of personal exposure concentration of fine particles for adults and children exposed to high ambient concentrations in Beijing, China. J. Environ. Sci. 2010, 22, 1757–1764. [Google Scholar] [CrossRef]
- Guo, Y.; Tong, S.; Zhang, Y.; Barnett, A.G.; Jia, Y.; Pan, X. The relationship between particulate air pollution and emergency hospital visits for hypertension in Beijing, China. Sci. Total Environ. 2010, 408, 4446–4450. [Google Scholar] [CrossRef] [PubMed] [Green Version]
- Zhang, X.; Zhao, X.; Pu, W.; Xu, J. Comparison of Elemental Characteristics of Suspended Particles PM2.5 in Urban and Rural Area of Beijing. China Powder Sci. Technol. 2010, 16, 28–34. [Google Scholar] [CrossRef]
- Lin, W.; Huang, W.; Zhu, T.; Hu, M.; Brunekreef, B.; Zhang, Y.; Liu, X.; Cheng, H.; Gehring, U.; Li, C.; et al. Acute respiratory inflammation in children and black carbon in ambient air before and during the 2008 Beijing Olympics. Environ. Health Perspect. 2011, 119, 1507–1512. [Google Scholar] [CrossRef] [PubMed]
- Liu, H.; He, K.; Ma, Y.; Zhao, Q.; Duan, F.; Liang, L. Variations of PM2.5 and its water soluble ions in urban and suburban Beijing before during and after 2008 Olympiad. Acta Sci. Circumst. 2011, 31, 177–185. [Google Scholar]
- Huang, W.; Zhu, T.; Pan, X.; Hu, M.; Lu, S.-E.; Lin, Y.; Wang, T.; Zhang, Y.; Tang, X. Air pollution and autonomic and vascular dysfunction in patients with cardiovascular disease: Interactions of systemic inflammation, overweight, and gender. Am. J. Epidemiol. 2012, 176, 117–126. [Google Scholar] [CrossRef] [PubMed]
- Chen, R.; Zhao, Z.; Kan, H. Heavy smog and hospital visits in Beijing, China. Am. J. Respir Crit. Care Med. 2013, 188, 1170–1171. [Google Scholar] [CrossRef] [PubMed]
- Guo, Y.; Li, S.; Tian, Z.; Pan, X.; Zhang, J.; Williams, G. The burden of air pollution on years of life lost in Beijing, China, 2004–2008: Retrospective regression analysis of daily deaths. BMJ 2013, 347, f7139. [Google Scholar] [CrossRef] [PubMed]
- Shang, Y.; Zhu, T.; Lenz, A.-G.; Frankenberger, B.; Tian, F.; Chen, C.; Stoeger, T. Reduced in vitro toxicity of fine particulate matter collected during the 2008 Summer Olympic Games in Beijing: The roles of chemical and biological components. Toxicol. In Vitro 2013, 27, 2084–2093. [Google Scholar] [CrossRef] [PubMed]
- Shi, Y.; Zhang, J.; Luo, H.; Lin, L.; Li, M.; Li, Q.; Zhang, F.; Zhuo, L.; Zhang, Y.; Zhang, J. Analysis of characteristics of atmosphere particulate matter pollution in Beijing during the fall and winter of 2012 to 2013. Ecol. Environ. Sci. 2013, 22, 1571–1577. [Google Scholar]
- Wu, S.; Deng, F.; Liu, Y.; Shima, M.; Niu, J.; Huang, Q.; Guo, X. Temperature, traffic-related air pollution, and heart rate variability in a panel of healthy adults. Environ. Res. 2013, 120, 82–89. [Google Scholar] [CrossRef] [PubMed]
- Xu, M.M.; Jia, Y.P.; Li, G.X.; Liu, L.Q.; Mo, Y.Z.; Jin, X.B.; Pan, X.C. Relationship between ambient fine particles and ventricular repolarization changes and heart rate variability of elderly people with heart disease in Beijing, China. Biomed. Environ. Sci. 2013, 26, 629–637. [Google Scholar] [PubMed]
- Zhang, R.; Jing, J.; Tao, J.; Hsu, S.-C.; Wang, G.; Cao, J.; Lee, C.S.L.; Zhu, L.; Chen, Z.; Zhao, Y.; et al. Chemical characterization and source apportionment of PM2.5 in Beijing: Seasonal perspective. Atmos. Chem. Phys. 2013, 13, 7053–7074. [Google Scholar] [CrossRef]
- Liang, Y.; Fang, L.; Pan, H.; Zhang, K.; Kan, H.; Brook, J.R.; Sun, Q. PM2.5 in Beijing—Temporal pattern and its association with influenza. Environ. Health 2014, 13, 102. [Google Scholar] [CrossRef] [PubMed]
- Liu, Q.; Baumgartner, J.; Zhang, Y.; Liu, Y.; Sun, Y.; Zhang, M. Oxidative potential and inflammatory impacts of source apportioned ambient air pollution in Beijing. Environ. Sci. Technol. 2014, 48, 12920–12929. [Google Scholar] [CrossRef] [PubMed]
- Mu, L.; Deng, F.; Tian, L.; Li, Y.; Swanson, M.; Ying, J.; Browne, R.W.; Rittenhouse-Olson, K.; Zhang, J.; Zhang, Z.-F.; et al. Peak expiratory flow, breath rate and blood pressure in adults with changes in particulate matter air pollution during the Beijing Olympics: A panel study. Environ. Res. 2014, 133, 4–11. [Google Scholar] [CrossRef] [PubMed]
- Wu, S.; Deng, F.; Hao, Y.; Wang, X.; Zheng, C.; Lv, H.; Lu, X.; Wei, H.; Huang, J.; Qin, Y.; et al. Fine particulate matter, temperature, and lung function in healthy adults: Findings from the HVNR study. Chemosphere 2014, 108, 168–174. [Google Scholar] [CrossRef] [PubMed]
- Zhao, C.X.; Wang, Y.Q.; Wang, Y.J.; Zhang, H.L.; Zhao, B.Q. Temporal and spatial distribution of PM2.5 and PM10 pollution status and the correlation of particulate matters and meteorological factors during winter and spring in Beijing. Environ. Sci. 2014, 35, 418–427. [Google Scholar] [CrossRef]
- Zhao, X.; Sun, Z.; Ruan, Y.; Yan, J.; Mukherjee, B.; Yang, F.; Duan, F.; Sun, L.; Liang, R.; Lian, H.; et al. Personal black carbon exposure influences ambulatory blood pressure: Air pollution and cardiometabolic disease (AIRCMD-China) study. Hypertension 2014, 63, 871–877. [Google Scholar] [CrossRef] [PubMed]
- Dao, X.; Zhang, L.; Wang, C.; Chen, Y.; Lyu, Y.; Teng, E. Characteristics of mass and ionic compounds of atmospheric particles in winter and summer of Beijing-Tianjin-Hebei area, China. Environ. Chem. 2015, 34, 60–69. [Google Scholar] [CrossRef]
- Huang, L.; Pu, Z.; Li, M.; Sundell, J. Characterizing the Indoor-Outdoor Relationship of Fine Particulate Matter in Non-Heating Season for Urban Residences in Beijing. PLoS ONE 2015, 10, e0138559. [Google Scholar] [CrossRef] [PubMed]
- Li, P.; Xin, J.; Wang, Y.; Li, G.; Pan, X.; Wang, S.; Cheng, M.; Wen, T.; Wang, G.; Liu, Z. Association between particulate matter and its chemical constituents of urban air pollution and daily mortality or morbidity in Beijing City. Environ. Sci. Pollut. Res. Int. 2015, 22, 358–368. [Google Scholar] [CrossRef] [PubMed]
- Li, Y.; Cheng, N.; Zhang, D.; Sun, R.; Dong, X.; Sun, N.; Chen, C. PM2.5 Background Concentration at Different Directions in Beijing in 2013. Environ. Sci. 2015, 36, 4331–4339. [Google Scholar]
- Li, R.; Li, Z.; Gao, W. Diurnal, seasonal, and spatial variation of PM2.5 in Beijing. Sci. China Press. 2015, 60, 387–395. [Google Scholar] [CrossRef]
- Rich, D.Q.; Liu, K.; Zhang, J.; Thurston, S.W.; Stevens, T.P.; Pan, Y.; Kane, C.; Weinberger, B.; Ohman-Strickland, P.; Woodruff, T.J.; et al. Differences in Birth Weight Associated with the 2008 Beijing Olympics Air Pollution Reduction: Results from a Natural Experiment. Environ. Health Perspect. 2015, 123, 880–887. [Google Scholar] [CrossRef] [PubMed]
- Wang, Z.; Li, Y.; Chen, T.; Zhang, D.; Sun, F.; Pan, L. Spatial-temporal characteristics of PM2.5 in Beijing in 2013. Acta Geogr Sin. 2015, 70, 110–120. [Google Scholar] [CrossRef]
- Xie, W.; Li, G.; Zhao, D.; Xie, X.; Wei, Z.; Wang, W.; Wang, M.; Li, G.; Liu, W.; Sun, J.; et al. Relationship between fine particulate air pollution and ischaemic heart disease morbidity and mortality. Heart 2015, 101, 257–263. [Google Scholar] [CrossRef] [PubMed]
- Yang, J.; Fu, Q.; Guo, X.; Chu, B.; Yao, Y.; Teng, Y.; Wang, Y. Concentrations and seasonal variation of ambient PM(2.5) and associated metals at a typical residential area in Beijing, China. Bull. Environ. Contam. Toxicol. 2015, 94, 232–239. [Google Scholar] [CrossRef] [PubMed]
- Yang, D.; Liu, B.; Zhang, D.; Chen, Y.; Zhou, J.; Liang, Y. Correlation, Seasonal and Temporal Variation of Water-soluble Ions of PM2.5 in Beijing During 2012–2013. Environ. Sci. 2015, 36, 768–773. [Google Scholar] [CrossRef]
- Liu, Q.; Baumgartner, J.; Zhang, Y.; Schauer, J.J. Source apportionment of Beijing air pollution during a severe winter haze event and associated pro-inflammatory responses in lung epithelial cells. Atmos. Environ. 2016, 126, 28–35. [Google Scholar] [CrossRef]
- Hwang, B.F.; Lee, Y.L. Air pollution and prevalence of bronchitic symptoms among children in Taiwan. Chest 2010, 138, 956–964. [Google Scholar] [CrossRef] [PubMed]
- Lin, Y.K.; Chang, C.K.; Chang, S.C.; Chen, P.S.; Lin, C.; Wang, Y.C. Temperature, nitrogen dioxide, circulating respiratory viruses and acute upper respiratory infections among children in Taipei, Taiwan: A population-based study. Environ. Res. 2013, 120, 109–118. [Google Scholar] [CrossRef] [PubMed]
- Chang, C.C.; Kuo, C.C.; Liou, S.H.; Yang, C.Y. Fine Particulate Air Pollution and Hospital Admissions for Myocardial Infarction in a Subtropical City: Taipei, Taiwan. J. Toxicol. Environ. Health Part A 2013, 76, 440–448. [Google Scholar] [CrossRef] [PubMed]
- Hsieh, Y.L.; Tsai, S.S.; Yang, C.Y. Fine particulate air pollution and hospital admissions for congestive heart failure: A case-crossover study in Taipei. Inhal. Toxicol. 2013, 25, 455–460. [Google Scholar] [CrossRef] [PubMed]
- Tsai, S.S.; Chang, C.C.; Yang, C.Y. Fine particulate air pollution and hospital admissions for chronic obstructive pulmonary disease: A case-crossover study in Taipei. Int. J. Environ. Res. Public Health 2013, 10, 6015–6026. [Google Scholar] [CrossRef] [PubMed]
- Chen, S.Y.; Lin, Y.L.; Chang, W.T.; Lee, C.T.; Chan, C.C. Increasing emergency room visits for stroke by elevated levels of fine particulate constituents. Sci. Total Environ. 2014, 473–474, 446–450. [Google Scholar] [CrossRef] [PubMed]
- Tsai, S.S.; Chang, C.C.; Liou, S.H.; Yang, C.Y. The Effects of Fine Particulate Air Pollution on Daily Mortality: A Case-Crossover Study in a Subtropical City, Taipei, Taiwan. Int. J. Environ. Res. Public Health 2014, 11, 5081–5093. [Google Scholar] [CrossRef] [PubMed]
- Wu, C.F.; Lin, H.I.; Ho, C.C.; Yang, T.H.; Chen, C.C.; Chan, C.C. Modeling horizontal and vertical variation in intraurban exposure to PM2.5 concentrations and compositions. Environ. Res. 2014, 133, 96–102. [Google Scholar] [CrossRef] [PubMed]
- Chang, L.-T.; Chuang, K.-J.; Yang, W.-T.; Wang, V.-S.; Chuang, H.-C.; Bao, B.-Y.; Liu, C.-S.; Chang, T.-Y. Short-term exposure to noise, fine particulate matter and nitrogen oxides on ambulatory blood pressure: A repeated-measure study. Environ. Res. 2015, 140, 634–640. [Google Scholar] [CrossRef] [PubMed]
- Chen, C.C.; Tsai, S.S.; Yang, C.Y. Association between Fine Particulate Air Pollution and Daily Clinic Visits for Migraine in a Subtropical City: Taipei, Taiwan. Int. J. Environ. Res. Public Health 2015, 12, 4697–4708. [Google Scholar] [CrossRef] [PubMed]
- Hwang, B.F.; Chen, Y.H.; Lin, Y.T.; Wu, X.T.; Lee, Y.L. Relationship between exposure to fine particulates and ozone and reduced lung function in children. Environ. Res. 2015, 137, 382–390. [Google Scholar] [CrossRef] [PubMed]
- World Health Organization. WHO Air Quality Guidelines for Particulate Matter, Ozone, Nitrogen Dioxide and Sulfur Dioxide: Global Update 2005: Summary of Risk Assessment; World Health Organization: Geneva, Switzerland, 2006. [Google Scholar]
- Krzyzanowski, M.; Apte, J.S.; Bonjour, S.P.; Brauer, M.; Cohen, A.J.; Prüss-Ustun, A.M. Air Pollution in the Mega-cities. Curr. Environ. Health Rep. 2014, 1, 185–191. [Google Scholar] [CrossRef]
- Lim, S.S.; Vos, T.; Flaxman, A.D.; Danaei, G.; Shibuya, K.; Adair-Rohani, H.; Amann, M.; Anderson, H.R.; Andrews, K.G.; Aryee, M.; et al. A comparative risk assessment of burden of disease and injury attributable to 67 risk factors and risk factor clusters in 21 regions, 1990–2010: A systematic analysis for the Global Burden of Disease Study 2010. Lancet 2012, 380, 2224–2260. [Google Scholar] [CrossRef]
- Gupta, P.; Christopher, S.A. Particulate matter air quality assessment using integrated surface, satellite, and meteorological products: 2. A neural network approach. J. Geophys. Res. 2009, 114, 1–14. [Google Scholar] [CrossRef]
- Wei, F.; Teng, E.; Wu, G.; Hu, W.; Wilson, W.E.; Chapman, R.S.; Pau, J.C.; Zhang, J. Ambient Concentrations and Elemental Compositions of PM10 and PM2.5 in Four Chinese Cities. Environ. Sci. Technol. 1999, 33, 4188–4193. [Google Scholar] [CrossRef]


| Region | [PM2.5] (μg/m3) | Number of Measurements | % Above Annual Limit 1 | % Above 24-h Limit 2 |
|---|---|---|---|---|
| Northeastern | 66.50 ± 27.96 | 61 | 91.80% | 34.43% |
| Northern | 76.10 ± 38.69 | 53 | 100% | 50.94% |
| Northwestern | 85.41 ± 59.19 | 42 | 100% | 14.29% |
| Eastern | 55.41 ± 18.16 | 121 | 86.78% | 20.66% |
| South Central | 50.23 ± 21.00 | 136 | 75.74% | 16.91% |
| Southwestern | 48.72 ± 13.63 | 51 | 90.20% | 11.76% |
| Beijing | 94.42 ± 23.83 | 98 | 100% | 77.55% |
| Taiwan | 30.49 ± 1.81 | 12 | 8.33% | 0% |
| Overall Average | 60.64 ± 33.27 | 574 | 87.80% | 32.06% |
| Region | [PM2.5] (μg/m3) | Number of Measurements | % Above Annual Limit 1 | % Above 24-h Limit 2 |
|---|---|---|---|---|
| BTH | 93.73 ± 25.89 | 123 | 100% | 78.05% |
| Yangtze River | 55.86 ± 17.62 | 59 | 93.22% | 28.1% |
| Pearl River | 47.23 ± 14.86 | 38 | 65.79% | 13.16% |
| Overall Average | 71.99 ± 30.20 | 220 | 92.27% | 53.64% |
© 2017 by the authors. Licensee MDPI, Basel, Switzerland. This article is an open access article distributed under the terms and conditions of the Creative Commons Attribution (CC BY) license ( http://creativecommons.org/licenses/by/4.0/).
Share and Cite
He, M.Z.; Zeng, X.; Zhang, K.; Kinney, P.L. Fine Particulate Matter Concentrations in Urban Chinese Cities, 2005–2016: A Systematic Review. Int. J. Environ. Res. Public Health 2017, 14, 191. https://0-doi-org.brum.beds.ac.uk/10.3390/ijerph14020191
He MZ, Zeng X, Zhang K, Kinney PL. Fine Particulate Matter Concentrations in Urban Chinese Cities, 2005–2016: A Systematic Review. International Journal of Environmental Research and Public Health. 2017; 14(2):191. https://0-doi-org.brum.beds.ac.uk/10.3390/ijerph14020191
Chicago/Turabian StyleHe, Mike Z., Xiange Zeng, Kaiyue Zhang, and Patrick L. Kinney. 2017. "Fine Particulate Matter Concentrations in Urban Chinese Cities, 2005–2016: A Systematic Review" International Journal of Environmental Research and Public Health 14, no. 2: 191. https://0-doi-org.brum.beds.ac.uk/10.3390/ijerph14020191