Article

The Epidemiological Influence of Climatic Factors on Shigellosis Incidence Rates in Korea

1
Department of Preventive Medicine College of Medicine, Eulji University, Daejeon 34824, Korea
2
Department of Social and Preventive Medicine, Sungkyunkwan University School of Medicine, Suwon 16419, Korea
3
Department of Preventive Medicine, College of Medicine, Korea University, Seoul 02841, Korea
4
Department of Preventive Medicine, School of Medicine, Kyungpook National University, Daegu 41944, Korea
5
Department of Public Health Science, Graduate School of Public Health, Seoul National University, Seoul 08826, Korea
6
Department of Cancer Control and Population Health, Graduate School of Cancer Science and Policy, National Cancer Center, Goyang 10408, Korea
*
Author to whom correspondence should be addressed.
Int. J. Environ. Res. Public Health 2018, 15(10), 2209; https://0-doi-org.brum.beds.ac.uk/10.3390/ijerph15102209
Submission received: 22 August 2018 / Revised: 6 October 2018 / Accepted: 6 October 2018 / Published: 10 October 2018

Abstract

:
Research has shown the effects of climatic factors on shigellosis; however, no previous study has evaluated climatic effects in regions with a winter seasonality of shigellosis incidence. We examined the effects of temperature and precipitation on shigellosis incidence in Korea from 2002–2010. The incidence of shigellosis was calculated based on data from the Korean Center for Disease Control and Prevention (KCDC, Cheongju, Korea), and a generalized additive model (GAM) was used to analyze the associations between the incidence and climatic factors. The annual incidence rate of shigellosis was 7.9 cases/million persons from 2002–2010. During 2007–2010, high incidence rates and winter seasonality were observed among those aged ≥65 years, but not among lower age groups. Based on the GAM model, the incidence of shigellosis is expected to increase by 13.6% and 2.9% with a temperature increase of 1 °C and a lag of two weeks and with a mean precipitation increase of 1 mm and a lag of five weeks after adjustment for seasonality, respectively. This study suggests that the incidence of shigellosis will increase with global climate change despite the winter seasonality of shigellosis in Korea. Public health action is needed to prevent the increase of shigellosis incidence associated with climate variations.

1. Introduction

Shigellosis is an enteric infection caused by Gram-negative bacillus-shaped bacteria of the genus Shigella. The genus Shigella includes the species Shigella dysenteriae, Shigella flexneri, Shigella boydii, and Shigella sonnei. Symptoms of shigellosis include loose feces, fever, nausea, endotoxemia, vomiting, abdominal cramps, and tenesmus. Shigella bacteria are transmitted via direct or indirect fecal–oral routes from a symptomatic patient or a short-term asymptomatic carrier.
The World Health Organization classifies shigellosis as a waterborne and foodborne disease for which the development of a vaccine is imminent [1]. In the past 50 years, Shigella bacteria have developed resistance to numerous antibiotics and the global burden of shigellosis has increased worldwide [1,2]. It has recently been shown that 20% of hospitalized patients die of shigellosis; thus, developing a public health strategy for shigellosis disease management is critical [1,2,3].
In Korea, shigellosis is classified as a Group 1 nationally notifiable infectious disease because of the possibilities of shigellosis epidemics. S. flexneri and S. sonnei outbreaks occurred in Korea during the 1950–1980s and 1990–2000s, respectively [4]. In addition, recent studies have identified drug-resistant S. sonnei in Korea [5,6].
It has been predicted that there will be unprecedented global climate change that will lead to increases in waterborne and foodborne infectious diseases. Previous research has shown a positive association between temperature and shigellosis incidence; these studies were executed primarily in tropical and subtropical regions and showed a summer seasonality of shigellosis incidence [7,8,9,10,11,12,13,14,15,16]. The main transmission routes of shigellosis in Korea were known to be ingestion of contaminated water or food, as well as from person to person [17]. Recently, seasonal patterns of shigellosis in Korea have altered from spring/autumn to winter seasonality, indicating that the main transmission route or the vulnerable population may have changed in Korea [17,18]. Moreover, the effects of climate factors on shigellosis in Korea may differ from the results of previous studies due to the winter seasonality that occurs in Korea. This study was executed to evaluate the effect of temperature and precipitation on shigellosis incidence in Korea and to predict future trends based on global climate change. We also examined the effects of climatic factors across all four seasons to identify the seasons vulnerable to shigellosis incidence due to climate change.

2. Materials and Methods

2.1. Data Collection

The incidence of shigellosis from 2002–2010 was determined from nationally notifiable infectious disease data, which is managed by the surveillance division of the Korean Center for Disease Control and Prevention (KCDC, Cheongju, Korea). Infectious disease cases are reported by health providers working at hospitals or clinics to their regional health center, and the reports are transferred to the KCDC [19]. Finally, national statistics based on the reports are published after confirmation by the KCDC [19].
Raw climatic factor data were collected by the automatic weather system (AWS) of the Korean Meteorological Administration (KMA, Seoul, Korea) from 2002–2010. The KMA operates 494 AWSs all over the country to provide real-time weather information, and raw data is collected at 10 min intervals [20]. The climatic data were processed by region every week based on structured grid data with 1 km resolution [20,21]. Population data from 2002–2010 were obtained from the resident registration population report by Statistics Korea (Daejeon, Korea). This research was conducted in accordance with the Declaration of Helsinki, and the protocol was approved by the Institutional Review Board (IRB No. EU-14-06) of Eulji Medical University (Daejeon, Korea).

2.2. Statistical Analysis

The incidence rates for each sex and age group were determined and age-standardized rates were calculated using Microsoft Excel 2010 (Microsoft, Redmond, WA, USA). The population number in 2006 was used as the standard population when calculating the age-standardized rate. The age groups were categorized as 0–2 years (infant), 3–6 years (child), 7–17 years (juvenile), 18–64 years (adult), and 65 years and over (elderly) [22].
We compared seasonal patterns and age-specific incidence rates between 2002–2006 and 2007–2010 because shigellosis incidence and seasonal patterns changed from 2007. A generalized additive model (GAM) was used to evaluate linear and nonlinear associations of shigellosis incidence with temperature and precipitation, respectively. The unit of analysis was province, and datasets were constructed across seven metropolitan cities and nine provinces.
Penalized thin plate regression splines and logarithm link functions were applied to the GAM. We considered shigellosis incidence as a quasi-Poisson distribution because the scale estimate was calculated to be ≥10 [23]. Model selection was based on the lowest generalized cross validation score and the highest deviance explained value. Model selection was based on the lowest generalized cross validation score and the highest deviance explained value. Equations (1) and (2) were used to estimate the linear effects of temperature and precipitation, respectively. Equation (3) was used to describe the nonlinear effects of temperature and precipitation. In Equation (4), the upper limit on the degrees of freedom of each week was divided according to the four seasons of Korea.
  • Equation (1). GAM for evaluating the effect of temperature
    g ( E ( Y ) ) = α + o f f s e t ( l o g ( p o p u l a t i o n ) ) + β 1 ( t e m p e r a t u r e i ) + s 1 ( p r e c i p i t a t i o n i ) + s 2 ( w e e k i ,   d f = 53 ) + s 3 ( y e a r i ,   d f = 9 )
  • Equation (2). GAM for evaluating the effect of precipitation
    g ( E ( Y ) ) = α + o f f s e t ( l o g ( p o p u l a t i o n ) ) + s 1 ( t e m p e r a t u r e i ) + β 1 ( p r e c i p i t a t i o n i ) + s 2 ( w e e k i ,   d f = 53 ) + s 3 ( y e a r i ,   d f = 9 )
  • Equation (3). GAM for smoothing plots
    g ( E ( Y ) ) = α + o f f s e t ( l o g ( p o p u l a t i o n ) ) + s 1 ( t e m p e r a t u r e i ) + s 2 ( p r e c i p i t a t i o n i ) + s 3 ( w e e k i ,   d f = 53 ) + s 4 ( y e a r i ,   d f = 9 )
  • Equation (4). GAM for seasonality stratification
    g ( E ( Y ) ) = α + o f f s e t ( l o g ( p o p u l a t i o n ) ) + s 1 ( t e m p e r a t u r e i ) + s 2 ( p r e c i p i t a t i o n i ) + s 3 ( w e e k i ,   d f = t ) + s 4 ( y e a r i ,   d f = 9 )
E ( Y ) is the expected number of shigellosis cases, t e m p e r a t u r e i is the weekly average of the daily peak temperature, p r e c i p i t a t i o n i is the weekly average of daily precipitation, population is the population number in the province, w e e k i and y e a r i are the corresponding periods of incidence, α is the dummy variable for the incidence of shigellosis, df is the upper limit on the degrees of freedom, and t is the number of seasonal week. The actual effective degrees of freedom are automatically corrected by the degree of penalization selected during fitting. An offset term was used to adjust for population size. The t e m p e r a t u r e i , p r e c i p i t a t i o n i , w e e k i , and y e a r i were adjusted with spline function s for smoothing.
The lag time between the change in climatic factors and the incidence of shigellosis was set from 0–6 weeks, including the time required for Shigella growth, contamination of water or food, occurrence of the intestinal infection, diagnosis of the infection, and notification of the shigellosis incident [24,25]. Further, to investigate the vulnerable season due to changes in climatic factors, a stratified association analysis was performed for all four seasons. The GAM analysis was conducted with “mgcv,” “season,” and “Hmis” packages using the “gam” command in R-3.2.0 for Windows (R Foundation for Statistical Computing, Vienna, Austria).

3. Results

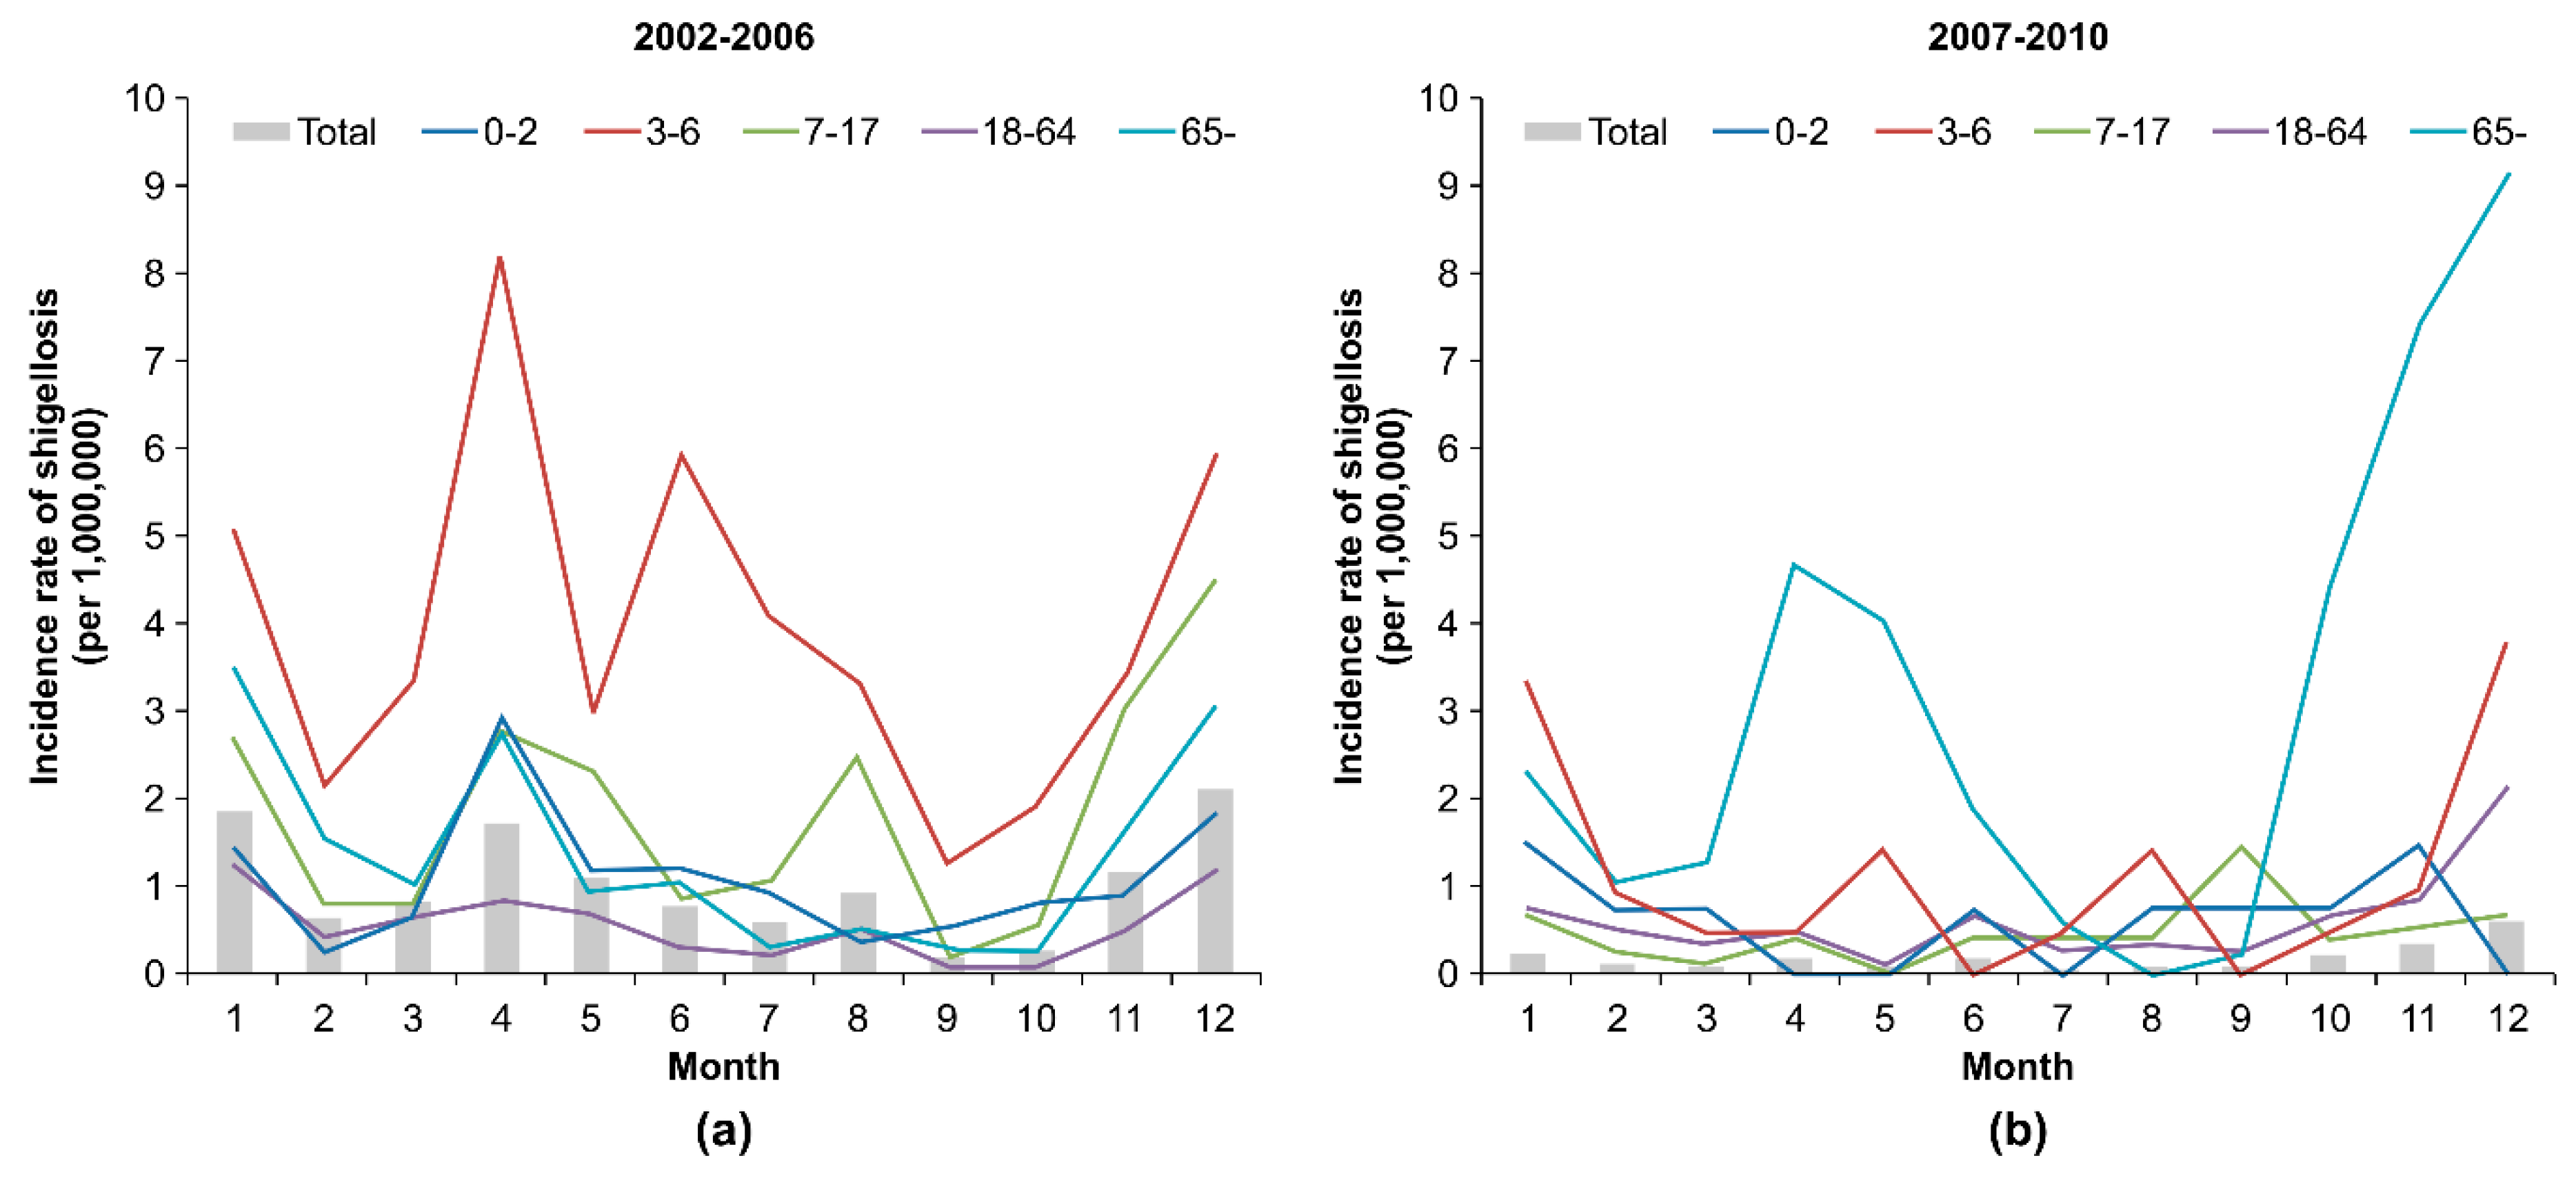
3.1. Distribution of Shigellosis Incidence across the Seasons according to Age

The annual average incidence rate of shigellosis from 2002–2010 was 7.9 cases per 1,000,000 persons. The annual incidence rate was the highest in 2003 with 23.0 cases per 1,000,000 persons and it gradually declined after 2006. The incidence rate was higher among women than men in every year. The incidence rates decreased significantly after 2006 for all of the age groups except the elderly. Additionally, from 2008–2010, the incidence rate was twice as high for the elderly (11.5, 9.9, and 8.0 cases per 1,000,000 per year, respectively) than for children (4.1, 3.2, 3.8 cases per 1,000,000 per year, respectively) and four times higher than for the other age groups (Table 1). From 2002–2006, the incidence of shigellosis showed spring and winter seasonality across most of the age groups. From 2007–2010, the incidence of shigellosis showed winter seasonality, especially among the elderly (Figure 1).

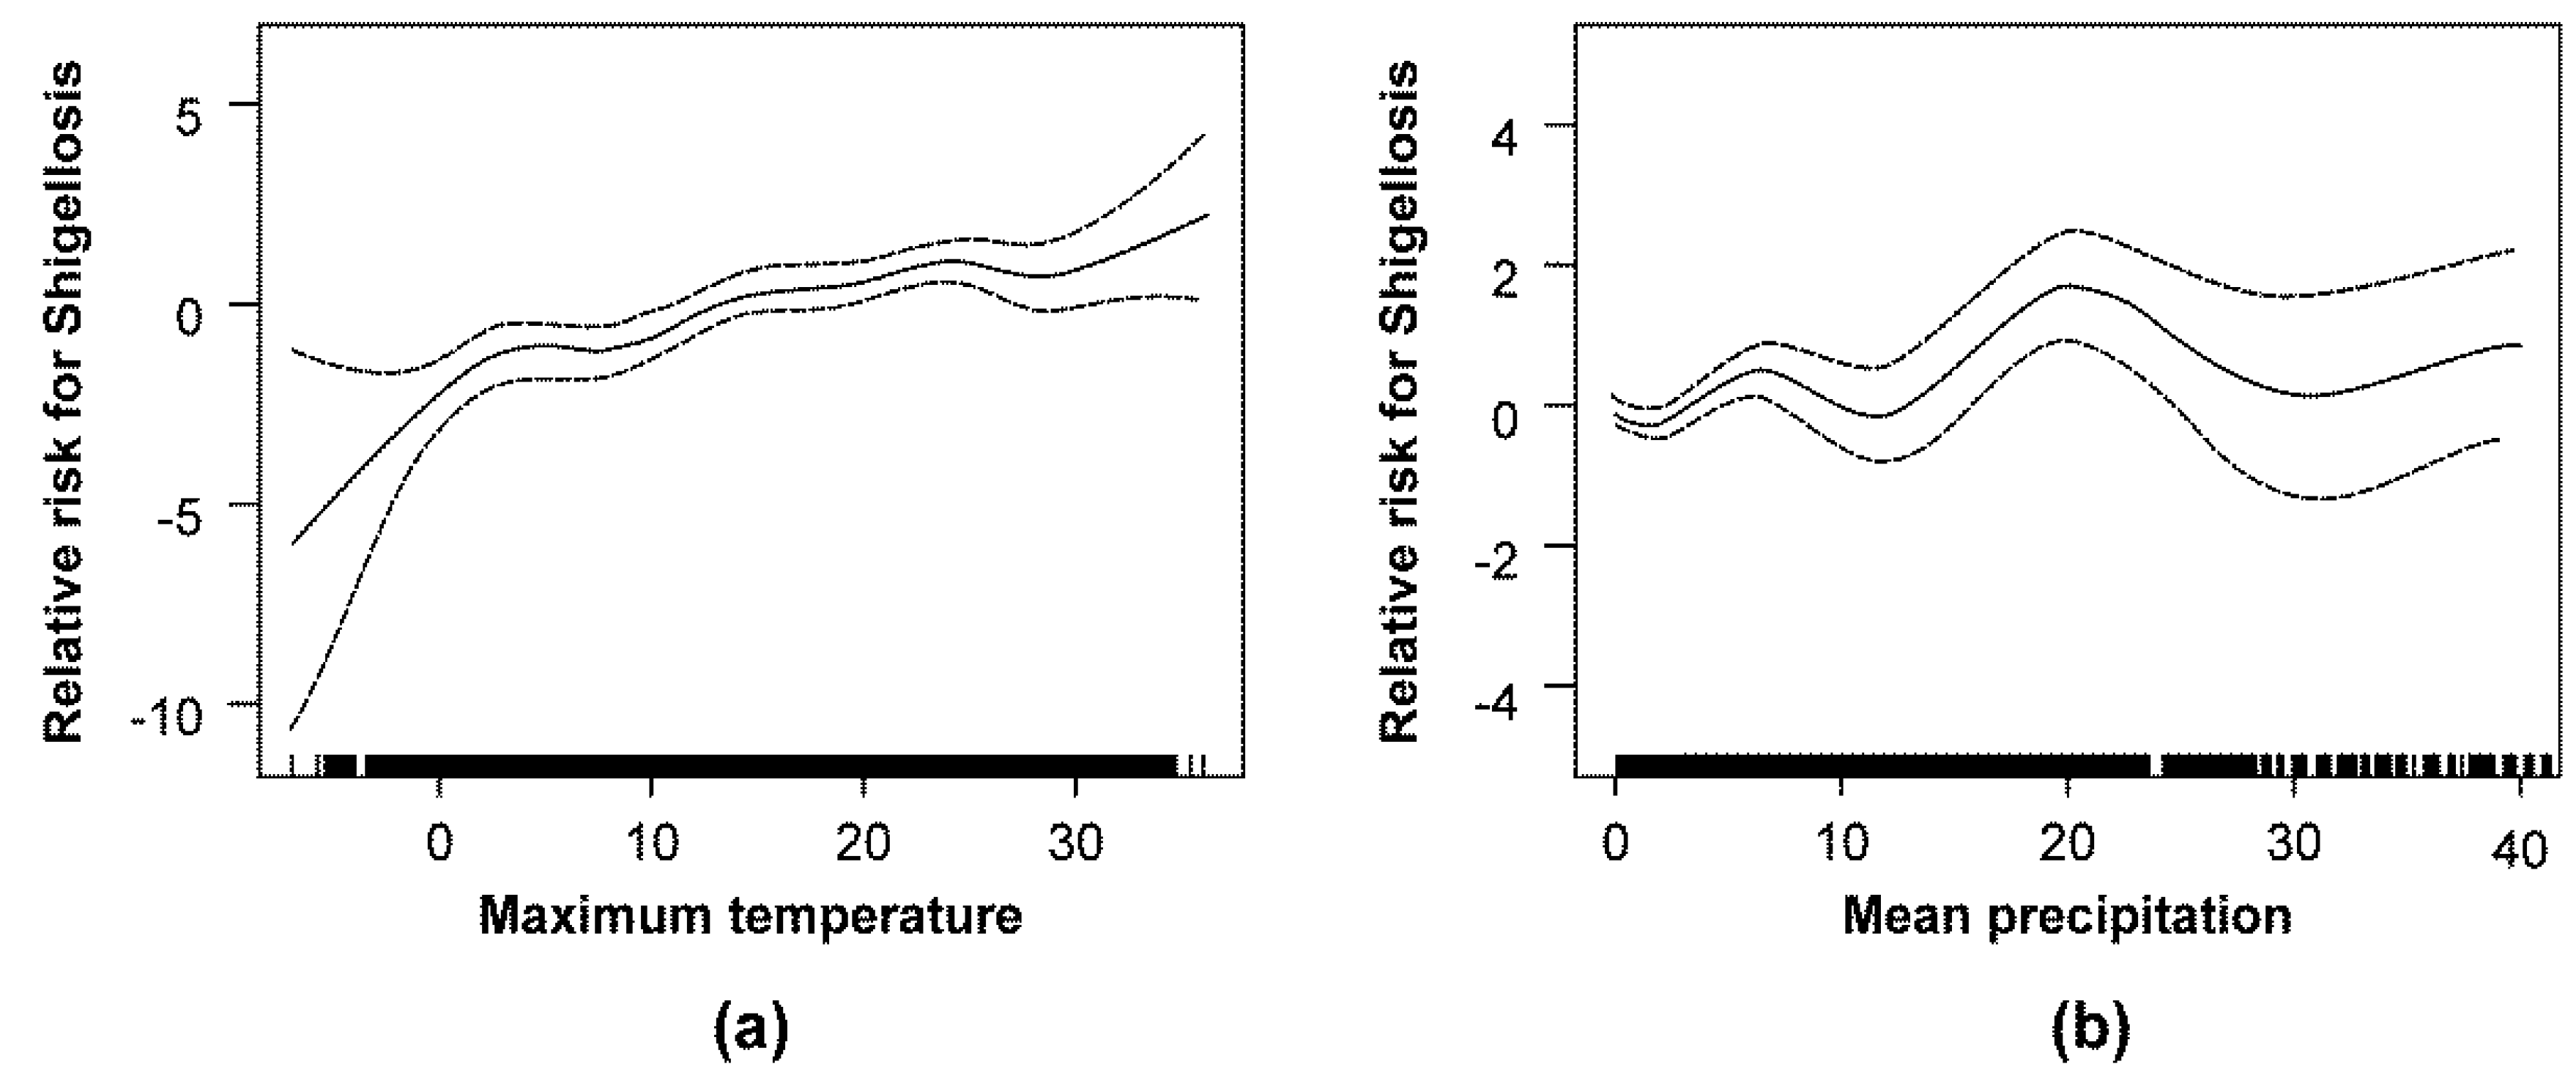
3.2. Association between Climatic Factors and the Incidence of Shigellosis

The incidence rate of shigellosis showed positive associations with temperature and precipitation at all lag times. The associations of incidence of shigellosis with temperature (lag week: 0–6) and precipitation (lag week: 0, 4–6) were statistically significant. A 1 °C increase in temperature and a 1 mm increase in precipitation were associated with a 13.6% (95% confidence interval (CI) 9.2–18.0%) and a 2.9% (95% CI: 0.5–5.2%) maximum increase in shigellosis incidence after two-week and five-week lags, respectively (Table 2).
There was an overall positive association between temperature and the shigellosis incidence rate. The degree of the association was larger below 4 °C than above it, although the precision of relative risk was lower below 4 °C than above it; the lower the temperature below 4 °C was, the wider the 95% confidence interval of relative risk was as observed in Figure 2. In contrast, the risk of shigellosis showed a nonlinear waxing and waning pattern when its association with increases in precipitation was evaluated (Figure 2).
The associations between the incidence rates of shigellosis and temperature and precipitation differed for each season. In the spring, a 1 °C increase in temperature and a 1 mm increase in precipitation were associated with a 16.1% (95% CI: 7.8–24.5%) and an 8.4% (95% CI: 4.7–12.1%) maximum increase in shigellosis incidence after a two-week lag, respectively. In summer, a 1 °C increase in temperature and a 1 mm increase in precipitation were associated with a maximum 17.5% (95% CI: 3.2–31.7%) increase and a maximum 2.9% (95% CI: 0.1–5.7%) decrease in shigellosis incidence at one-week and two-week lags, respectively. In autumn, a 1 °C increase in temperature and a 1 mm increase in precipitation were associated with a 20.0% (95% CI: 8.0–32.0%) and a 11.8% (95% CI: 3.1–20.4%) maximum increase in shigellosis incidence at two-week and zero-week lags, respectively. In winter, a 1 °C increase in temperature and a 1 mm increase in precipitation were associated with a 17.4% (95% CI: 12.6–22.2%) increase and a 15.3% (95% CI: 4.2–26.4%) decrease in shigellosis incidence after two-week and zero-week lags, respectively (Table 3).

4. Discussion

This is the first study to confirm the association of climatic factors with shigellosis in a region that has shown winter seasonality for shigellosis. The shigellosis incidence rate in Korea associated positively with temperature and precipitation at all of the lag times. After stratification by season, the effect of temperature was prominent, whereas the effect of precipitation was variable.
The reduction in shigellosis incidence among children and juveniles may be attributed to active public hygiene interventions for daycare and food service facility workers since 2006 [26,27,28,29,30,31,32]. In contrast, the incidence of shigellosis among the elderly was consistent in 2007–2010. Introduction of National Long-Term Care Insurance for the elderly in July 2008 led to a drastic increase in the number of elderly care facilities and their residents, which may have led to increased transmission of healthcare-associated infections in elderly care facilities [33,34]. Moreover, the elderly population was not included as a priority target for national sanitation control. Consequently, these factors may have caused the high incidence rate of shigellosis among the elderly during the late 2000s [35,36].
There have been limited studies on winter patterns of shigellosis seasonality, and they have failed to clearly identify the mechanism underlying these winter patterns [37,38]. From 1978–1988, winter patterns of shigellosis seasonality were observed in Milwaukee, United States and were attributed to the lack of appropriate sanitary control in daycare centers in major cities during the winter [38]. One possible reason for the winter pattern of seasonality observed among the elderly in this study is the characteristic behavior of rural elderly people to spend long periods of time together in senior citizen centers or community halls during the winter [39].
In this study, the estimated effect of rises in the weekly average of the daily peak temperature and the weekly average of the daily precipitation was an increase in the incidence rate of shigellosis. Previous studies from tropical and subtropical regions of China and Vietnam also reported a similar effect of temperature on shigellosis [8,12,14,15,16]. The estimated positive effect of precipitation on shigellosis in our study was concordant with results from some studies [11,12,15,16], but inconsistent with results from other studies [13]. Further studies are needed to estimate the effects of climatic factors on shigellosis incidence in temperate regions.
According to the smoothing plot, the risk of shigellosis increased linearly with increases in temperature, whereas the risk of shigellosis waxed and waned with increases in precipitation yet displayed an overall increase. The larger association between temperature and shigellosis incidence below 4 °C observed in the smoothing plot suggests that a 1 °C increase in temperature may cause a greater increase of shigellosis incidence in cold temperatures than in warm temperatures. A previous study that used GAM modeling showed a positive linear association of shigellosis with temperature and a fluctuating nonlinear association of shigellosis with precipitation, which is consistent with our results [14]. The waxing and waning pattern of shigellosis risk with increases in precipitation can be explained. Contamination of drinking water due to heavy rainfall can increase the risk of shigellosis and can explain the positive association between precipitation and shigellosis incidence. In addition, relative humidity is generally higher with high precipitation, and high relative humidity can shorten the survival period of bacteria within the normal temperature interval of growth and can explain the negative association between precipitation and shigellosis incidence [40]. The positive effect of temperature on shigellosis incidence was consistent across all four seasons. In contrast, the effect of precipitation was negative during summer and winter, which may be the result of the complex association between precipitation and shigellosis incidence.
This study had several limitations. First, although various factors, such as the ecology of the infectious agent and the behavior of the population, may affect the incidence of shigellosis, we only considered the influence of climatic factors on the incidence of shigellosis. Future studies should include other factors, such as humidity and the behavior of the population, which may affect the incidence of shigellosis. Second, because nationally notifiable infectious diseases are reported by health care providers, the statistics do not reflect all cases of infections. Although the reporting rate is lower than the actual incidence rate, it cannot be concluded that the level of underreporting was affected by the climatic factors, and this causes non-differential misclassification. If all cases had been reported, the associations may have been higher than observed in this study. Although the reporting rate of sporadic infections is usually low, the reporting rate is higher if infections occur in educational or daycare facilities where investigations of epidemics are conducted regularly. Differences in reporting rates, which vary according to emerging patterns of infections, may have affected this analysis on the association between shigellosis and climatic factors.
This study was meaningful in that it was the first to analyze the association between the incidence of shigellosis and climatic factors in the Korean population and to perform a stratified analysis to identify vulnerable seasons. Second, the study revealed that the winter patterns of seasonality that have been observed since the late 2000s occurred primarily among the elderly population; thus, we recommend enforcement of sanitary control in this population.

5. Conclusions

In this study, the incidence of shigellosis in Korea associated positively with temperature and precipitation, and we predict that the incidence of shigellosis will increase with global climate changes in the future. Therefore, consistent and careful monitoring of the incidence of shigellosis is necessary from a public health perspective. Moreover, further analyses on the association of shigellosis with climate and identification of populations vulnerable to climate change in Korea are necessary.

Author Contributions

Conceptualization, Y.-J.S., M.K. (Moran Ki) and J.L.; Data curation, Y.-J.S. and J.L.; Formal analysis, Y.-J.S.; Funding acquisition, M.K. (Moran Ki); Investigation, Y.-J.S.; Methodology, Y.-J.S. and J.L.; Project administration, M.K. (Moran Ki) and J.L.; Resources, Y.-J.S. and J.L.; Software, Y.-J.S.; Supervision, H.-K.C., M.K. (Myung Ki), J.-Y.S., S.-s.H., M.P., M.K. (Moran Ki) and J.L.; Validation, Y.-J.S., H.-K.C., M.K. (Myung Ki), J.-Y.S., S.-s.H. and M.P.; Writing—original draft, Y.-J.S. and J.L.; Writing—review and editing, J.L.

Funding

This research was funded by the Research Program funded by the Korean Centers for Disease Control and Prevention (2013E2100101). This paper was supported by Eulji University in 2018.

Conflicts of Interest

The authors declare no conflict of interest. The funders had no role in the design of the study; in the collection, analyses, or interpretation of data; in the writing of the manuscript, and in the decision to publish the results.

References

  1. Kotloff, K.L.; Winickoff, J.P.; Ivanoff, B.; Clemens, J.D.; Swerdlow, D.L.; Sansonetti, P.J.; Adak, G.K.; Levine, M.M. Global burden of Shigella infections: Implications for vaccine development and implementation of control strategies. Bull. World Health Organ. 1999, 77, 651–666. [Google Scholar] [PubMed]
  2. Sack, R.B.; Rahman, M.; Yunus, M.; Khan, E.H. Antimicrobial resistance in organisms causing diarrheal disease. Clin. Infect. Dis. 1997, 24, S102–S105. [Google Scholar] [CrossRef] [PubMed]
  3. Heymann, D.L. Control of Communicable Diseases Manual; American Public Health Association: Washington, DC, USA, 2008. [Google Scholar]
  4. Lee, J.C.; Jeong, Y.S.; Oh, J.Y.; Kang, H.Y.; Kim, K.H.; Kim, J.; Lee, Y.C.; Cho, D.T.; Seol, S.Y. Epidemiology of shigellosis in Korea. J. Bacteriol. Virol. 2006, 36, 41–49. [Google Scholar] [CrossRef]
  5. Lee, J.C.; Oh, J.Y.; Kim, K.S.; Jeong, Y.W.; Cho, J.W.; Park, J.C.; Seol, S.Y.; Cho, D.T. Antimicrobial resistance of Shigella sonnei in Korea during the last two decades. Apmis 2001, 109, 228–234. [Google Scholar] [CrossRef] [PubMed]
  6. Seol, S.Y.; Kim, Y.T.; Jeong, Y.S.; Oh, J.Y.; Kang, H.Y.; Moon, D.C.; Kim, J.; Lee, Y.C.; Cho, D.T.; Lee, J.C. Molecular characterization of antimicrobial resistance in Shigella sonnei isolates in Korea. J. Med. Microbiol. 2006, 55, 871–877. [Google Scholar] [CrossRef] [PubMed]
  7. Chen, M.-J.; Lin, C.-Y.; Wu, Y.-T.; Wu, P.-C.; Lung, S.-C.; Su, H.-J. Effects of extreme precipitation to the distribution of infectious diseases in Taiwan, 1994–2008. PLoS ONE 2012, 7, e34651. [Google Scholar] [CrossRef] [PubMed]
  8. Gao, L.; Zhang, Y.; Ding, G.; Liu, Q.; Zhou, M.; Li, X.; Jiang, B. Meteorological variables and bacillary dysentery cases in Changsha City, China. Am. J. Trop. Med. Hyg. 2014, 90, 697–704. [Google Scholar] [CrossRef] [PubMed]
  9. Guan, P.; Huang, D.; Guo, J.; Wang, P.; Zhou, B. Bacillary dysentery and meteorological factors in northeastern China: A historical review based on classification and regression trees. Jpn. J. Infect. Dis. 2008, 61, 356–360. [Google Scholar] [PubMed]
  10. Huang, D.; Guan, P.; Guo, J.; Wang, P.; Zhou, B. Investigating the effects of climate variations on bacillary dysentery incidence in northeast China using ridge regression and hierarchical cluster analysis. BMC Infect. Dis. 2008, 8, 130. [Google Scholar] [CrossRef] [PubMed]
  11. Kelly-Hope, L.A.; Alonso, W.J.; Thiem, V.D.; Canh, D.G.; Anh, D.D.; Lee, H.; Miller, M.A. Temporal trends and climatic factors associated with bacterial enteric diseases in Vietnam, 1991–2001. Environ. Health Perspect. 2008, 116, 7. [Google Scholar] [CrossRef] [PubMed]
  12. Lee, H.S.; Hoang, T.H.; Pham-Duc, P.; Lee, M.; Grace, D.; Phung, D.C.; Thuc, V.M.; Nguyen-Viet, H. Seasonal and geographical distribution of bacillary dysentery (shigellosis) and associated climate risk factors in Kon Tum Province in Vietnam from 1999 to 2013. Infect. Dis. Poverty 2017, 6, 113. [Google Scholar] [CrossRef] [PubMed]
  13. Li, Z.; Wang, L.; Sun, W.; Hou, X.; Yang, H.; Sun, L.; Xu, S.; Sun, Q.; Zhang, J.; Song, H. Identifying high-risk areas of bacillary dysentery and associated meteorological factors in Wuhan, China. Sci. Rep. 2013, 3, 3239. [Google Scholar] [CrossRef] [PubMed]
  14. Ma, W.; Sun, X.; Song, Y.; Tao, F.; Feng, W.; He, Y.; Zhao, N.; Yuan, Z. Applied mixed generalized additive model to assess the effect of temperature on the incidence of bacillary dysentery and its forecast. PLoS ONE 2013, 8, e62122. [Google Scholar] [CrossRef] [PubMed]
  15. Zhang, Y.; Bi, P.; Hiller, J.E. Weather and the transmission of bacillary dysentery in Jinan, northern China: A time-series analysis. Public Health Rep. 2008, 123, 61–66. [Google Scholar] [CrossRef] [PubMed]
  16. Zhang, Y.; Bi, P.; Hiller, J.E.; Sun, Y.; Ryan, P. Climate variations and bacillary dysentery in northern and southern cities of China. J. Infect. 2007, 55, 194–200. [Google Scholar] [CrossRef] [PubMed]
  17. Pai, H. Bacillary dysentery. J. Korean Med. Assoc. 2003, 46, 527–532. [Google Scholar] [CrossRef]
  18. Kim, N.-O.; Jung, S.-M.; Na, H.-Y.; Chung, G.T.; Yoo, C.-K.; Seong, W.K.; Hong, S. Enteric bacteria isolated from diarrheal patients in Korea in 2014. Osong Public Health Res. Perspect. 2015, 6, 233–240. [Google Scholar] [CrossRef] [PubMed]
  19. Park, S.; Cho, E. National Infectious Diseases Surveillance data of South Korea. Epidemiol. Health 2014, 36, e2014030. [Google Scholar] [CrossRef] [PubMed]
  20. Kim, M.; Lee, D.; Kim, J. Production and validation of daily grid data with 1 km resolution in South Korea. J. Clim. Res. 2013, 8, 13–25. [Google Scholar]
  21. Kim, M.-K.; Han, M.-S.; Jang, D.-H.; Baek, S.-G.; Lee, W.-S.; Kim, Y.-H.; Kim, S. Production technique of observation grid data of 1 km resolution. J. Clim. Res. 2012, 7, 55–68. [Google Scholar]
  22. Bogin, B.; Smith, B.H. Evolution of the Human Life Cycle; Wiley-Liss: Hoboken, NJ, USA, 2000. [Google Scholar]
  23. Unkel, S.; Farrington, C.; Garthwaite, P.H.; Robertson, C.; Andrews, N. Statistical methods for the prospective detection of infectious disease outbreaks: A review. J. R. Stat. Soc. Ser. A Stat. Soc. 2012, 175, 49–82. [Google Scholar] [CrossRef]
  24. Jajosky, R.A.; Groseclose, S.L. Evaluation of reporting timeliness of public health surveillance systems for infectious diseases. BMC Public Health 2004, 4, 29. [Google Scholar] [CrossRef] [PubMed] [Green Version]
  25. Neimann, J.; Engberg, J.; Mølbak, K.; Wegener, H.C. A case–control study of risk factors for sporadic Campylobacter infections in Denmark. Epidemiol. Infect. 2003, 130, 353–366. [Google Scholar] [CrossRef] [PubMed]
  26. Chung, M.O.; Seo, S.H. School dietitians’ perceptions of potentially hazardous food and inspection of food safety and sanitation. J. Korean Diet. Assoc. 2008, 14, 176–185. [Google Scholar]
  27. Kim, G.M.; Lee, S.Y. A study on the sanitation management status and barriers to HACCP system implementation of school foodservice institutions in Seoul metropolitan area. Korean J. Commun. Nutr. 2008, 13, 405–417. [Google Scholar]
  28. Kim, J. Studies on the knowledge, attitudes, and behavior of mothers toward food hygiene and safety of school food-service programs-Part 1. J. Food Hyg. Saf. 2004, 19, 38–48. [Google Scholar]
  29. Kim, Y. The importance of hygiene condition and HACCP system application at school food service. Food Sci. Ind. 2003, 36, 92–98. [Google Scholar]
  30. Kim, Y.S.; Park, J.W.; Bang, K.S.; Jung, S.R.; Woo, H.S.; Lee, H.J.; Jang, H.S. A study on the evaluation of maternal child health services in public health centers. J. Korean Commun. Nurs. 2002, 13, 280–291. [Google Scholar]
  31. Koh, M.; Jung, L.; Lee, J. Performance status of sanitary management of school food service in the Jeonnam area. Korean J. Hum. Ecol. 2004, 7, 51–67. [Google Scholar]
  32. Park, S.H.; Lim, Y.H. A study on the sanitary management of school foodservice operations in Daejeon and Chungnam. Korean J. Commun. Nutr. 2005, 10, 234–242. [Google Scholar]
  33. Eriksen, H.; Koch, A.; Elstrøm, P.; Nilsen, R.; Harthug, S.; Aavitsland, P. Healthcare-associated infection among residents of long-term care facilities: A cohort and nested case–control study. J. Hosp. Infect. 2007, 65, 334–340. [Google Scholar] [CrossRef] [PubMed]
  34. Gray, J. Infection control: Beyond the horizon. J. Hosp. Infect. 2015, 89, 237–240. [Google Scholar] [CrossRef] [PubMed]
  35. Park, M.H.; Kim, M.H. A Proposal of Policy on the Long-term Care System for the Elderly. J. Public Welf. Adm. 2007, 17, 105–152. [Google Scholar]
  36. Lee, E. Current Situation and Policy Implication for the Elderly Long-Term Care Insurance; Health-Welfare Policy Forum: Seoul, Korea, 2009; pp. 23–31. [Google Scholar]
  37. Calderon-Margalit, R.; Navon-Venezia, S.; Gefen, D.; Amitai, Z.; Barda, R.; Vulikh, I.; Sompolinsky, D. Biennial hyperepidemic shigellosis in an observant Jewish community. Epidemiol. Infect. 2010, 138, 244–252. [Google Scholar] [CrossRef] [PubMed]
  38. Gradus, M.; Nichamin, H. Shigellosis winter trends in Milwaukee. Wis. Med. J. 1989, 88, 17–18. [Google Scholar] [PubMed]
  39. Han, G.H.; Kim, J.H. The ecological characteristics of the communities and social interactions of the elderly in rural Korea. Korean J. Commun. Living Sci. 2005, 16, 73–88. [Google Scholar]
  40. Stine, S.W.; Song, I.; Choi, C.Y.; Gerba, C.P. Effect of relative humidity on preharvest survival of bacterial and viral pathogens on the surface of cantaloupe, lettuce, and bell peppers. J. Food Prot. 2005, 68, 1352–1358. [Google Scholar] [CrossRef] [PubMed]
Figure 1. Annual incidence rate (per million) of shigellosis by age, 2002–2010.
Ijerph 15 02209 g001
Figure 2. Smoothing plots of (a) the weekly maximum temperature and (b) mean precipitation and their relationships to shigellosis in Korea, 2002–2010. Note: The continuous line indicates the relative risk for shigellosis. The regions above and below the discontinuous lines indicate the confidence interval of the relative risk for shigellosis.
Ijerph 15 02209 g002
Table 1. Annual incidence rate (per million) of shigellosis by sex and age, 2002–2010.
Year200220032004200520062007200820092010Total
Total15.7323.009.575.617.551.832.982.922.497.90
Sex
Men13.4622.369.545.006.941.502.671.771.927.18
Women18.0223.649.606.228.162.163.294.083.058.62
Age (years)
0–215.0426.995.427.118.870.003.662.171.468.37
3–656.59113.5512.7213.8336.903.804.093.213.7930.84
7–1724.3645.1028.444.838.180.942.561.510.8513.02
18–649.5210.115.113.975.241.521.722.181.934.55
≥6524.5628.0910.9614.688.565.1011.489.878.0412.78
Table 2. Associations between shigellosis incidence and climatic factors.
Climatic FactorsTime-PointRelative Risk95% Confidence IntervalChange (%)p-Value
Maximum temperaturePresent1.1001.0601.14010.0<0.001
Lag 11.1281.0851.17112.8<0.001
Lag 21.1361.0921.18013.6<0.001
Lag 31.1061.0631.14910.6<0.001
Lag 41.0981.0571.1399.8<0.001
Lag 51.0761.0331.1197.6<0.001
Lag 61.0801.0381.1228.0<0.001
Daily precipitationPresent1.0251.0031.0472.50.030
Lag 11.0210.9971.0452.10.094
Lag 21.0200.9961.0452.00.110
Lag 31.0120.9871.0381.20.342
Lag 41.0261.0031.0492.60.026
Lag 51.0291.0051.0522.90.018
Lag 61.0291.0041.0542.90.026
Note: Statistical analyses were conducted using the generalized additive model and seasonality was corrected by spline functions. When the effect of temperature was primarily examined, corrections for precipitation were made, and when the effect of precipitation was primarily examined, corrections for temperature were made.
Table 3. Associations between shigellosis incidence and climatic factors after seasonal stratification.
SeasonTime-PointMaximum TemperatureMean Precipitation
RR95% CIChange (%)p-ValueRR95% CIChange (%)p-Value
SpringPresent1.0470.9681.1264.70.2521.0491.0171.0814.90.003
Lag 11.0440.9691.1194.40.2591.0461.0101.0834.60.016
Lag 21.1611.0781.24516.1<0.0011.0841.0471.1218.4<0.001
Lag 31.1221.0501.19412.20.0021.0821.0321.1338.20.002
Lag 41.0700.9991.1417.00.0631.0370.9751.0993.70.252
Lag 51.0230.9491.0982.30.5441.0410.9791.1034.10.206
Lag 61.0480.9731.1234.80.2241.0660.9961.1356.60.072
SummerPresent0.9970.8771.116−0.30.9551.0000.9781.0220.00.989
Lag 11.1751.0321.31717.50.0270.9990.9711.027−0.10.939
Lag 21.0400.9041.1754.00.5740.9710.9430.999−2.90.039
Lag 30.9680.8481.088−3.20.5920.9810.9561.005−1.90.116
Lag 41.0090.9001.1170.90.8751.0150.9951.0351.50.149
Lag 50.8870.7800.995−11.30.0291.0010.9811.0210.10.905
Lag 60.9670.8571.077−3.30.5541.0110.9881.0351.10.354
AutumnPresent1.0670.9741.1606.70.1741.1181.0311.20411.80.012
Lag 11.1861.0731.30018.60.0031.0660.9821.1496.60.134
Lag 21.2001.0801.32020.00.0031.0270.9351.1182.70.573
Lag 31.1791.0611.29717.90.0060.9940.9061.082−0.60.892
Lag 41.1771.0481.30617.70.0131.0691.0111.1266.90.024
Lag 51.1831.0411.32418.30.0201.0300.9741.0873.00.301
Lag 61.1491.0061.29214.90.0581.0070.9561.0580.70.785
WinterPresent1.0981.0511.1459.8<0.0011.0710.9771.1657.10.152
Lag 11.1561.1081.20515.6<0.0011.0740.9741.1757.40.163
Lag 21.1671.1201.21416.7<0.0011.0180.9171.1191.80.727
Lag 31.1221.0751.16912.2<0.0011.0390.9391.1403.90.453
Lag 41.1741.1261.22217.4<0.0010.8470.7360.958−15.30.003
Lag 51.1381.0851.19113.8<0.0010.9820.8801.085−1.80.735
Lag 61.1081.0591.15710.8<0.0010.9910.8881.093−0.90.856
Note: RR: relative risk; 95% CI: 95% confidence interval. Statistical analyses were conducted using the generalized additive model and seasonality was corrected by spline functions. When the effect of temperature was primarily examined, corrections for precipitation were made, and when the effect of precipitation was primarily examined, corrections for temperature were made.

