Life Satisfaction, Interpersonal Relationships, and Learning Influence Withdrawal from School: A Study among Junior High School Students in Japan


Abstract
:1. Introduction
2. Materials and Methods
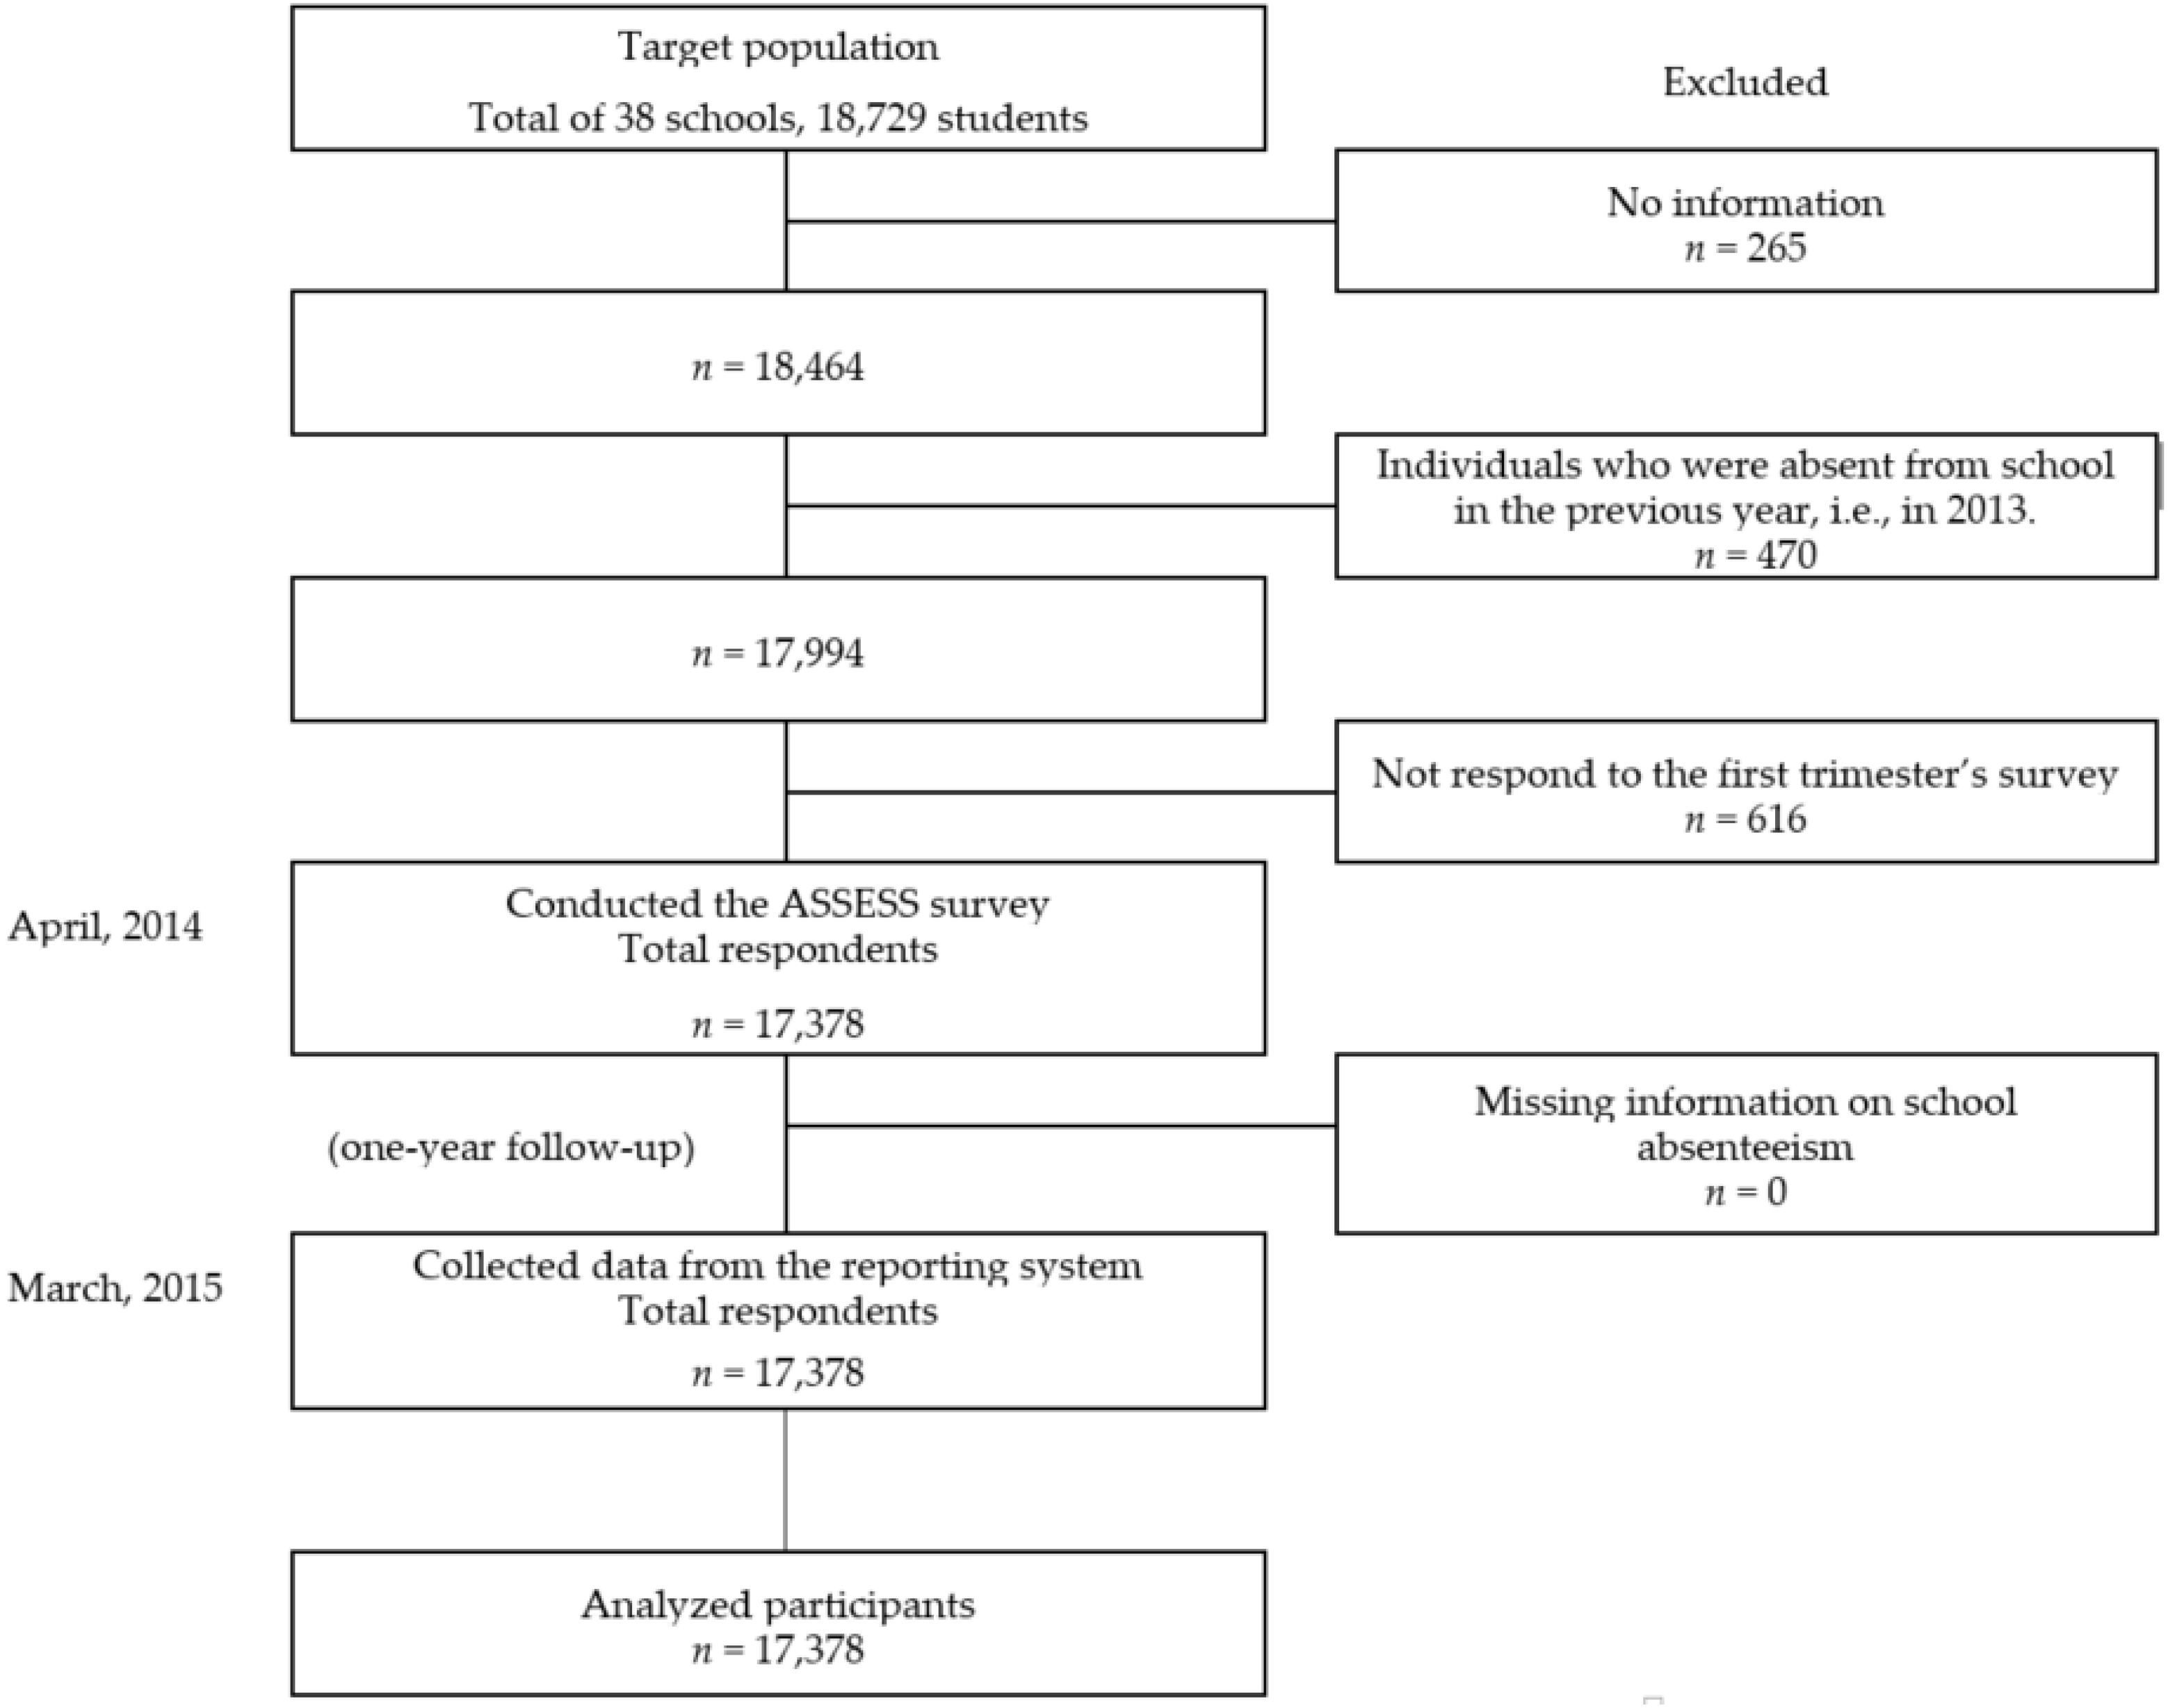
2.1. Data Source
2.2. Exposure Variable
2.3. Outcome Variable: School Absenteeism
2.4. Data Analysis and Ethical Issues
3. Results
4. Discussion
4.1. Lower Life Satisfaction Affects School Absenteeism
4.2. Adjustment to Learning and Absenteeism
4.3. Interpersonal Relationships and Absenteeism
4.4. Limitations
5. Conclusions
Author Contributions
Funding
Acknowledgments
Conflicts of Interest
References
- Bould, H.; De Stavola, B.; Magnusson, C.; Micali, N.; Dal, H.; Evans, J.; Dalman, C.; Lewis, G. The influence of school on whether girls develop eating disorders. Int. J. Epidemiol. 2016, 45, 480–488. [Google Scholar] [CrossRef] [PubMed] [Green Version]
- Nagane, M. Relationship of subjective chronic fatigue to academic performance. Psychol. Rep. 2004, 95, 48–52. [Google Scholar] [CrossRef] [PubMed]
- Tyrrell, M. School phobia. J. Sch. Nurs. 2005, 21, 147–151. [Google Scholar] [CrossRef] [PubMed]
- Oh, W.; Rubin, K.H.; Bowker, J.C.; Booth-LaForce, C.; Rose-Krasnor, L.; Laursen, B. Trajectories of social withdrawal from middle childhood to early adolescence. J. Abnorm. Child Psychol. 2008, 36, 553–566. [Google Scholar] [CrossRef] [PubMed]
- Kawachi, I.; Subramanian, S.V.; Kim, D. (Eds.) Social Capital and Health; Springer: New York, NY, USA, 2008. [Google Scholar] [CrossRef]
- Edwards, D.; Mullis, F. Creating a sense of belonging to build safe schools. J. Individ. Psychol. 2001, 57, 196–203. [Google Scholar]
- Salmela-Aro, K.; Kiuru, N.; Nurmi, J.-E. The role of educational track in adolescents’ school burnout: A longitudinal study. Br. J. Educ. Psychol. 2008, 78, 663–689. [Google Scholar] [CrossRef] [PubMed]
- Chau, K.; Kabuth, B.; Causin-Brice, O.; Delacour, Y.; Richoux-Picard, C.; Verdin, M.; Armand, I.; Chau, N. Associations between school difficulties and health-related problems and risky behaviours in early adolescence: A cross-sectional study in middle-school adolescents in France. Psychiatry Res. 2016, 30, 1–9. [Google Scholar] [CrossRef] [PubMed]
- Black, L.I.; Zablotsky, B. Chronic School Absenteeism Among Children with Selected Developmental Disabilities: National Health Interview Survey, 2014–2016. Natl. Health Stat. Rep. 2018, 118, 1–7. [Google Scholar]
- Gonzálvez, C.; Kearney, C.A.; Jiménez-Ayala, C.E.; Sanmartín, R.; Vicent, M.; Inglés, C.J.; García-Fernández, J.M. Functional profiles of school refusal behavior and their relationship with depression, anxiety, and stress. Psychiatry Res. 2018, 269, 140–144. [Google Scholar] [CrossRef] [PubMed]
- Knollmann, M.; Reissner, V.; Hebebrand, J. Towards a comprehensive assessment of school absenteeism: Development and initial validation of the inventory of school attendance problems. Eur. Child. Adolesc. Psychiatry 2018. [Google Scholar] [CrossRef] [PubMed]
- Stempel, H.; Cox-Martin, M.; Bronsert, M.; Dickinson, L.M.; Allison, M.A. Chronic School Absenteeism and the Role of Adverse Childhood Experiences. Acad. Pediatr. 2017, 17, 837–843. [Google Scholar] [CrossRef] [PubMed]
- King, N.; Dewey, C.; Borish, D. Determinants of Primary School Non-Enrollment and Absenteeism: Results from a Retrospective, Convergent Mixed Methods, Cohort Study in Rural Western Kenya. PLoS ONE 2015, 15, e0138362. [Google Scholar] [CrossRef] [PubMed]
- Kupersmidt, J.B.; Coie, J.D. Preadolescent peer status, aggression, and school adjustment as predictors of externalizing problems in adolescence. Child. Dev. 1990, 61, 1350–1362. [Google Scholar] [CrossRef] [PubMed]
- Ratelle, C.F.; Duchesne, S.; Guay, F. Predicting school adjustment from multiple perspectives on parental behaviors. J. Adolesc. 2017, 54, 60–72. [Google Scholar] [CrossRef] [PubMed]
- Nakamura, M.; Kondo, I.; Kubota, A.; Furukawa, I.; Suzuki, T.; Nakamura, H.; Hayakawa, N.; Ojima, T.; Aoki, N. School attendance problems, subjective symptoms and lifestyle factors:the Shizuoka health and lifestyle survey of students. Jpn. J. Public Health 2010, 57, 881–890. [Google Scholar]
- Makino, S.; Tatsumi, A.; Otsuka, T. The Experience of Elementary School Teachers’ Support of School Non-attending Children Neglected by Their Parents. J. Jpn. Acad. Community Health Nurs. 2015, 17, 60–69. [Google Scholar]
- Hysing, M.; Haugland, S.; Stormark, K.M.; Bøe, T.; Sivertsen, B. Sleep and school attendance in adolescence: Results from a large population-based study. Scand. J. Public Health 2015, 43, 2–9. [Google Scholar] [CrossRef] [PubMed]
- Kurihara, S.; Inoue, W. Excel 2013 ASSESS; Honnomori Publisher: Tokyo, Japan, 2013. (In Japanese) [Google Scholar]
- Kurihara, S.; Inoue, W. How to Use ASSESS; Honnomori Publisher: Tokyo, Japan, 2010. (In Japanese) [Google Scholar]
- Easton, S.; Ferrari, E. Children’s travel to school—The interaction of individual, neigbhourhood and school factors. Trans. Pol. 2015, 44, 9–18. [Google Scholar] [CrossRef]
- Johnson, A.M.; Falstein, F.I.; Szurek, S.A.; Svendsen, M. School phobia. Am. J. Orthopsychiatry 1941, 2, 702. [Google Scholar] [CrossRef]
- Hoshino, Y.; Niwa, S. Separation anxiety as a genesis of school refusal showing physical symptoms and therapeutic approach. Psychosom. Med. 2000, 4, 462–467. [Google Scholar]
- Krieg, A.; Dickie, J.R. Attachment and hikikomori: A psychosocial developmental model. Int. J. Soc. Psychiatry 2013, 59, 61–72. [Google Scholar] [CrossRef] [PubMed]
- Dupere, V.; Archambault, I.; Leventhal, T.; Dion, E.; Anderson, S. School mobility and school-age children’s social adjustment. Dev. Psychol. 2015, 51, 197–210. [Google Scholar] [CrossRef] [PubMed]
- Mizuno, K.; Tanaka, M.; Fukuda, S.; Imai-Matsumura, K.; Watanabe, Y. Relationship between cognitive function and prevalence of decrease in intrinsic academic motivation in adolescents. Behav. Brain Funct. 2011, 7, 4. [Google Scholar] [CrossRef] [PubMed] [Green Version]
- Lepore, S.J.; Kliewer, W. Violence exposure, sleep disturbance, and poor academic performance in middle school. J. Abnorm. Child Psychol. 2013, 41, 1179–1189. [Google Scholar] [CrossRef] [PubMed]
- Ministry of Education, Culture, Sports, Science and Technology. Survey and Guidance on Undesirable Behavior in Students. 2015. Available online: http://www.mext.go.jp/b_menu/toukei/chousa01/shidou/1267646.htm (accessed on 1 October 2018).
- Ministry of Education, Culture, Sports, Science and Technology. 2003. Available online: http://www.mext.go.jp/b_menu/ shingi/chousa/shotou/054/shiryo/attach/1361231.htm (accessed on 1 October 2018).
- Bowker, J.C.; Ojo, A.A.; Bowker, M.H. Brief report: Perceptions of social withdrawal during emerging adulthood in Lagos, Nigeria. J. Adolesc. 2016, 47, 1–4. [Google Scholar] [CrossRef] [PubMed]
- Li, T.M.; Wong, P.W. Youth social withdrawal behavior (hikikomori): A systematic review of qualitative and quantitative studies. Aust. N. Z. J. Psychiatry 2015, 49, 595–609. [Google Scholar] [CrossRef] [PubMed] [Green Version]
- Igarashi, T. Children’s Tendency to be Absent from School and Their School-life Skills: Transition from Elementary to Junior High School. Jpn. J. Educ. Psychol. 2011, 59, 64–76. [Google Scholar] [CrossRef]


| Gender Informationand ASSESS Scores | Seventh Grade | Eighth Grade | Ninth Grade | |||||||||||||
|---|---|---|---|---|---|---|---|---|---|---|---|---|---|---|---|---|
| Total | Absent More Than | Total | Absent More Than | Total | Absent More Than | |||||||||||
| 10 Days | 30 Days | 10 Days | 30 Days | 10 Days | 30 Days | |||||||||||
| n | % | n | % | n | % | n | % | n | % | n | % | |||||
| Gender | ||||||||||||||||
| Boy | 2623 | 110 | (4.2) | 40 | (1.5) | 2366 | 128 | (5.4) | 44 | (1.9) | 2686 | 90 | (3.4) | 35 | (1.3) | |
| Girl | 2404 | 142 | (5.9) | 54 | (2.2) | 2239 | 137 | (6.1) | 51 | (2.3) | 2469 | 91 | (3.7) | 35 | (1.4) | |
| Missing | 1179 | 75 | (6.4) | 25 | (2.1) | 1352 | 70 | (5.2) | 28 | (2.1) | 626 | 28 | (4.5) | 14 | (2.2) | |
| Life satisfaction | ||||||||||||||||
| More than 50 | 4079 | 165 | (4.0) | 45 | (1.1) | 3744 | 156 | (4.2) | 42 | (1.1) | 4124 | 108 | (2.6) | 35 | (0.8) | |
| 40–49 | 1473 | 77 | (5.2) | 27 | (1.8) | 1418 | 83 | (5.9) | 34 | (2.4) | 978 | 38 | (3.9) | 15 | (1.5) | |
| Less than 39 | 501 | 61 | (12.2) | 30 | (6.0) | 605 | 58 | (9.6) | 21 | (3.5) | 455 | 26 | (5.7) | 9 | (2.0) | |
| Teacher support | ||||||||||||||||
| More than 50 | 3952 | 171 | (4.3) | 56 | (1.4) | 3682 | 179 | (4.9) | 55 | (1.5) | 4165 | 124 | (3.0) | 41 | (1.0) | |
| 40–49 | 1503 | 76 | (5.1) | 21 | (1.4) | 1539 | 73 | (4.7) | 29 | (1.9) | 1021 | 28 | (2.7) | 9 | (0.9) | |
| Less than 39 | 596 | 56 | (9.4) | 25 | (4.2) | 540 | 45 | (8.3) | 13 | (2.4) | 372 | 20 | (5.4) | 9 | (2.4) | |
| Friendship | ||||||||||||||||
| More than 50 | 4122 | 189 | (4.6) | 52 | (1.3) | 3523 | 160 | (4.5) | 51 | (1.4) | 3750 | 106 | (2.8) | 30 | (0.8) | |
| 40–49 | 1436 | 68 | (4.7) | 30 | (2.1) | 1551 | 89 | (5.7) | 28 | (1.8) | 1346 | 43 | (3.2) | 17 | (1.3) | |
| Less than 39 | 498 | 46 | (9.2) | 20 | (4.0) | 692 | 48 | (6.9) | 18 | (2.6) | 460 | 23 | (5.0) | 12 | (2.6) | |
| Social skills | ||||||||||||||||
| More than 50 | 3533 | 156 | (4.4) | 41 | (1.2) | 3405 | 153 | (4.5) | 46 | (1.4) | 3396 | 97 | (2.9) | 26 | (0.8) | |
| 40–49 | 1758 | 86 | (4.9) | 30 | (1.7) | 1753 | 92 | (5.2) | 37 | (2.1) | 1439 | 42 | (2.9) | 20 | (1.4) | |
| Less than 39 | 765 | 61 | (8.0) | 31 | (4.1) | 609 | 52 | (8.5) | 14 | (2.3) | 724 | 33 | (4.6) | 13 | (1.8) | |
| Non-intrusive relationship | ||||||||||||||||
| More than 50 | 3814 | 193 | (5.1) | 66 | (1.7) | 3291 | 145 | (4.4) | 43 | (1.3) | 3049 | 87 | (2.9) | 29 | (1.0) | |
| 40–49 | 1734 | 80 | (4.6) | 26 | (1.5) | 1865 | 102 | (5.5) | 32 | (1.7) | 1958 | 59 | (3.0) | 17 | (0.9) | |
| Less than 39 | 507 | 30 | (5.9) | 10 | (2.0) | 606 | 50 | (8.3) | 22 | (3.6) | 552 | 26 | (4.7) | 13 | (2.4) | |
| Learning | ||||||||||||||||
| More than 50 | 3953 | 161 | (4.1) | 56 | (1.4) | 3415 | 142 | (4.2) | 44 | (1.3) | 2755 | 74 | (2.7) | 27 | (1.0) | |
| 40–49 | 1444 | 87 | (6.0) | 27 | (1.9) | 1496 | 76 | (5.1) | 27 | (1.8) | 1804 | 59 | (3.3) | 21 | (1.2) | |
| Less than 39 | 658 | 55 | (8.4) | 19 | (2.9) | 854 | 79 | (9.3) | 26 | (3.0) | 999 | 39 | (3.9) | 11 | (1.1) | |
| Total | 6055 | 303 | (5.0) | 102 | (1.7) | 5765 | 297 | (5.2) | 97 | (1.7) | 5558 | 172 | (3.1) | 59 | (1.1) | |
| ASSESS Scores | All Grades | Seventh Grade | Eighth Grade | Ninth Grade | ||||||||||||
|---|---|---|---|---|---|---|---|---|---|---|---|---|---|---|---|---|
| Absent More Than | Absent More Than | Absent More Than | Absent More Than | |||||||||||||
| 10 Days | 30 Days | 10 Days | 30 Days | 10 Days | 30 Days | 10 Days | 30 Days | |||||||||
| OR | 95%CI | OR | 95%CI | OR | 95%CI | OR | 95%CI | OR | 95%CI | OR | 95%CI | OR | 95%CI | OR | 95%CI | |
| Life satisfaction | ||||||||||||||||
| More than 50 | Reference | Reference | Reference | Reference | Reference | Reference | Reference | Reference | ||||||||
| 40–49 | 1.40 | (1.23, 1.60) | 1.45 | (1.22, 1.72) | 1.30 | (1.06, 1.60) | 1.31 | (0.99, 1.73) | 1.31 | (1.06, 1.62) | 1.43 | (1.09, 1.88) | 1.58 | (1.20, 2.06) | 1.50 | (1.03, 2.19) |
| Less than 39 | 2.06 | (1.75, 2.42) | 2.73 | (2.25, 3.32) | 2.30 | (1.77, 3.00) | 3.29 | (2.41, 4.48) | 1.83 | (1.41, 2.38) | 2.44 | (1.78, 3.34) | 2.00 | (1.42, 2.80) | 2.25 | (1.45, 3.50) |
| Learning | ||||||||||||||||
| More than 50 | Reference | Reference | Reference | Reference | Reference | Reference | Reference | Reference | ||||||||
| 40–49 | 1.21 | (1.07, 1.38) | 1.27 | (1.07, 1.50) | 1.25 | (1.02, 1.55) | 1.51 | (1.15, 1.97) | 1.35 | (1.09, 1.68) | 1.23 | (0.93, 1.64) | 1.19 | (0.93, 1.54) | 1.22 | (0.87, 1.73) |
| Less than 39 | 1.76 | (1.53, 2.03) | 1.92 | (1.60, 2.31) | 1.86 | (1.44, 2.39) | 2.15 | (1.56, 2.95) | 2.14 | (1.70, 2.69) | 2.35 | (1.77, 3.13) | 1.53 | (1.16, 2.04) | 1.47 | (0.99, 2.18) |
| Interpersonal relationship | ||||||||||||||||
| More than 50 | Reference | Reference | Reference | Reference | Reference | Reference | Reference | Reference | ||||||||
| 40–49 | 1.32 | (1.17, 1.48) | 1.46 | (1.25, 1.71) | 1.24 | (1.02, 1.52) | 1.48 | (1.15, 1.90) | 1.36 | (1.12, 1.66) | 1.63 | (1.27, 2.09) | 1.34 | (1.05, 1.71) | 1.16 | (0.83, 1.63) |
| Less than 39 | 1.79 | (1.32, 2.41) | 1.79 | (1.20, 2.65) | 1.53 | (0.90, 2.62) | 1.58 | (0.79, 3.16) | 1.84 | (1.16, 2.94) | 1.84 | (1.00, 3.39) | 2.00 | (1.11, 3.61) | 1.95 | (0.89, 4.27) |
| ASSESS Scores | All Grades | Seventh Grade | Eighth Grade | Ninth Grade | ||||||||||||
|---|---|---|---|---|---|---|---|---|---|---|---|---|---|---|---|---|
| Absent More Than | Absent More Than | Absent More Than | Absent More Than | |||||||||||||
| 10 Days | 30 Days | 10 Days | 30 Days | 10 Days | 30 Days | 10 Days | 30 Days | |||||||||
| HR | 95%CI | HR | 95%CI | HR | 95%CI | HR | 95%CI | HR | 95%CI | HR | 95%CI | HR | 95%CI | HR | 95%CI | |
| Life satisfaction | ||||||||||||||||
| More than 50 | Reference | Reference | Reference | Reference | Reference | Reference | Reference | Reference | ||||||||
| 40–49 | 1.44 | (1.22, 1.70) | 1.95 | (1.47, 2.60) | 1.30 | (0.99, 1.70) | 1.66 | (1.03, 2.68) | 1.42 | (1.09, 1.86) | 2.15 | (1.37, 3.38) | 1.49 | (1.03, 2.16) | 1.81 | (0.99, 3.32) |
| Less than 39 | 2.66 | (2.20, 3.21) | 3.80 | (2.79, 5.17) | 3.17 | (2.37, 4.26) | 5.57 | (3.51, 8.84) | 2.37 | (1.75, 3.20) | 3.12 | (1.85, 5.27) | 2.23 | (1.45, 3.42) | 2.36 | (1.13, 4.90) |
| Learning | ||||||||||||||||
| More than 50 | Reference | Reference | Reference | Reference | Reference | Reference | Reference | Reference | ||||||||
| 40–49 | 1.26 | (1.07, 1.49) | 1.26 | (0.95, 1.67) | 1.49 | (1.15, 1.94) | 1.32 | (0.84, 2.09) | 1.22 | (0.93, 1.62) | 1.40 | (0.87, 2.27) | 1.22 | (0.87, 1.72) | 1.19 | (0.67, 2.10) |
| Less than 39 | 1.89 | (1.58, 2.26) | 1.81 | (1.33, 2.48) | 2.10 | (1.54, 2.85) | 2.05 | (1.22, 3.45) | 2.28 | (1.73, 3.00) | 2.38 | (1.46, 3.86) | 1.46 | (0.99, 2.15) | 1.12 | (0.56, 2.26) |
| Interpersonal relationship | ||||||||||||||||
| More than 50 | Reference | Reference | Reference | Reference | Reference | Reference | Reference | Reference | ||||||||
| 40–49 | 1.45 | (1.24, 1.69) | 1.86 | (1.44, 2.40) | 1.47 | (1.15, 1.88) | 2.08 | (1.38, 3.14) | 1.61 | (1.26, 2.04) | 1.88 | (1.25, 2.84) | 1.16 | (0.83, 1.61) | 1.51 | (0.87, 2.62) |
| Less than 39 | 1.76 | (1.20, 2.58) | 2.06 | (1.08, 3.91) | 1.56 | (0.80, 3.04) | 2.41 | (0.87, 6.66) | 1.80 | (1.00, 3.24) | 1.42 | (0.44, 4.54) | 1.94 | (0.90, 4.15) | 2.68 | (0.82, 8.70) |
© 2018 by the authors. Licensee MDPI, Basel, Switzerland. This article is an open access article distributed under the terms and conditions of the Creative Commons Attribution (CC BY) license (http://creativecommons.org/licenses/by/4.0/).
Share and Cite
Inoue, S.; Kato, T.; Yorifuji, T. Life Satisfaction, Interpersonal Relationships, and Learning Influence Withdrawal from School: A Study among Junior High School Students in Japan. Int. J. Environ. Res. Public Health 2018, 15, 2309. https://0-doi-org.brum.beds.ac.uk/10.3390/ijerph15102309
Inoue S, Kato T, Yorifuji T. Life Satisfaction, Interpersonal Relationships, and Learning Influence Withdrawal from School: A Study among Junior High School Students in Japan. International Journal of Environmental Research and Public Health. 2018; 15(10):2309. https://0-doi-org.brum.beds.ac.uk/10.3390/ijerph15102309
Chicago/Turabian StyleInoue, Sachiko, Tsuguhiko Kato, and Takashi Yorifuji. 2018. "Life Satisfaction, Interpersonal Relationships, and Learning Influence Withdrawal from School: A Study among Junior High School Students in Japan" International Journal of Environmental Research and Public Health 15, no. 10: 2309. https://0-doi-org.brum.beds.ac.uk/10.3390/ijerph15102309