Estimation of the Nutrient and Chlorophyll a Reference Conditions in Taihu Lake Based on A New Method with Extreme–Markov Theory


Abstract
:1. Introduction
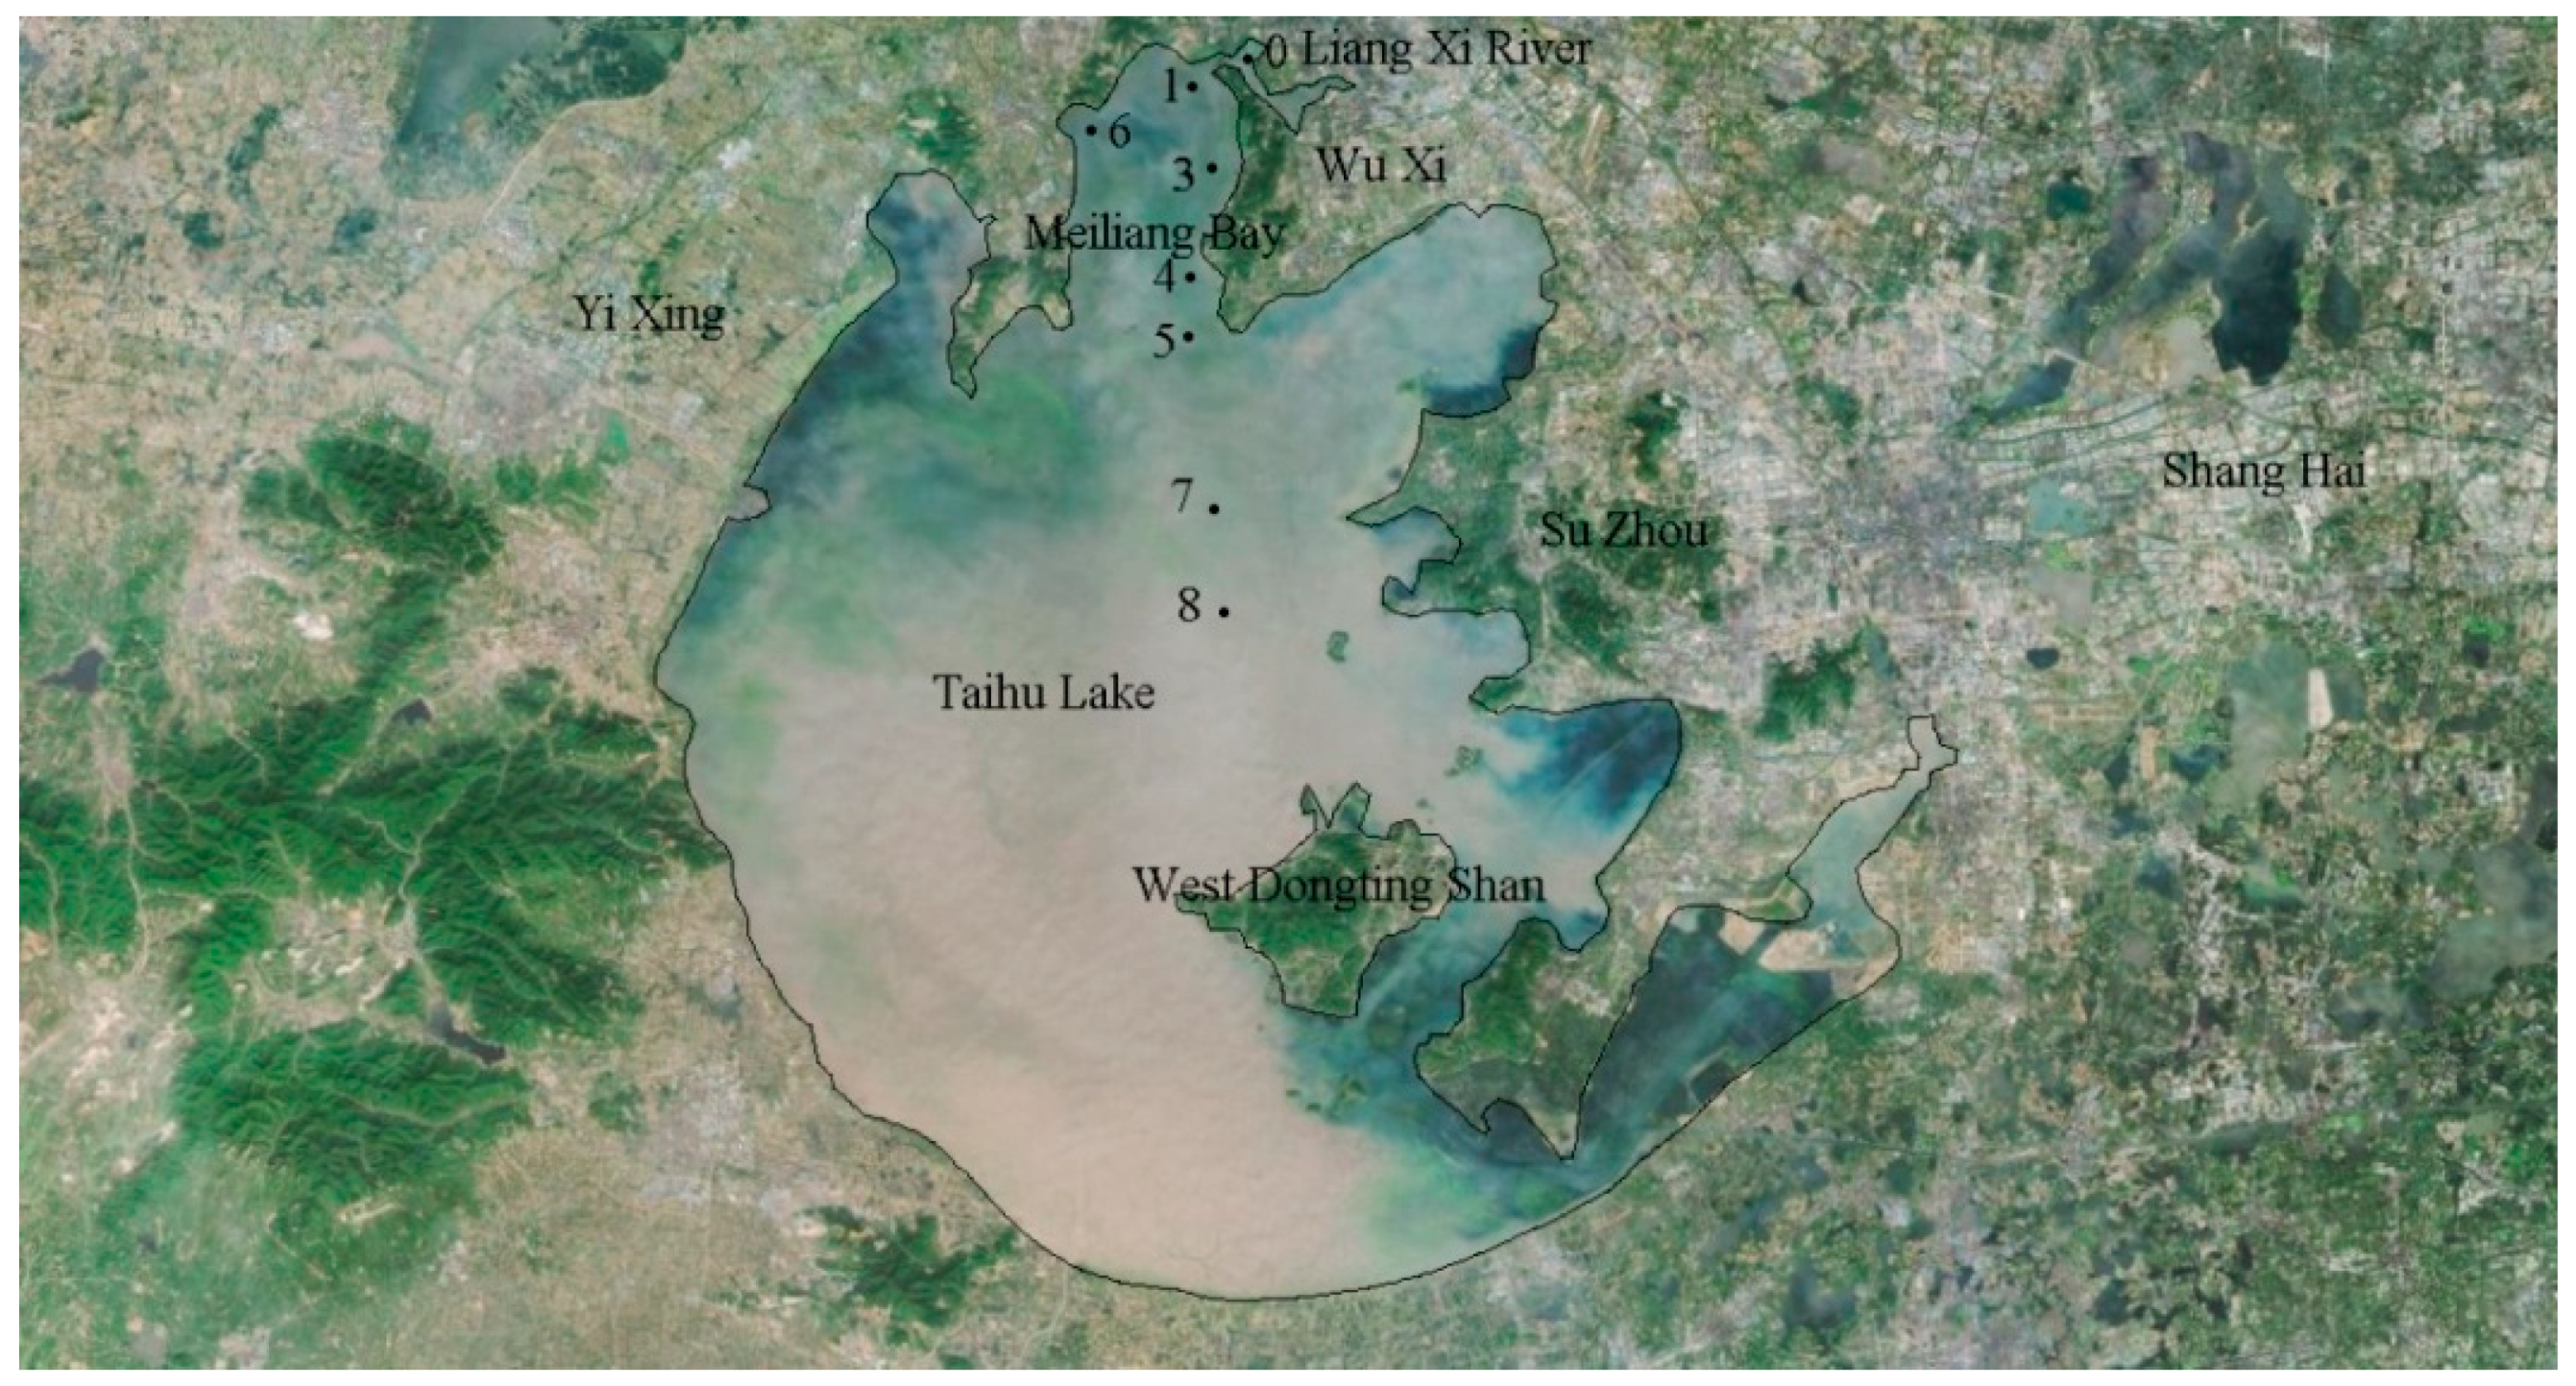
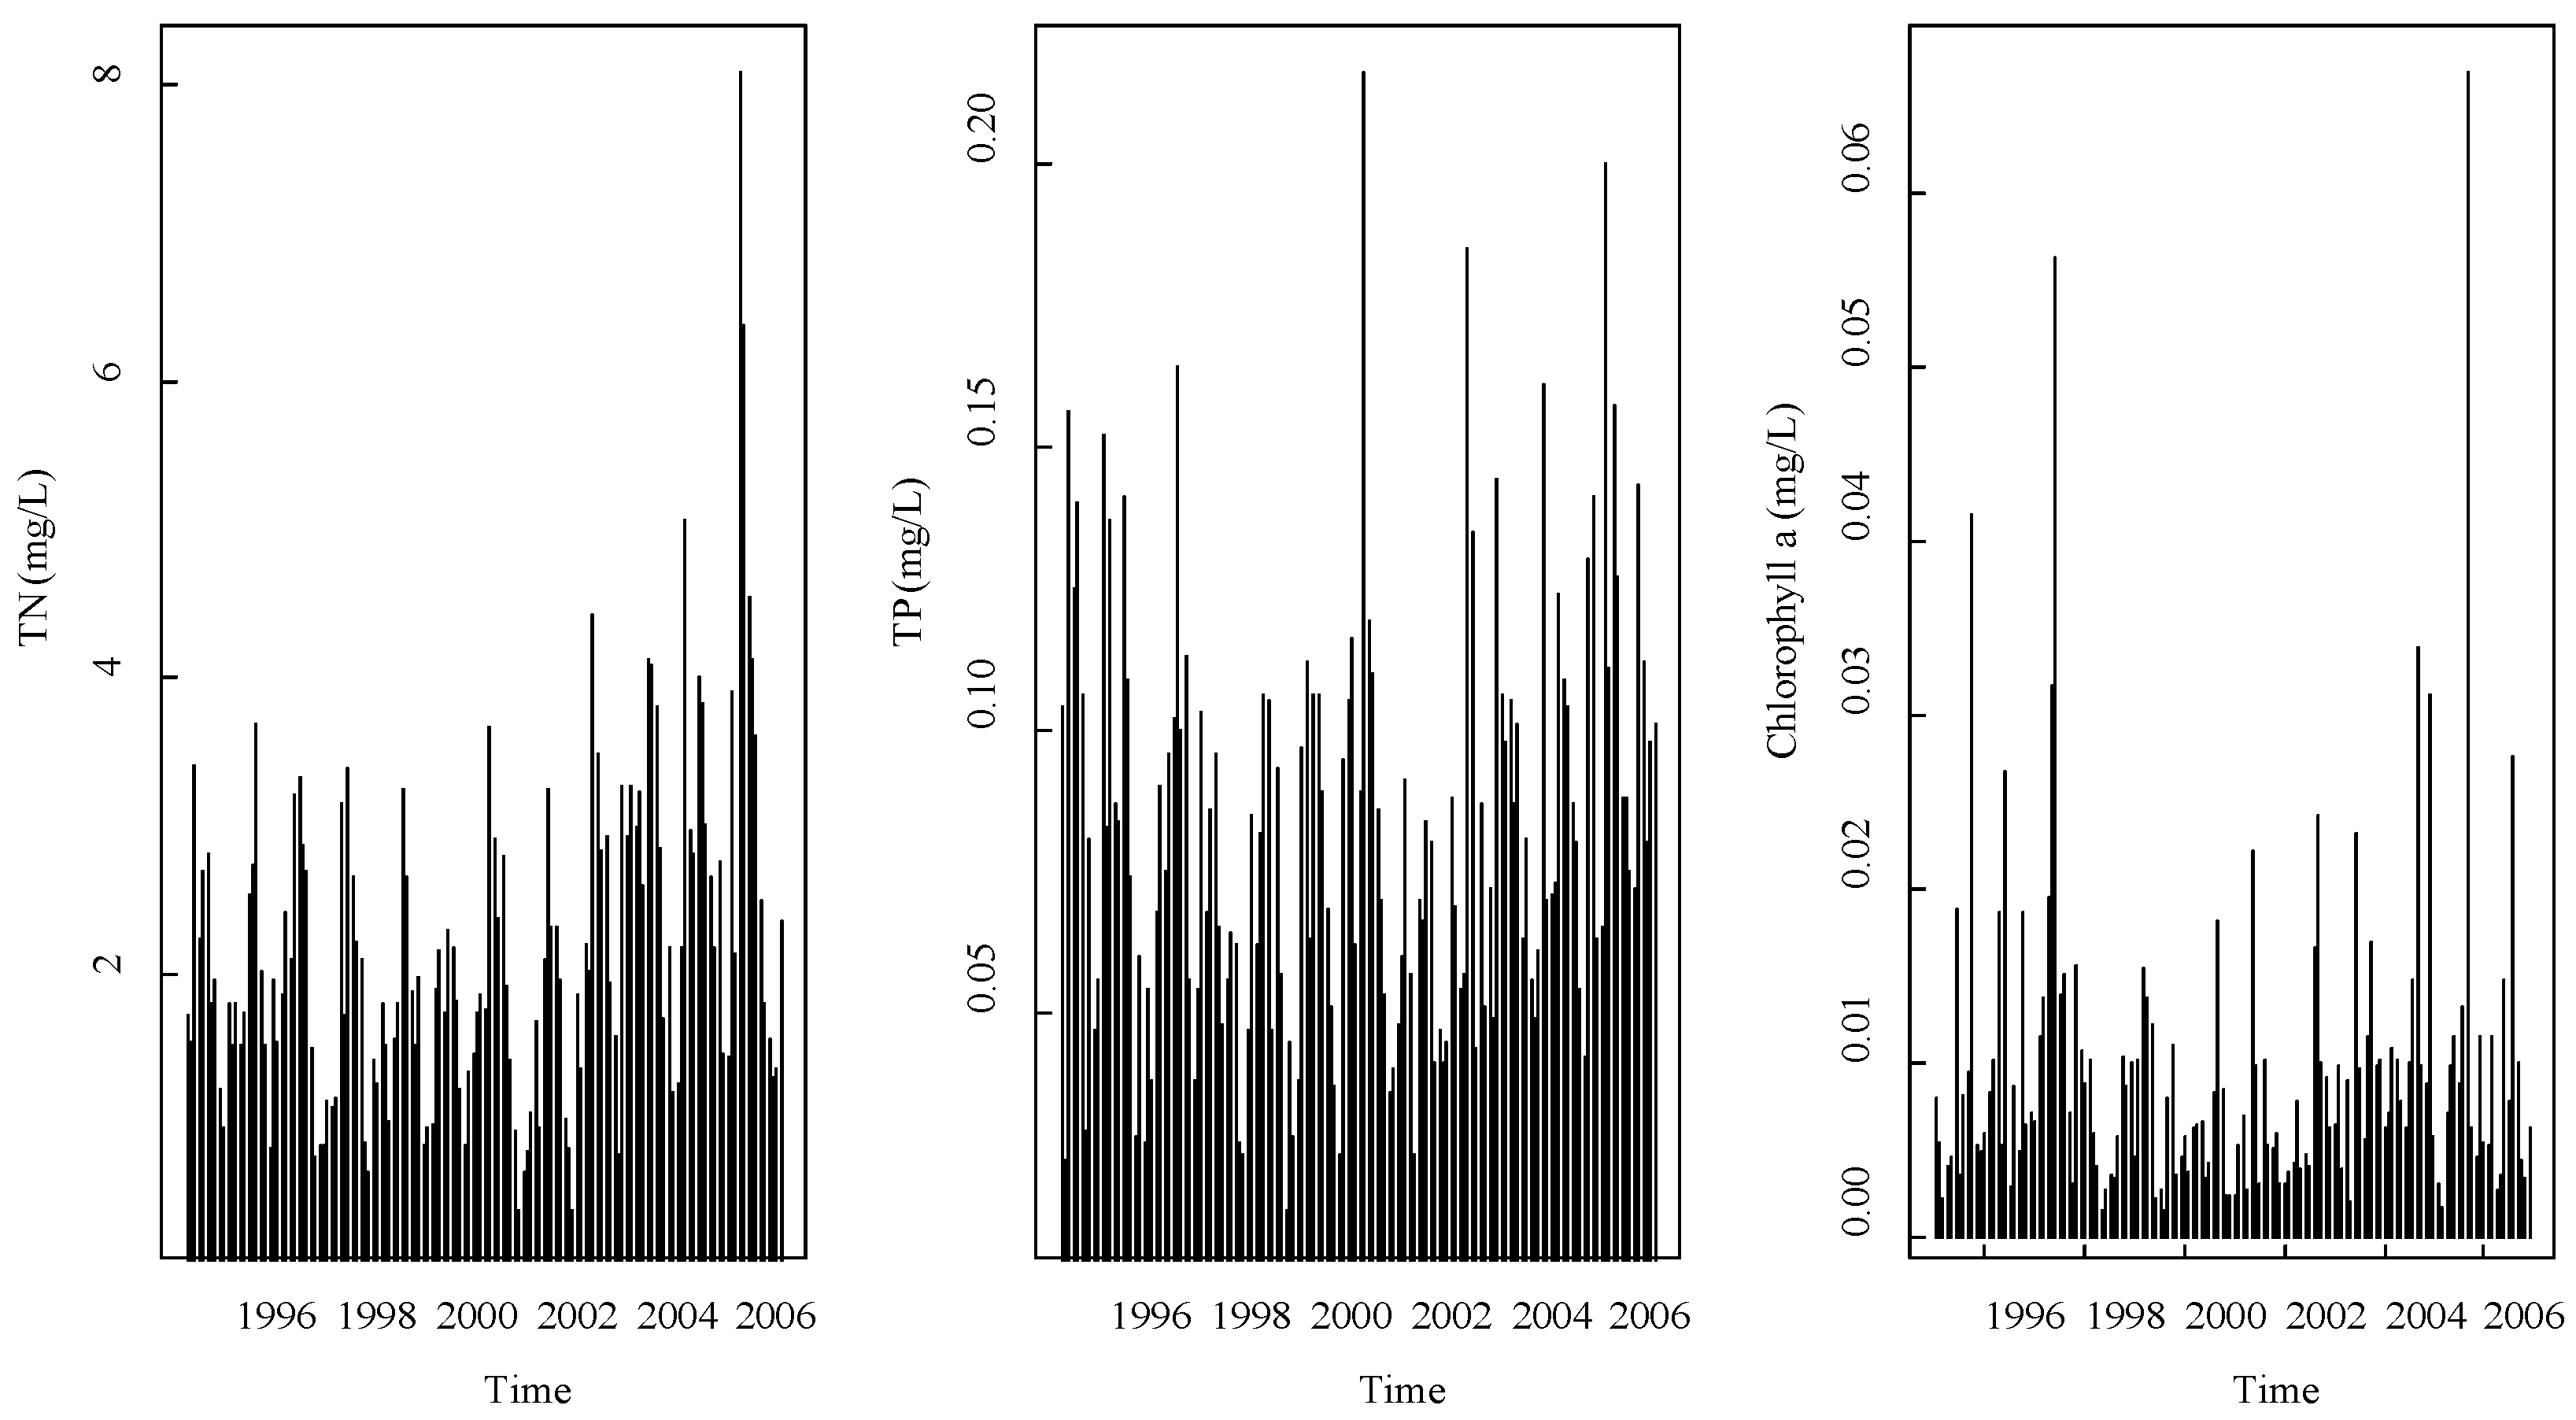
2. Research Region and Data Sources
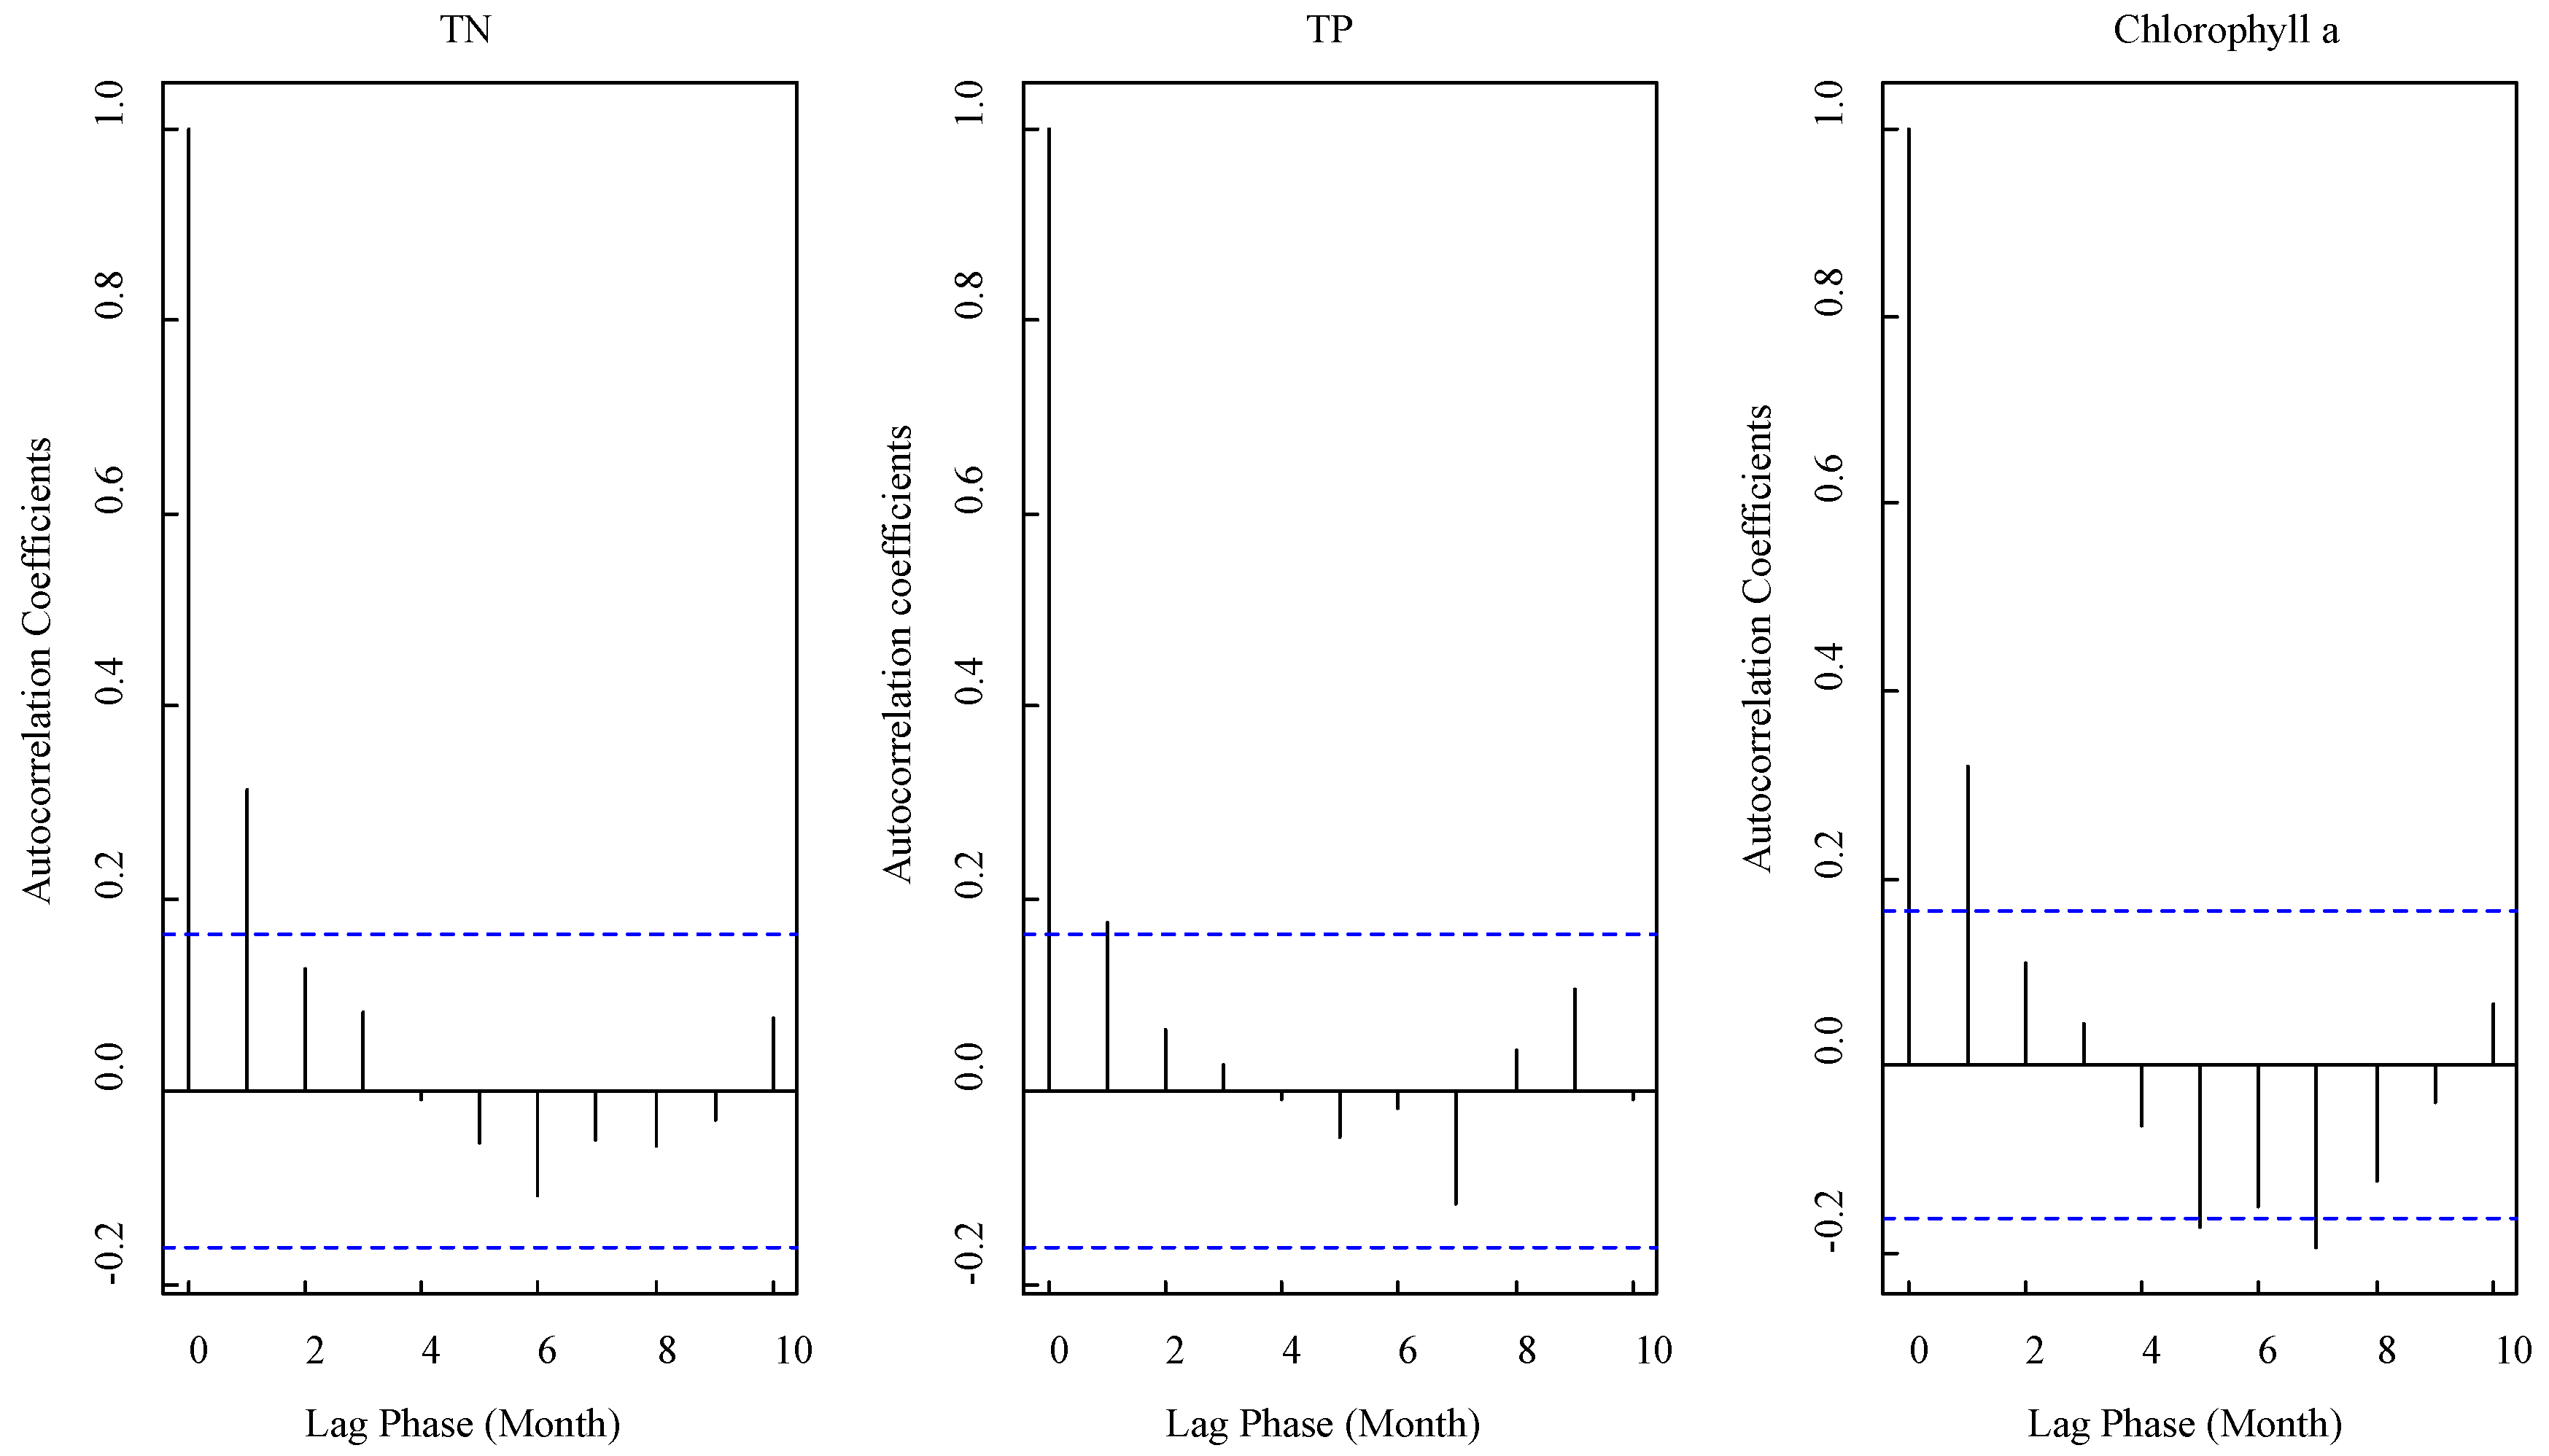
3. Methods
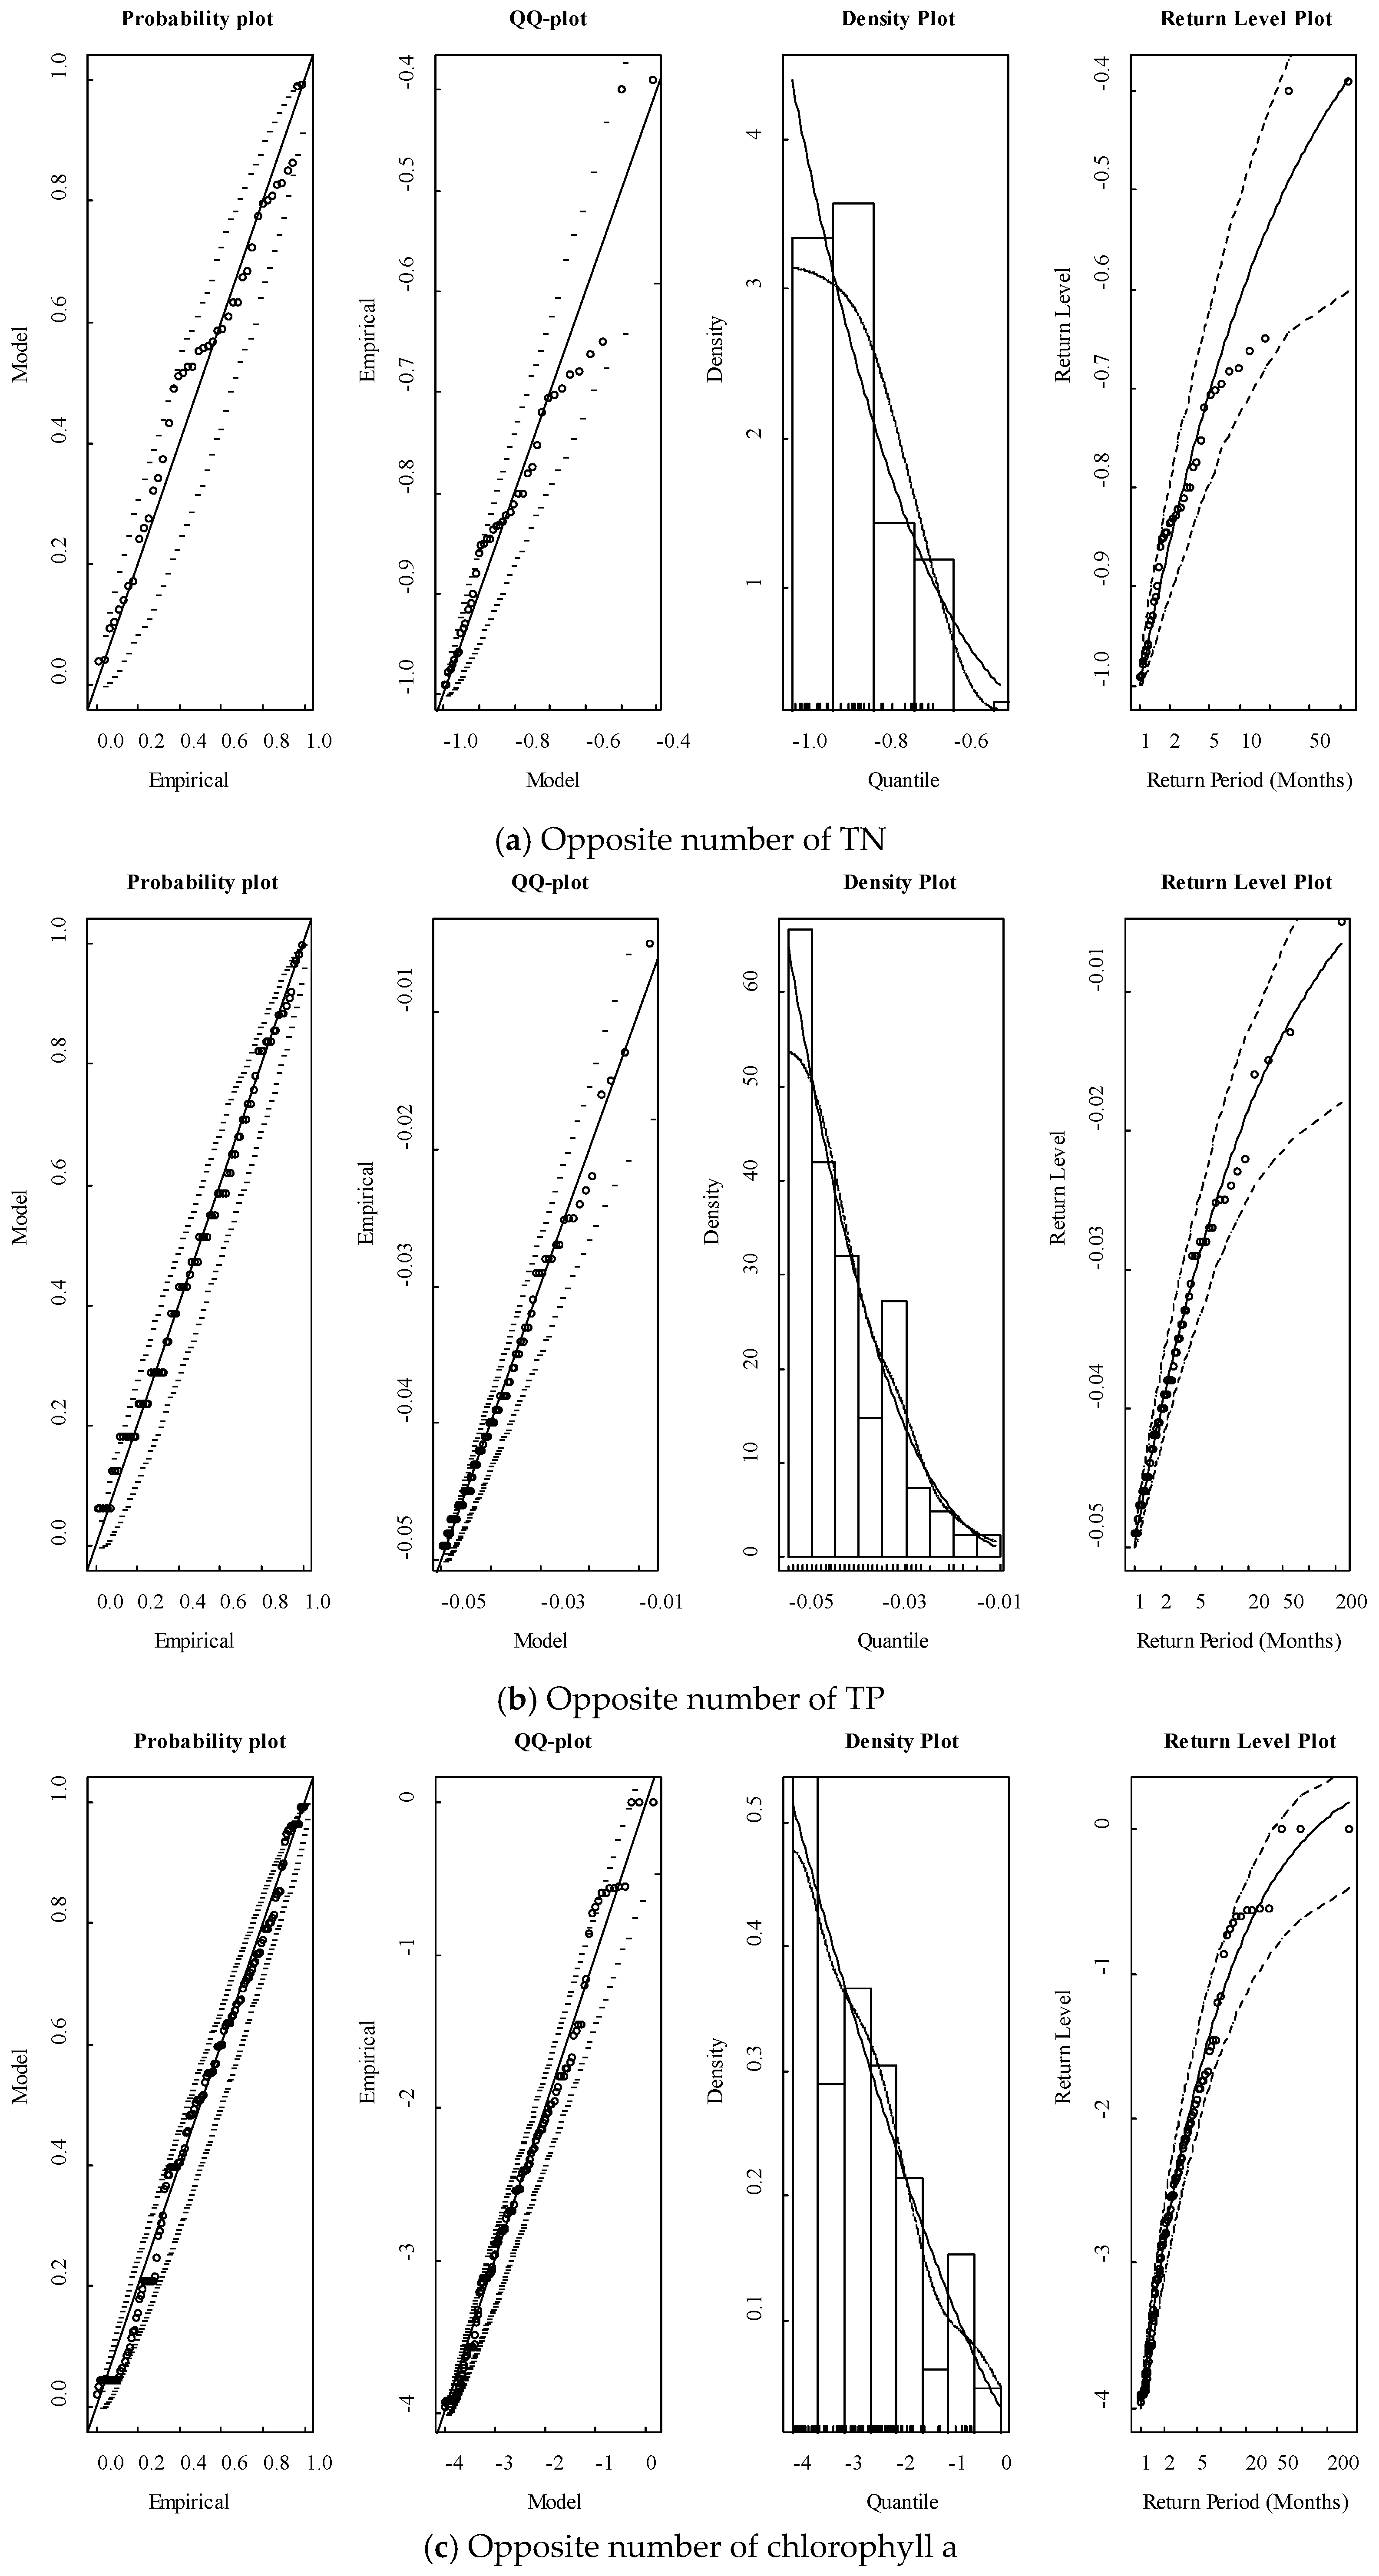
4. Results
5. Discussion
6. Conclusions
Author Contributions
Funding
Conflicts of Interest
References
- United States Environment Protection Agency. Nutrient Criteria Technical Guidance Manual: Lakes and Reservoirs; United States Environment Protection Agency, Office of Water: Washington, DC, USA, 2000; pp. 3–58.
- United States Environment Protection Agency. Ambient Water Quality Criteria Recommendation: Lakes and Reservoirs in Nutrient Ecoregion II; United States Environment Protection Agency, Office of Water: Washington, DC, USA, 2000; pp. 17–126.
- Solheim, A.L. Reference Condition of European Lakes: Indicators and Methods for the Water Framework Directive Assessment of Reference Conditons; Rebecca 07; EU: Brussel, Belgium, 2005; pp. 5–49. [Google Scholar]
- Keller, S.; Maier, P.; Riese, F.; Norra, S.; Holbach, A.; Börsig, N.; Wilhelms, A.; Moldaenke, C.; Zaake, A.; Hinz, S. Hyperspectral Data and Machine Learning for Estimating CDOM, Chlorophyll a, Diatoms, Green Algae and Turbidity. Int. J. Environ. Res. Public Health 2018, 15, 1881. [Google Scholar] [CrossRef] [PubMed]
- Xin, X.; Huang, G.; An, C.; Huang, C.; Weger, H.; Zhao, S.; Zhou, Y.; Rosendahl, S. Insights into the Toxicity of Triclosan to Green Microalga Chlorococcum sp. Using Synchrotron-Based Fourier Transform Infrared Spectromicroscopy: Biophysiological Analyses and Roles of Environmental Factors. Environ. Sci. Technol. 2018, 52, 2295–2306. [Google Scholar] [CrossRef] [PubMed]
- United States Environment Protection Agency. Using Stressor-Response Relationships to Derive Numeric Nutrient Criteria; United States Environment Protection Agency, Office of Water: Washington, DC, USA, 2010; pp. 1–203.
- Salerno, F.; Viviano, G.; Carraro, E.; Manfredi, E.C.; Lami, A.; Musazzi, S.; Marchetto, A.; Guyennon, N.; Tartari, G.; Copetti, D. Total Phosphorus Reference Condition for Subalpine Lakes: A Comparison among Traditional Methods and a New Process-Based Watershed Approach. J. Environ. Manag. 2014, 145, 94–105. [Google Scholar] [CrossRef] [PubMed]
- Zhang, L.B.; Huo, S.L.; Zhou, Y.L.; Tong, Z.H.; Liu, L. Establishing Lake Reference Conditons for Nutrient Criteria Based on System Dynamics. Acta Sci. Circumst. 2011, 31, 1254–1262. [Google Scholar]
- Dodds, W.K.; Carney, E.; Angelo, R.T. Determining Ecoregional Reference Conditions for Nutrients, Secchi Depth and Chlorophyll a in Kansas Lakes and Reservoirs. Lake Reserv. Manag. 2006, 22, 151–159. [Google Scholar] [CrossRef] [Green Version]
- Chen, Q.; Huo, S.L.; Xi, B.D.; Zan, F.Y.; Li, X. Study on Establishing Lake Reference Condition for Nutrient. Ecol. Environ. Sci. 2010, 19, 544–549. [Google Scholar]
- Zheng, B.H.; Xu, Q.J.; Zhou, B.H.; Zhang, L.J. Building Nutrient and Its Response Idications Reference State for Criteria Enaction: On the Case of Lake Taihu, a Typical Shallow Lake in Eastern China. J. Lake Sci. 2009, 21, 21–26. [Google Scholar]
- Cardoso, A.C.; Solimini, A.; Premazzi, G.; Carvalho, L.; Lyche, A.; Rekolainen, S. Phosphorus Reference Concentrations in European Lakes. Hydrobiologia 2007, 584, 3–12. [Google Scholar] [CrossRef]
- Gu, L.; Li, Q.; Hua, Z.; Hong, B. The Improved Mei Model for Forecasting Tp Reference Concentration in Lake Taihu Basin. J. Lake Sci. 2013, 25, 347–351. [Google Scholar]
- Li, X.P.; Chen, X.H.; Dong, X.H.; Dong, Z.; Sun, D.P. Nurient Dynamics over the Past 100 Years and Its Resoration Baseline in Dianshan Lake. Environ. Sci. 2012, 33, 3301–3307. [Google Scholar]
- Andersen, J.H.; Conley, D.J.; Hedal, S. Palaeoecology, Reference Conditions and Classification of Ecological Status: The Eu Water Framework Directive in Practice. Mar. Pollut. Bull. 2004, 49, 283–290. [Google Scholar] [CrossRef] [PubMed]
- Heiskary, S.; Swain, E. Water Quality Reconstruction from Fossil Diatoms: Applications for Trend Assessment, Model Verification, and Development of Nutrient Criteria for Lakes in Minnesota, USA; Minnesota Pollution Control Agency: St. Paul, MN, USA, 2002; pp. 1–85. [Google Scholar]
- Huo, S.L.; Ma, C.Z.; Xi, B.D.; Gao, R.T.; Deng, X.Z.; Jiang, T.T.; He, Z.S.; Su, J.; Wu, F.; Liu, H.L. Lake Ecoregions and Nutrient Criteria Development in China. Ecol. Indic. 2014, 46, 1–10. [Google Scholar] [CrossRef]
- Huo, S.L.; Xi, B.D.; Su, J.; Zan, F.Y.; Chen, Q.; Ji, D.F.; Ma, C.Z. Determining Reference Conditions for TN, TP, SD and Chl-a in Eastern Plain Ecoregion Lakes, China. J. Environ. Sci. 2013, 25, 1001–1006. [Google Scholar] [CrossRef]
- Huo, S.L.; Ma, C.Z.; Xi, B.D.; Tong, Z.H.; He, Z.S.; Su, J.; Wu, F.C. Determining Ecoregional Numeric Nutrient Criteria by Stressor-Response Models in Yungui Ecoregion Lakes, China. Environ. Sci. Pollut. Res. 2014, 21, 8831–8846. [Google Scholar] [CrossRef] [PubMed]
- Huo, S.L.; Xi, B.D.; Ma, C.Z.; Liu, H.L. Stressor–Response Models: A Practical Application for the Development of Lake Nutrient Criteria in China. Environ. Sci. Technol. 2013, 47, 11922–11923. [Google Scholar] [CrossRef] [PubMed]
- Huo, S.L.; Ma, C.Z.; Xi, B.D.; Su, J.; He, Z.S.; Li, X. Establishing Water Quality Reference Conditions for Nutrients, Chlorophyll a and Secchi Depth for 7 Typical Lakes in Arid and Semiarid Ecoregion, China. Environ. Earth Sci. 2015, 73, 4739–4748. [Google Scholar] [CrossRef]
- Haggard, B.E.; Scott, J.T.; Longing, S.D. Sestonic Chlorophyll a Shows Hierarchical Structure and Thresholds with Nutrients across the Red River Basin, USA. J. Environ. Qual. 2013, 42, 437–445. [Google Scholar] [CrossRef] [PubMed]
- Huo, S.L.; Xi, B.D. Determing Nutrient Criteria by Stressor-Reponse Models and Case Study; Science Press: Beijing, China, 2014; pp. 78–93. [Google Scholar]
- Huo, S.L.; Ma, C.Z.; Xi, B.D.; He, Z.S.; Su, J.; Wu, F.C. Nonparametric Approaches for Estimating Regional Lake Nutrient Thresholds. Ecol. Indic. 2015, 58, 225–234. [Google Scholar] [CrossRef]
- Lversen, G.R.; Gergen, M. Statistics: The Conceptual Approach; Springer: New York, NY, USA, 1997; pp. 177–247. [Google Scholar]
- Hua, Z.L.; Wang, L. A New Method for Estimation the Lake Quality Reference Condition. Environ. Sci. 2013, 34, 2134–2138. [Google Scholar]
- Hua, Z.L.; Wang, L.; Gu, L.; Chu, K.J. Estimation of the Lake Quality Reference Conditon Based on the Threshold Extreme Theory. China. Environ. Sci. 2014, 34, 3215–3222. [Google Scholar]
- Coles, S. An Introduction to Statistical Modeling of Extreme Values; Springer: London, UK, 2001; pp. 92–104. [Google Scholar]
- Qin, B.Q. Lake Taihu, China—Dynamics and Environmental Change; Springer: London, UK, 2008; pp. 3–52. [Google Scholar]
- Qin, B.Q.; Hu, C.H. Chinese Ecosystem Positioning Observation and Research Data Sets: Taihu Lake; China Agriculture Press: Beijing, China, 2010; pp. 147–271. [Google Scholar]
- Simith, L.R. Markov Chain Models for Threshold Exceedances. Biometrika 1997, 84, 249–268. [Google Scholar] [CrossRef]
- Shi, J.D. Practical Extremum Statistics Methods; Science and Technology; Tianjin Science and Technology Press: Tianjin, China, 2006; pp. 152–169. [Google Scholar]
- Wang, L.; Hua, Z.; Gu, L.; Chu, K. Estimating the Reference Nutrient Levels of the Shallow Lakes in the East China Using a Combination with Several Non-Parametric Methods. Adv. Water Sci. 2014, 25, 724–730. [Google Scholar]
- Wang, L.; Hua, Z.L. Estimation Precision in Frequency Analysis Process for Calculating the Reference Conditions of Lakes. Asian. J. Ecotoxicol. 2015, 10, 245–251. [Google Scholar]
- Nanjing Institute of Geography and Limnology, Chinese Academy of Sciences. A Preliminary Report of Comprehensive Investigation of Taihu Lake; Science Press: Beijing, China, 1965; p. 37. [Google Scholar]


| Total Nitrogen (mg/L) | Total Phosphorus (mg/L) | Chlorophyll a (μg/L) | |
|---|---|---|---|
| Mean Value | 4.01 | 0.16 | 24.78 |
| Standard Deviation | 2.81 | 0.14 | 34.57 |
| Kurtosis | 2.85 | 49.19 | 53.28 |
| Skew | 1.54 | 5.06 | 5.40 |
| Minimum Value | 0.39 | 0.00 | 0.00 |
| Maximum Value | 21.93 | 2.13 | 521.73 |
| POT Model [27] | Extreme–Markov Model | ||||||
|---|---|---|---|---|---|---|---|
| Variables | Effective Observations | σ(se) | ξ(se) | Effective Observations | σ(se) | ξ(se) | α(se) |
| TN | 77 | 0.34(0.093) | −0.48(0.21) | 129 | 0.23(0.044) | −0.27(0.12) | 0.78(0.046) |
| TP | 97 | 0.028(0.002) | −0.58(0.051) | 162 | 0.015(0.001) | −0.17(0.033) | 0.88(0.032) |
| Chlorophyll a | 127 | 3.27(0.53) | −0.82(0.15) | 278 | 1.94(0.22) | −0.43(0.08) | 0.17(0.004) |
| Variables | POT Model [27] | GEV Model [26] | Extreme–Markov Model | |||
|---|---|---|---|---|---|---|
| 25% Quantiles | 95% Confidences | 25% Quantiles | 95% Confidences | 25% Quantiles | 95% Confidences | |
| TN (mg/L) | 0.66 | 0.55–0.77 | 0.71 | 0.58–0.84 | 0.69 | 0.62–0.76 |
| TP (mg/L) | 0.023 | 0.022–0.025 | 0.025 | 0.018–0.033 | 0.029 | 0.028–0.030 |
| Chlorophyll a (μg/L) | 1.27 | 0.84–1.70 | 1.81 | 1.32–2.33 | 1.89 | 1.55–2.23 |
| Variables | Methods | Reference Values (95% Confidence Intervals) |
|---|---|---|
| TN (mg/L) | Frequency Analysis [11] | 0.60 |
| Seasonal Decomposition [33] | 0.78 (0.53–0.83) | |
| TP (mg/L) | Frequency Analysis [11], MEI [13] | 0.030 |
| Seasonal Decomposition [33] | 0.030 (0.025–0.046) | |
| Chlorophyll a (μg/L) | Frequency Analysis [11] | 4 |
| Seasonal Decomposition [33] | 2.63 (1.86–2.65) |
© 2018 by the authors. Licensee MDPI, Basel, Switzerland. This article is an open access article distributed under the terms and conditions of the Creative Commons Attribution (CC BY) license (http://creativecommons.org/licenses/by/4.0/).
Share and Cite
Wang, L.; Wang, Y.; Cheng, H.; Cheng, J. Estimation of the Nutrient and Chlorophyll a Reference Conditions in Taihu Lake Based on A New Method with Extreme–Markov Theory. Int. J. Environ. Res. Public Health 2018, 15, 2372. https://0-doi-org.brum.beds.ac.uk/10.3390/ijerph15112372
Wang L, Wang Y, Cheng H, Cheng J. Estimation of the Nutrient and Chlorophyll a Reference Conditions in Taihu Lake Based on A New Method with Extreme–Markov Theory. International Journal of Environmental Research and Public Health. 2018; 15(11):2372. https://0-doi-org.brum.beds.ac.uk/10.3390/ijerph15112372
Chicago/Turabian StyleWang, Liang, Yulin Wang, Haomiao Cheng, and Jilin Cheng. 2018. "Estimation of the Nutrient and Chlorophyll a Reference Conditions in Taihu Lake Based on A New Method with Extreme–Markov Theory" International Journal of Environmental Research and Public Health 15, no. 11: 2372. https://0-doi-org.brum.beds.ac.uk/10.3390/ijerph15112372