Article

Arsenic and Heavy Metal Accumulation and Risk Assessment in Soils around Mining Areas: The Urad Houqi Area in Arid Northwest China as an Example

1
State Key Laboratory of Urban and Regional Ecology, Research Center for Eco-Environmental Sciences, Chinese Academy of Sciences, Beijing 100085, China
2
Inner Mongolia Institute of Geological Environmental Monitoring, Hohhot 010020, China
3
Inner Mongolia Autonomous Region Metallurgy Research Institute, Hohhot 010010, China
4
Key Laboratory of Ecosystem Network Observation and Modeling, Institute of Geographic Sciences and Natural Resources Research, Chinese Academy of Sciences, Beijing 100101, China
5
Institute of Loess Plateau, Shanxi University, Taiyuan 030006, China
*
Author to whom correspondence should be addressed.
Int. J. Environ. Res. Public Health 2018, 15(11), 2410; https://0-doi-org.brum.beds.ac.uk/10.3390/ijerph15112410
Submission received: 1 January 1970 / Revised: 18 October 2018 / Accepted: 27 October 2018 / Published: 30 October 2018
(This article belongs to the Collection Environmental Risk Assessment)

Abstract

:
Mining activities make important contributions to economic growth, but they can also produce massive amounts of solid waste, such as tailings and metal accumulations. Taking the Urad Houqi mining area in Inner Mongolia as the study area, this study systematically assessed the contamination risk of arsenic and heavy metals in the soils of the study area and explored the contamination characteristics in a key polymetallic mining area. For the whole study area, based on the Nemerow comprehensive pollution method, almost half of the investigated sites were contaminated, and the most contaminated site was Urad Houqi Qianzhen Mineral Concentration Co., Ltd. (Bayannaoer, China), a cooperation between the lead and zinc mining industry. The assessment results indicated that Cd and As were the elements of greatest concern, followed by Pb, Cr and Hg. Particularly, for the typical Dongshengmiao mining area, when compared with the GB15618-1995 standard values, As, Zn and Cd posed the most serious contamination threat, while Cr and Ni exhibited clean conditions. In addition, the vertical distribution maps demonstrated that the contents of arsenic and metals in some soil profiles were correlated with sampling depth. Therefore, arsenic and heavy metals pose high threat to soil ecosystems in this area, there is encouragement for some control and remediation measures to be taken into effect.

1. Introduction

The exploitation of mineral resources has great negative impacts not only on the surrounding soils but also on the total environment, and one of the most distinct impacts is metal contamination [1,2,3]. Anthropogenic activities, i.e., natural metal mineral mining and metal substance production, are the dominant sources of metal contamination in the environment, including soils [4,5,6,7], which could lead to a higher metal content in soils around the metallogenic belt, and the impacts of quartzite on soil metal contents are larger than those of carbonate rock [8].
During exploitation, large quantities of wastewater, waste gases and solid wastes are produced by mining activities, which are the main pathways of entry of metals into the surrounding soils [9,10,11]. A large number of metals are contained in the waste rock of tailing products, and they cannot be managed and recycled [12,13]. When the surface wastewater seeps into the ground, metals remain in the aeration zones and even reach the satiety zones, which could influence soil and groundwater ecosystems and induce plant growth inhibition [12,14,15]. Developed regions, such as North America and Europe, have placed high emphasis on metal pollution caused by the mining and smelting industries, and the mechanisms and remediation methods of metal pollution have been studied in depth [16,17]. The revegetation rate of damaged land in mining areas has reached 75% in developed regions and only 13.3% in China [18]. However, despite the severe situation in China, locals still overlook the metal contamination and remediation of surrounding soils in mining areas.
Therefore, the assessment of soil metal contamination in mining areas is essential and also the foundation of soil remediation. Many investigators have carried out a large number of studies on soil metal contamination. There are some commonly used methods for assessing soil metal pollution, such as the single factor index method, synthetic index method, geoaccumulation index method, and fuzzy mathematical method [4,19,20,21]. However, most of these methods have certain limitations. We must identify an appropriate method or conduct an assessment via multiple methods according to actual conditions. Usually, the background value of a local soil environment or the standard for soil environmental quality are used as references to ensure the reasonability of an assessment.
The study area of Urad Houqi is in the Inner Mongolia Autonomous region in arid northwest China. Metal contamination in soils is of concern in the Inner Mongolia Autonomous region because it is one of most important mineral and mining bases in China, and it is one of the 14 key prevention and control provinces in China. The Urad Houqi area belongs to the city of Bayan Nur, which is a key nonferrous metal mining region in the Inner Mongolia Autonomous area. The metal accumulation characteristics in soil of Bayan Nur are distinct. Zhang et al. demonstrated that metal contents in soil and underground water increased each year due to the exploitation of metal mining [22]. The results of another study showed that the concentrations of toxic metals (Co, Ni, Fe, Mn, Ba, Cu, Cr, Pb, and Zn) in the topsoil of the Hetao Plain had significant positive correlations with each other, and their common source was the mining area in Langshan and the industrial production area in the city [22]. Moreover, areas where local lesions were concentrated usually overlapped areas with high levels of metals. The contents of Pb and As in the soil and underground water of the Hetao Plain were much higher than their respective background values owing to the exploitation of mineral resources [23].
Therefore, in this study, we took a mining area (Urad Houqi) as an example using multiple methods to evaluate the risk of arsenic and heavy metal contamination in soils. The objectives of this study are (1) to conduct an arsenic and heavy metal contamination assessment in soils and (2) to explore the characteristics of arsenic and heavy metal contamination in a key polymetallic mining area.

2. Materials and Methods

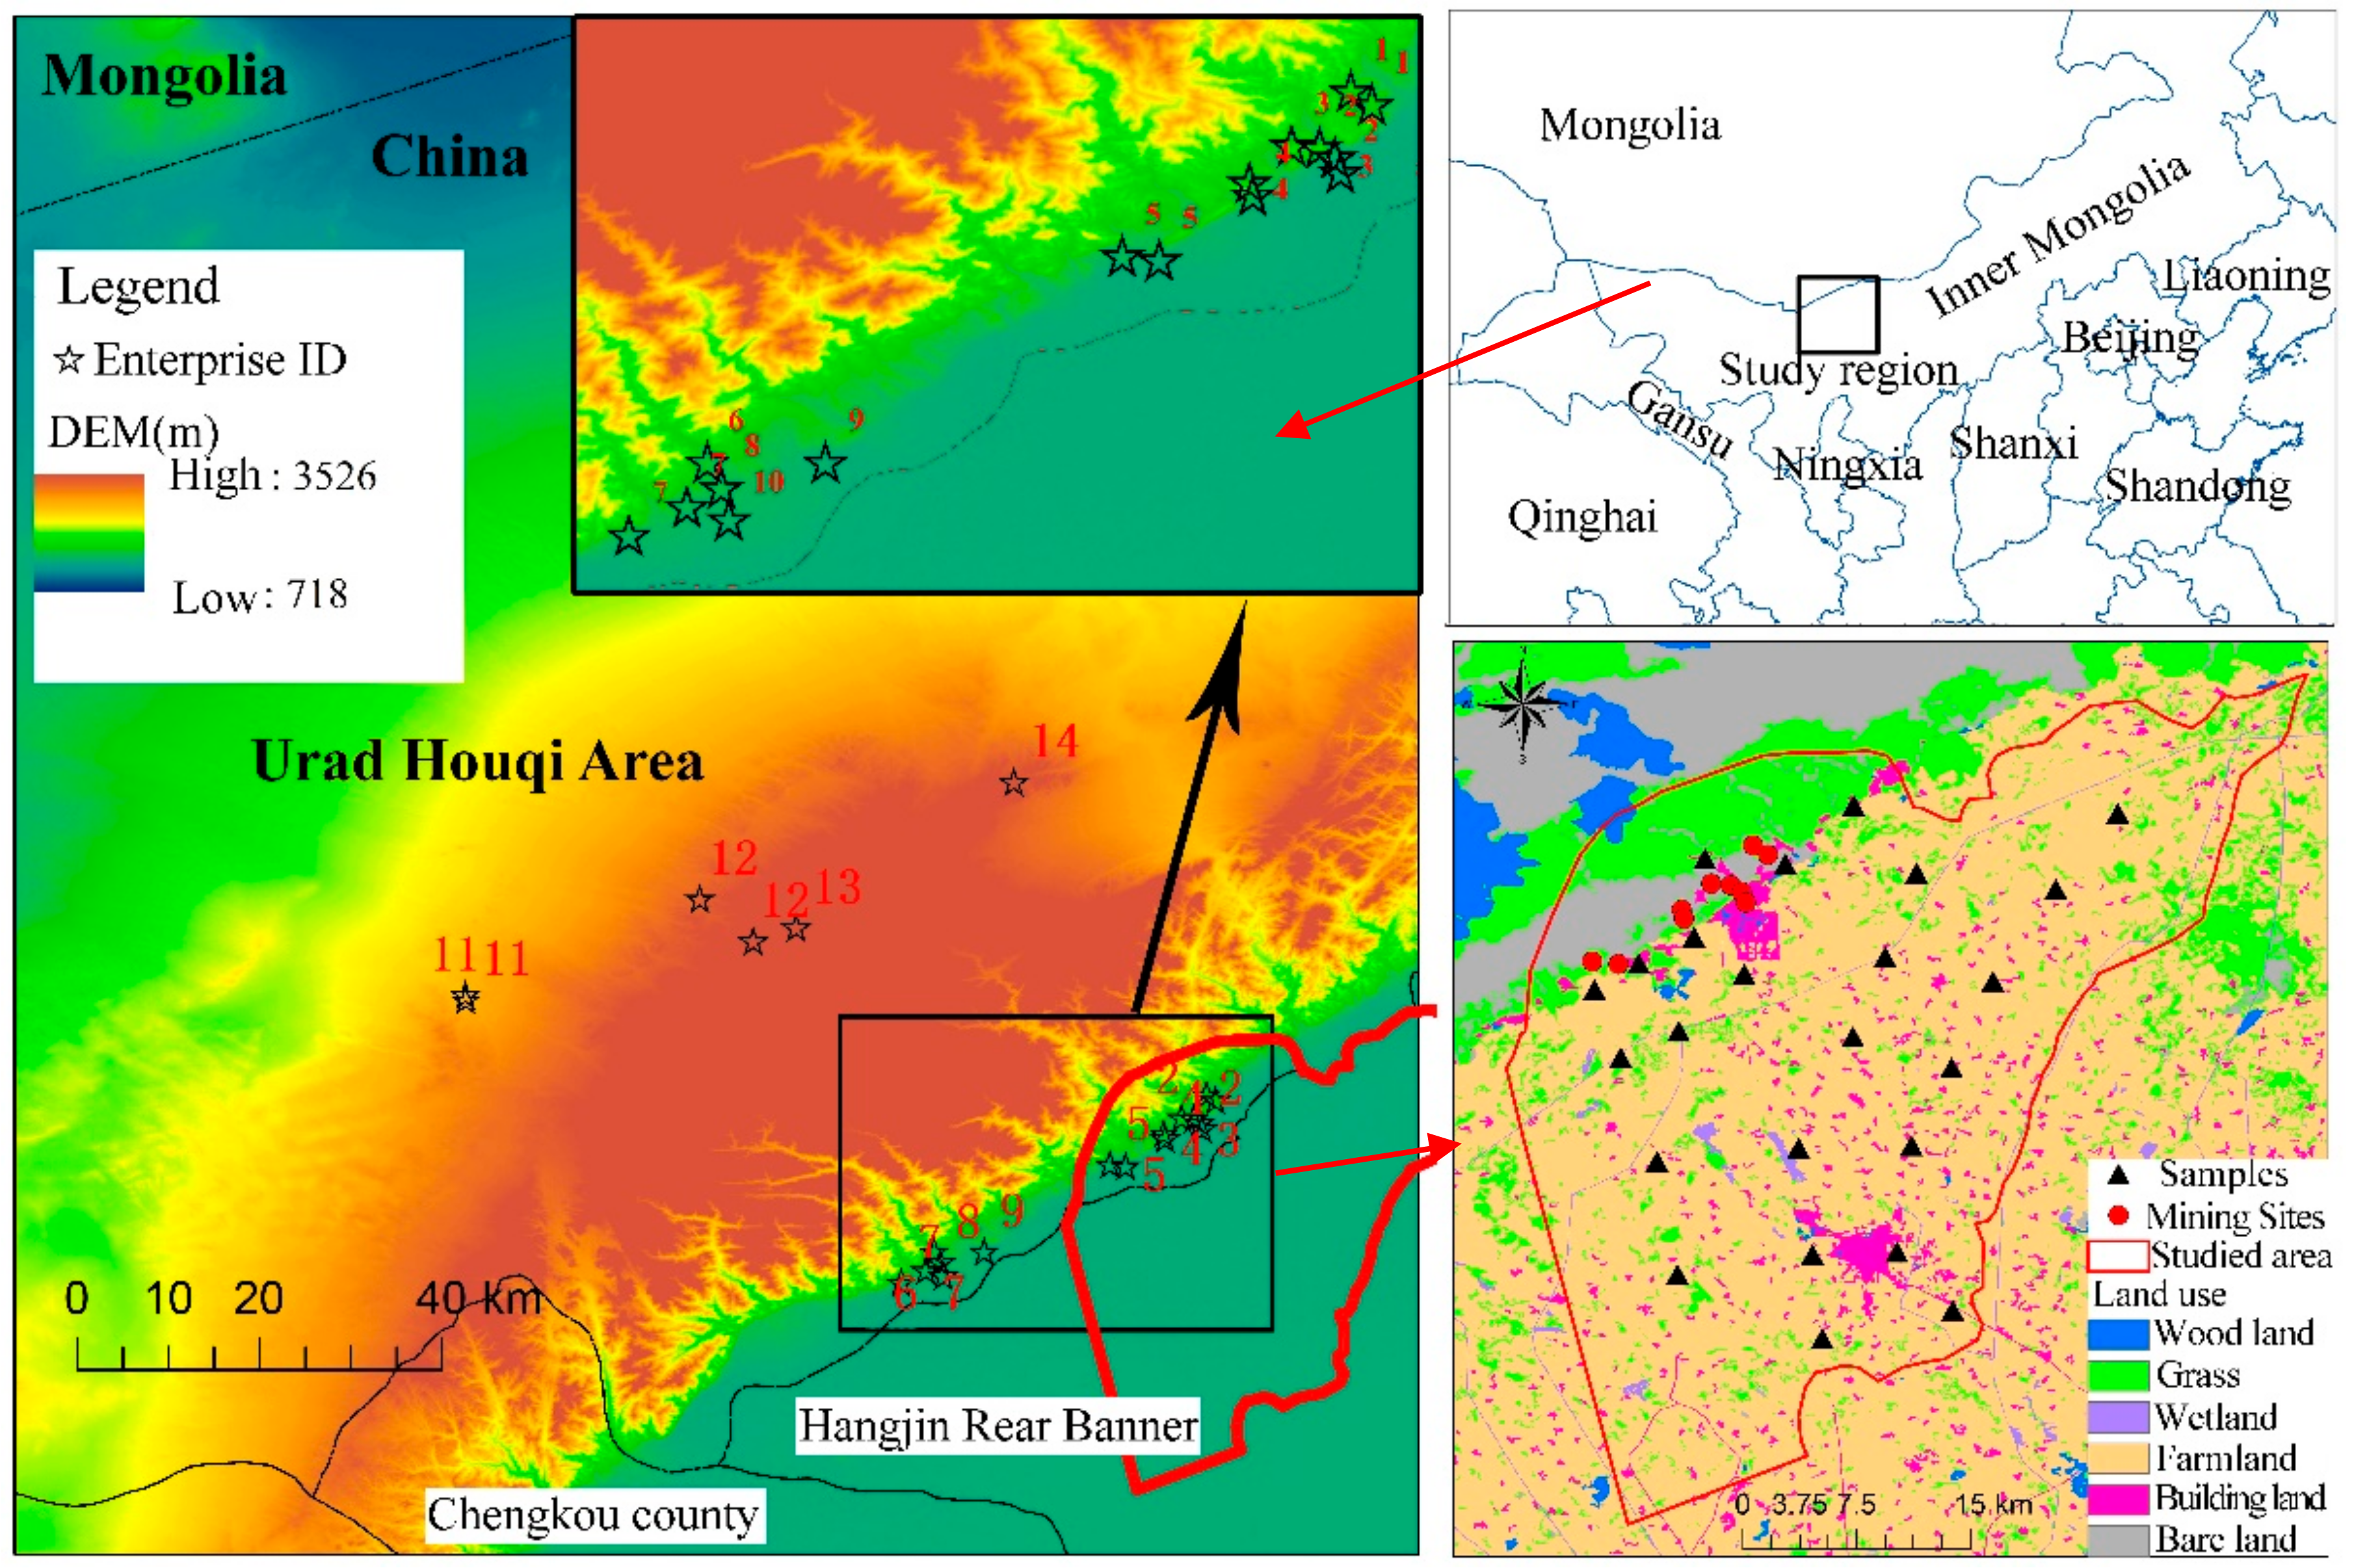
2.1. Case Study Area

The Urad Houqi area, which has a vast territory and various topographies, is located in northwest Inner Mongolia. There are various mining industries in the study area, including lead, copper, zinc, and sulfur mines. In the central part, there is a large amount of nonferrous metal mineral resources. In addition, a polymetallic metallogenic belt is located in the northern part of the study area, where nonferrous metal mineral resources exist in rich reserves (e.g., copper, zinc and iron sulfide mineral resources) and vary in type. Nonferrous metal mining is an important economic pillar industry in this region.
There are 14 key enterprises investigated in the study area, including 10 metal mining enterprises, two smelting enterprises and two chemical manufacturing enterprises. Among them, there are nine still in production, four enterprises that have stopped production, while the remaining one has moved to another location. More details on these enterprises can be found in Table S1. Most of the enterprises are near sensitive lands, which comprise agricultural land, grassland and residential areas.

2.2. Soil Sampling and Chemical Analysis

In this study, we set 14 sampling sites, consistent with the 14 investigated enterprises. Nine to twelve soil samples were collected from each site, including background and contaminated samples. Each sample was composed by five sub-samples that were collected from the center and four corners of an area of 50 × 50 m2. In total, 202 samples were collected from all sites, and 26 samples were collected to study the characteristics of Dongshengmiao mining area. Each background soil was collected from the earthwork stacking point formed before the enterprise was built. Each sample is analyzed separately. The location of the study area and investigated enterprises (sites) were shown in Figure 1. For the sites in plain areas, at least two samples were collected along the four cardinal directions of the producing tracts. For sites in mountainous areas, at least two samples were collected along three uniform angle directions of the producing tracts. The surface soil samples (0–20 cm) were collected from the sites. In addition, in order to study the vertical distribution and migration of arsenic and metals in soils of Dongshengmiao mining area, seven profile sampling sites were set in waste stacking location and tailing reservoir where arsenic and metals were easily to accumulate and transport downward to pose threat to the groundwater. Four-layer samples were collected from each profile sample (0–20 cm, 20–40 cm, 40–60 cm, and 60–100 cm layers). Approximately 1 kg of soil was collected from each layer.
The samples were preserved in sealed valve bags before they were dried by the vacuum freeze-drying method for 24 h. Then, they were crushed to pass through a 75 μm nylon mesh sieve. For the determination of arsenic and heavy metals, 0.5 g soil samples were weighed, placed into PVC digestion vessels, and then digested using 10 mL mixed-acid of HNO3 (Guaranteed Reagent, Tianjin Fenchuan Chemical Regent Technologies Co., Ltd., Tianjin, China), HClO4 (Guaranteed Reagent, Tianjin Zhengcheng Chemical Products Co., Ltd., Tianjin, China), HCl (Guaranteed Reagent, Tianjin Fenchuan Chemical Regent Technologies Co., Ltd., Tianjin, China) and HF (Guaranteed Reagent, Tianjin Fenchuan Chemical Regent Technologies Co., Ltd., Tianjin, China). Each analytical sample weight was between 0.10~2.00 g according to the content of target element. The digestion solution was diluted with 2% HNO3 to a final volume of 50 mL. The concentrations of Cr, Zn, Pb, Cu, Ni, and Cd in the soil samples were determined by inductively coupled plasma mass spectrometry (ICP-MS, Agilent 8800, Agilent Technologies Inc, Foster City, CA, USA). The concentrations of As and Hg were determined by atomic fluorescence spectrometer (AFS-2100, Beijing HaiGuang Instrument Ltd, Beijing, China). The quality control was assured by the analysis of duplicate samples and certified reference materials (GSS 13 and 17, purchased from the General Research Institute for Nonferrous Metals). According to the measurement of repeated samples and reference materials, the relative standard deviation (RSD) was below 3.6% for Cr, Zn, Pb, Cu, Ni, and Cd, and 7.3% for As and Hg, respectively. The recovery of reference materials was 84.4–125.7%.

2.3. Soil Arsenic and Heavy Metal Contamination Evaluation Standards and Methods

2.3.1. Evaluation Factors

According to the soil environmental quality standard of China (GB15618-1995) and the technical specification for soil environmental monitoring (HJ166-2004), when combining the results of the experimental analysis, we selected mercury (Hg), arsenic (As), lead (Pb), chromium (Cr) and cadmium (Cd) as the evaluation factors. The reason is that they have been designated by the local government as key pollutants for prevention and control, as they are mainly derived from the non-ferrous metal mining and smelting industries in this region. Also, these substances of interest were selected because of their implications for human health based on toxicological and epidemiological data [24,25].

2.3.2. Evaluation Methods

In this paper, we referred to the soil environmental quality standard of China (GB15618-1995) and the technical specification for soil environmental monitoring (HJ166-2004) to conduct the soil environmental quality assessment.
(1)
Exceeding the standard rate
Exceeding the standard rate of element i (Ri) was defined by the ratio of the number of samples exceeding the secondary guideline value in the soil environmental quality standard of China (GB15618-1995) (Si) to the total sample size (S) (Equation (1)). As a statistical indicator, the exceeding rates of the elements can be used to identify the main elements of contamination. The larger Ri is, the more serious the contamination of element i:
R i = S i S   ×   100 %
where Ri represents the exceeding standard rate of element i, Si represents the sample size of element i exceeding the secondary guideline value, and S represents the total sample size of element i.
(2)
Single factor pollution index method
The single factor pollution index method is a typical and proven contamination assessment method. It is an index that reflects the influence of a single contaminant on soil. Its calculation is, as shown in Equation (2) [26]:
P i = C i G i  
where Pi represents the single factor pollution index of element i, Ci represents the content of element i in soils, and Gi represents the guideline value of element i in soils.
(3)
Nemerow comprehensive pollution index method
Nemerow comprehensive pollution index method is one of the most commonly used comprehensive assessment methods in soil metal contamination assessment [27]. This method was developed based on single pollution index. It allows the assessment of the overall degree of pollution in soils and includes the contents of all analyzed elements. Therefore, it is a comprehensive index reflecting the influences of multiple contaminants on the soil environment, as shown in Equations (3) and (4) [28]:
P N =   P ¯ 2 + P 2 m a x 2  
P ¯ =   1 n i = 1 n P i  
where PN represents the Nemerow comprehensive pollution index, Pi represents the single factor pollution index of element i, Pmax represents the maximum value of the single factor pollution index, and P ¯ represents the average value of the single factor pollution index.

2.3.3. Evaluation Standard and Statistics Analysis

In this study, the Grade II values of GB15618-1995 were compared with the measured concentrations of metals in soils to conduct the evaluation, which are listed in Table 1. The grading standard for soil pollution is listed in Table 2.
Statistics analysis was carried out using SPSS 20.0 (IBM SPSS, Chicago, IL, USA), including statistical description (skewness, kurtosis, and standard deviation) and Spearman correlation analysis. The former was employed for examining the statistical distribution and central tendency of the data. Spearman correlation analysis was applied to calculate correlations between the heavy metal contents.

3. Results and Discussion

3.1. Soil Arsenic and Heavy Metal Pollution in Different Mining Enterprises

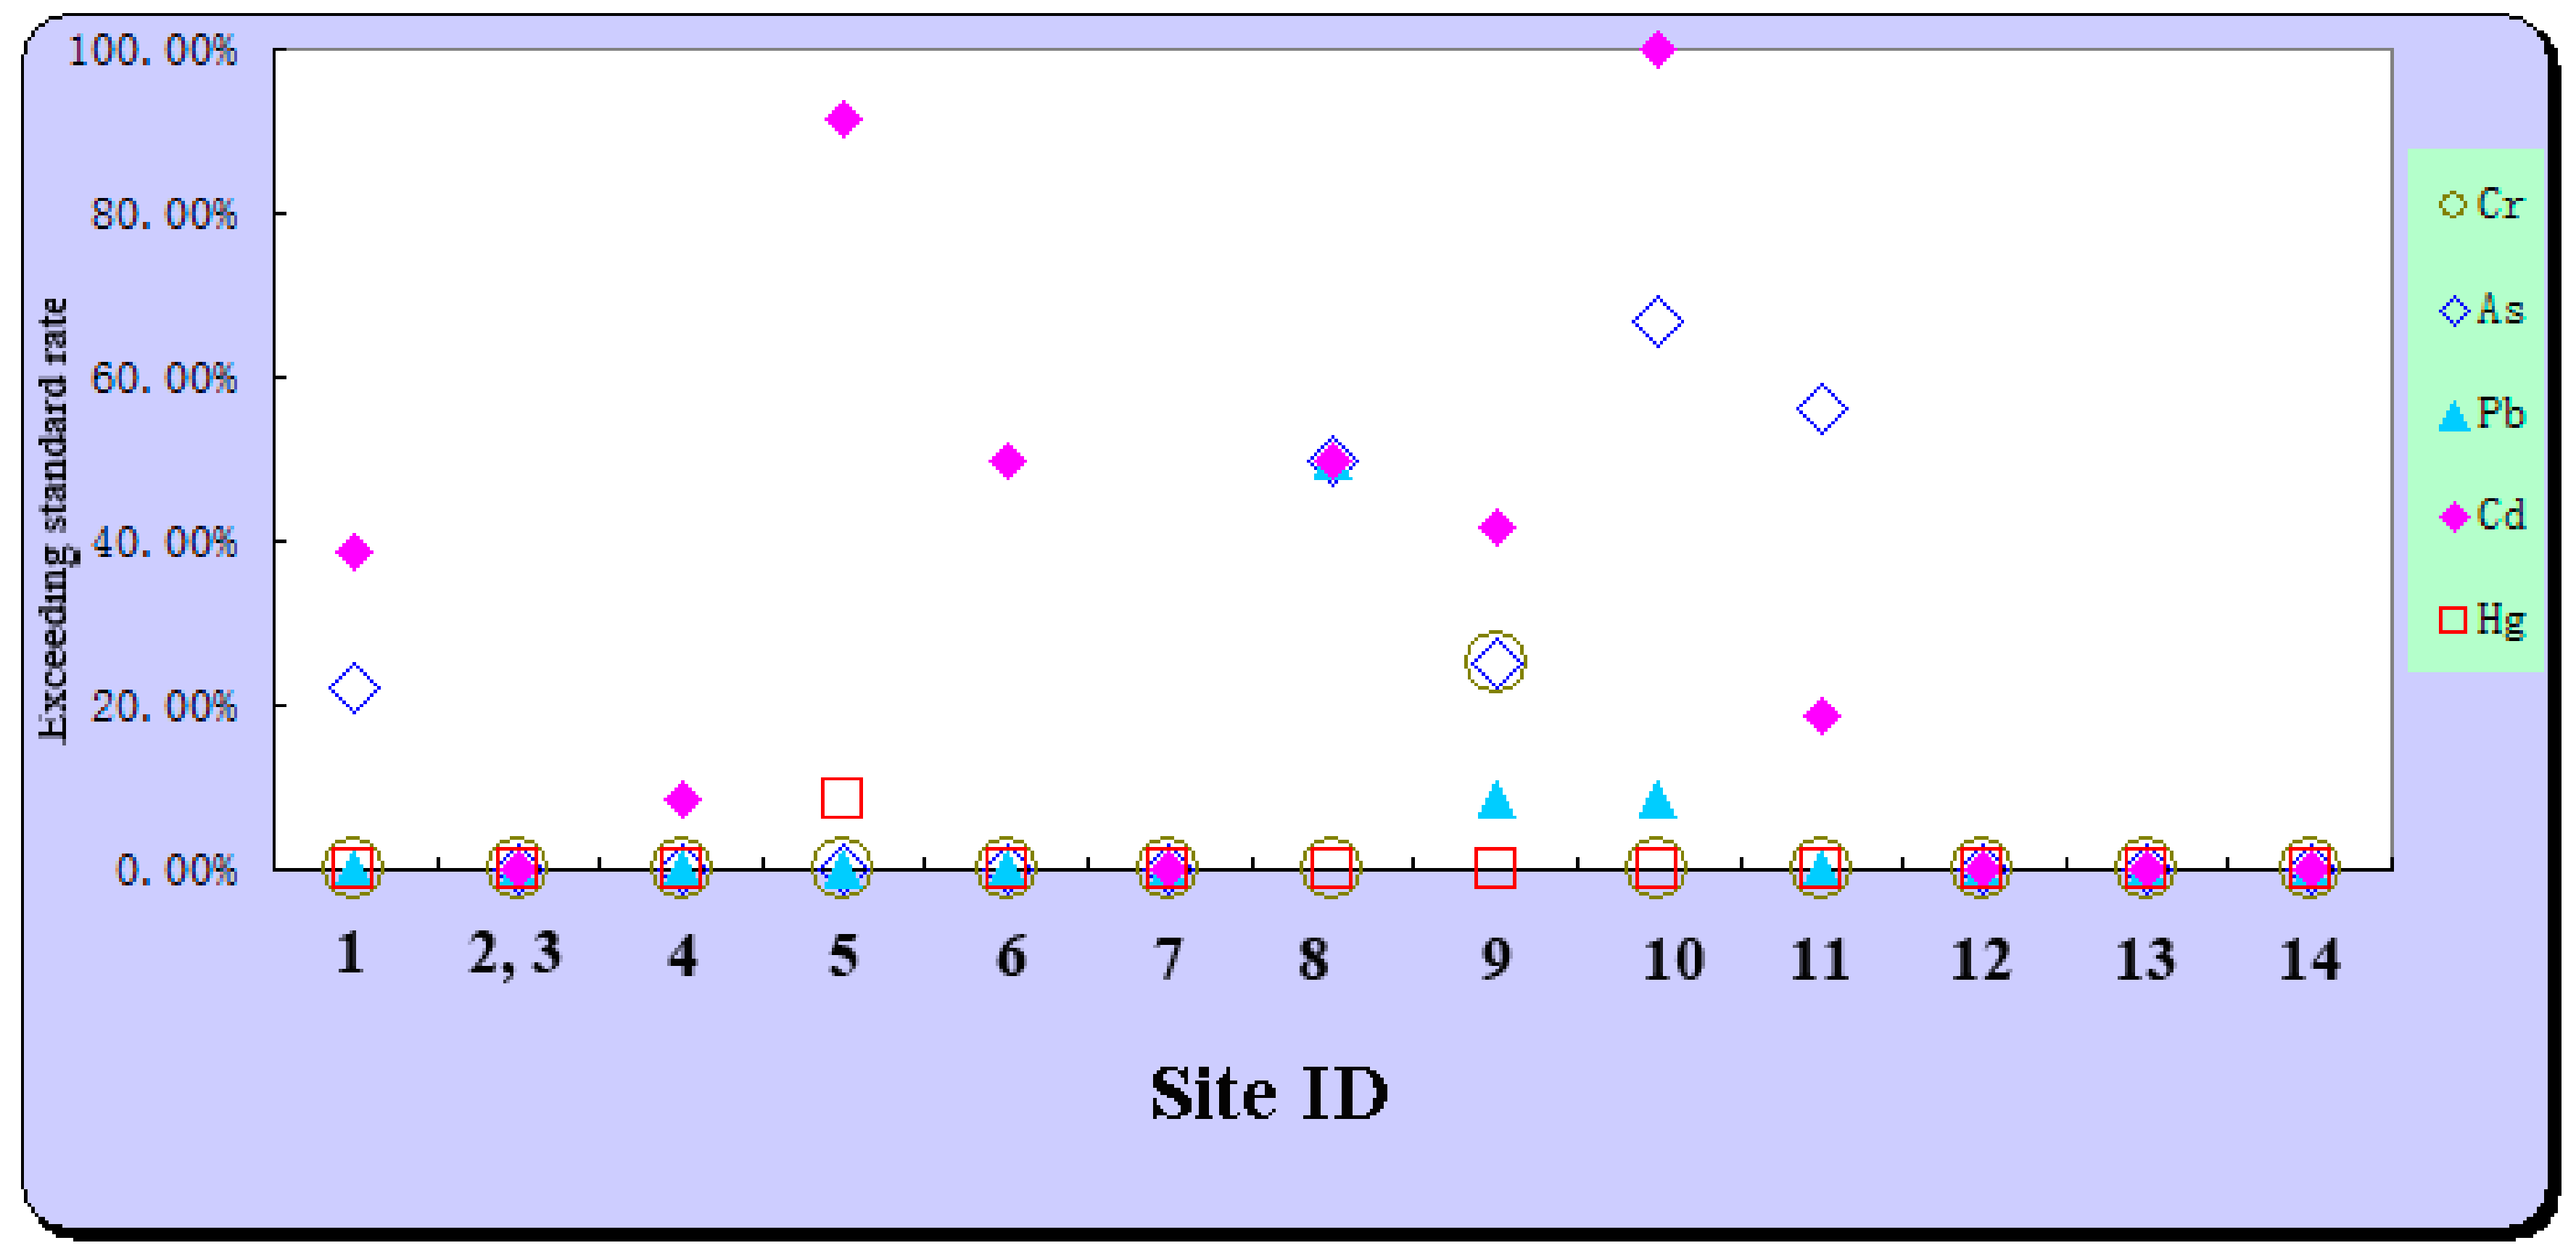
3.1.1. Exceeding the Standard Rate

The statistical descriptions of Cr, As, Pb, Cd and Hg in soils for each site and their exceeding standard rates are listed in Table 3. Among all 13 sites (sites 2 and 3 are integrated into one investigated site because of the short distance), there were five sites where the contents of all five elements did not exceed the standard values (Table 3). However, in the other eight sites, Cd and As were identified as the main contaminants because the frequencies of their exceeding standard rates were higher, while the exceeding standard rates of Pb, Hg and Cr were almost zero (Table 3).
In addition, we made a scatter plot of the metal exceeding standard rates for each site. For most investigated sites, Cd and As were the main contaminants, followed by Pb (Figure 2). Generally, the metals of greatest concern, in order, would be as follows: Cd > As > Pb > Cr > Hg. However, there were some differences among the soil sites. Taking Hg as an example, only the exceeding standard rate of soil around Bayan Nur Zijin Nonferrous Metal Co., Ltd., Bayannaoer, China, (Site No.5), was greater than zero (8.33%). For Cr, only the exceeding standard rate of soil around Bayan Nur Feishang Copper Co., Ltd., Bayannaoer, China, (Site No.9), was greater than zero (25%). Notably, the exceeding standard rate of Cd in soil around Urad Houqi Yifengxi Chemistry Co., Ltd., Bayannaoer, China, (Site No.10) was 100%, which indicated that there might be potential risk of Cd contamination in the surrounding soil.

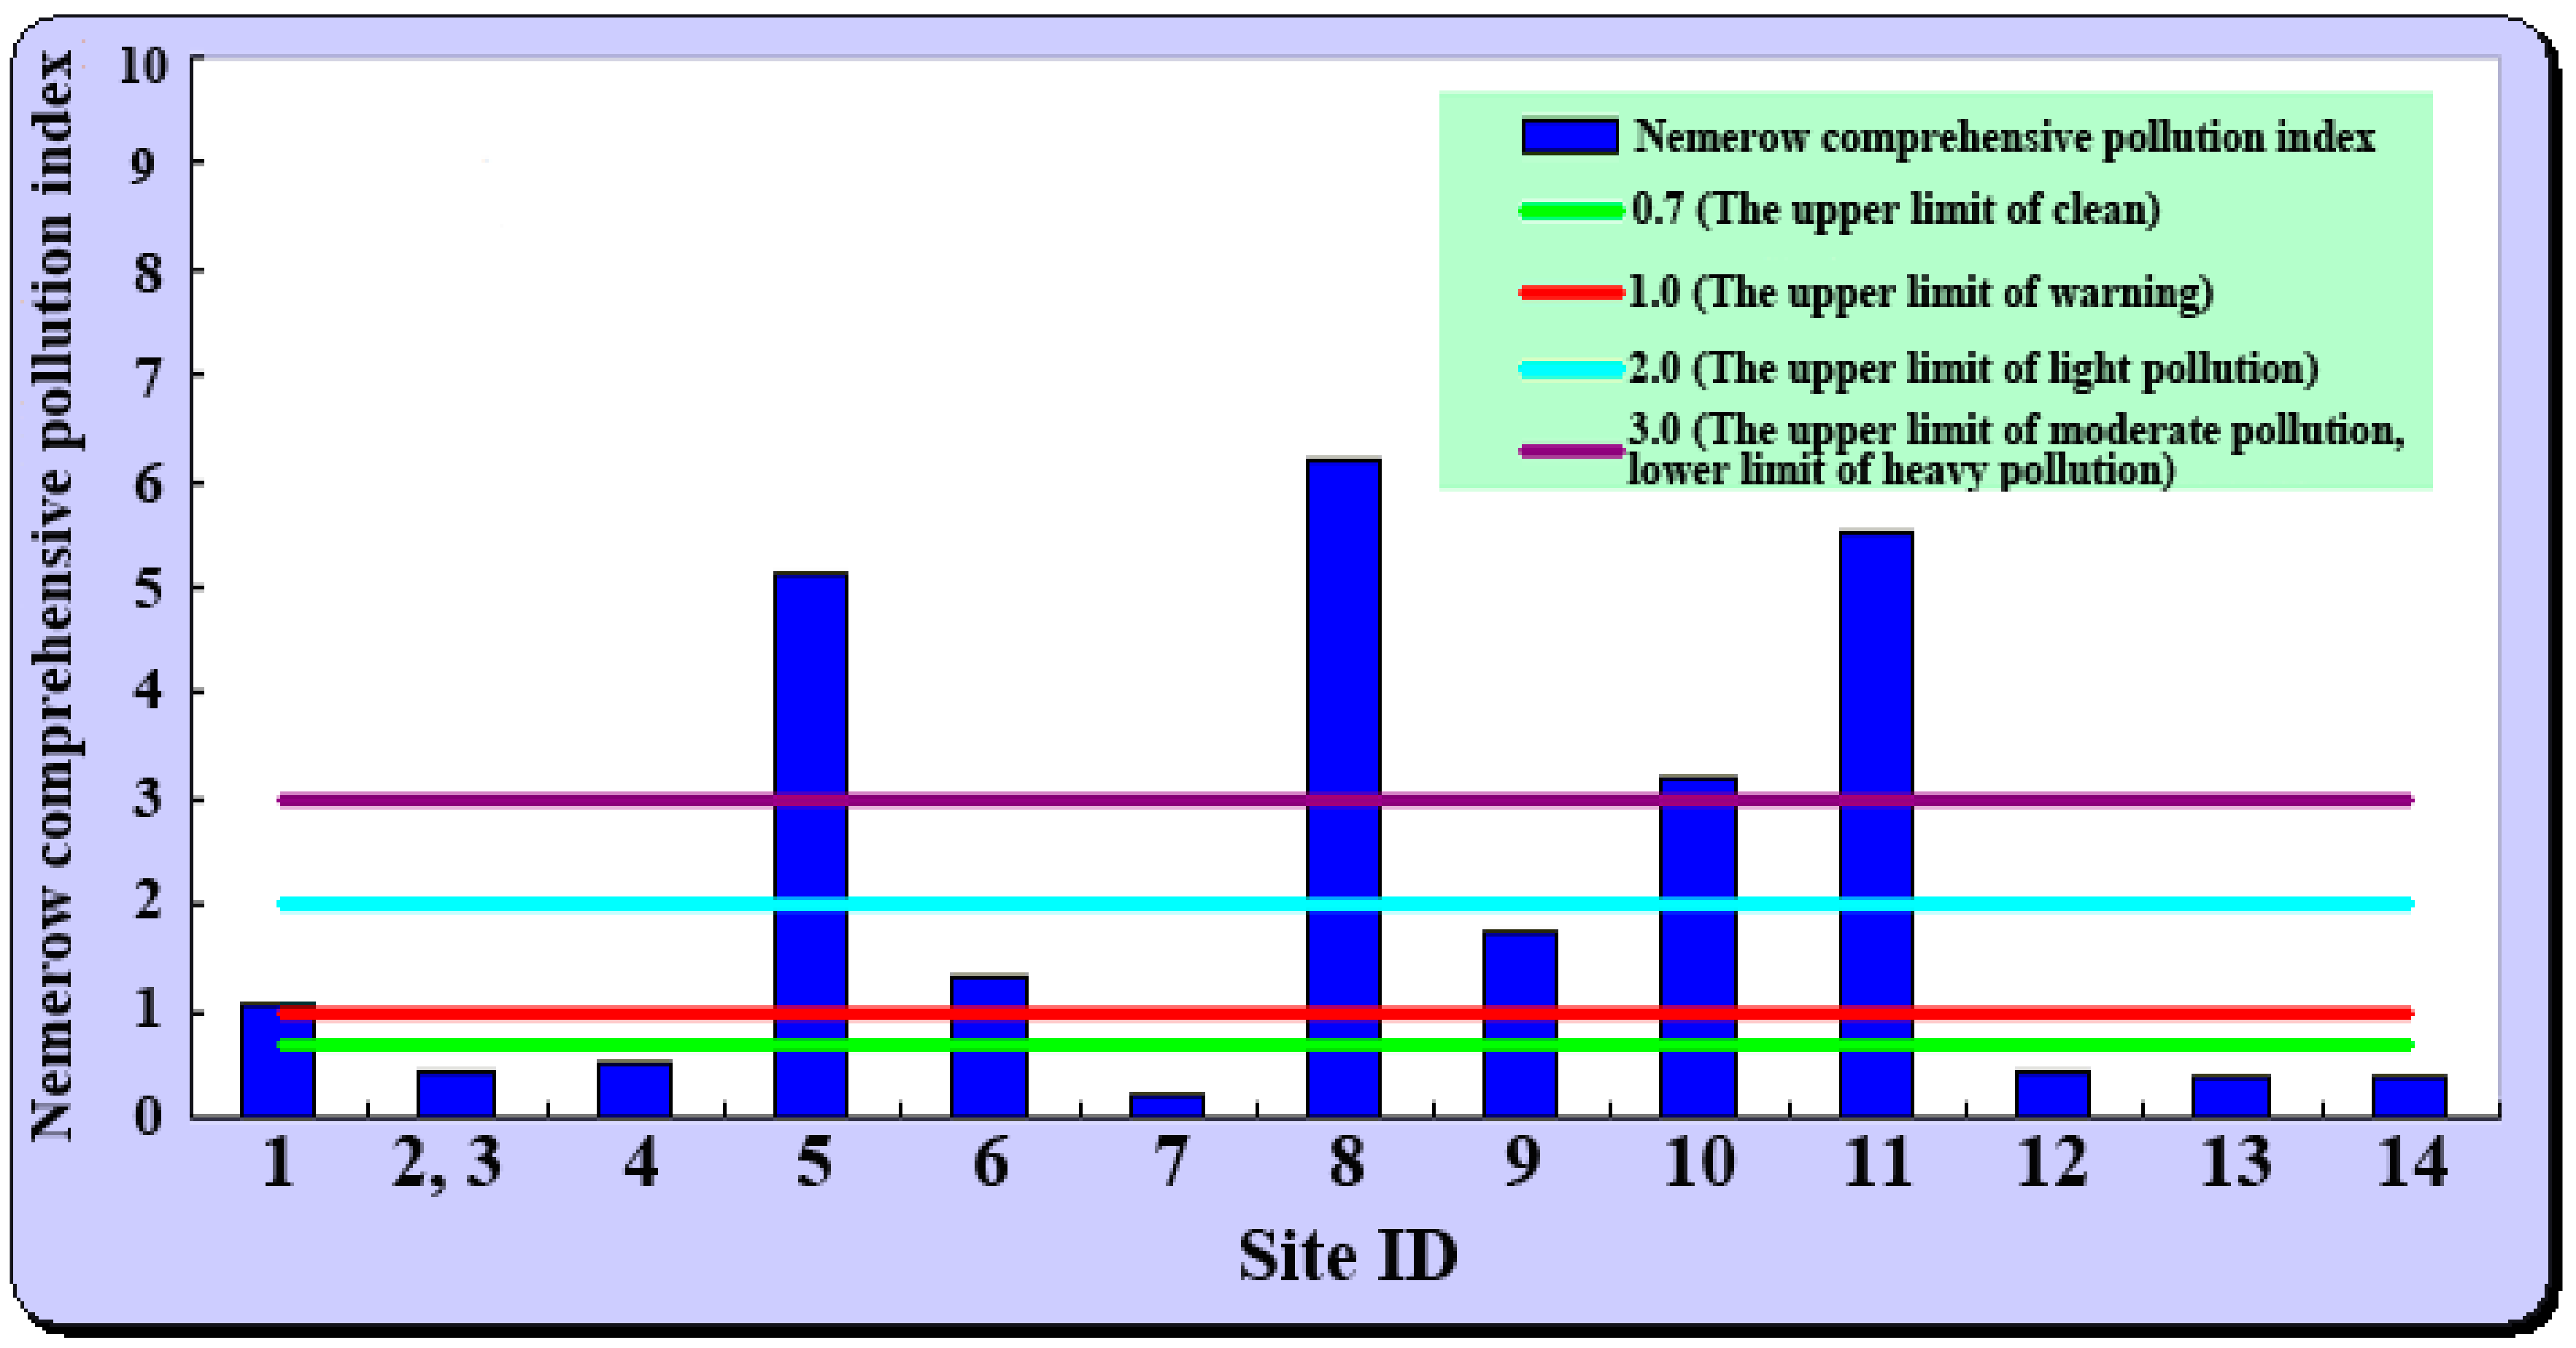
3.1.2. Pollution Index Assessment

We also assessed the soil arsenic and heavy metal contamination using the single factor pollution index and Nemerow comprehensive pollution index methods, and the results are shown in Table 4. According to the single factor pollution index assessment results, the single factor pollution index values of Cd, As and Pb in soils in some sites were greater than 1.0, which exceeded the pollution index thresholds. These results indicated that the soils in some sites (i.e., Zhenyuan Mineral Concentration Factory, Bayan Nur Zijin Nonferrous Metal Co., Ltd., Inner Mongolia Qihua Mineral Concentration Factory, Urad Houqi Qianzhen Mineral Concentration Co., Ltd., Urad Houqi Yifengxi Chemistry Co., Ltd.) were seriously contaminated by Cd, As and Pb. The greater the single factor pollution index values were, the more serious the accumulation of metals.
For Cd, among the 13 investigated sites, there were five sites where the average single factor index values of the surrounding soils were greater than 1.0, which showed high accumulation of Cd in soil around these enterprises. The single factor index value for Urad Houqi Qianzhen Mineral Concentration Co., Ltd. (Site No.8 in Table 4), was the highest, with a value of 8.465. For As, there were 4 sites where the average single factor index value of the surrounding soils was greater than 1.0, among which the value at Urad Houqi Oubulage Copper Mineral Co., Ltd. (Site No.11), was extremely higher than those at other sites, with a value of 7.625. For Pb, there was only one site where the average single factor index value for the surrounding soil was greater than 1.0, with a value of 1.216, which indicated that the accumulation of Pb was generally minor.
Particularly, at some sampling sites, the single factor index values of As and Cd were relatively higher than those at other sites. The highest value of As was found in soil around Urad Houqi Oubulage Copper Mineral Co., Ltd. (Site No.11 in Table 4), with a value of 38.295, which substantially exceeded the pollution index threshold. The highest value of Cd was detected in the soil around Bayan Nur Zijin Nonferrous Metal Co., Ltd. (Site No.5 in Table 4), which reached up to 48.425, indicating high accumulation of Cd in the surrounding soil.
According to the Nemerow comprehensive pollution method, among the 13 investigated sites, there were four sites that exhibited levels of heavy pollution, three sites that exhibited levels of light pollution, and six sites that were clean (Figure 3). In other words, sites below the limit of warning accounted for 46.15% of the total sites, and 53.85% of the total sites were contaminated to varying degree ranges. Among the four heavily contaminated sites, the most contaminated site was at Urad Houqi Qianzhen Mineral Concentration Co., Ltd. (6.215), followed by Urad Houqi Oubulage Copper Mineral Co., Ltd. (5.523), with Cd and As being the dominant elements, respectively.
In a word, almost half of the investigated soils were contaminated by metals. Cd and As were the elements with the greatest concern, followed by Pb, Cr and Hg, even though there were some differences among the sites. These metals pose increasingly ecological and human health risk due to the bioaccumulation and biomagnification in the food chain [24,29]. The bioaccessibility of metals (i.e., Pb, As) in soils have been reported to be in the range of 0.1–68% [30]. The differences in the morphology, composition and mineralogy of metals may be the main reasons for the wide range of these values. In this study, the average value of Cd (1.03 mg/kg) exceeded the ecological screening levels in soils of 1.0 mg/kg for avian wildlife and 0.38 mg/kg for mammalian wildlife [31]. Food intake was the main route Cd entering the body, and the major threat to human health was chronic accumulation which could lead to kidney dysfunction, human carcinogen, and reproductive toxicity [32,33]. Since Cd is very biopersistent and its half-life period might reach as long as 30 years in the human body [34], the degree of contamination around mining enterprises indicated that atmospheric deposition and consequent accumulation in soils needed to be minimized. Besides, As values in nearly 15% of the total samples exceeded Grade II values of the Chinese standard, while the geometric average value of As was 3.84 times higher than the US baseline [24,35]. Arsenic compounds adsorb strongly to soils and could be transported over short distances to groundwater and crops (i.e., wheat and maize) [36]. Some studies showed that the contribution by aerosol inhalation was less important than by dust ingestion, while the daily oral intake of As surpassed the limitation for children in a mining region. Nevertheless, because long-term exposure to As was associated with skin damage, cancer risk, and urinary bladder [24], greater concern on this element was very important. Pb could accumulate in the entire food chain, and the risk of Pb poisoning through the food chain increased with the soil Pb level. Higher Pb concentrations were more likely to be found in leafy vegetables and root crops [25]. Though the average value of Pb (75.82 mg/kg) fell below the soil cleanup standard of 400 mg/kg for residential areas established by EPA [37], they were greater than the ecological soil screening levels of EPA for avian wildlife (16 mg/kg) and mammalian wildlife (59 mg/kg) [38]. Given the relatively widespread elevation in Pb levels, high Pb levels related to mining and smelting activities in the region might contribute to the exposure of local residents, especially for children. Moreover, Pb could cause serious injury to the brain, nervous system, and kidneys during the key periods of child growth [24,36]. Therefore, the metal pollution should be elevated as an important public health priority in the Urad Houqi region.

3.2. Source Apportionment

Nonferrous metal mining and smelting were the major sources of Cd and As contamination, which was similar with the study result of Li et al. [39]. Fundamentally, Cd and As are often associated with zinc, lead-zinc, and copper-lead-zinc deposits. In mining, smelting and roasting ores, Cd and As could be discharged into the surrounding environment through solid wastes (tailings, slag) [22,23], which led to the accumulation of Cd and As in the surrounding soil.
In particular, cadmium and zinc, lead often coexist in the nature. In this study area, it was associated with light-colored sphalerite with a larger reserve, which was similar with the research of Alloway [40]. During mining processes, after Pb and Zn are refined, more Cd leaves residue in tailings and broken ores, which can then be carried to additional areas due to artificial or natural causes, such as rainfall. For the smelting industry, before Cd is extracted from ores completely, Cd deposits into the surrounding soil along with particles in air during smelting activities [41], which makes the Cd concentration in the humus layer exceed the standard value. Finally, based on the accumulation assessment results, the mineral concentration industry plays a predominant role in soil pollution, followed by the smelting industry and acid manufacturing industry.

3.3. Soil Arsenic and Heavy Metal Pollution Characteristics in a Key Mining Area

3.3.1. Statistical Characteristics of Arsenic and Heavy Metal Pollution in Surface Soils

In this section, we selected a typical area, the Dongshengmiao mining area, as a key case to explore soil arsenic and heavy metal pollution characteristics. The Dongshengmiao mining area includes three investigated enterprises (Urad Houqi Zijin Mining Co., Ltd., Inner Mongolia Dongshengmiao Mining Co., Ltd. and Wancheng Business Dongshengmiao Co., Ltd.), which shared the same tailings. This area was representative in exploring the characteristics of soil heavy metal pollution in polymetallic mining areas.
The statistical characteristics of Cr, Ni, Cu, Zn, As, Cd, and Pb are listed in Table 5. As, Zn and Cd emerged as posing the most serious contamination threat, while Cr and Ni were clean when compared with the GB15618-1995 standard values. The exceeding standard rates of Cr, Ni, Cu, Zn, As, Cd, and Pb were 0.00%, 0.00%, 7.69%, 30.77%, 50.00%, 26.92%, and 11.54%, respectively. In addition, Cd, Pb, As, Zn and Cu had larger coefficients of variation (CVs; >1.0), indicating that they were obviously affected by external interference and that the spatial distributions of these metals varied remarkably [42].
Moreover, there were significant positive correlations between metals Ni, Cu, Zn, As, Cd, and Pb, such as Cr and Ni, Ni and Cu, Zn and Cd, and Cd and Pb (p < 0.01) (Table 6), which showed that there may have been isogenesis or they were less affected by the soil parent materials [42]. Therefore, the mining activities in this key area made a large contribution to the accumulation of arsenic and heavy metals in the surrounding agricultural soils and the sedimentation of metals in the atmosphere.

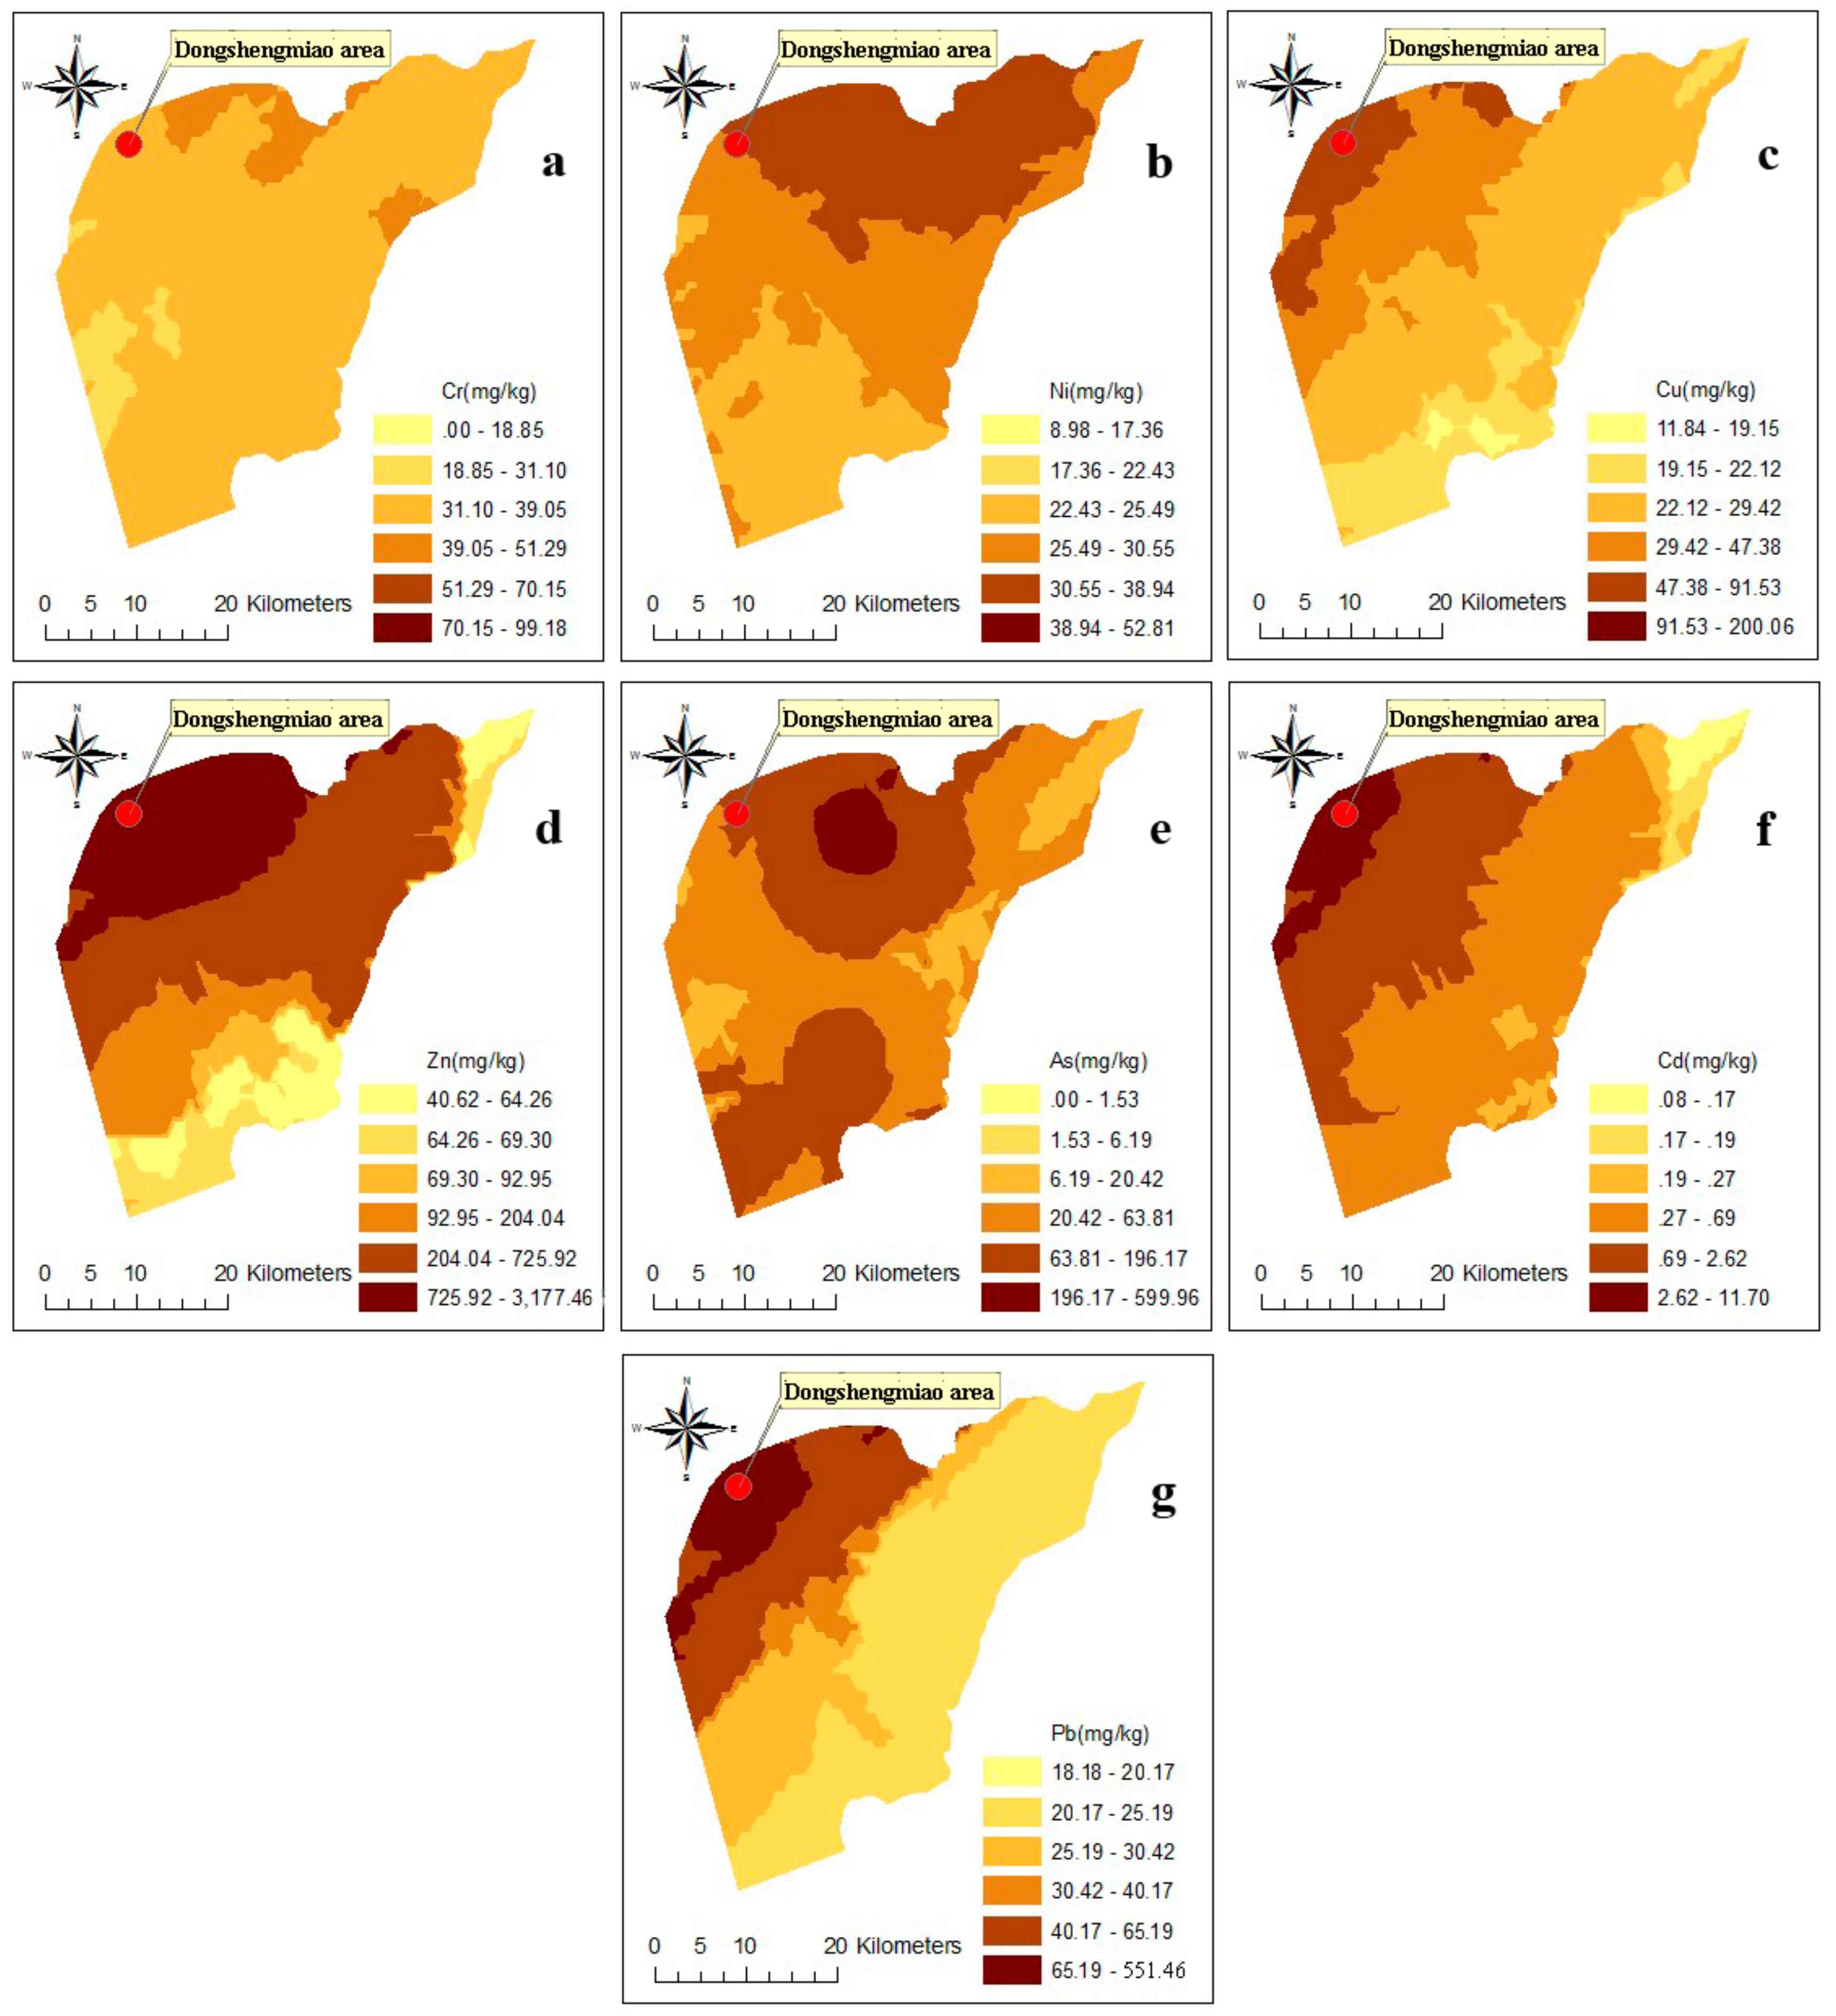
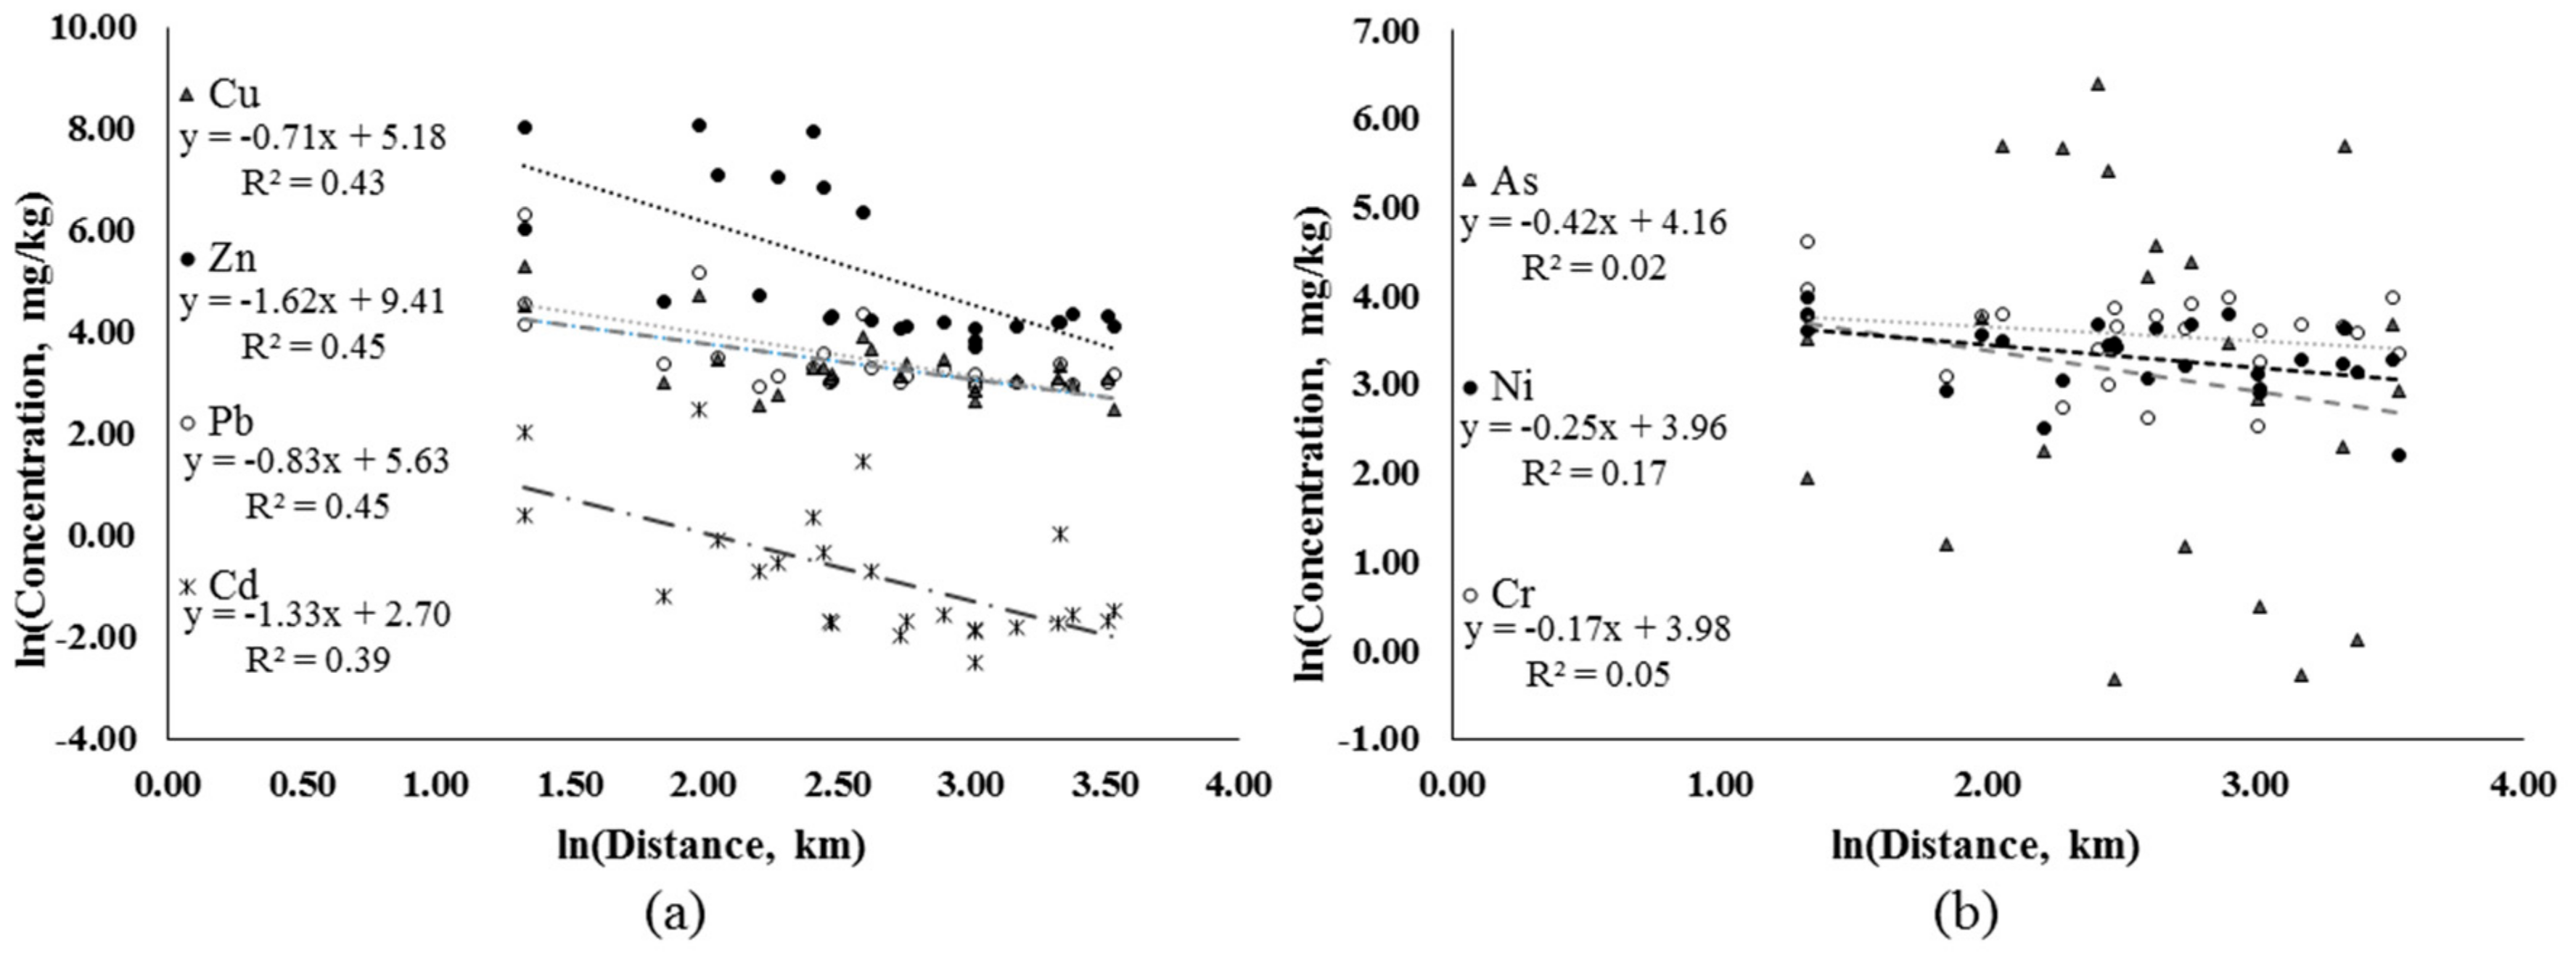
3.3.2. Spatial Distribution of Arsenic and Heavy Metal Accumulations

As one of the main geostatistical methods, kriging interpolation was used to draw the spatial distribution map of arsenic and heavy metal accumulations in the key mining area. This method demonstrated that the accumulations of Cu, Zn, Cd and Pb were the heaviest in the Dongshengmiao mining area and gradually became lighter from the mining area with distance (Figure 4).
The contents of Zn, Cd and As in the surrounding mining area exceeded the secondary standard values. The As content was higher downstream of the mining area and in northern Bayan Nur; this result was closely related to the high background value of sediments downstream of the mining area, which was the key area of As prevention and control. The higher As content in northern Bayan Nur was due to atmospheric deposition. However, Cr and Ni did not demonstrate apparent spatial distribution differences. The results showed significant logarithmic correlations between Cu, Zn, Pb and Cd concentrations and distance to the mines (Figure 5a, p < 0.05). However, no significant correlations were found between Cr, As and Hg concentrations and the distance (Figure 5b, p > 0.05). All the element concentrations showed a decrease trend with distance to the mine (Figure 5), which indicated that Cu, Zn, Pb and Cd in soils mainly originated from mining and smelting activities through short-distance transmission processes.

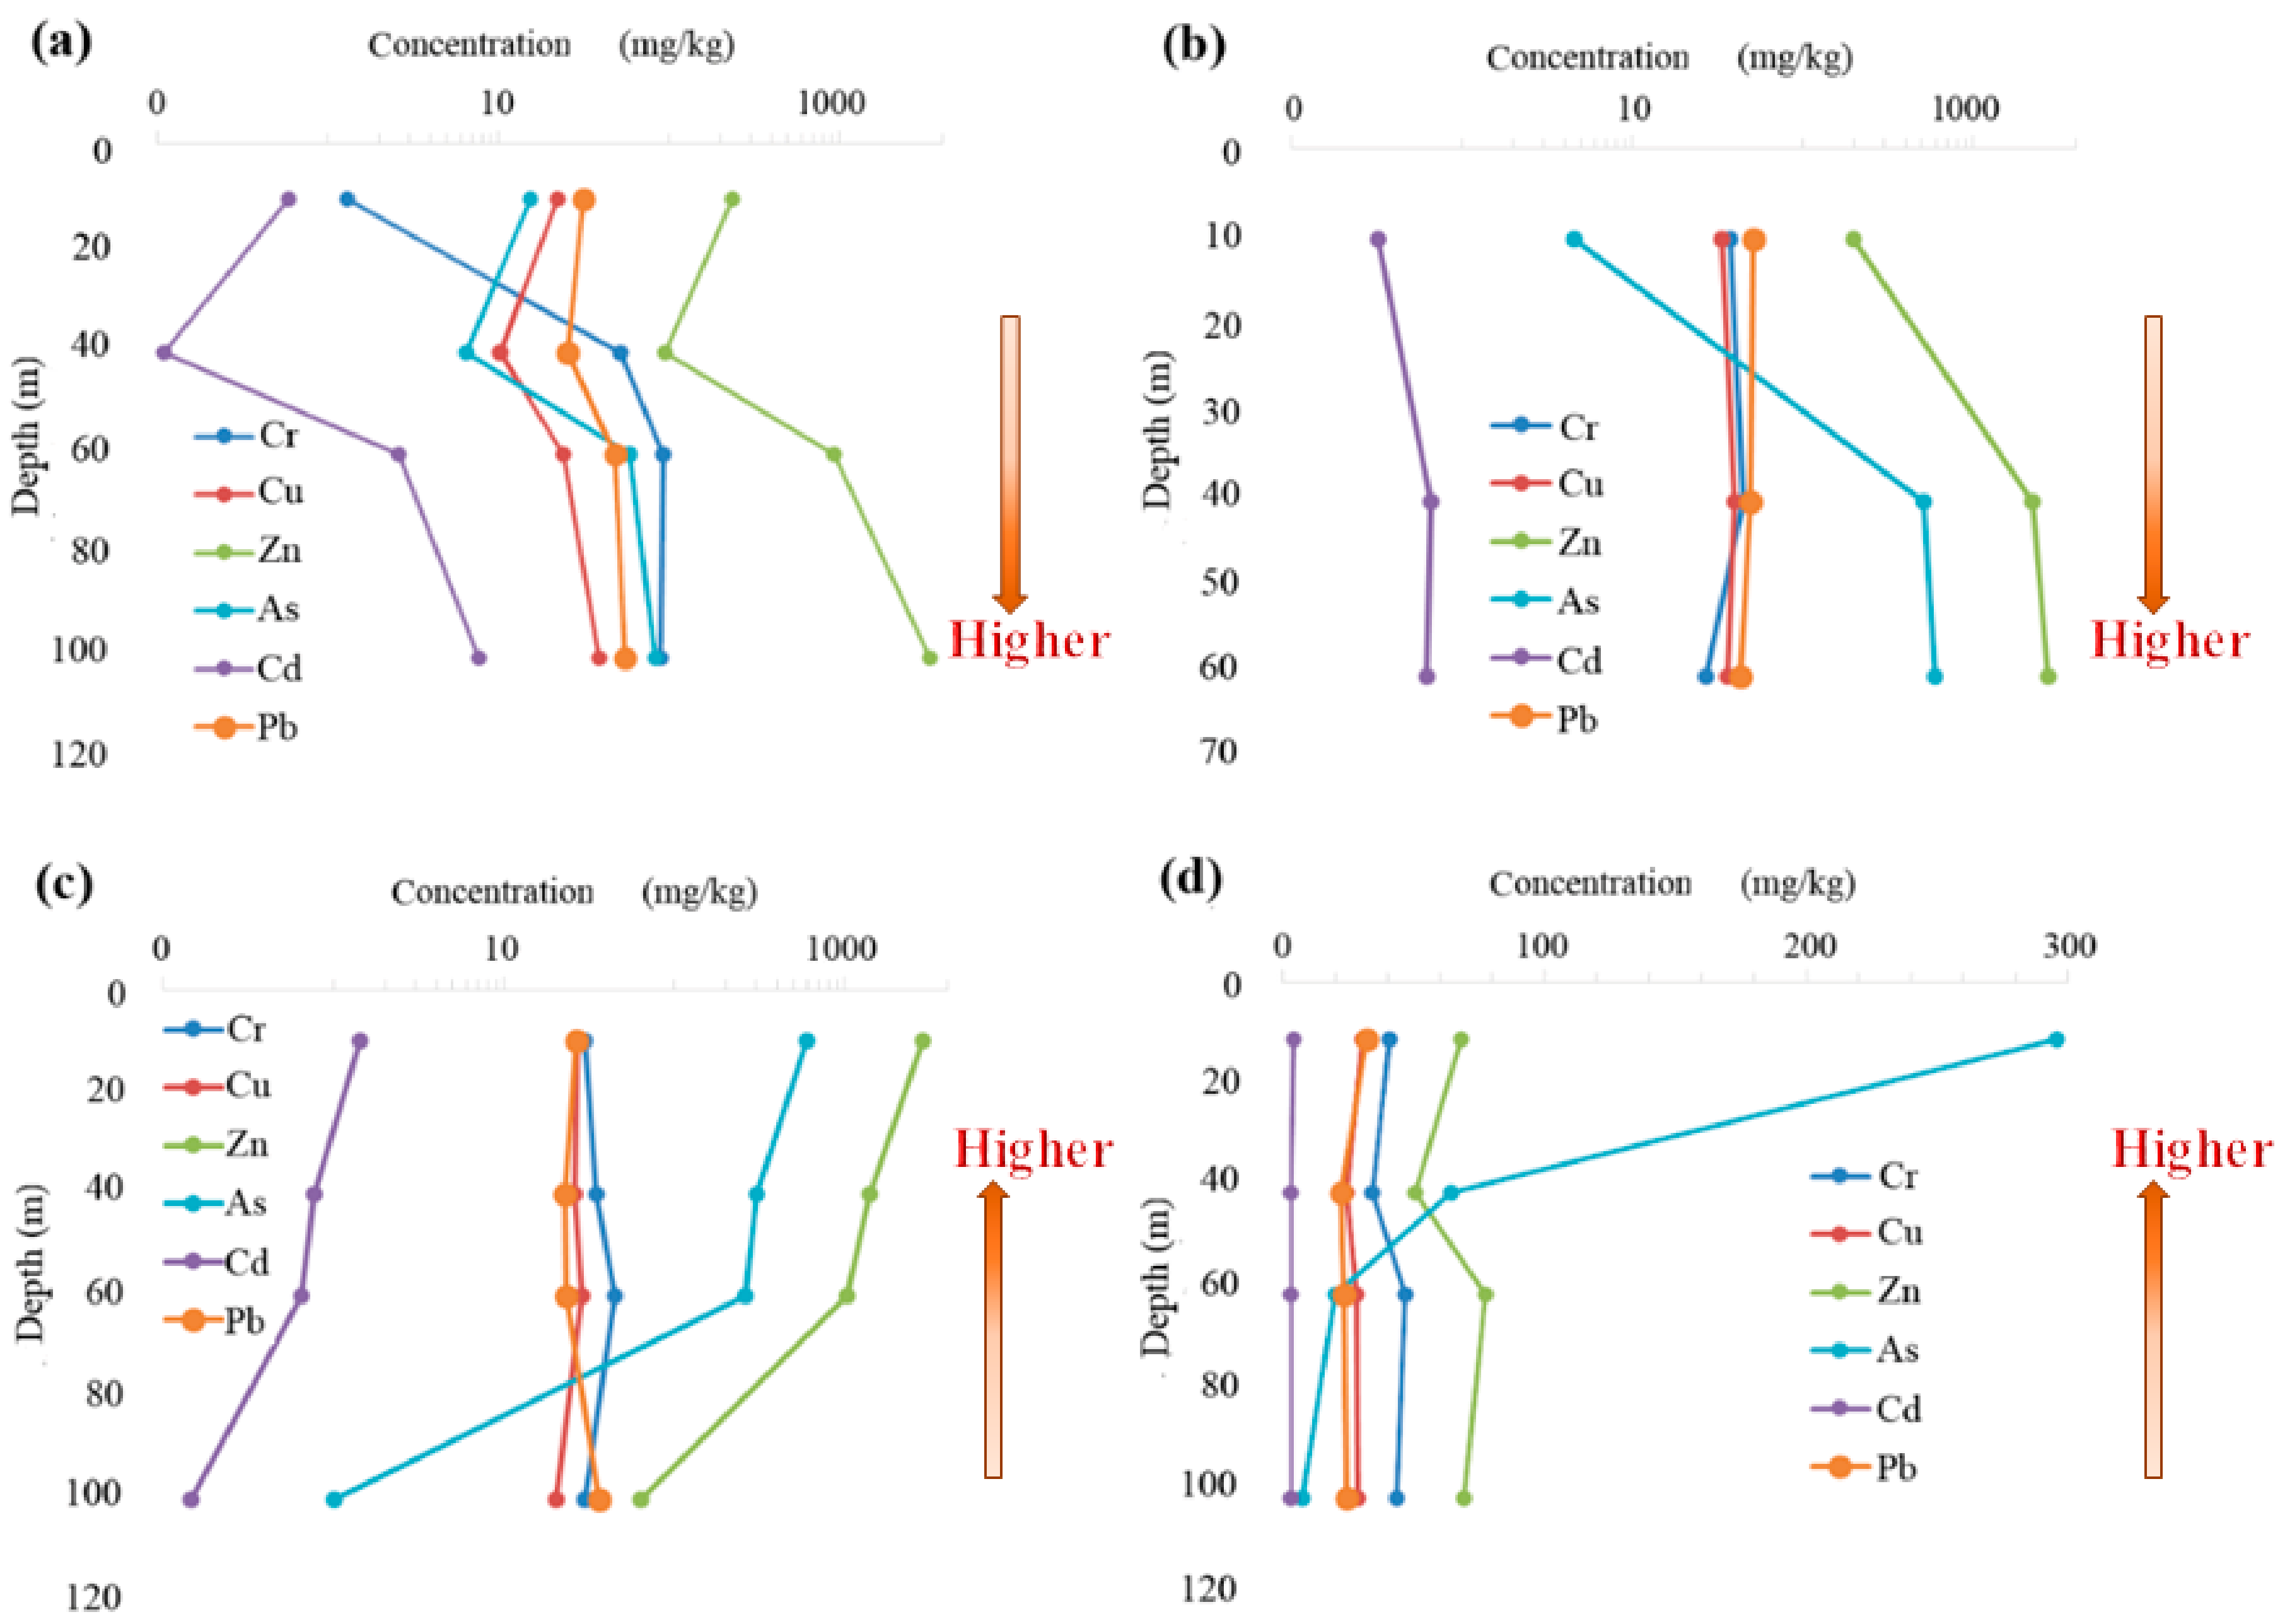
3.3.3. Vertical Distribution of Soil Arsenic and Heavy Metal Accumulations

Seven soil profiles were set for the Dongshengmiao mining area, including the surrounding soils of a wastewater drainage ditch of a smelting plant, the front belt of a mining area, alluvial plains, and the surrounding agricultural soils of mining areas. Finally, four samples were taken from four layers (1: 0–20 cm; 2: 20–40 cm; 3: 40–60 cm; 4: 60–100 cm) for each profile (except profile B). The contents of the heavy metals in the samples are listed in Table 7.
We selected four typical profiles, A (Wastewater drainage ditch of the Zijin smelting plant), B (Front belt of a mining area), C (Surrounding agricultural soil of a mining area), and D (Surrounding agricultural soil of an alluvial plain), to make the vertical distribution maps of the arsenic and heavy metal contents (Figure 6).
Two vertical distribution features were explained by the arsenic and heavy metal contents in the surrounding soils of the key mining area. One feature was that the arsenic and heavy metal contents increased with sampling depth, which was characterized by the surrounding soils of the wastewater drainage ditch and front belt (Table 7 and Figure 6a,b), where the transport of arsenic and heavy metals was driven by water. In this case, the element contents below the surface layer were higher. The contents of Zn, Cd and As exceeded the tertiary values of GB15618-1995. The metals were transported downward with the water flow under the influences of wastewater and irrigation and then accumulated at the bottom. In particular, the contents of Zn in soil layer 4 (60–100 cm) of the wastewater drainage ditch and front belt were approximately 10-fold higher than those in the surface layer (Table 7), indicating that the underground water was potentially threatened.
On the other hand, the element contents decreased with the sampling depth (Figure 6c,d). In this case, the profiles were far from the surface water and mines. The elements (Cd, As, Zn) accumulated predominantly in the surface indicating that the soils were seriously contaminated by exogenous pollution sources like atmospheric deposition and industrial, agricultural and domestic activities. And they transported downward very slowly owing to far from the surface water. In the alluvial plains far from the mines, the element contents in soils were obviously lower than those in the surrounding soils of the mines, and their vertical variations were relatively smaller. However, they were affected in several ways, such as by element contents in the surface layer, land use types, industrial and agricultural activities, atmospheric deposition and wind direction. In addition, for each metal, we analyzed its accumulation characteristics in the four typical profiles. Generally, there were no large differences in the average contents of Cr, Zn, As, Cd and Pb in the four profiles (p > 0.05) except for Ni and Cu. For Ni, the average contents of profiles C and D were significantly higher than profile B, which was significantly higher than that of profile A (p < 0.05). For Cu, the average contents of profiles B, C and D were significantly higher than that of profile A (p < 0.05), while there were no significant differences among profiles B, C and D (p > 0.05). The contents of Cr and Cu were generally higher in the middle layers than those in the surface and bottom layers. It demonstrated that Cr and Cu showed surface-aggregation property to a certain level and they might transport downward very slowly because of the arid climate and less rainfall in Inner Mongolia [43]. However, all the contents of Cr, Cu and Ni in the four profiles did not exceed the standard values, posing less risk to soil ecosystems. The maximum values of both Zn and As were found in the surface layer of the surrounding agricultural soil of the mining area (profile C), and they both exceeded the tertiary values of GB15618-1995, which showed that the surrounding agricultural soil of the mining area was seriously contaminated by Zn and As. The highest content of Cd was detected in the bottom layer of profile A, followed by the surface and middle layers of profile C. Because the three enterprises included in this key area belonged to lead and zinc smelting/mining industry (Table S1). And, cadmium and zinc, lead often coexist in the nature [44]. Some scientists also found that the unreasonable exploitation of lead and zinc mines could bring about the contamination of Cd in the North America, North Europe and East Asia [45,46,47]. The highest contents of Cd exceeded the second value of GB15618-1995 in this area, indicating that it suffered from intense Cd pollution. However, the surrounding agricultural soil of the alluvial plain (profile D) was not contaminated by heavy metals.

4. Conclusions

Mining activities not only lead to the massive stacking of tailings, which was one of the six most concerned solid wastes listed in “The 13th five-year plan for comprehensive utilization of industrial solid wastes” in China, but also cause heavy metal contamination. Inner Mongolia is one of the mineral resource bases in China. This study used the Urad Houqi mining area as the study area, conducted a soil arsenic and heavy metal contamination assessment for the entire area, and explored the characteristics of soil arsenic and heavy metal contamination in the Dongshengmiao mining area, which is a typical polymetallic mining area. In general, almost half of the investigated sites were contaminated by Cd, As and Pb, with the mineral concentration industry, smelting industry and acid manufacturing industry being the dominant sources. Particularly, for the Dongshengmiao mining area, As, Zn and Cd posed the most serious contamination risks, followed by Pb, and the accumulations of these metals was the heaviest in the mining area, which gradually decreased with distance. Therefore, increased concerns and control measures are needed for As, Cd, Pb and Zn contamination in the Urad Houqi mining area.

Supplementary Materials

The following are available online at https://www.mdpi.com/1660-4601/15/11/2410/s1, Table S1: Summary of the 14 key investigated sites in Urad Houqi.

Author Contributions

Conceptualization, S.S. and C.S.; methodology, Y.L. and L.L.; software, L.L. and M.L.; validation, J.L. and S.S.; investigation, L.W., Y.L., M.L. and S.S.; data curation, Y.L. and J.L.; writing—original draft preparation, S.S.; writing—review and editing, C.S.

Funding

This research was funded by the Incentive Fund for the Scientific and Technology Innovation Program of Inner Mongolia (20131510), the Natural Science Foundation of Inner Mongolia (2015KF01, 2014MS0553), the National Key R & D Program of China (2017YFC0505706), the National Natural Science Foundation of China (41761144053, 41501539 and 41420104004), and the Open Fund of State Key Laboratory of Urban and Regional Ecology in China (SKLURE2016-2-6).

Conflicts of Interest

The authors declare no conflict of interest.

References

  1. Gutti, B.; Aji, M.M.; Magaji, G. Environmental impact of natural resources exploitation in Nigeria and the way forward. J. Appl. Technol. Environ. Sanit. 2012, 2, 95–102. [Google Scholar]
  2. Aigbedion, I. Environmental effect of mineral exploitation in Nigeria. Int. J. Phys. Sci. 2007, 2, 33–38. [Google Scholar]
  3. Li, J.; Zhou, X.; Yan, J.; Li, H.; He, J. Effects of regenerating vegetation on soil enzyme activity and microbial structure in reclaimed soils on a surface coal mine site. Appl. Soil Ecol. 2015, 87, 56–62. [Google Scholar] [CrossRef] [Green Version]
  4. Liu, Y.; Su, C.; Zhang, H.; Li, X.; Pei, J. Interaction of Soil Heavy Metal Pollution with Industrialisation and the Landscape Pattern in Taiyuan City, China. PLoS ONE 2014, 9, e105798. [Google Scholar] [CrossRef] [PubMed]
  5. Bhuiyan, M.A.; Parvez, L.; Islam, M.; Dampare, S.B.; Suzuki, S. Heavy metal pollution of coal mine-affected agricultural soils in the northern part of Bangladesh. J. Hazard. Mater. 2010, 173, 384–392. [Google Scholar] [CrossRef] [PubMed]
  6. Liu, G.; Tao, L.; Liu, X.; Hou, J.; Wang, A.; Li, R. Heavy metal speciation and pollution of agricultural soils along Jishui River in non-ferrous metal mine area in Jiangxi Province, China. J. Geochem. Explor. 2013, 132, 156–163. [Google Scholar] [CrossRef]
  7. Wang, X.; He, M.; Xie, J.; Xi, J.; Lu, X. Heavy metal pollution of the world largest antimony mine-affected agricultural soils in Hunan province (China). J. Soils Sediments 2010, 10, 827–837. [Google Scholar] [CrossRef]
  8. Guo, P. Study on Heavy Metal Contamination Mechanism and Countermeasure in Urban Soil of Changchun. Doctoral Dissertation, Jilin University, Changchun, China, 2005. [Google Scholar]
  9. Lin, Z.; Herbert, R.B., Jr. Heavy metal retention in secondary precipitates from a mine rock dump and underlying soil, Dalarna, Sweden. Environ. Geol. 1997, 33, 1–12. [Google Scholar] [CrossRef]
  10. Banat, K.M.; Howari, F.M.; Al-Hamad, A.A. Heavy metals in urban soils of central Jordan: Should we worry about their environmental risks? Environ. Res. 2005, 97, 258–273. [Google Scholar] [CrossRef] [PubMed]
  11. Chen, X.B.; Wright, J.V.; Conca, J.L.; Peurrung, L.M. Effects of pH on Heavy Metal Sorption on Mineral Apatite. Environ. Sci. Technol. 1997, 31, 624–631. [Google Scholar] [CrossRef]
  12. Shu, W.S.; Ye, Z.H.; Zhang, Z.Q.; Lan, C.Y.; Wong, M.H. Natural Colonization of Plants on Five Lead/Zinc Mine Tailings in Southern China. Restor. Ecol. 2005, 13, 49–60. [Google Scholar] [CrossRef]
  13. Losfeld, G.; L’Huillier, L.; Fogliani, B.; Jaffré, T.; Grison, C. Mining in New Caledonia: Environmental stakes and restoration opportunities. Environ. Sci. Pollut. Res. 2015, 22, 5592–5607. [Google Scholar] [CrossRef] [PubMed]
  14. Chiu, K.K.; Ye, Z.H.; Wong, M.H. Growth of Vetiveria zizanioides and Phragmities australis on Pb/Zn and Cu mine tailings amended with manure compost and sewage sludge: A greenhouse study. Bioresour. Technol. 2006, 97, 158–170. [Google Scholar] [CrossRef] [PubMed]
  15. Lan, C. Effects of acid leaching on heavy metals mobility of Pb/Zn tailings and the phyto toxicity of leachate. China Environ. 1996, 16, 461–465. [Google Scholar]
  16. Verner, J.F.; Ramsey, M.H.; Helios-Rybicka, E.; JeˆDrzejczyk, B. Heavy metal contamination of soils around a PbZn smelter in Bukowno, Poland. Appl. Geochem. 1996, 11, 11–16. [Google Scholar] [CrossRef]
  17. Castro-Larragoitia, J.; Kramar, U.; Puchelt, H. 200 years of mining activities at La Paz/San Luis Potosí/Mexico—Consequences for environment and geochemical exploration. J. Geochem. Explor. 1997, 58, 81–91. [Google Scholar] [CrossRef]
  18. Li, M.S. Ecological restoration of mineland with particular reference to the metalliferous mine wasteland in China: A review of research and practice. Sci. Total Environ. 2006, 357, 38–53. [Google Scholar] [CrossRef] [PubMed]
  19. Zanello, S.; Melo, V.F.; Nagata, N. Study of different environmental matrices to access the extension of metal contamination along highways. Environ. Sci. Pollut. Res. 2017, 25, 5969–5979. [Google Scholar] [CrossRef] [PubMed]
  20. Ogunkunle, C.O.; Ziyath, A.; Opeloyeru, N.; Adeniyi, S.; Fatoba, P. Sources, Transport Pathways and the Ecological Risks of Heavy Metals Present in the Roadside Soil Environment in Urban Areas. Environ. Res. Eng. Manag. 2017, 73, 21–31. [Google Scholar] [CrossRef]
  21. Tan, M.Z.; Fang-Ming, X.U.; Chen, J.; Zhang, X.L.; Chen, J.Z. Spatial Prediction of Heavy Metal Pollution for Soils in Peri-Urban Beijing, China Based on Fuzzy Set Theory 1. Pedosphere 2006, 16, 545–554. [Google Scholar] [CrossRef]
  22. Wang, J.Z.; Jing-Lu, W.U.; Zeng, H.A.; Bai, R.D. Topsoil Element Contents and Its Spatial Distribution Characteristics in Hetao Plain. Acta Sedimentol. Sin. 2014, 32, 677–683. (In Chinese) [Google Scholar]
  23. Zhang, H. Heavy-Metal pollution and arseniasis in Hetao region, China. AMBIO 2004, 33, 138–140. [Google Scholar] [CrossRef] [PubMed]
  24. Diawara, M.M.; Litt, J.S.; Unis, D.; Alfonso, N.; Martinez, L.; Crock, J.G.; Smith, D.B.; Carsella, J. Arsenic, Cadmium, Lead, and Mercury in Surface Soils, Pueblo, Colorado: Implications for Population Health Risk. Environ. Geochem. Health 2006, 28, 297–315. [Google Scholar] [CrossRef] [PubMed]
  25. Wuana, R.A.; Okieimen, F.E. Heavy Metals in Contaminated Soils: A Review of Sources, Chemistry, Risks and Best Available Strategies for Remediation. ISRN Ecol. 2011, 2011. [Google Scholar] [CrossRef]
  26. Guo, W.; Liu, X.; Liu, Z.; Li, G. Pollution and Potential Ecological Risk Evaluation of Heavy Metals in the Sediments around Dongjiang Harbor, Tianjin. Procedia Environ. Sci. 2010, 2, 729–736. [Google Scholar] [CrossRef]
  27. Chen, H.; Teng, Y.; Lu, S.; Wang, Y.; Wang, J. Contamination features and health risk of soil heavy metals in China. Sci. Total Environ. 2015, 512–513, 143–153. [Google Scholar] [CrossRef] [PubMed]
  28. Gong, Q.; Deng, J.; Xiang, Y.; Wang, Q.; Yang, L. Calculating Pollution Indices by Heavy Metals in Ecological Geochemistry Assessment and a Case Study in Parks of Beijing. J. China Univ. Geosci. 2008, 19, 230–241. [Google Scholar]
  29. Shiowatana, J.; McLaren, R.G.; Chanmekha, N.; Samphao, A. Fractionation of arsenic in soil by a continuous-flow sequential extraction method. J. Environ. Qual. 2001, 30, 1940–1949. [Google Scholar] [CrossRef] [PubMed]
  30. Drahota, P.; Raus, K.; Rychlíková, E.; Rohovec, J. Bioaccessibility of As, Cu, Pb, and Zn in mine waste, urban soil, and road dust in the historical mining village of Kaňk, Czech Republic. Environ. Geochem. Health 2018, 40, 1495–1512. [Google Scholar] [CrossRef] [PubMed]
  31. Environmental Protection Agency (EPA). Ecological Soil Screening Levels for Cadmium, Interim Final, OSWER Directive 9285.7-65; Environmental Protection Agency: Washington, DC, USA, 2003. [Google Scholar]
  32. Sarabia, R.; Del Ramo, J.; Diaz-Mayans, J.; Torreblanca, A. Developmental and reproductive effects of low cadmium concentration on Artemia parthenogenetica. J. Envrion. Sci Health Part A 2003, 38, 1065–1071. [Google Scholar] [CrossRef]
  33. Manahan, S.E. Toxicological Chemistry and Biochemistry, 3rd ed.; CRC Press, Limited Liability Company (LLC): Boca Raton, FL, USA, 2003. [Google Scholar]
  34. Goyer, R.A. Toxic effects of metal. In Klaassen Casaretts Toxicology—The Basic Science of Poisons; McGraw-Hill: New York, NY, USA, 1996; pp. 691–736. [Google Scholar]
  35. Shacklette, H.T.; Boerngen, J.G. Element Concentrations in Soils and Other Surficial Materials of the Conterminous United States; USGS Professional Paper 1270; US Printing Office: Washington, DC, USA, 1984. [Google Scholar]
  36. Zhang, S.H.; Wang, Y.; Pervaiz, A.; Kong, L.H.; He, M.C. Comparison of diffusive gradients in thin-films (DGT) and chemical extraction methods for predicting bioavailability of antimony and arsenic to maize. Geoderma 2018, 332, 1–9. [Google Scholar] [CrossRef]
  37. Environmental Protection Agency (EPA). 2001 Federal Register; Environmental Protection Agency (EPA): Washington, DC, USA, 2001; Volume 66, pp. 1206–1240. [Google Scholar]
  38. Environmental Protection Agency (EPA). Ecological Soil Screening Levels for Lead, Interim Final, OSWER Directive 9285.7-70; Environmental Protection Agency (EPA): Washington, DC, USA, 2003. [Google Scholar]
  39. Li, Y.; Wang, Y.B.; Gou, X.; Su, Y.B.; Wang, G. Risk assessment of heavy metals in soils and vegetables around non-ferrous metals mining and smelting sites, Baiyin, China. J. Environ. Sci. 2006, 18, 1124–1134. [Google Scholar] [CrossRef]
  40. Alloway, B.J. Sources of Heavy Metals and Metalloids in Soils; Springer: Dordrecht, The Netherlands, 2013; pp. 11–50. [Google Scholar]
  41. Li, X.; Thornton, I. Chemical partitioning of trace and major elements in soils contaminated by mining and smelting activities. Appl. Geochem. 2002, 16, 1693–1706. [Google Scholar] [CrossRef]
  42. Xie, T.; Wang, M.; Chen, W.; Uwizeyimana, H. Impacts of urbanization and landscape patterns on the accumulation of heavy metals in soils in residential areas in Beijing. J. Soils Sediments 2018, 1–11. [Google Scholar] [CrossRef]
  43. Li, L.; Zhang, D.; Yi, Y.; Wang, Y.; Li, T. Vertical distribution and immigrant character of heavy metals in soil in Lianshan and Longgang Districts of Huludao city. J. Anhui Agric. Sci. 2007, 35, 3916–3918. (In Chinese) [Google Scholar]
  44. Hang, L.; Xiao, T.; Tan, X.; Liu, D.; Jiang, Z.; Zheng, J.; Shi, G. Speciation Analysis of Cadmium in Tailings from the Jinding Pb-Zn Mining Area, Yunnan Province. Earth Environ. 2009, 2, 111–117. (In Chinese) [Google Scholar]
  45. Macgregor, A. Analysis of Control Methods: Mercury and Cadmium Pollution. Environ. Health Perspect. 1975, 12, 137. [Google Scholar] [CrossRef] [PubMed]
  46. Ma, W.; van-der-Voet, H. A risk-assessment model for toxic exposure of small mammalian carnivores to cadmium in contaminated natural environments. Sci. Total Environ. 1993, 134, 1701–1714. [Google Scholar] [CrossRef]
  47. Smolders, A.J.P.; Lock, R.A.C.; Van-der-Velde, G.; Medina-Hoyos, R.I.; Roelofs, J.G.M. Effects of mining activities on heavy metal concentrations in water, sediment, and macroinvertebrates in different reaches of the Pilcomayo River, South America. Arch. Environ. Contam. Toxicol. 2003, 44, 0314–0323. [Google Scholar] [CrossRef] [PubMed]
Figure 1. Location of different mining enterprises and sampling sites.
Ijerph 15 02410 g001
Figure 2. Exceeding the standard rate of arsenic and heavy metals in soils.
Ijerph 15 02410 g002
Figure 3. Soil arsenic and heavy metal pollution assessment by Nemerow comprehensive pollution method.
Ijerph 15 02410 g003
Figure 4. Spatial distribution of arsenic and heavy metal accumulations in soil in the Dongshengmiao mining area: (a) Cr, (b) Ni, (c) Cu, (d) Zn, (e) As, (f) Cd, and (g) Pb.
Ijerph 15 02410 g004
Figure 5. The relationship between element concentrations and distance to the mine: (a) Cu, Zn, Pb, and Cd, (b) As, Ni, and Cr.
Ijerph 15 02410 g005
Figure 6. Vertical distributions of arsenic and heavy metal accumulations in typical profiles of the Dongshengmiao mining area: (a) profile A, (b) profile B, (c) profile C, (d) profile D.
Ijerph 15 02410 g006
Table 1. Grade II values of GB15618-1995 (unit: mg/kg).
Element pHCrAsPbCdHg
CEC > 5 cmol(+)/kgCEC ≤ 5 cmol(+)/kgCEC > 5 cmol(+)/kgCEC ≤ 5 cmol(+)/kg
<6.51507540202500.30.3
6.5–7.520010030153000.30.5
>7.52501252512.53500.61
Note: CEC represents cationic exchange capacity.
Table 2. Grading standard for soil pollution of arsenic and metals.
GradeSingle Factor Pollution Index Nemerow Comprehensive
Pollution Index
Level
1Pi ≤ 0.7PN ≤ 0.7Clean
20.7 < Pi ≤ 1.00.7 < PN ≤ 1.0Warning
31.0 < Pi ≤ 2.01.0 < PN ≤ 2.0Light pollution
42.0 < Pi ≤ 3.02.0 < PN ≤ 3.0Moderate pollution
5Pi > 3.0PN > 3.0Heavy pollution
Table 3. Description of Cr, As, Pb, Cd and Hg in soils (0–20 cm) for each site and their exceeding standard rates (dry weight).
Site ID (Enterprise Name, Number of Samples) Soil Arsenic and Heavy Metal Content (mg/kg)
CrAsPbCdHg
Recommended Value250.00025.000350.0000.6001.000
1 (Zhenyuan Mineral Concentration Factory, Bayannaoer, China, 18)Average49.10018.93684.167 0.4540.014
Maximum67.400131.740176.6001.1270.022
Minimum24.6004.70023.9000.1330.009
Median50.75013.15085.0000.4020.014
SD **13.40028.47850.7390.2960.004
Exceeding rate 0.00%22.22%0.00%38.89%0.00%
2, 3 * (Urad Houqi Zijin Mining Co., Ltd., Wancheng Business Dongshengmiao Co., Ltd., Bayannaoer, China, 30)Average87.84511.26332.8850.2320.019
Maximum105.80014.91043.3000.3390.031
Minimum58.1007.15025.9000.1610.012
Median88.25011.10031.7000.2180.018
SD **15.1512.4564.0230.0540.006
Exceeding rate0.00%0.00%0.00%0.00%0.00%
4 (Inner Mongolia Dongshengmiao Mining Co., Ltd., Bayannaoer, China, 12)Average60.93311.49835.8420.3830.030
Maximum74.00014.62056.1000.7200.048
Minimum51.5007.40025.8000.2080.020
Median59.50012.55031.4000.3740.028
SD **8.4492.44510.2490.1370.008
Exceeding rate0.00%0.00%0.00%8.33%0.00%
5 (Bayan Nur Zijin Nonferrous Metal Co., Ltd., Bayannaoer, China, 12)Average49.10810.35948.7924.2460.327
Maximum66.50017.050137.50029.0552.253
Minimum40.0008.84025.7000.4600.014
Median49.4509.65536.0001.3260.047
SD **7.2182.22731.9607.9360.660
Exceeding rate0.00%0.00%0.00%91.67%8.33%
6 (Inner Mongolia Qihua Mineral Concentration Factory, Bayannaoer, China, 12)Average30.4646.40361.7501.0470.023
Maximum51.3009.810163.1003.4940.069
Minimum10.2004.67024.9000.2020.009
Median30.8505.50052.6000.3910.015
SD **16.4821.79338.3591.0520.018
Exceeding rate0.00%0.00%0.00%50.00%0.00%
7 (Inner Mongolia Qihua Sulfuric Acid Factory, Bayannaoer, China, 12)Average22.0865.87419.6000.1280.012
Maximum24.7009.47022.9000.1710.019
Minimum17.3004.64017.4000.0860.007
Median22.8005.36019.0000.1120.012
SD **2.4901.6241.7760.0320.004
Exceeding rate0.00%0.00%0.00%0.00%0.00%
8 (Urad Houqi Qianzhen Mineral Concentration Co., Ltd., Bayannaoer, China, 18)Average27.95019.890323.9002.5960.055
Maximum41.10044.510999.6006.7260.118
Minimum11.6006.60031.4000.2210.014
Median29.05016.065194.2501.8680.044
SD **10.54114.417367.4862.7000.042
Exceeding rate0.00%50.00%50.00%50.00%0.00%
9 (Bayan Nur Feishang Copper Co., Ltd., Bayannaoer, China, 12)Average71.08312.042120.7831.3660.056
Maximum248.10033.910508.6004.8390.195
Minimum17.2004.82028.1000.1590.014
Median23.6007.73553.7500.4400.029
SD **89.0869.189143.2381.7240.055
Exceeding rate25.00%25.00%8.33%41.67%0.00%
10 (Urad Houqi Yifengxi Chemistry Co., Ltd., Bayannaoer, China, 12)Average26.48328.122163.0421.4650.028
Maximum41.50052.580397.4002.6460.042
Minimum15.9009.57089.4000.9210.011
Median23.65024.835135.8001.3520.028
SD **8.14015.82677.7250.5180.011
Exceeding rate0.00%66.67%8.33%100.00%0.00%
11 (Urad Houqi Oubulage Copper Mineral Co., Ltd., Bayannaoer, China, 16)Average38.856110.89626.6130.2890.022
Maximum57.900478.69068.0000.9590.053
Minimum22.40013.56015.5000.0850.013
Median38.30029.90022.0000.1430.016
SD **8.496155.52413.2880.2760.012
Exceeding rate0.00%56.25%0.00%18.75%0.00%
12 (Bayan Nur West Copper Co., Ltd., Bayannaoer, China, 16)Average29.2567.78927.7170.0800.010
Maximum43.80010.01038.9000.1390.016
Minimum21.9006.19018.1000.0590.008
Median27.6007.32027.5000.0760.009
SD **6.4291.1225.7020.0190.002
Exceeding rate0.00%0.00%0.00%0.00%0.00%
13 (Urad Houqi Xinxing Mining Co., Ltd., Bayannaoer, China, 16)Average39.7009.65523.0000.0800.015
Maximum67.90013.58034.7000.1350.022
Minimum16.6005.21014.4000.0490.010
Median34.90010.38022.4000.0730.015
SD **18.5222.6485.8060.0270.004
Exceeding rate0.00%0.00%0.00%0.00%0.00%
14 (Urad Houqi Ebutu Nickel Mineral Co., Ltd., Bayannaoer, China, 16)Average38.1157.28117.6080.0670.012
Maximum54.1008.46018.7000.0840.015
Minimum32.3006.17016.1000.0450.009
Median35.2007.24017.6000.0650.011
SD **6.3630.7400.8370.0120.002
Exceeding rate0.00%0.00%0.00%0.00%0.00%
Note: * Sites 2 and 3 are too near and they are located in the same gully region, so they are integrated into one investigated site. ** SD means standard deviation.
Table 4. Soil arsenic and heavy metal pollution assessment results by pollution index methods.
Site ID Single Factor Pollution Index ValueNemerow Comprehensive Pollution IndexResult
CrAsPbCdHg
1Maximum0.29510.5390.3341.0970.0157.652Heavy pollution
Minimum0.2460.5270.0680.2220.0190.403Clean
Average0.3021.2870.2430.7850.0151.084Light pollution
2, 3Maximum0.6670.7460.0920.3320.0190.589Clean
Minimum0.3770.3220.0910.3650.0190.314Clean
Average0.3730.4670.0950.4040.0200.408Clean
4Maximum0.2060.4430.1601.2000.0480.897Warning
Minimum0.2480.4960.0770.3850.0280.392Clean
Average0.2440.4600.1020.6380.0300.517Clean
5Maximum0.1980.3900.21548.4252.25335.007Heavy pollution
Minimum0.1620.3770.0800.7670.0210.577Clean
Average0.2130.4510.1397.0770.3275.140Heavy pollution
6Maximum0.3860.7850.4665.8230.0394.252Heavy pollution
Minimum0.1380.4060.0710.3370.0090.317Light pollution
Average0.2110.4400.1781.7900.0241.330Light pollution
7Maximum0.1660.4150.0540.1780.0110.316Clean
Minimum0.0990.2060.0580.1870.0120.166Clean
Average0.1000.2650.0560.2140.0120.220Clean
8Maximum0.5312.2263.99822.4200.39416.396Heavy pollution
Minimum0.0910.3840.0900.4620.0240.359Clean
Average0.2891.1521.2168.4650.1396.215Heavy pollution
9Maximum1.9852.7131.4537.9080.1955.944Heavy pollution
Minimum0.1450.3880.1140.4300.0140.341Clean
Average0.5610.9370.3452.2770.0561.765Light pollution
10Maximum0.4441.6041.1858.8200.1406.471Heavy pollution
Minimum0.2101.2790.3111.5350.0281.185Light pollution
Average0.2611.6130.5644.3150.0663.202Heavy pollution
11Maximum0.31438.2950.1181.2500.04627.664Heavy pollution
Minimum0.1590.5920.0650.1900.0150.443Light pollution
Average0.2077.6250.0760.4810.0225.523Heavy pollution
12Maximum0.2180.7380.1110.2320.0100.554Clean
Minimum0.1610.3800.0590.1280.0130.288Clean
Average0.2070.5580.0790.1330.0100.419Clean
13Maximum0.2360.7400.0640.1330.0170.550Clean
Minimum0.1280.3830.0740.1250.0150.290Clean
Average0.1900.4820.0660.1330.0150.363Clean
14Maximum0.2820.6770.0490.1070.0150.505Clean
Minimum0.1380.2860.0470.1070.0110.219Clean
Average0.2590.4880.0500.1120.0120.369Clean
Table 5. Statistical description of arsenic and heavy metals in surface soil in the Dongshengmiao mining area (dry weight).
ElementsMinimum (mg/kg)Maximum (mg/kg)Average (mg/kg)SDCVSkewnessKurtosis
Cr-99.1837.2119.100.511.003.54
Ni8.9852.8129.2510.520.360.17−0.29
Cu11.84200.0637.1840.231.083.1811.05
Zn40.623177.46564.88960.391.702.073.14
As-599.9684.24142.831.702.386.07
Cd0.0811.701.302.652.043.1810.32
Pb18.18551.4656.13106.641.904.3820.38
Note: SD and CV indicate standard deviation and coefficient of variation, respectively.
Table 6. Spearman correlation analysis between elements.
ElementsCrNiCuZnAsCdPb
Cr1.0000.748 **0.594 **0.0770.0280.0840.229
Ni-1.0000.805 **0.341 *0.399 *0.423 *0.534 **
Cu--1.0000.542 **0.447 *0.644 **0.785 **
Zn---1.0000.503 **0.858 **0.599 **
As----1.0000.633 **0.545 **
Cd-----1.0000.795 **
Pb------1.000
Note: ** Correlation is significant at the 0.01 level. * Correlation is significant at the 0.05 level.
Table 7. The contents of arsenic and heavy metals in the samples for each profile (dry weight, unit: mg/kg).
Location/ProfileIDCrNiCuZnAsCdPb
Wastewater drainage ditch of the Zijin smelting plant (A)A-10.0012.0913.09112.479.400.4818.18
A-228.448.206.5149.024.260.1114.97
A-348.5413.2014.14386.5631.711.8926.56
A-446.3419.8322.011254.1643.415.0330.01
Front belt of a mining area (B)B-122.0718.3919.99100.693.260.3029.19
B-226.2525.4923.54908.94236.210.5728.59
B-316.5021.9521.391087.89272.060.5325.31
Surrounding agricultural soil of a mining area (C)C-129.5539.2727.082837.19599.961.4426.60
C-234.5036.6925.921393.44300.860.7722.67
C-345.0039.7728.561032.84261.860.6523.10
C-429.9626.2620.2463.720.000.1536.42
Surrounding agricultural soil of an alluvial plain (D)D-137.8037.7927.4865.16293.211.0229.30
D-231.5032.9021.6347.6761.220.1319.44
D-343.7432.7625.4074.8616.890.1520.40
D-440.4031.3825.6666.184.720.1621.66
Surrounding agricultural soil of an alluvial plain (E)E-153.7044.3931.8866.9931.790.2125.79
E-252.0544.1832.8267.0859.130.2226.43
E-337.6548.3236.0374.4547.360.2128.58
E-430.7534.3025.4070.750.000.1621.54
Surrounding forestry soil of an alluvial plain (F) F-112.6022.5617.2146.1916.970.1523.36
F-217.1049.5219.0240.2264.290.1223.45
F-39.0021.5615.5934.7336.810.1423.00
F-45.8527.2022.3165.728.540.2523.12
Surrounding agricultural soil of a mining area (G)G-115.3021.0215.691149.54290.960.5922.86
G-216.2026.0120.131006.7451.690.5524.08
G-343.5035.6927.741242.39280.810.7226.00
G-433.1530.4229.181276.59294.410.7526.49

