Healthy Diets in Rural Victoria—Cheaper than Unhealthy Alternatives, Yet Unaffordable

 , , ,
, , ,  ,
,
Abstract
:1. Introduction
‘If it’s not available or you cannot afford it, then you cannot eat it even if you wanted to!’.[1] (p. 363)
2. Materials and Methods
2.1. Study Context and Selection of Study Site
2.2. Selection of Data Collection Tool
2.3. Selection of Retail Food Outlets
2.4. Data Collection
2.5. Data Entry
2.6. Data Analysis
3. Results
4. Discussion
5. Strengths and Limitations
6. Conclusions
Supplementary Materials
Author Contributions
Funding
Acknowledgments
Conflicts of Interest
Appendix A

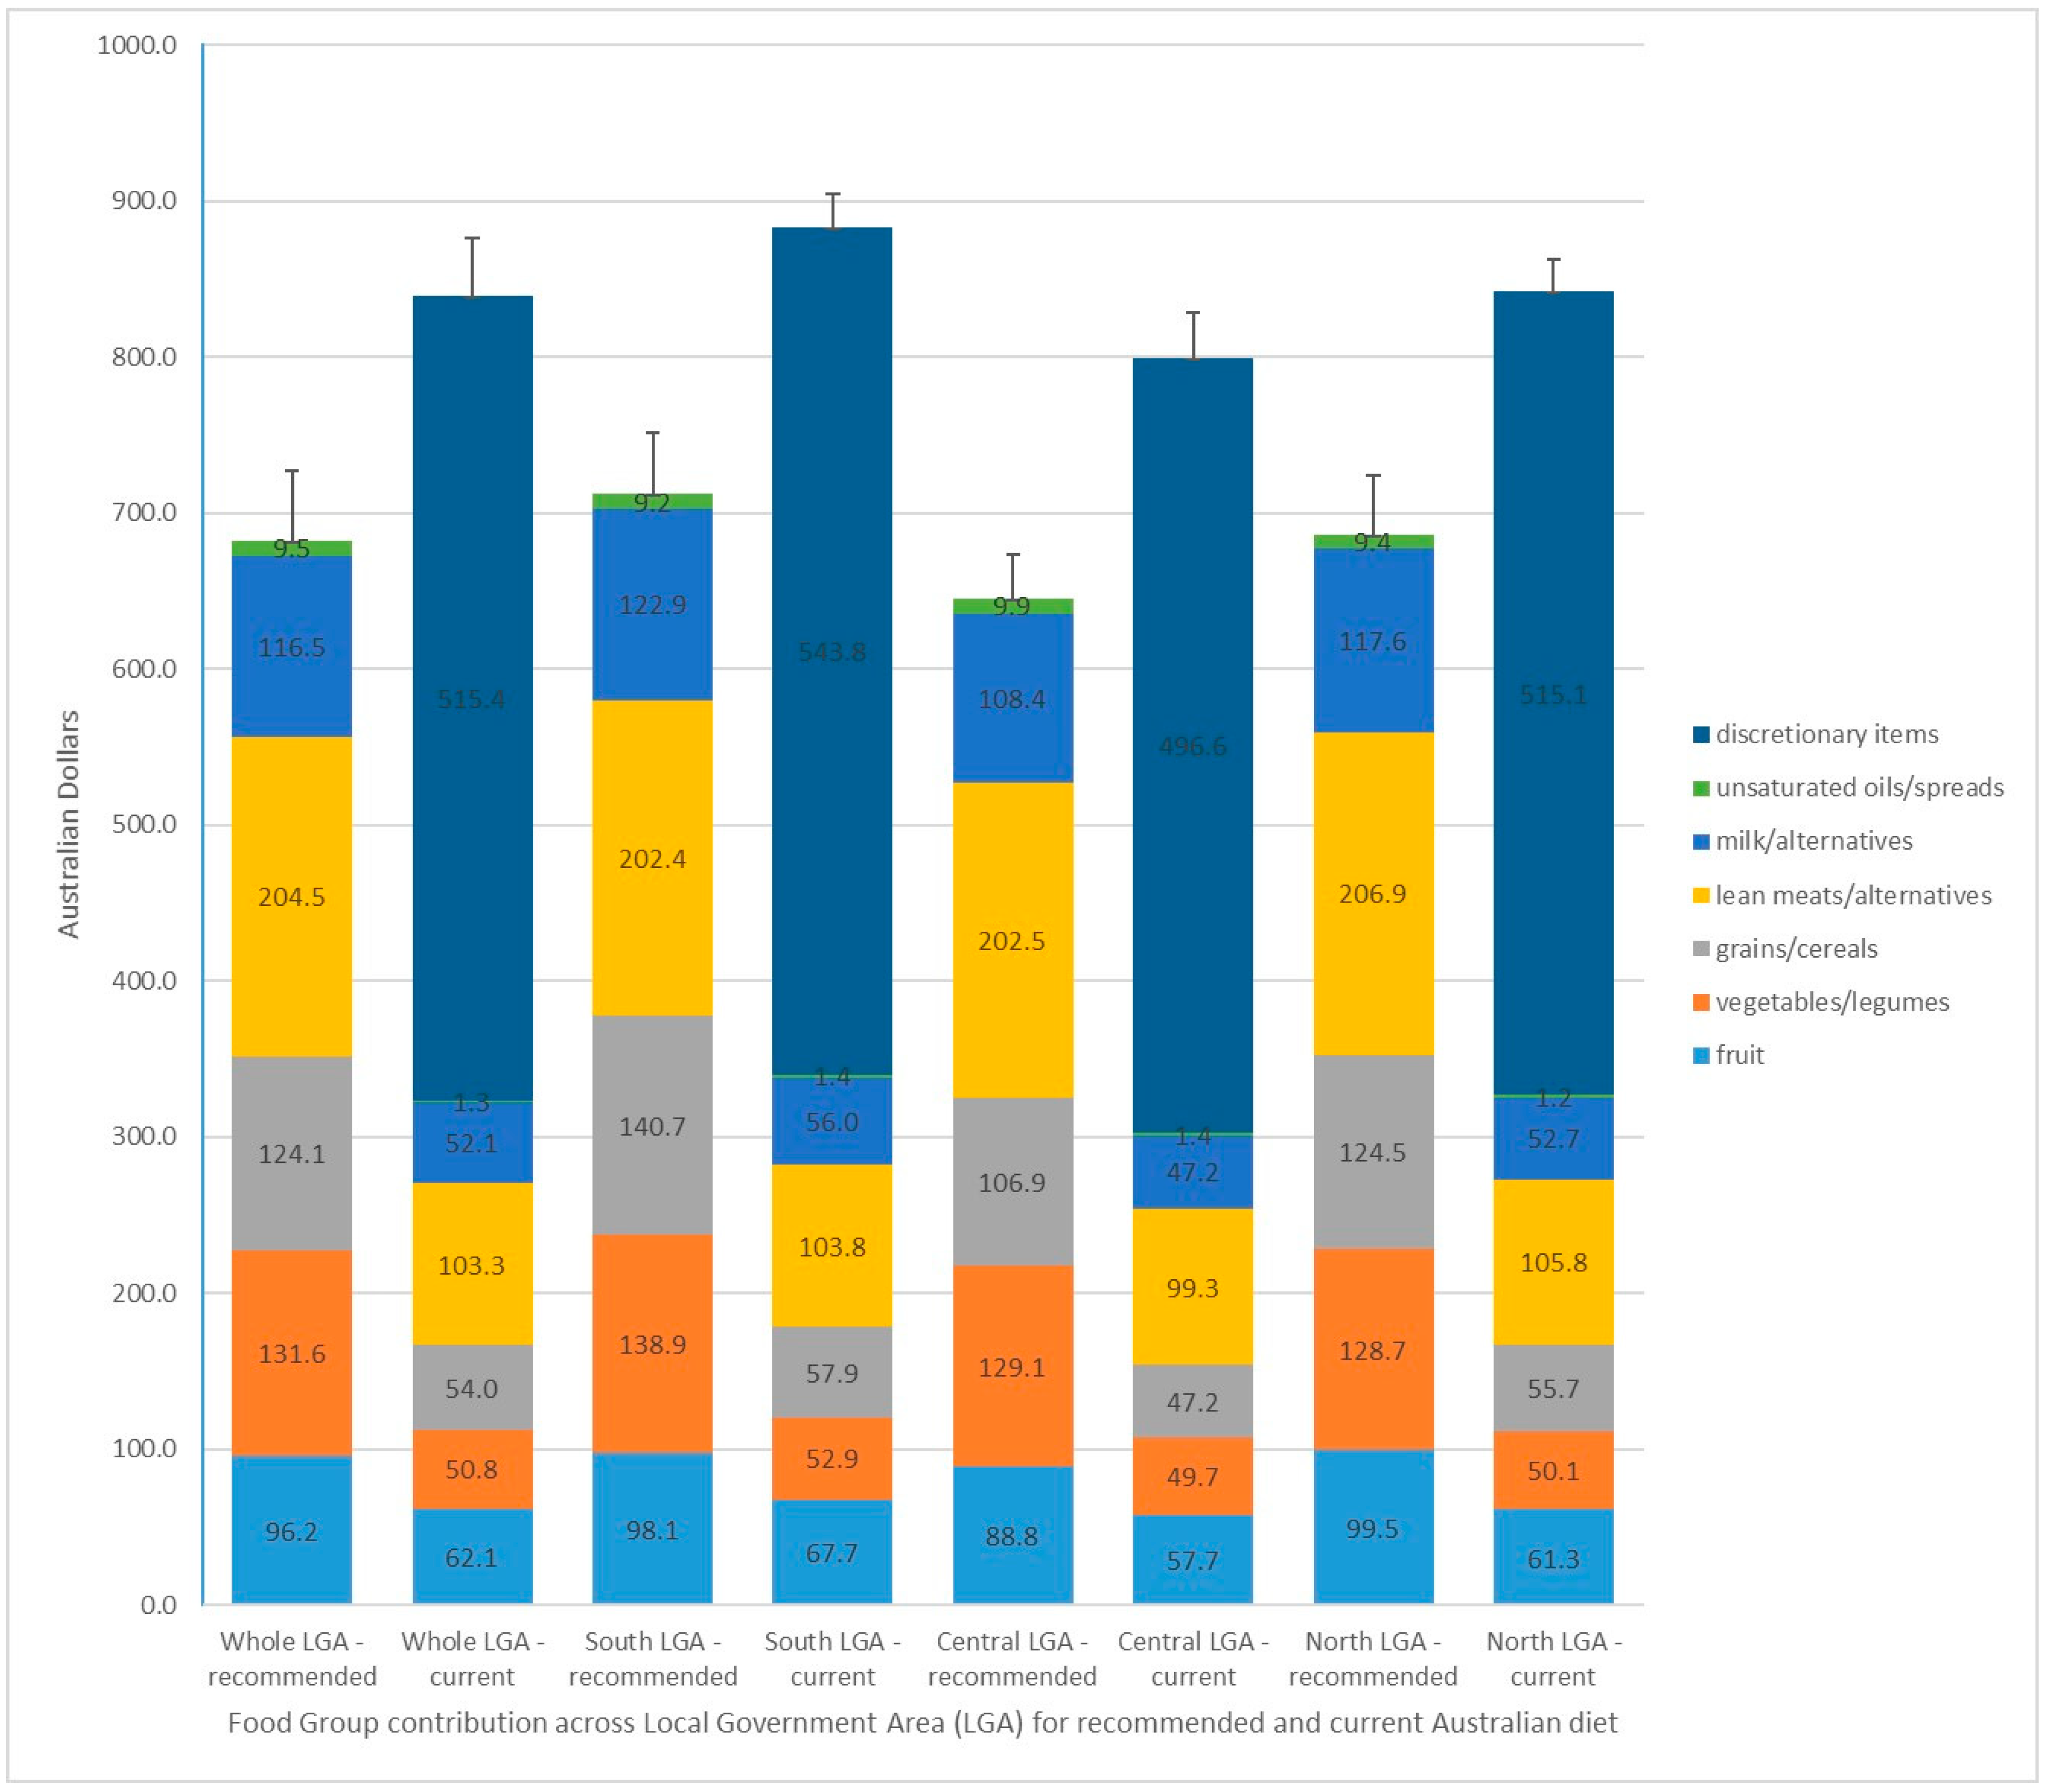
| Northern LGA = towns 1,2,3,4,5; Central LGA = towns 6,7; Southern LGA = towns 8,9,10 | Whole LGA—Recommended Diet | Whole LGA—Current Diet | Southern LGA—Recommended Diet | Southern LGA—Current Diet | Central LGA—Recommended Diet | Central LGA—Current Diet | Northern LGA—Recommended Diet | Northern LGA—Current Diet |
|---|---|---|---|---|---|---|---|---|
| TOTAL DIET $mean ±sd | 702.41 ± 44.89 | 866.19 ± 37.54 | 733.31 ± 39.70 | 901.38 ± 20.87 | 661.96 ± 27.66 | 823.23 ± 29.55 | 708.14 ± 37.96 | 870.86 ± 21.02 |
| CORE 5 FOOD GROUP FOODS $mean +sd (%total diet cost) | 702.41 ± 44.89 (100.0%) | 343.47 ± 26.93 (39.65%) | 733.31 ± 39.70 (100%) | 360.24 ± 23.33 (39.97%) | 661.96 ± 27.66 (100%) | 318.79 ± 19.23 (38.72%) | 708.14 ± 37.96(100%) | 348.20 ± 22.15 (39.98%) |
| FRUIT $mean ±sd (%total diet cost) | 96.20 ± 13.89 (13.70%) | 62.06 ± 11.45 (7.16%) | 98.14 ± 15.29 (13.38%) | 67.73 ± 12.11 (7.51%) | 88.77 ± 2.48 (13.41%) | 57.65 ± 2.35 (7.00%) | 99.49 ± 15.30 (14.05%) | 61.31 ± 12.87 (7.04%) |
| VEGETABLES/LEGUMES $mean ±sd (%total diet cost) | 131.61 ± 8.71 (18.74%) | 50.77 ± 4.39 (5.86%) | 138.87 ± 1.15 (18.94%) | 52.90 ± 2.75 (5.87%) | 129.14 ± 10.15 (19.51%) | 49.74 ± 5.13 (6.04%) | 128.74 ± 7.80 (18.18%) | 50.10 ± 4.26 (5.75%) |
| FRUIT & VEG/LEGUMES $mean ±sd (%total diet cost) | 227.81 ± 18.81 (32.43%) | 112.83 ± 13.00 (13.03%) | 237.01 ± 15.77 (32.32%) | 120.64 ± 12.67 (13.38%) | 217.90 ± 11.33 (32.92%) | 107.39 ± 7.33 (13.04%) | 228.23 ± 21.02 (32.23%) | 111.41 ± 13.66 (12.79%) |
| GRAINS/CEREALS $mean ±sd (%total diet cost) | 124.11 ± 17.69 (17.67%) | 53.98 ± 5.13 (6.23%) | 140.70 ± 13.93 (19.19%) | 57.93 ± 3.86 (6.43%) | 106.86 ± 8.71 (16.14%) | 47.22 ± 2.06 (5.74%) | 124.50 ± 13.52(17.58%) | 55.68 ± 2.63 (6.39%) |
| LEAN MEATS & ALT $mean ±sd (%total diet cost) | 204.48 ± 9.05 (29.11%) | 103.27 ± 6.56 (11.92%) | 202.41 ± 11.03 (27.60%) | 103.80 ± 6.06 (11.44%) | 202.54 ± 10.10 (30.60%) | 99.32 ± 7.22 (12.06%) | 206.88 ± 5.94 (29.22%) | 105.76 ± 5.08 (12.14%) |
| MILK & ALT $mean ±sd (%total diet cost) | 116.54 ± 6.64 (16.59%) | 52.08 ± 4.82 (6.01%) | 122.86 ± 3.30 (16.75%) | 55.99 ± 4.79 (6.21%) | 108.40 ± 5.41 (16.38%) | 47.17 ± 2.80 (5.73%) | 117.64 ± 2.83 (16.61%) | 52.67 ± 2.94 (6.05%) |
| UNSATURATED OILS/SPREADS $mean +sd (%total diet cost) | 9.47 ± 0.86 (1.35%) | 1.30 ± 0.19 (1.15%) | 9.16 ± 1.25 (1.25%) | 1.43 ± 0.19 (0.16%) | 9.92 ± 0.22 (1.50%) | 1.36 ± 0.07 (0.17%) | 9.39 ± 0.69 (1.33%) | 1.19 ± 0.17 (0.14%) |
| WATER$mean +sd (%total diet cost) | 20.00 ± 5.90 (2.85%) | 20.00 ± 5.90 (2.31%) | 21.18 ± 8.31 (2.89%) | 21.18 ± 8.31 (2.35%) | 16.33 ± 5.55 (2.47%) | 16.33 ± 5.55 (1.98%) | 21.50 ± 2.32 (3.04%) | 21.50 ± 2.32 (2.47%) |
| ALL DISCRETIONARY FOODS $mean +sd (%total diet cost) | 515.42 ± 22.77 (59.50%) | 534.77 ± 28.41 (59.33%) | 496.63 ± 17.77 (60.33%) | 515.08 ± 5.49 (59.15%) | ||||
| TAKE-AWAY FOODS $mean +sd (%total diet cost) | 156.67 ± 15.29 (18.09%) | 172.48 ± 19.10 (19.13%) | 149.97 ± 3.06 (18.22%) | 151.20 ± 9.14 (17.36%) | ||||
| ARTIFICIALLY SWEETENED BEVERAGES $mean +sd (%total diet cost) | 7.31 ± 1.10 (0.84%) | 6.37 ± 0.93 (0.71%) | 7.81 ± 0.91 (0.95%) | 7.58 ± 0.96 (0.87%) | ||||
| SUGAR SWEETENED BEVERAGES$mean +sd (%total diet cost) | 44.03 ± 6.66 (5.08%) | 38.37 ± 5.63 (4.26%) | 47.05 ± 5.46(5.72%) | 45.61 ± 5.79 (5.24%) | ||||
| ALCOHOLIC BEVERAGES $mean +sd (%total diet cost) | 97.33 ± 9.74 (11.24%) | 102.63 ± 12.40 (11.39%) | 88.45 ± 6.96 (10.74%) | 99.47 ± 4.30 (11.42%) |
References
- Burns, C.; Friel, S. It’s time to determine the cost of a healthy diet in Australia. ANZJPH 2007, 31, 363–365. [Google Scholar] [CrossRef]
- HLPE. Food Security and Climate Change; Committee on World Food Security: Rome, Italy, 2012. [Google Scholar]
- McKechnie, R.; Turrell, G.; Giskes, K.; Gallegos, D. Single-item measure of food insecurity used in the national health survey may underestimate prevalence in Australia. ANZJPH 2018, 42, 389–395. [Google Scholar] [CrossRef] [PubMed]
- ABS. Australian National Health Survey—First Results 2014–2015; Australian Bureau of Statistics: Canberra, Australia, 2015.
- Franklin, B.; Jones, A.; Love, D.; Puckett, S.; Macklin, J.; White-Means, S. Exploring mediators of food insecurity and obesity: A review of recent literature. J. Community Health 2012, 37, 253–264. [Google Scholar] [CrossRef] [PubMed]
- Abarca-Gómez, L.; Abdeen, Z.A.; Hamid, Z.A.; Abu-Rmeileh, N.M.; Acosta-Cazares, B.; Acuin, C.; Adams, R.J.; Aekplakorn, W.; Afsana, K.; Aguilar-Salinas, C.A.; et al. Worldwide trends in body-mass index, underweight, overweight, and obesity from 1975 to 2016: A pooled analysis of 2416 population based measurement studies in 128·9 million children, adolescents, and adults. Lancet 2017, 390, 2627–2642. [Google Scholar] [CrossRef]
- AIHW. Australian Burden of Disease: Impact of Overweight and Obesity as a Risk Factor for Chronic Conditions; Australian Institute of Health and Welfare: Canberra, Australia, 2017.
- Glanz, K.; Johnson, L.; Yaroch, A.L.; Phillips, M.; Ayala, G.X.; Davis, E.L. Measures of retail food store environments and sales: Review and implications for healthy eating initiatives. J. Nutr. Educ. Behav. 2016, 48, 280.e1–288.e1. [Google Scholar] [CrossRef] [PubMed]
- Swinburn, B.A.; Sacks, G.; Hall, K.D.; McPherson, K.; Finegood, D.T.; Moodie, M.L.; Gortmaker, S.L. The global obesity pandemic: Shaped by global drivers and local environments. Lancet 2011, 378, 804–814. [Google Scholar] [CrossRef]
- Backholer, K.; Spencer, E.; Gearon, E.; Magliano, D.J.; McNaughton, S.A.; Shaw, J.E.; Peeters, A. The association between socio-economic position and diet quality in Australian adults. Public Health Nutr. 2016, 19, 477–485. [Google Scholar] [CrossRef] [PubMed]
- AIHW. Australian Burden of Disease Study: Impact and Causes of Illness and Deaths in Australia 2011; Australian Institute of Health and Welfare: Canberra, Australia, 2016.
- ABS. Australian Health Survey—Consumption of Food Groups from the Australian Dietary Guidelines 2011–2012; Australian Bureau of Statistics: Canberra, Australia, 2016.
- Lewis, M.; Lee, A. Costing ‘healthy’ food baskets in Australia—A systematic review of food price and affordability monitoring tools, protocols and methods. Public Health Nutr. 2016, 19, 2872–2886. [Google Scholar] [CrossRef] [PubMed]
- State Government of Victoria. Victorian Population Health Survey 2012; Department of Health and Human Services: Melbourne, Australia, 2016.
- National Rural Health Alliance. Food Security and Health in Rural and Remote AUSTRALIA; Rural Industries Research and Development Corporation, Australian Government: Deakin West, ACT, Australia, 2016.
- Palermo, C.; McCartan, J.; Kleve, S.; Sinha, K.; Shiell, A. A longitudinal study of the cost of food in victoria influenced by geography and nutritional quality. ANZJPH 2016, 40, 270–273. [Google Scholar] [CrossRef] [PubMed]
- Ward, P.R.; Coveney, J.; Verity, F.; Carter, P.; Schilling, M. Cost and affordability of healthy food in rural South Australia. Rural Remote Health 2012, 12, 1938. [Google Scholar] [PubMed]
- Innes-Hughes, C.; Boylan, S.; King, L.; Lobb, E. Measuring the food environment in three rural towns in New South Wales, Australia. Health Promot. J. Aust. 2012, 23, 129–133. [Google Scholar] [CrossRef]
- Palermo, C.E.; Walker, K.Z.; Hill, P.; McDonald, J. The cost of healthy food in rural Victoria. Rural Remote Health 2008, 8, 1074. [Google Scholar] [PubMed]
- Chapman, K.; Innes-Hughes, C.; Goldsbury, D.; Kelly, B.; Bauman, A.; Allman-Farinelli, M. A comparison of the cost of generic and branded food products in Australian supermarkets. Public Health Nutr. 2013, 16, 894–900. [Google Scholar] [CrossRef] [PubMed]
- Lee, A.J.; Kane, S.; Ramsey, R.; Good, E.; Dick, M. Testing the price and affordability of healthy and current (unhealthy) diets and the potential impacts of policy change in Australia. BMC Public Health 2016, 16, 315. [Google Scholar] [CrossRef] [PubMed]
- Lee, A.; Mhurchu, C.N.; Sacks, G.; Swinburn, B.; Snowdon, W.; Vandevijvere, S.; Hawkes, C.; L’Abbe, M.; Rayner, M.; Sanders, D.; et al. Monitoring the price and affordability of foods and diets globally. Obes. Rev. 2013, 14 (Suppl. 1), 82–95. [Google Scholar] [CrossRef] [Green Version]
- Lee, A.; Kane, S.; Lewis, M.; Good, E.; Pollard, C.M.; Landrigan, T.J.; Dick, M. Healthy Diets ASAP—Australian Standardised Affordability and Pricing methods protocol. BMC Nutr. J. 2018, 17, 88. [Google Scholar] [CrossRef] [PubMed]
- NHMRC. Australian Dietary Guidelines; National Health and Medical Research Council: Canberra, Australia, 2013. Available online: http://www.eatforhealth.gov.au (accessed on 26 August 2018).
- ABS. Australian Health Survey—First Results 2011–2012; Australian Bureau of Statistics: Canberra, Australia, 2012.
- ABS. Census of Population and Housing—Quickstats, Community Profiles and Datapacks User Guide. Available online: http://quickstats.censusdata.abs.gov.au/census_services/getproduct/census/2016/quickstat/LGA27630 (accessed on 28 August 2017).
- AIHW. Rural, Regional and Remote Health: A Guide to Remoteness Classifications; Australian Institute of Health and Welfare: Canberra, Australia, 2004.
- Wimmera Primary Care Partnership. Wimmera Population Health and Wellbeing Profile 2016; Wimmera Primary Care Partnership: Horsham, Victoria, Australia, 2016. [Google Scholar]
- State Government of Victoria. Change and Disadvantage in the Grampians Region, Vvictoria; Department of Planning and Community Development: Melbourne, Australia, 2011.
- State Government of Victoria. Victorian Population Health Survey 2014: Modifiable Risk Factors Contributing to Chronic Disease in Victoria; Department of Health and Human Services: Melbourne, Australia, 2016.
- Caspi, C.E.; Friebur, R. Modified ground-truthing: An accurate and cost-effective food environment validation method for town and rural areas. IJBNPA 2016, 13, 37. [Google Scholar] [CrossRef] [PubMed]
- Australian Government Department of Human Services. Social and Health Payments and Services. Available online: https://www.humanservices.gov.au/ (accessed on 28 August 2017).
- Rao, M.; Afshin, A.; Singh, G.; Mozaffarian, D. Do healthier foods and diet patterns cost more than less healthy options? A systematic review and meta-analysis. BMJ Open 2013, 3, e004277. [Google Scholar] [CrossRef] [PubMed] [Green Version]
- Australian Taxation Office, A.G. GST-Free Food. Available online: https://www.ato.gov.au/Business/GST/In-detail/Your-industry/Food/GST-and-food/?anchor=GSTfreefood (accessed on 3 July 2018).
- Rossimel, A.; Han, S.S.; Larsen, K.; Palermo, C. Access and affordability of nutritious food in metropolitan Melbourne. Nutr. Diet. 2016, 73, 13–18. [Google Scholar] [CrossRef]
- Harrison, M.; Lee, A.; Findlay, M.; Nicholls, R.; Leonard, D.; Martin, C. The increasing cost of healthy food. ANZJPH 2010, 34, 179–186. [Google Scholar] [CrossRef] [PubMed]
- Bardenhagen, C.J.; Pinard, C.A.; Pirog, R.; Yaroch, A.L. Characterizing rural food access in remote areas. J. Community Health 2017, 42, 1008–1019. [Google Scholar] [CrossRef] [PubMed]
- State Government of Victoria. VLGA Food Scan Report: Mildura Rural City Council; Healthy Together Victoria: Mildura, Australia, 2013.
- Wimmera Food Security Group. Victorian Healthy Food Basket Survey—Summer 2016–2017; Wimmera Primary Care Partnership: Horsham, Victoria, Australia, 2017. [Google Scholar]
- ABS. Australian Dietary Guideline Food Price Indexes Series 6401.1. Available online: http://www.abs.gov.au/AUSSTATS/[email protected]/Previousproducts/6401.0Feature%20Article1Dec%202015?opendocument&tabname=Summary&prodno=6401.0&issue=Dec%202015&num=&view= (accessed on 12 November 2017).
- Ghosh-Dastidar, M.; Hunter, G.; Collins, R.L.; Zenk, S.N.; Cummins, S.; Beckman, R.; Nugroho, A.K.; Sloan, J.C.; Wagner, L.; Dubowitz, T. Does opening a supermarket in a food desert change the food environment? Health Place 2017, 46, 249–256. [Google Scholar] [CrossRef] [PubMed]
- Vilaro, M.; Barnett, T. The rural food environment: A survey of food price, availability, and quality in a rural Florida community. Food Public Health 2013, 3. [Google Scholar] [CrossRef]
- Pulker, C.E.; Trapp, G.S.A.; Scott, J.A.; Pollard, C.M. What are the position and power of supermarkets in the Australian food system, and the implications for public health? A systematic scoping review. Obes. Rev. 2018, 19, 198–218. [Google Scholar] [CrossRef] [PubMed]
- Sacks, G.; Robinson, E.; Cameron, A.; INFORMAS. Inside Our Supermarkets—Assessment of Company Policies and Committments Related to Obesity Prevention and Nutrition; Deakin University: Melbourne, Australia, 2018. [Google Scholar]
- Martinez-Donate, A.P.; Riggall, A.J.; Meinen, A.M.; Malecki, K.; Escaron, A.L.; Hall, B.; Menzies, A.; Garske, G.; Nieto, F.J.; Nitzke, S. Evaluation of a pilot healthy eating intervention in restaurants and food stores of a rural community: A randomized community trial. BMC Public Health 2015, 15, 136. [Google Scholar] [CrossRef] [PubMed]
- Gittelsohn, J.; Trude, A.C.B.; Kim, H. Pricing strategies to encourage availability, purchase, and consumption of healthy foods and beverages: A systematic review. Prev. Chronic Dis. 2017, 14, E107. [Google Scholar] [CrossRef] [PubMed]
- Kim, M.; Budd, N.; Batorsky, B.; Krubiner, C.; Manchikanti, S.; Waldrop, G.; Trude, A.; Gittelsohn, J. Barriers to and facilitators of stocking healthy food options: Viewpoints of Baltimore city small storeowners. Ecol. Food Nutr. 2017, 56, 17–30. [Google Scholar] [CrossRef] [PubMed]
- Freight Improvement Toolkit; National Rural Health Alliance: Canberra, ACT, Australia, 2007.
- Queensland Health. Vegetable and Fruit Supply to South West Queensland: An Information Paper; Queensland Government: Brisbane, Australia, 2006.
- Lee, A.; Baker, P.; Stanton, R.; Friel, S.; O’Dea, K.; Weightman, A. Scoping Study to Inform the Development of the New National Nutrition Policy; (rft 028/1213); Released under FOI, March 2016; QUT, Australian Department of Health and Ageing: Queensland, Brisbane, Australia, 2013.
- The People’s Food Plan; Australian Food Sovereignty Alliance: Canberra, ACT, Australia, 2013.
- Kern, D.M.; Auchincloss, A.H.; Stehr, M.F.; Roux, A.V.D.; Moore, L.V.; Kanter, G.P.; Robinson, L.F. Neighborhood prices of healthier and unhealthier foods and associations with diet quality: Evidence from the multi-ethnic study of atherosclerosis. Int. J. Environ. Res. Public Health 2017, 14, 1394. [Google Scholar] [CrossRef] [PubMed]
- Powell, L.M.; Maciejewski, M.L. Taxes and sugar-sweetened beverages. JAMA 2018, 319, 229–230. [Google Scholar] [CrossRef] [PubMed]
| Food Groupings (Recommended Serves/Day) | Australian Dietary Guidelines—Recommended Dietary Intakes | Australian Health Survey—Current Dietary Intakes | ||
|---|---|---|---|---|
| Males | Females | Males | Females | |
| Bread and Cereals | 6 | 6 | 5.2 | 3.7 |
| Fruit | 2 | 2 | 1.2 | 1.1 |
| Vegetables | 6 | 5 | 2.8 | 2.7 |
| Dairy | 2.5 | 2.5 | 1.6 | 1.3 |
| Meat and alternatives | 3 | 2.5 | 2.2 | 1.6 |
| Discretionary items | 0 | 0 | 6.4 | 4.2 |
| Assumptions a | Fortnightly Income | |
|---|---|---|
| The family is privately renting a 3 bedroom house at $130/week | Paid employment—adult male | $1390.04 |
| The adult male works on a permanent basis at national minimum wage * ($18.29/h) for 38 h/week | Paid employment—adult female | $219.00 |
| The adult female works on a part-time basis at national minimum wage * ($18.29/h) for 6 h/week | Family Tax Benefit A ^ | $420.70 |
| Both children attend school and are fully immunised | Family Tax Benefit A supplement | $55.87 |
| None of the family are disabled | Family Tax Benefit B ^^ | $108.64 |
| The family have some emergency savings that earn negligible interest | Family Tax Benefit B Supplement | $13.62 |
| The family has negligible tax deductions | Clean Energy Supplement | $9.94 |
| Rent Assistance ** | $132.61 | |
| INCOME TAX PAID # | −$185.66 | |
| TOTAL FORTNIGHTLY INCOME | $2167.24 | |
| Retail Food Outlet by Town | Super-Market a | General Store b | Bakery | Take-Away | Café | Hotel/Pub | Service Station | Total Outlets by Town | |
|---|---|---|---|---|---|---|---|---|---|
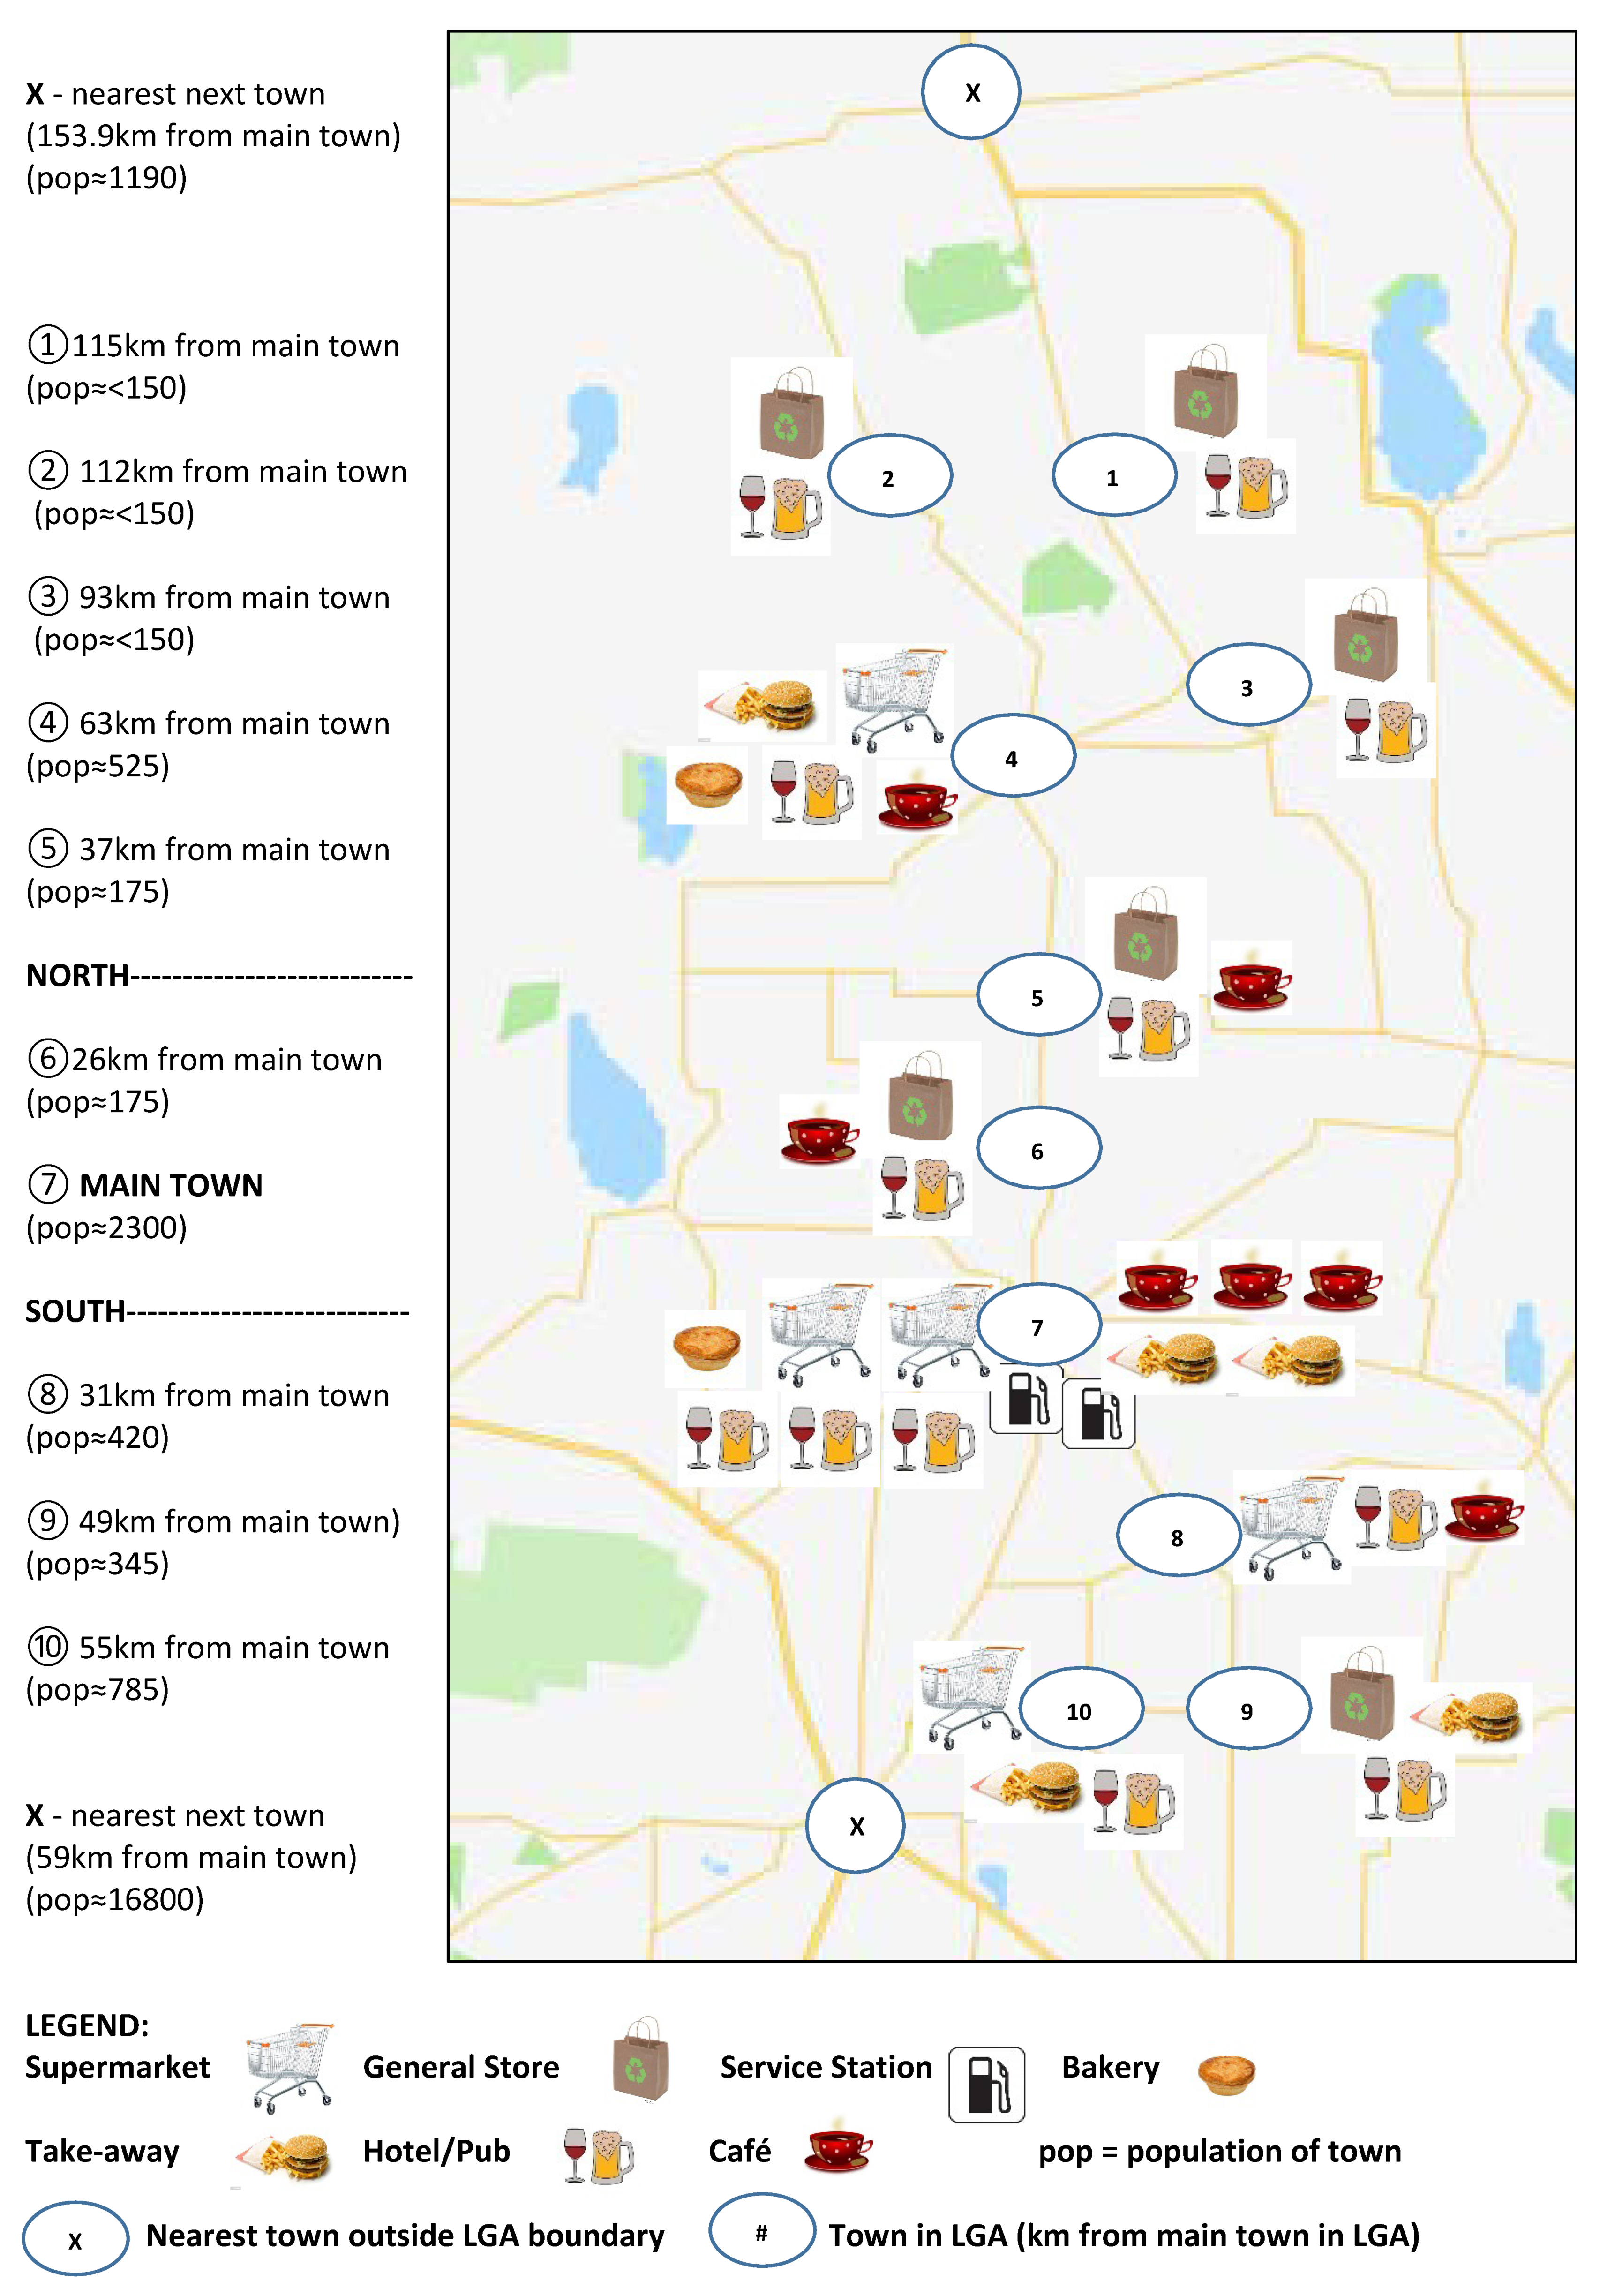
| North of LGA | Town 1 | 1 | 1 | 2 | |||||
| Town 2 | 1 | 1 | 2 | ||||||
| Town 3 | 1 | 1 | 2 | ||||||
| Town 4 | 1 | 1 | 1 | 1 | 1 | 5 | |||
| Town 5 | 1 | 1 | 1 | 3 | |||||
| Centre of LGA | Town 6 | 1 | 1 | 1 | 3 | ||||
| Town 7 | 2 | 1 | 3 | 3 | 3 | 2 | 14 | ||
| South of LGA | Town 8 | 1 | 1 | 1 | 3 | ||||
| Town 9 | 1 | 1 | 1 | 3 | |||||
| Town 10 | 1 | 1 | 1 | 3 | |||||
| Total Outlets by Type | 5 | 6 | 2 | 6 | 7 | 12 | 2 | 40 | |
| LGA Area and Town | Median Household Income ($2358) | Low Household Income ($2167) | ||
|---|---|---|---|---|
| Recommended Diet (%) | Current Diet (%) | Recommended Diet (%) | Current Diet (%) | |
| Whole of LGA | 30 | 37 | 32 | 40 |
| Town 1 | 28 | 36 | 30 | 39 |
| Town 2 | 28 | 37 | 31 | 40 |
| Town 3 | 32 | 37 | 35 | 41 |
| Town 4 | 30 | 32 | 33 | 34 |
| Town 5 | 32 | 38 | 34 | 42 |
| North of the LGA | 30 | 37 | 33 | 40 |
| Town 6 | 27 | 35 | 30 | 38 |
| Town 7 | 27–30 | 33–36 | 30–32 | 36–40 |
| Centre of the LGA | 28 | 35 | 31 | 38 |
| Town 8 | 31 | 37 | 33 | 40 |
| Town 9 | 33 | 39 | 36 | 42 |
| Town 10 | 29 | 39 | 32 | 42 |
| South of the LGA | 30 | 37 | 32 | 40 |
© 2018 by the authors. Licensee MDPI, Basel, Switzerland. This article is an open access article distributed under the terms and conditions of the Creative Commons Attribution (CC BY) license (http://creativecommons.org/licenses/by/4.0/).
Share and Cite
Love, P.; Whelan, J.; Bell, C.; Grainger, F.; Russell, C.; Lewis, M.; Lee, A. Healthy Diets in Rural Victoria—Cheaper than Unhealthy Alternatives, Yet Unaffordable. Int. J. Environ. Res. Public Health 2018, 15, 2469. https://0-doi-org.brum.beds.ac.uk/10.3390/ijerph15112469
Love P, Whelan J, Bell C, Grainger F, Russell C, Lewis M, Lee A. Healthy Diets in Rural Victoria—Cheaper than Unhealthy Alternatives, Yet Unaffordable. International Journal of Environmental Research and Public Health. 2018; 15(11):2469. https://0-doi-org.brum.beds.ac.uk/10.3390/ijerph15112469
Chicago/Turabian StyleLove, Penelope, Jillian Whelan, Colin Bell, Felicity Grainger, Cherie Russell, Meron Lewis, and Amanda Lee. 2018. "Healthy Diets in Rural Victoria—Cheaper than Unhealthy Alternatives, Yet Unaffordable" International Journal of Environmental Research and Public Health 15, no. 11: 2469. https://0-doi-org.brum.beds.ac.uk/10.3390/ijerph15112469