Exposure to Household Air Pollution from Biomass Cookstoves and Levels of Fractional Exhaled Nitric Oxide (FeNO) among Honduran Women

 , , , , , ,
Abstract
:1. Introduction
2. Materials and Methods
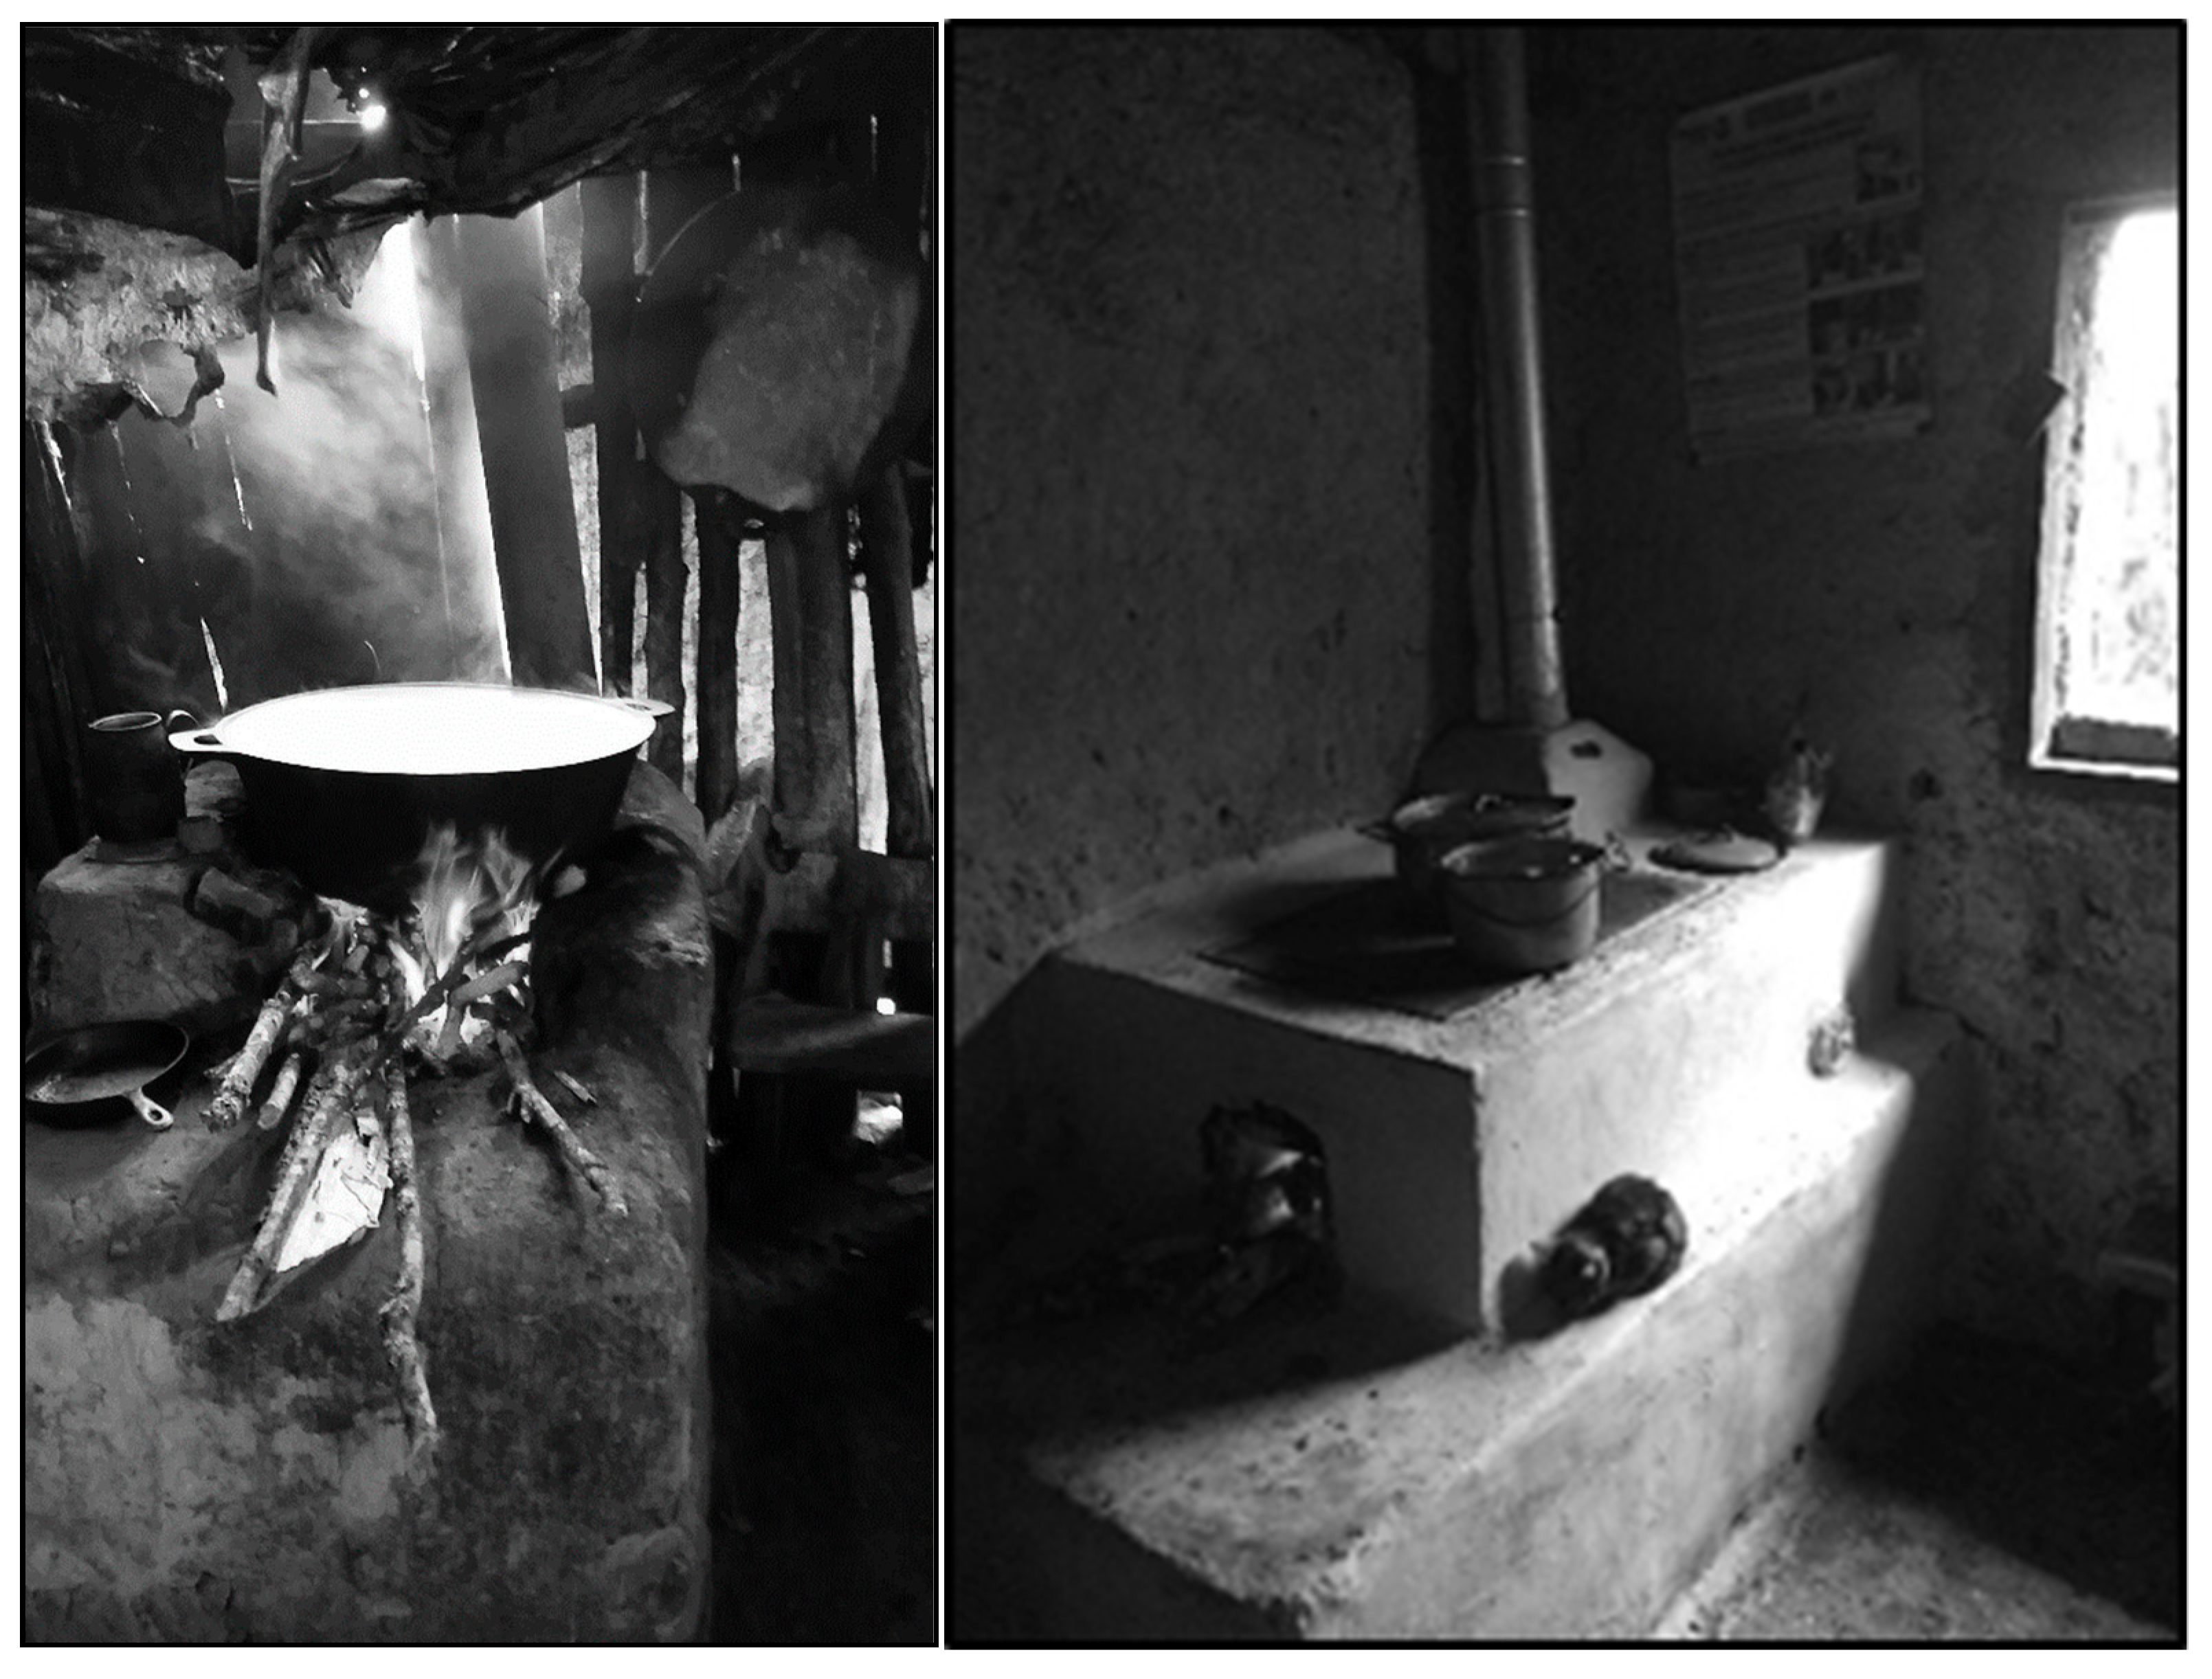
2.1. Study Setting
2.2. Participants
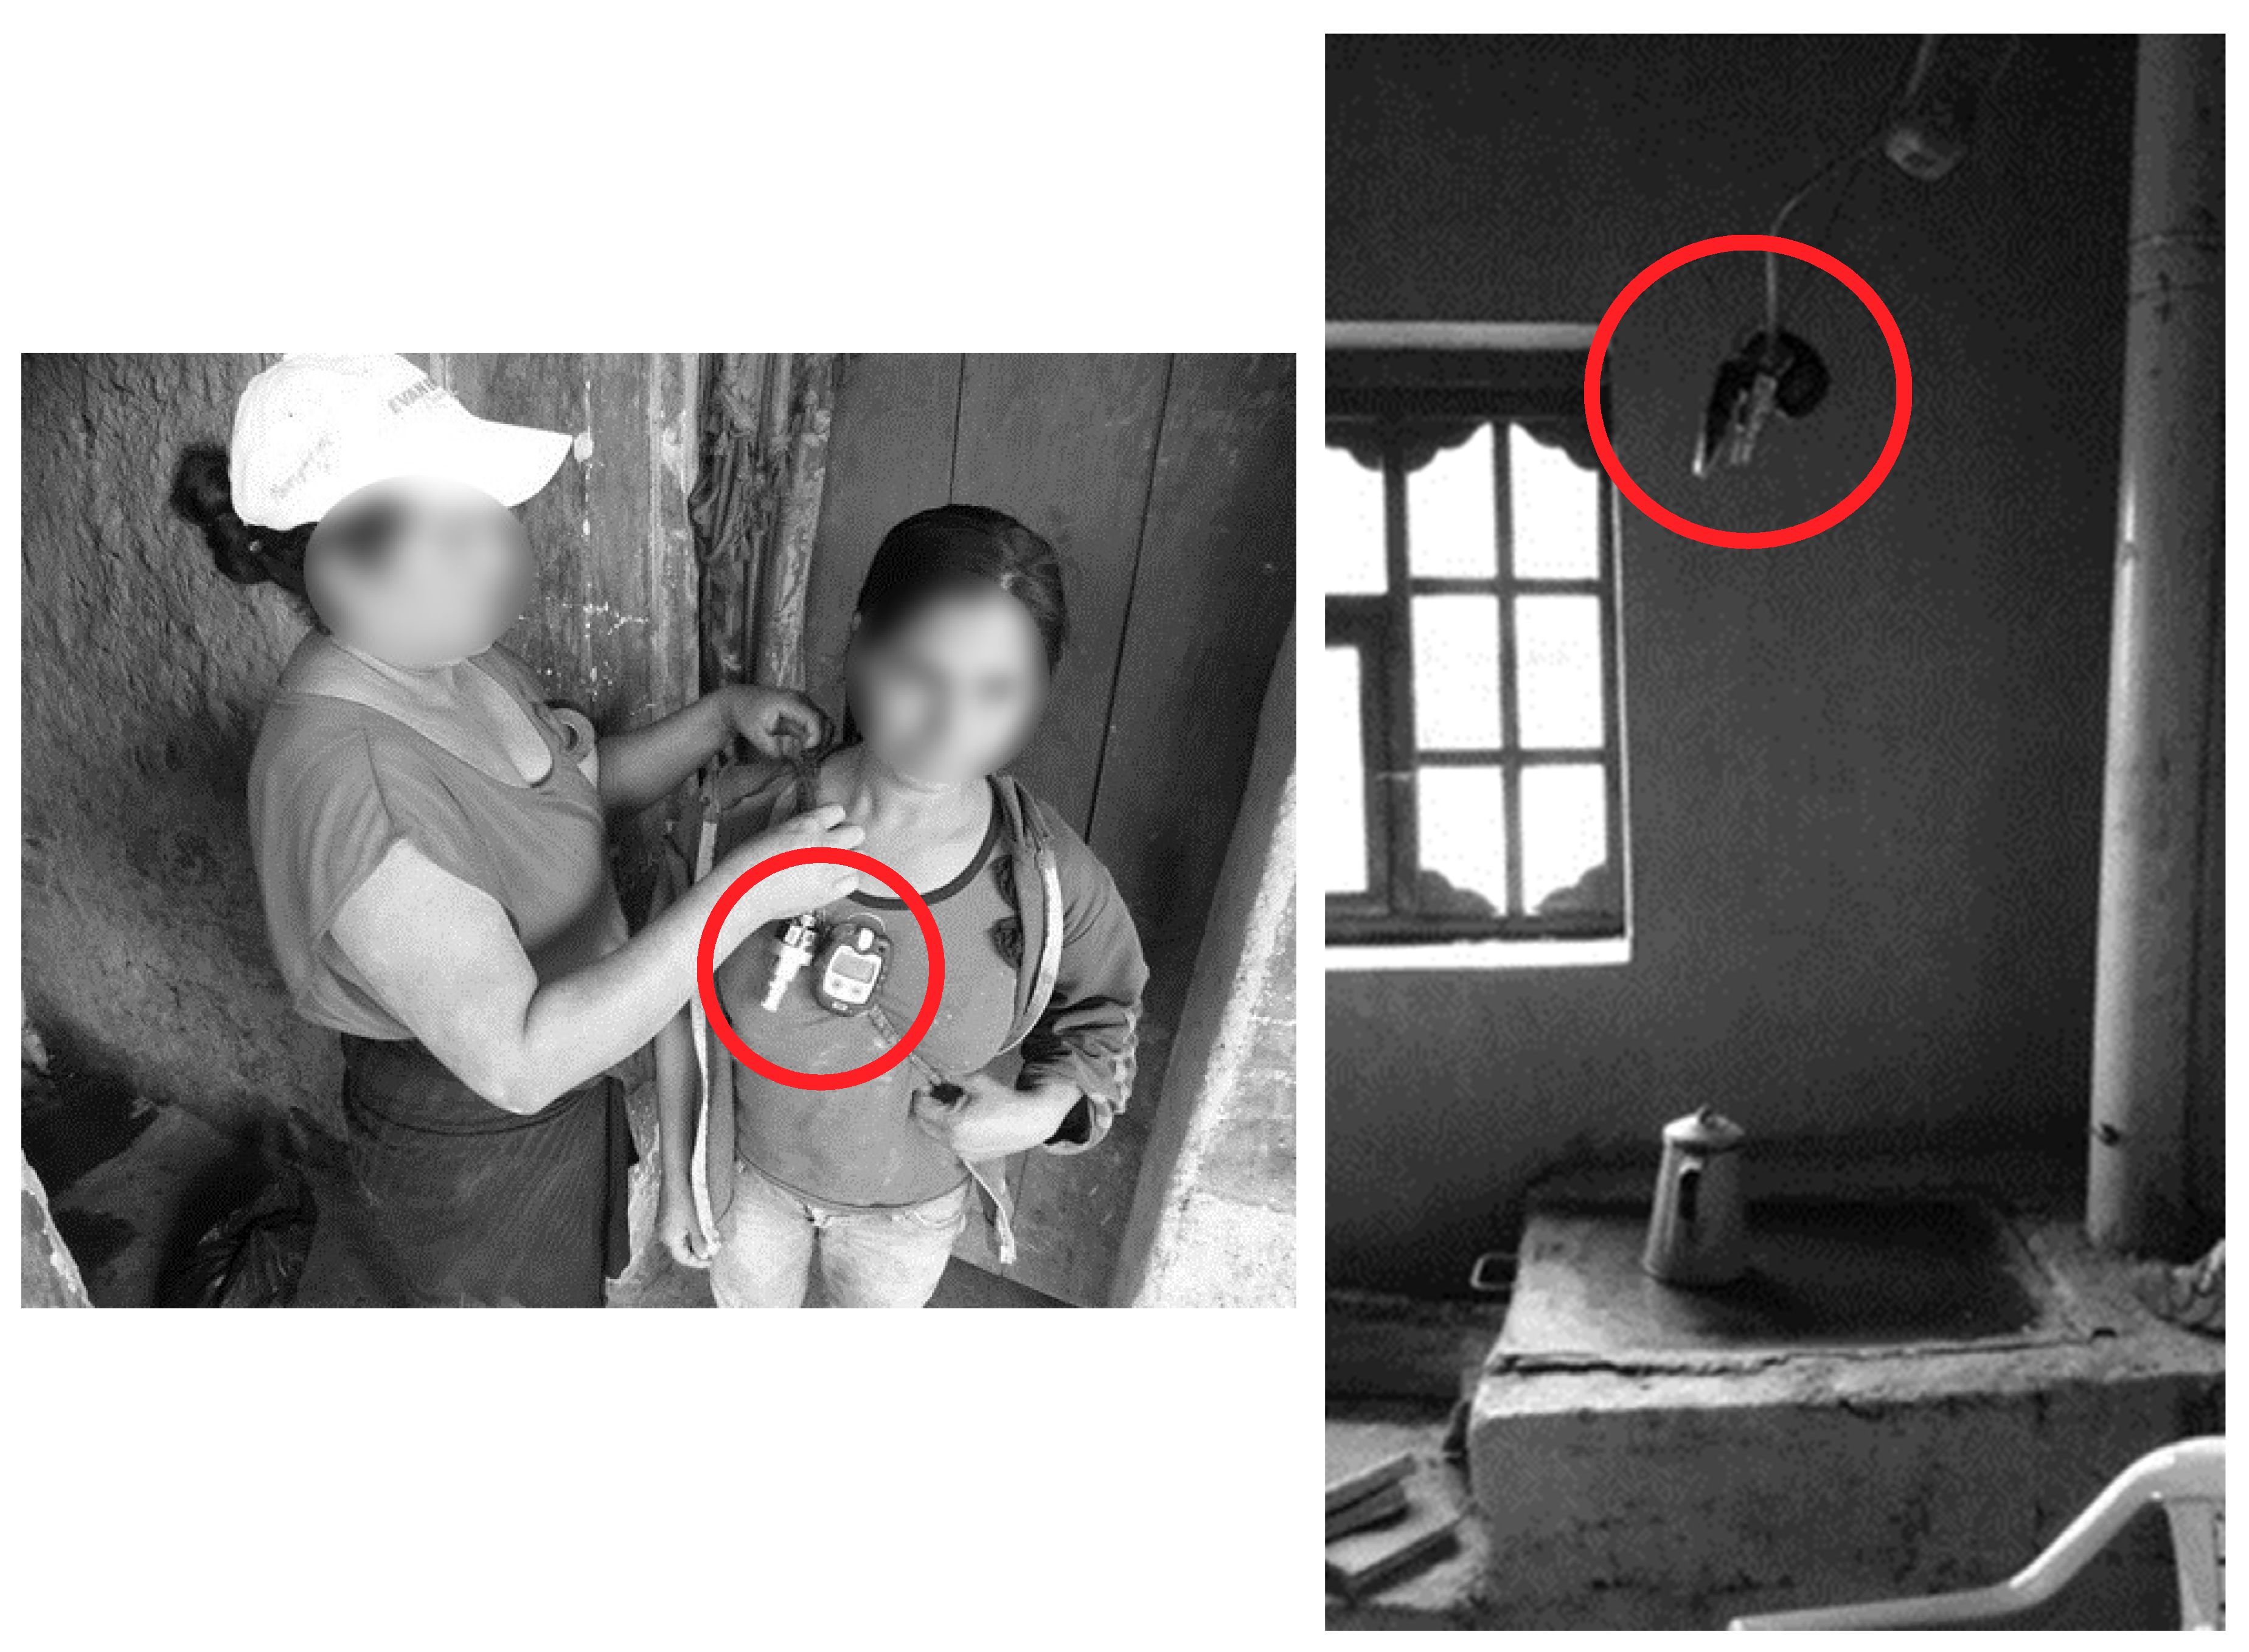
2.3. Exposure to Household Air Pollution
2.4. Fractional Exhaled Nitric Oxide
2.5. Covariate Assessment
2.6. Statistical Analysis
3. Results
4. Discussion
5. Conclusions
Supplementary Materials
Author Contributions
Funding
Acknowledgments
Conflicts of Interest
References
- Gakidou, E.; Afshin, A.; Abajobir, A.A.; Abate, K.H.; Abbafati, C.; Abbas, K.M.; Abd-Allah, F.; Abdulle, A.M.; Abera, S.F.; Aboyans, V.; et al. Global, regional, and national comparative risk assessment of 84 behavioural, environmental and occupational, and metabolic risks or clusters of risks, 1990–2016: A systematic analysis for the Global Burden of Disease Study 2016. Lancet 2017, 390, 1345–1422. [Google Scholar] [CrossRef]
- Roden, C. a.; Bond, T.C.; Conway, S.; Osorto Pinel, A.B.; MacCarty, N.; Still, D. Laboratory and field investigations of particulate and carbon monoxide emissions from traditional and improved cookstoves. Atmos. Environ. 2009, 43, 1170–1181. [Google Scholar] [CrossRef]
- Jetter, J.; Zhao, Y.; Smith, K.R.; Khan, B.; Yelverton, T.; Decarlo, P.; Hays, M.D. Pollutant emissions and energy efficiency under controlled conditions for household biomass cookstoves and implications for metrics useful in setting international test standards. Environ. Sci. Technol. 2012, 46, 10827–10834. [Google Scholar] [CrossRef] [PubMed]
- Naeher, L.P.; Brauer, M.; Lipsett, M.; Zelikoff, J.T.; Simpson, C.D.; Koenig, J.Q.; Smith, K.R. Woodsmoke Health Effects: A Review. Inhal. Toxicol. 2007, 19, 67–106. [Google Scholar] [CrossRef] [PubMed] [Green Version]
- Smith, K.R.; Bruce, N.; Balakrishnan, K.; Adair-Rohani, H.; Balmes, J.; Chafe, Z.; Dherani, M.; Hosgood, H.D.; Mehta, S.; Pope, D.; et al. Millions dead: How do we know and what does it mean? Methods used in the comparative risk assessment of household air pollution. Annu. Rev. Public Health 2014, 35, 185–206. [Google Scholar] [CrossRef] [PubMed]
- Forouzanfar, M.H.; Afshin, A.; Alexander, L.T.; Anderson, H.R.; Bhutta, Z.A.; Biryukov, S.; Brauer, M.; Burnett, R.; Cercy, K.; Charlson, F.J.; et al. Global, regional, and national comparative risk assessment of 79 behavioural, environmental and occupational, and metabolic risks or clusters of risks, 1990–2015: A systematic analysis for the Global Burden of Disease Study 2015. Lancet 2016, 388, 1659–1724. [Google Scholar] [CrossRef]
- Amegah, A.K.; Quansah, R.; Jaakkola, J.J.K. Household air pollution from solid fuel use and risk of adverse pregnancy outcomes: A systematic review and meta-analysis of the empirical evidence. PLoS ONE 2014, 9, e113920. [Google Scholar] [CrossRef] [PubMed]
- Bruce, N.; Pope, D.; Rehfuess, E.; Balakrishnan, K.; Adair-Rohani, H.; Dora, C. WHO indoor air quality guidelines on household fuel combustion: Strategy implications of new evidence on interventions and exposure–risk functions. Atmos. Environ. 2015, 106, 451–457. [Google Scholar] [CrossRef]
- Bernstein, J.A.; Alexis, N.; Barnes, C.; Bernstein, I.L.; Bernstein, J.A.; Nel, A.; Peden, D.; Diaz-Sanchez, D.; Tarlo, S.M.; Williams, P.B. Health effects of air pollution. J. Allergy Clin. Immunol. 2004, 114, 1116–1123. [Google Scholar] [CrossRef] [PubMed]
- Anderson, J.O.; Thundiyil, J.G.; Stolbach, A. Clearing the Air: A Review of the Effects of Particulate Matter Air Pollution on Human Health. J. Med. Toxicol. 2012, 8, 166–175. [Google Scholar] [CrossRef] [PubMed]
- Kelly, F.J.; Fussell, J.C. Air pollution and airway disease. Clin. Exp. Allergy 2011, 41, 1059–1071. [Google Scholar] [CrossRef] [PubMed]
- Holgate, S.T.; Sandström, T.; Frew, A.J.; Stenfors, N.; Nördenhall, C.; Salvi, S.; Blomberg, A.; Helleday, R.; Söderberg, M. Health effects of acute exposure to air pollution. Part I: Healthy and asthmatic subjects exposed to diesel exhaust. Res. Rep. Health Eff. Inst. 2003, 112, 1–30. [Google Scholar]
- van Eeden, S.F.; Tan, W.C.; Suwa, T.; Mukae, H.; Terashima, T.; Fuji, T.; Qui, D.; Vincent, R.; Hogg, J.C. Cytokines Involved in the Systemic Inflammatory Response Induced by Exposure to Particulate Matter Air Pollutants (PM 10). Am. J. Respir. Crit. Care Med. 2001, 164, 826–830. [Google Scholar] [CrossRef] [PubMed]
- Dweik, R.; Boggs, P.; Erzurum, S.; Irvin, C. An Official ATS Clinical Practice Guideline: Interpretation of Exhaled Nitric Oxide Levels (FENO) for. Am. J. Respir. Crit. Care Med. 2011, 184, 602–615. [Google Scholar] [CrossRef] [PubMed]
- Fahy, J. V Eosinophilic and neutrophilic inflammation in asthma: Insights from clinical studies. Proc. Am. Thorac. Soc. 2009, 6, 256–259. [Google Scholar] [CrossRef] [PubMed]
- Barnes, P.J.; Dweik, R.A.; Gelb, A.F.; Gibson, P.G.; George, S.C.; Grasemann, H.; Pavord, I.D.; Ratjen, F.; Silkoff, P.E.; Taylor, D.R.; et al. Exhaled nitric oxide in pulmonary diseases a comprehensive review. Chest 2010, 138, 682–692. [Google Scholar] [CrossRef] [PubMed]
- Possa, S.S.; Leick, E.A.; Prado, C.M.; Martins, M.A.; Tibério, I.F.L.C. Eosinophilic inflammation in allergic asthma. Front. Pharmacol. 2013, 4, 46. [Google Scholar] [CrossRef] [PubMed] [Green Version]
- Zamora, R.; Vodovotz, Y.; Billiar, T.R. Inducible nitric oxide synthase and inflammatory diseases. Mol. Med. 2000, 6, 347–373. [Google Scholar] [CrossRef] [PubMed]
- Harnan, S.E.; Tappenden, P.; Essat, M.; Gomersall, T.; Minton, J.; Wong, R.; Pavord, I.; Everard, M.; Lawson, R. Measurement of exhaled nitric oxide concentration in asthma: A systematic review and economic evaluation of NIOX MINO, NIOX VERO and NObreath. Health Technol. Assess. 2015, 19, 1–330. [Google Scholar] [CrossRef] [PubMed]
- Huang, W.; Wang, G.; Lu, S.-E.; Kipen, H.; Wang, Y.; Hu, M.; Lin, W.; Rich, D.; Ohman-Strickland, P.; Diehl, S.R.; et al. Inflammatory and oxidative stress responses of healthy young adults to changes in air quality during the Beijing Olympics. Am. J. Respir. Crit. Care Med. 2012, 186, 1150–1159. [Google Scholar] [CrossRef] [PubMed]
- Van Amsterdam, J.G.; Verlaan, B.P.; Van Loveren, H.; Elzakker, B.G.; Vos, S.G.; Opperhuizen, A.; Steerenberg, P.A. Air pollution is associated with increased level of exhaled nitric oxide in nonsmoking healthy subjects. Arch. Environ. Health 1999, 54, 331–335. [Google Scholar] [CrossRef] [PubMed]
- Xu, T.; Hou, J.; Cheng, J.; Zhang, R.; Yin, W.; Huang, C.; Zhu, X.; Chen, W.; Yuan, J. Estimated individual inhaled dose of fine particles and indicators of lung function: A pilot study among Chinese young adults. Environ. Pollut. 2018, 235, 505–513. [Google Scholar] [CrossRef] [PubMed]
- Shi, J.; Chen, R.; Yang, C.; Lin, Z.; Cai, J.; Xia, Y.; Wang, C.; Li, H.; Johnson, N.; Xu, X.; et al. Association between fine particulate matter chemical constituents and airway inflammation: A panel study among healthy adults in China. Environ. Res. 2016, 150, 264–268. [Google Scholar] [CrossRef] [PubMed]
- Barregard, L.; Sällsten, G.; Andersson, L.; Almstrand, A.-C.; Gustafson, P.; Andersson, M.; Olin, A.-C. Experimental exposure to wood smoke: Effects on airway inflammation and oxidative stress. Occup. Environ. Med. 2008, 65, 319–324. [Google Scholar] [CrossRef] [PubMed]
- Strak, M.; Boogaard, H.; Meliefste, K.; Oldenwening, M.; Zuurbier, M.; Brunekreef, B.; Hoek, G. Respiratory health effects of ultrafine and fine particle exposure in cyclists. Occup. Environ. Med. 2010, 67, 118–124. [Google Scholar] [CrossRef] [PubMed]
- Torres-Duque, C.; Maldonado, D.; Perez-Padilla, R.; Ezzati, M.; Viegi, G. Biomass fuels and respiratory diseases: A review of the evidence. Proc. Am. Thorac. Soc. 2008, 5, 577–590. [Google Scholar] [CrossRef] [PubMed]
- Po, J.Y.T.; FitzGerald, J.M.; Carlsten, C. Respiratory disease associated with solid biomass fuel exposure in rural women and children: Systematic review and meta-analysis. Thorax 2011, 66, 232–239. [Google Scholar] [CrossRef] [PubMed]
- Schei, M.A.; Hessen, J.O.; Smith, K.R.; Bruce, N.; McCracken, J.; Lopez, V. Childhood asthma and indoor woodsmoke from cooking in Guatemala. J. Expo. Anal. Environ. Epidemiol. 2004, 14. [Google Scholar] [CrossRef] [PubMed]
- Pollard, S.L.; Williams, D.L.; Breysse, P.N.; Baron, P.A.; Grajeda, L.M.; Gilman, R.H.; Miranda, J.J.; Checkley, W. A cross-sectional study of determinants of indoor environmental exposures in households with and without chronic exposure to biomass fuel smoke. Environ. Health 2014, 13, 12. [Google Scholar] [CrossRef] [PubMed]
- Hansen, A.D.A.; Rosen, H.; Novakov, T. The aethalometer—An instrument for the real-time measurement of optical absorption by aerosol particles. Sci. Total Environ. 1984, 36, 191–196. [Google Scholar] [CrossRef]
- Chylek, P.; Ramaswamy, V.; Cheng, R.; Pinnick, R.G. Optical properties and mass concentration of carbonaceous smokes. Appl. Opt. 1981, 20, 2980–2985. [Google Scholar] [CrossRef] [PubMed]
- Kirchstetter, T.W.; Novakov, T. Controlled generation of black carbon particles from a diffusion flame and applications in evaluating black carbon measurement methods. Atmos. Environ. 2007, 41, 1874–1888. [Google Scholar] [CrossRef]
- Rajkumar, S.; Clark, M.L.; Young, B.N.; Benka-Coker, M.L.; Bachand, A.M.; Brook, R.D.; Nelson, T.L.; Volckens, J.; Reynolds, S.J.; L’Orange, C.; et al. Exposure to Household Air Pollution from Biomass-Burning Cookstoves and HbA1c and Diabetic Status among Honduran Women. Indoor Air 2018, 768–776. [Google Scholar] [CrossRef] [PubMed]
- Young, B.N.; Clark, M.L.; Rajkumar, S.; Benka-Coker, M.L.; Bachand, A.; Brook, R.D.; Nelson, T.L.; Volckens, J.; Reynolds, S.; L’Orange, C.; et al. Exposure to household air pollution from biomass cookstoves and blood pressure among women in rural honduras: A cross-sectional study. Indoor Air 2018, 1–13. [Google Scholar] [CrossRef] [PubMed]
- Brunette, W.; Sundt, M.; Dell, N.; Chaudhri, R.; Breit, N.; Borriello, G. Open Data Kit 2.0: Expanding and Refining Information Services for Developing Regions. In Proceedings of the 14th Workshop on Mobile Computing Systems and Applications, Jekyll Island, GA, USA, 26–27 February 2013. [Google Scholar]
- Arps, S. Socioeconomic status and body size among women in Honduran Miskito communities. Ann. Hum. Biol. 2011, 38, 508–519. [Google Scholar] [CrossRef] [PubMed]
- Ainsworth, B.E.; Haskell, W.L.; Herrmann, S.D.; Meckes, N.; Bassett, D.R.; Tudor-Locke, C.; Greer, J.L.; Vezina, J.; Whitt-Glover, M.C.; Leon, A.S. 2011 compendium of physical activities: A second update of codes and MET values. Med. Sci. Sports Exerc. 2011, 43, 1575–1581. [Google Scholar] [CrossRef] [PubMed]
- Olin, A.-C. Height, Age, and Atopy Are Associated With Fraction of Exhaled Nitric Oxide in a Large Adult General Population Sample. CHEST J. 2006, 130, 1319. [Google Scholar] [CrossRef] [PubMed]
- Dressel, H.; de la Motte, D.; Reichert, J.; Ochmann, U.; Petru, R.; Angerer, P.; Holz, O.; Nowak, D.; Jörres, R.A. Exhaled nitric oxide: Independent effects of atopy, smoking, respiratory tract infection, gender and height. Respir. Med. 2008, 102, 962–969. [Google Scholar] [CrossRef] [PubMed] [Green Version]
- Savy, M.; Martin-Prével, Y.; Traissac, P.; Eymard-Duvernay, S.; Delpeuch, F. Dietary diversity scores and nutritional status of women change during the seasonal food shortage in rural Burkina Faso. J. Nutr. 2006, 136, 2625–2632. [Google Scholar] [CrossRef] [PubMed]
- Clark, M.L.; Peel, J.L. Perspectives in Household Air Pollution Research: Who Will Benefit from Interventions? Curr. Environ. Health Rep. 2014, 250–257. [Google Scholar] [CrossRef]
- World Health Organization. Air Quality Guidelines: Global Update 2005: Particulate Matter, Ozone, Nitrogen Dioxide, and Sulfur Dioxide; World Health Organization: Geneva, Switzerland, 2006; Volume 3. [Google Scholar]
- Adamkiewicz, G.; Ebelt, S.; Syring, M.; Slater, J.; Speizer, F.E.; Schwartz, J.; Suh, H.; Gold, D.R. Association between air pollution exposure and exhaled nitric oxide in an elderly population. Thorax 2004, 59, 204–209. [Google Scholar] [CrossRef] [PubMed] [Green Version]
- Dubowsky Adar, S.; Adamkiewicz, G.; Gold, D.R.; Schwartz, J.; Coull, B.A.; Suh, H. Ambient and microenvironmental particles and exhaled nitric oxide before and after a group bus trip. Environ. Health Perspect. 2007, 115, 507–512. [Google Scholar] [CrossRef] [PubMed] [Green Version]
- Yoda, Y.; Otani, N.; Sakurai, S.; Shima, M. Acute effects of summer air pollution on pulmonary function and airway inflammation in healthy young women. J. Epidemiol. 2014, 24, 312–320. [Google Scholar] [CrossRef] [PubMed]
- Riddervold, I.; Bønløkke, J.; Olin, A.; Grønborg, T.; Schlünssen, V.; Skogstrand, K.; Hougaard, D.; Massling, A.; Sigsgaard, T. Effects of wood smoke particles from wood-burning stoves on the respiratory health of atopic humans. Part. Fibre Toxicol. 2012, 9, 12. [Google Scholar] [CrossRef] [PubMed] [Green Version]
- Sehlstedt, M.; Dove, R.; Boman, C.; Pagels, J.; Swietlicki, E.; Löndahl, J.; Westerholm, R.; Bosson, J.; Barath, S.; Behndig, A.F.; et al. Antioxidant airway responses following experimental exposure to wood smoke in man. Part. Fibre Toxicol. 2010, 7, 21. [Google Scholar] [CrossRef] [PubMed] [Green Version]
- Muala, A.; Rankin, G.; Sehlstedt, M.; Unosson, J.; Bosson, J.A.; Pourazar, J.; Nystrom, R.; Boman, C.; Blomberg, A. Effects of experimental wood smoke exposure in healthy human subjects. Am. J. Respir. Crit. Care Med. 2013, 187, A3504. [Google Scholar]
- Stockfelt, L.; Sallsten, G.; Olin, A.-C.; Almerud, P.; Samuelsson, L.; Johannesson, S.; Molnar, P.; Strandberg, B.; Almstrand, A.-C.; Bergemalm-Rynell, K.; et al. Effects on airways of short-term exposure to two kinds of wood smoke in a chamber study of healthy humans. Inhal. Toxicol. 2012, 24, 47–59. [Google Scholar] [CrossRef] [PubMed]
- Tsoukias, N.M.; George, S.C. A two-compartment model of pulmonary nitric oxide exchange dynamics. J. Appl. Physiol. 1998, 85, 653–666. [Google Scholar] [CrossRef] [PubMed]
- Eckel, S.P.; Salam, M.T. Single high flow exhaled nitric oxide is an imperfect proxy for distal nitric oxide. Occup. Environ. Med. 2013, 70, 519–520. [Google Scholar] [CrossRef] [PubMed]
- Hogman, M.; Stromberg, S.; Schedin, U.; Frostell, C.; Hedenstierna, G.; Gustafson, L.E. Nitric oxide from the human respiratory tract efficiently quantified by standardized single breath measurements. Acta Physiol. 1997, 159, 345–346. [Google Scholar] [CrossRef] [PubMed]
- Silkoff, P.E.; Mcclean, P.A.; Slutsky, A.S.; Furlott, H.G.; Hoffstein, E.; Wakita, S.; Chapman, K.R.; Szalai, J.P.; Zamel, N. Marked flow-dependence of exhaled nitric oxide using a new technique to exclude nasal nitric oxide. Am. J. Respir. Crit. Care Med. 1997, 155, 260–267. [Google Scholar] [CrossRef] [PubMed]
- George, S.C.; Hogman, M.; Permutt, S.; Silkoff, P.E. Modeling pulmonary nitric oxide exchange. J. Appl. Physiol. 2004, 96, 831–839. [Google Scholar] [CrossRef] [PubMed] [Green Version]
- Modig, L.; Dahgam, S.; Olsson, D.; Nyberg, F.; Wass, K.; Forsberg, B.; Olin, A.-C. Short-term exposure to ozone and levels of exhaled nitric oxide. Epidemiology 2014, 25, 79–87. [Google Scholar] [CrossRef] [PubMed]
- Salam, M.T.; Byun, H.-M.; Lurmann, F.; Breton, C.V.; Wang, X.; Eckel, S.P.; Gilliland, F.D. Genetic and epigenetic variations in inducible nitric oxide synthase promoter, particulate pollution, and exhaled nitric oxide levels in children. J. Allergy Clin. Immunol. 2012, 129, 232–239.e7. [Google Scholar] [CrossRef] [PubMed] [Green Version]
- Brauer, M.; Avila-Casado, C.; Fortoul, T.I.; Vedal, S.; Stevens, B.; Churg, A. Air pollution and retained particles in the lung. Environ. Health Perspect. 2001, 109, 1039–1043. [Google Scholar] [CrossRef] [PubMed]
- Olin, A.C.; Rosengren, A.; Thelle, D.S.; Lissner, L.; Torén, K. Increased fraction of exhaled nitric oxide predicts new-onset wheeze in a general population. Am. J. Respir. Crit. Care Med. 2010, 181, 324–327. [Google Scholar] [CrossRef] [PubMed]
- Olin, A.C.; Alving, K.; Torén, K. Exhaled nitric oxide: Relation to sensitization and respiratory symptoms. Clin. Exp. Allergy 2004, 34, 221–226. [Google Scholar] [CrossRef] [PubMed]
- Pignatti, P.; Spanevello, A. Towards a practical clinical use of fractioned exhaled nitric oxide levels in chronic cough. Ann. Transl. Med. 2016, 4, 357. [Google Scholar] [CrossRef] [PubMed]
- Bjermer, L.; Alving, K.; Diamant, Z.; Magnussen, H.; Pavord, I.; Piacentini, G.; Price, D.; Roche, N.; Sastre, J.; Thomas, M.; et al. Current evidence and future research needs for FeNO measurement in respiratory diseases. Respir. Med. 2014, 108, 830–841. [Google Scholar] [CrossRef] [PubMed] [Green Version]
- Salam, M.T.; Bastain, T.M.; Rappaport, E.B.; Islam, T.; Berhane, K.; Gauderman, W.J.; Gilliland, F.D. Genetic variations in nitric oxide synthase and arginase influence exhaled nitric oxide levels in children. Allergy 2011, 66, 412–419. [Google Scholar] [CrossRef] [PubMed]
- Salam, M.T.; Lin, P.C.; Eckel, S.P.; Gauderman, W.J.; Gilliland, F.D. Inducible nitric oxide synthase promoter haplotypes and residential traffic-related air pollution jointly influence exhaled nitric oxide level in children. PLoS ONE 2015, 10, e0145363. [Google Scholar] [CrossRef] [PubMed]


| Total (n = 139) | Traditional (n = 72) | Justa (n = 67) | Test Value | |
|---|---|---|---|---|
| n (%) or Mean (SD); Range | n (%) or Mean (SD); Range | n (%) or Mean (SD); Range | (p-Value) * | |
| Age (years) | 37.1 (9.1); 25–56 | 38.3 (9.9); 25–56 | 35.9 (7.9); 25–56 | 0.29 |
| Height (meters) | 1.45 (0.05); 1.37–1.59 | 1.45 (0.05); 1.37–1.59 | 1.45 (0.04); 1.37–1.56 | 0.40 |
| Waist-to-hip ratio | 0.87 (0.06); 0.74–1.10 | 0.88 (0.06); 0.74–1.09 | 0.87 (0.05); 0.77–0.99 | 0.08 |
| Body mass index (kg/m2) | 25.8 (4.2); 17.6–37.5 | 25.5 (4.4); 17.5–37.5 | 26.2 (3.8); 18.2–33.6 | 0.24 |
| Physical activity (MET) 1 | 212 (103); 31–542 | 216 (110); 31–542 | 209 (95); 46–444 | 0.82 |
| Elevation (meters) | 1916 (107); 1729–2157 | 1896 (98); 1736–2152 | 1938 (112); 1729–2157 | 0.01 |
| Beds per person 2 | 0.52 (0.18); 0.2–1.0 | 0.50 (0.17); 0.2–1.0 | 0.55 (0.19); 0.25–1.0 | 0.15 |
| Diet diversity score 3 | 6.1 (1.7); 2–10 | 6.1 (1.7); 3–10 | 5.9 (1.6); 2–10 | 0.62 |
| Years of education | ||||
| Less than six years | 66 (48.1%) | 38 (53.5%) | 28 (42.4%) | 0.26 |
| Six or more years | 71 (51.8%) | 33 (46.5%) | 38 (57.6%) | |
| Number of assets 4 | ||||
| Less than two | 67 (48.5%) | 38 (53.5%) | 34 (51.0%) | 0.87 |
| Two or more | 71 (51.5%) | 33 (46.5%) | 33 (49.0%) | |
| Years spent cooking with biomass | 25.6 (9.9); 7–50 | 26.6 (10.8); 7–49 | 24.5 (8.8); 9–50 | 0.38 |
| Self-reported exposure to secondhand smoke | 5 (3.6%) | 5 (3.6%) | 0 (0%) | - |
| Fractional exhale nitric oxide (ppb) | 17.9 (12.1); 3.5–95 | 17.4 (10.8); 3.5–62 | 18.5 (13.4); 5–95 | 0.64 |
| All Participants | Traditional Stove Users | Justa Stove Users | ||||||||||||||||
|---|---|---|---|---|---|---|---|---|---|---|---|---|---|---|---|---|---|---|
| n | Min | 25th | Median | 75th | Max | n | Min | 25th | Median | 75th | Max | n | Min | 25th | Median | 75th | Max | |
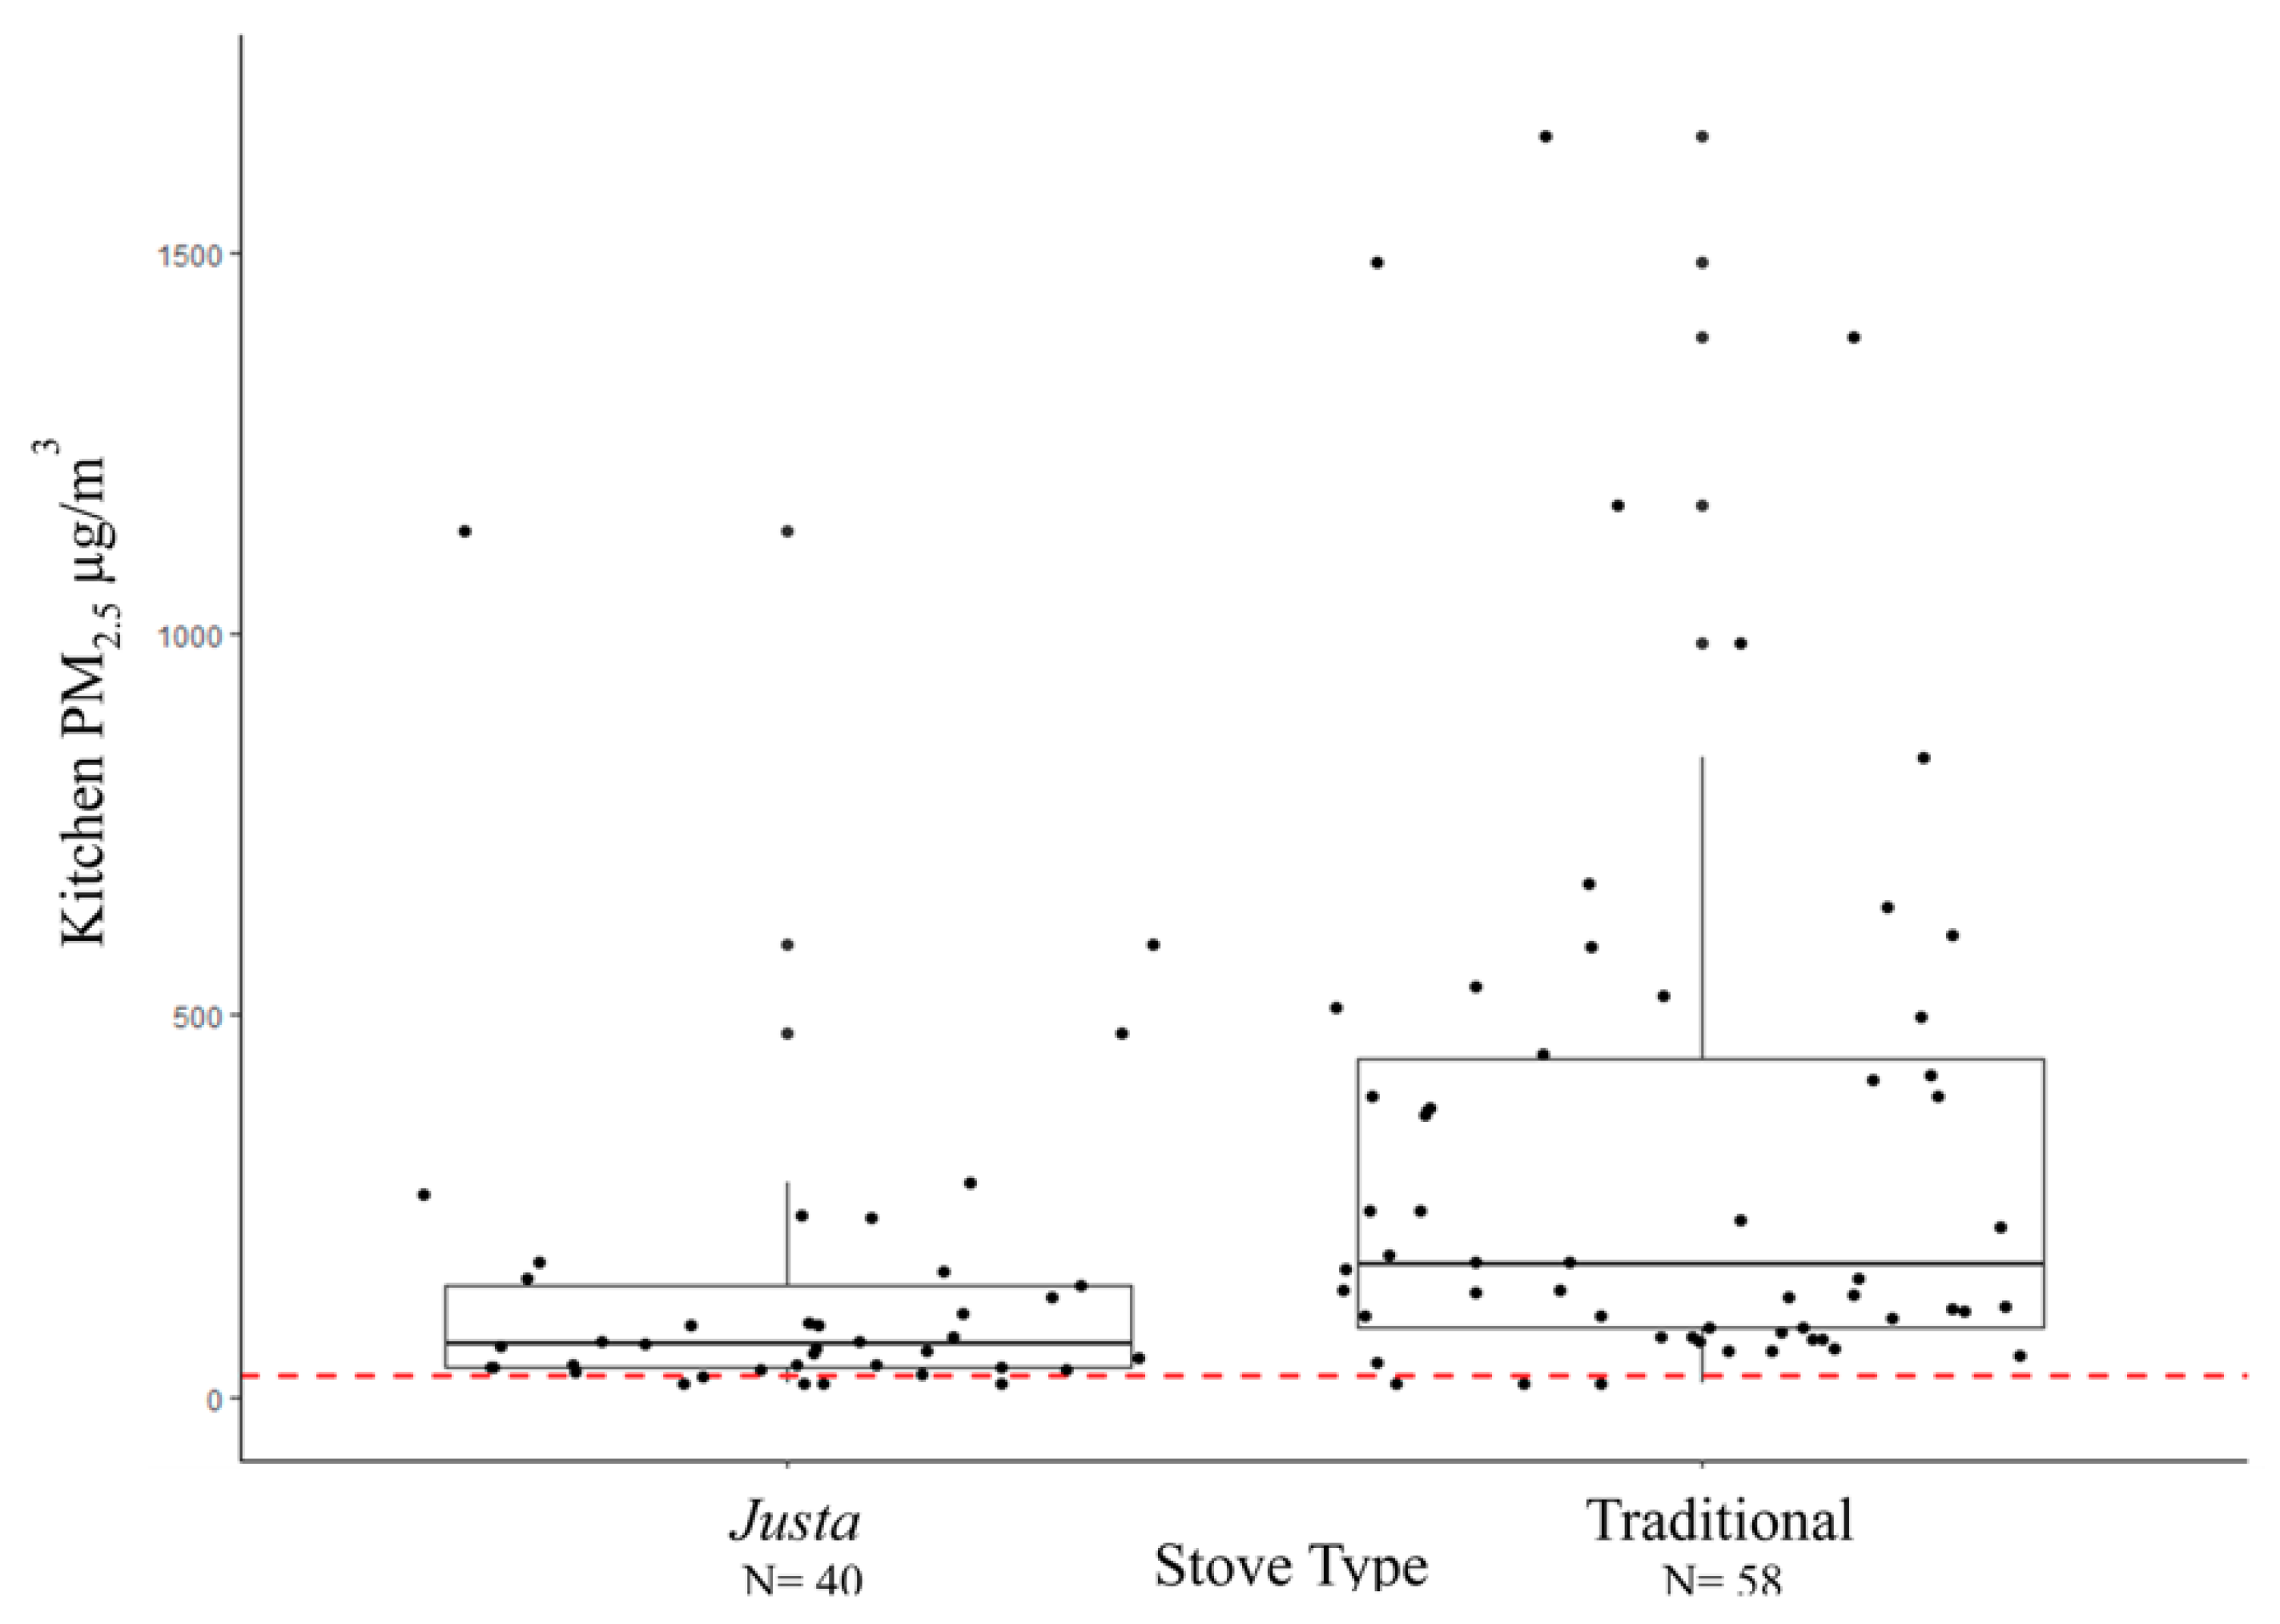
| 24-h average kitchen PM2.5 (µg/m3) | 98 | 18 | 61 | 116 | 369 | 1654 | 58 | 18 | 90 | 172 | 448 | 1654 | 40 | 18 | 37 | 68 | 150 | 1134 |
| 24-h average personal PM2.5 (µg/m3) | 98 | 18 | 48 | 80 | 138 | 346 | 59 | 18 | 62 | 112 | 154 | 346 | 39 | 18 | 39 | 52 | 81 | 174 |
| 24-h average kitchen Black Carbon (µg/m3) | 98 | 1 | 8 | 18 | 78 | 1172 | 58 | 1 | 14 | 44 | 113 | 1172 | 40 | 1 | 4 | 11 | 15 | 469 |
| 24-h average personal Black Carbon (µg/m3) | 98 | 1 | 4 | 7 | 17 | 123 | 58 | 1 | 6 | 14 | 32 | 123 | 40 | 1 | 1 | 4 | 8 | 47 |
| n | Crude Percent Difference in FeNO | 95% CI | n | Adjusted Percent Difference in FeNO | 95% CI | |
|---|---|---|---|---|---|---|
| Age (years) 1 | 139 | <0.1 | (−0.2, 0.3) | 136 | 0.1 | (−0.2, 0.4) |
| Height (meters) 2 | 139 | −3.79 | (−39.51, 53.02) | 136 | −0.25 | (−37.59, 59.44) |
| Cough 3 | ||||||
| No | 118 | ref | 115 | |||
| Yes | 21 | 78.8 | (38.8, 130.2) | 21 | 78.8 | (37.5, 132.5) |
| Chest Tightness 3 | ||||||
| No | 128 | ref | 125 | |||
| Yes | 11 | 17.6 | (−17.9, 68.3) | 11 | 24.5 | (−14.5, 81.5) |
| Mucus 3 | ||||||
| No | 121 | ref | 118 | |||
| Yes | 18 | 47.4 | (11.2, 95.3) | 18 | 52.4 | (13.4, 104.8) |
| Difficulty Breathing 3 | ||||||
| No | 129 | ref | 126 | |||
| Yes | 10 | 42.1 | (−2.0, 105.9) | 10 | 39.4 | (−5.1, 104.8) |
| n | Crude Percent Difference in FeNO | 95% CI | n | Adjusted Percent Difference in FeNO 1 | 95% CI | |
|---|---|---|---|---|---|---|
| 24-h average kitchen PM2.5 (µg/m3) 2 | 98 | 0.3 | (−2.0, 2.7) | 84 | 0.5 | (−2.0, 3.1) |
| 24-h average personal PM2.5 (µg/m3) 2 | 98 | 0.8 | (−3.1, 4.9) | 85 | 0.8 | (−3.4, 5.2) |
| 24-h average kitchen Black Carbon (µg/m3) 2 | 98 | −0.1 | (−1.8, 1.6) | 84 | −0.1 | (−1.9, 1.8) |
| 24-h average personal Black Carbon (µg/m3) 2 | 98 | <0.0 | (−2.1, 1.9) | 84 | −0.2 | (−2.4, 2.0) |
| Stove Type 3 | 139 | 136 | ||||
| Justa | 67 | ref | 65 | ref | ||
| Traditional | 72 | −6.5 | (−22.9, 13.6) | 71 | −6.1 | (−23.5, 15.3) |
| n | Adjusted Percent Difference 1 | 95% CI | p-Value for Interaction | |
|---|---|---|---|---|
| 24-h average kitchen PM2.5 (µg/m3) 2 | 0.7 | |||
| Age < 40 | 65 | <0.1 | (−3.3, 3.4) | |
| Age ≥ 40 | 31 | 1.0 | (−3.0, 5.1) | |
| 24-h average personal PM2.5 (µg/m3) 2 | 0.2 | |||
| Age < 40 | 66 | −0.9 | (−5.7, 4.3) | |
| Age ≥ 40 | 31 | 5.2 | (−3.3, 14.3) | |
| 24-h average kitchen Black Carbon (µg/m3) 2 | 0.8 | |||
| Age < 40 | 65 | −0.3 | (−2.6, 2.1) | |
| Age ≥ 40 | 31 | 0.2 | (−2.7, 3.2) | |
| 24-h average personal Black Carbon (µg/m3) 2 | 0.7 | |||
| Age < 40 | 65 | −0.5 | (−3.1, 2.3) | |
| Age ≥ 40 | 31 | 0.5 | (−3.3, 4.7) | |
| Stove Type 3 (traditional compared to Justa [ref]) | ||||
| Traditional | ||||
| Age < 40 | 72 | −12.2 | (−31.9, 13.1) | 0.3 |
| Age ≥ 40 | 67 | 11.1 | (−22., 59.2) |
© 2018 by the authors. Licensee MDPI, Basel, Switzerland. This article is an open access article distributed under the terms and conditions of the Creative Commons Attribution (CC BY) license (http://creativecommons.org/licenses/by/4.0/).
Share and Cite
Benka-Coker, M.L.; Clark, M.L.; Rajkumar, S.; Young, B.N.; Bachand, A.M.; Balmes, J.R.; Brook, R.; Nelson, T.L.; Volckens, J.; Reynolds, S.J.; et al. Exposure to Household Air Pollution from Biomass Cookstoves and Levels of Fractional Exhaled Nitric Oxide (FeNO) among Honduran Women. Int. J. Environ. Res. Public Health 2018, 15, 2544. https://0-doi-org.brum.beds.ac.uk/10.3390/ijerph15112544
Benka-Coker ML, Clark ML, Rajkumar S, Young BN, Bachand AM, Balmes JR, Brook R, Nelson TL, Volckens J, Reynolds SJ, et al. Exposure to Household Air Pollution from Biomass Cookstoves and Levels of Fractional Exhaled Nitric Oxide (FeNO) among Honduran Women. International Journal of Environmental Research and Public Health. 2018; 15(11):2544. https://0-doi-org.brum.beds.ac.uk/10.3390/ijerph15112544
Chicago/Turabian StyleBenka-Coker, Megan L., Maggie L. Clark, Sarah Rajkumar, Bonnie N. Young, Annette M. Bachand, John R. Balmes, Robert Brook, Tracy L. Nelson, John Volckens, Steve J. Reynolds, and et al. 2018. "Exposure to Household Air Pollution from Biomass Cookstoves and Levels of Fractional Exhaled Nitric Oxide (FeNO) among Honduran Women" International Journal of Environmental Research and Public Health 15, no. 11: 2544. https://0-doi-org.brum.beds.ac.uk/10.3390/ijerph15112544