Long-Term Exposure to Air Pollutants and Cancer Mortality: A Meta-Analysis of Cohort Studies


Abstract
:1. Introduction
2. Materials and Methods
2.1. Data Sources and Searches
2.2. Study Selection and Eligibility
2.3. Data Extraction
2.4. Assessment of Methodological Quality
2.5. Main and Subgroup Analyses
2.6. Statistical Analyses
3. Results
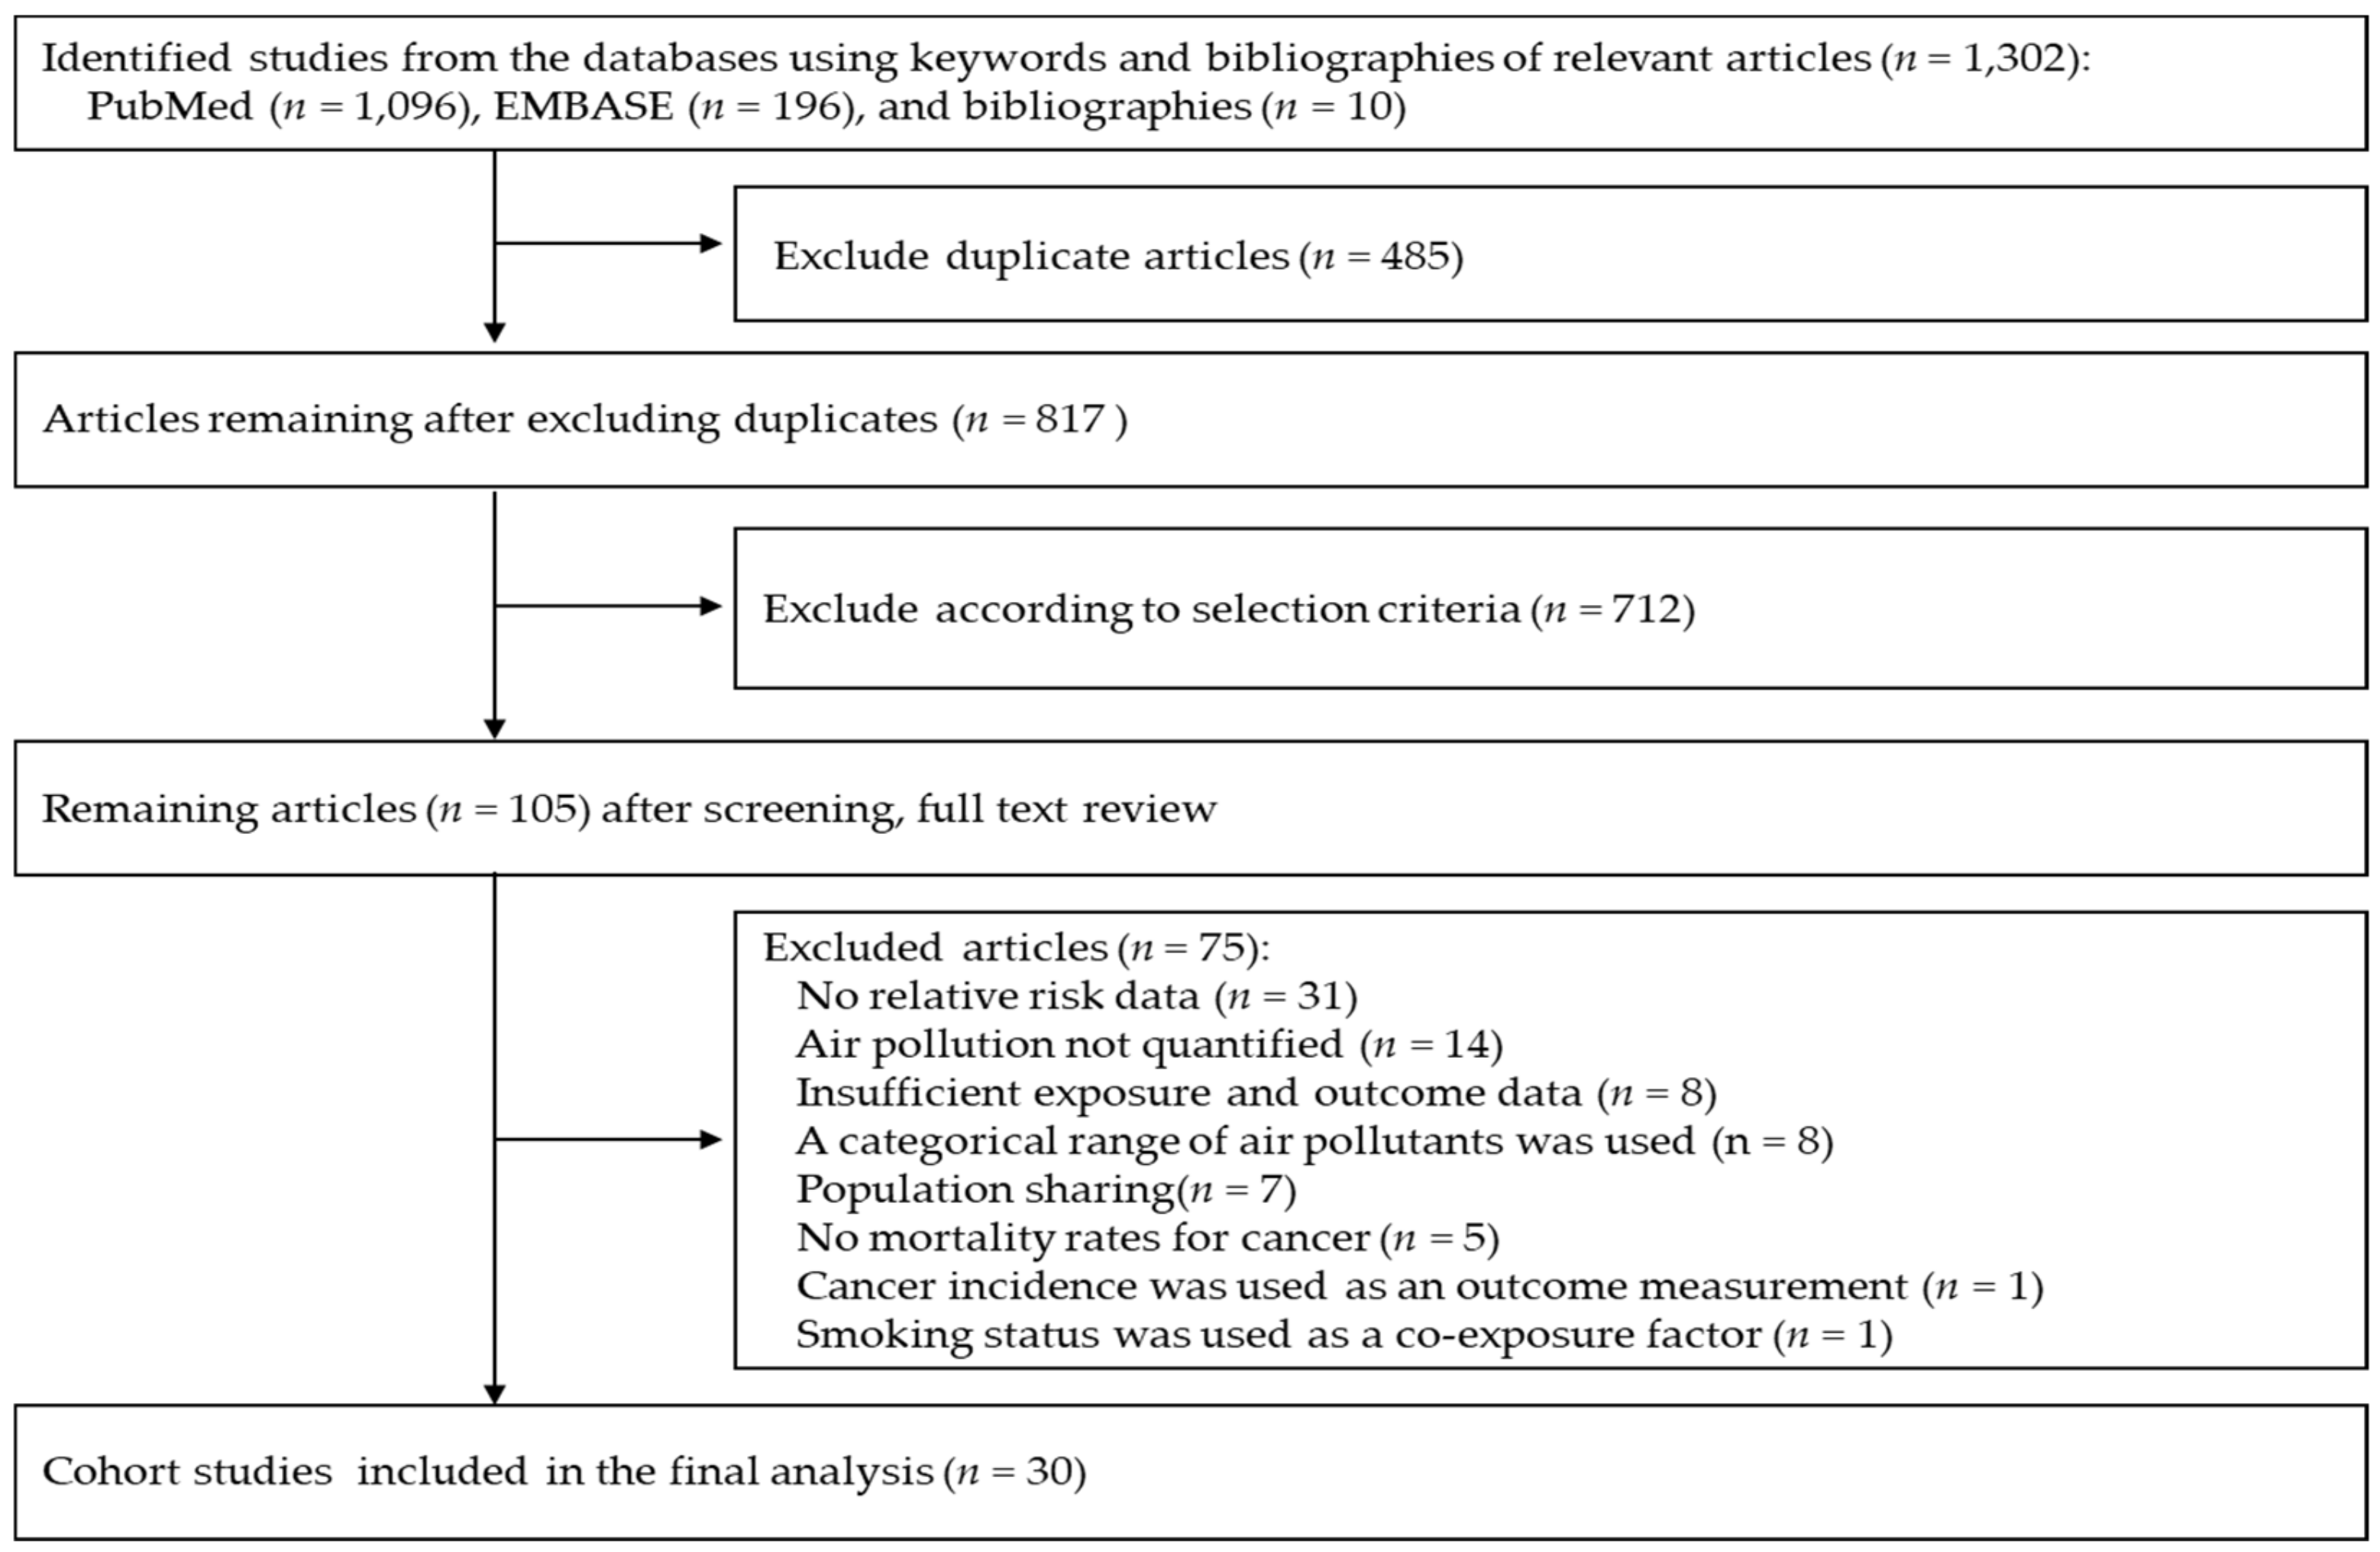
3.1. Eligible Studies
3.2. Characteristics of Studies Included in the Final Analysis
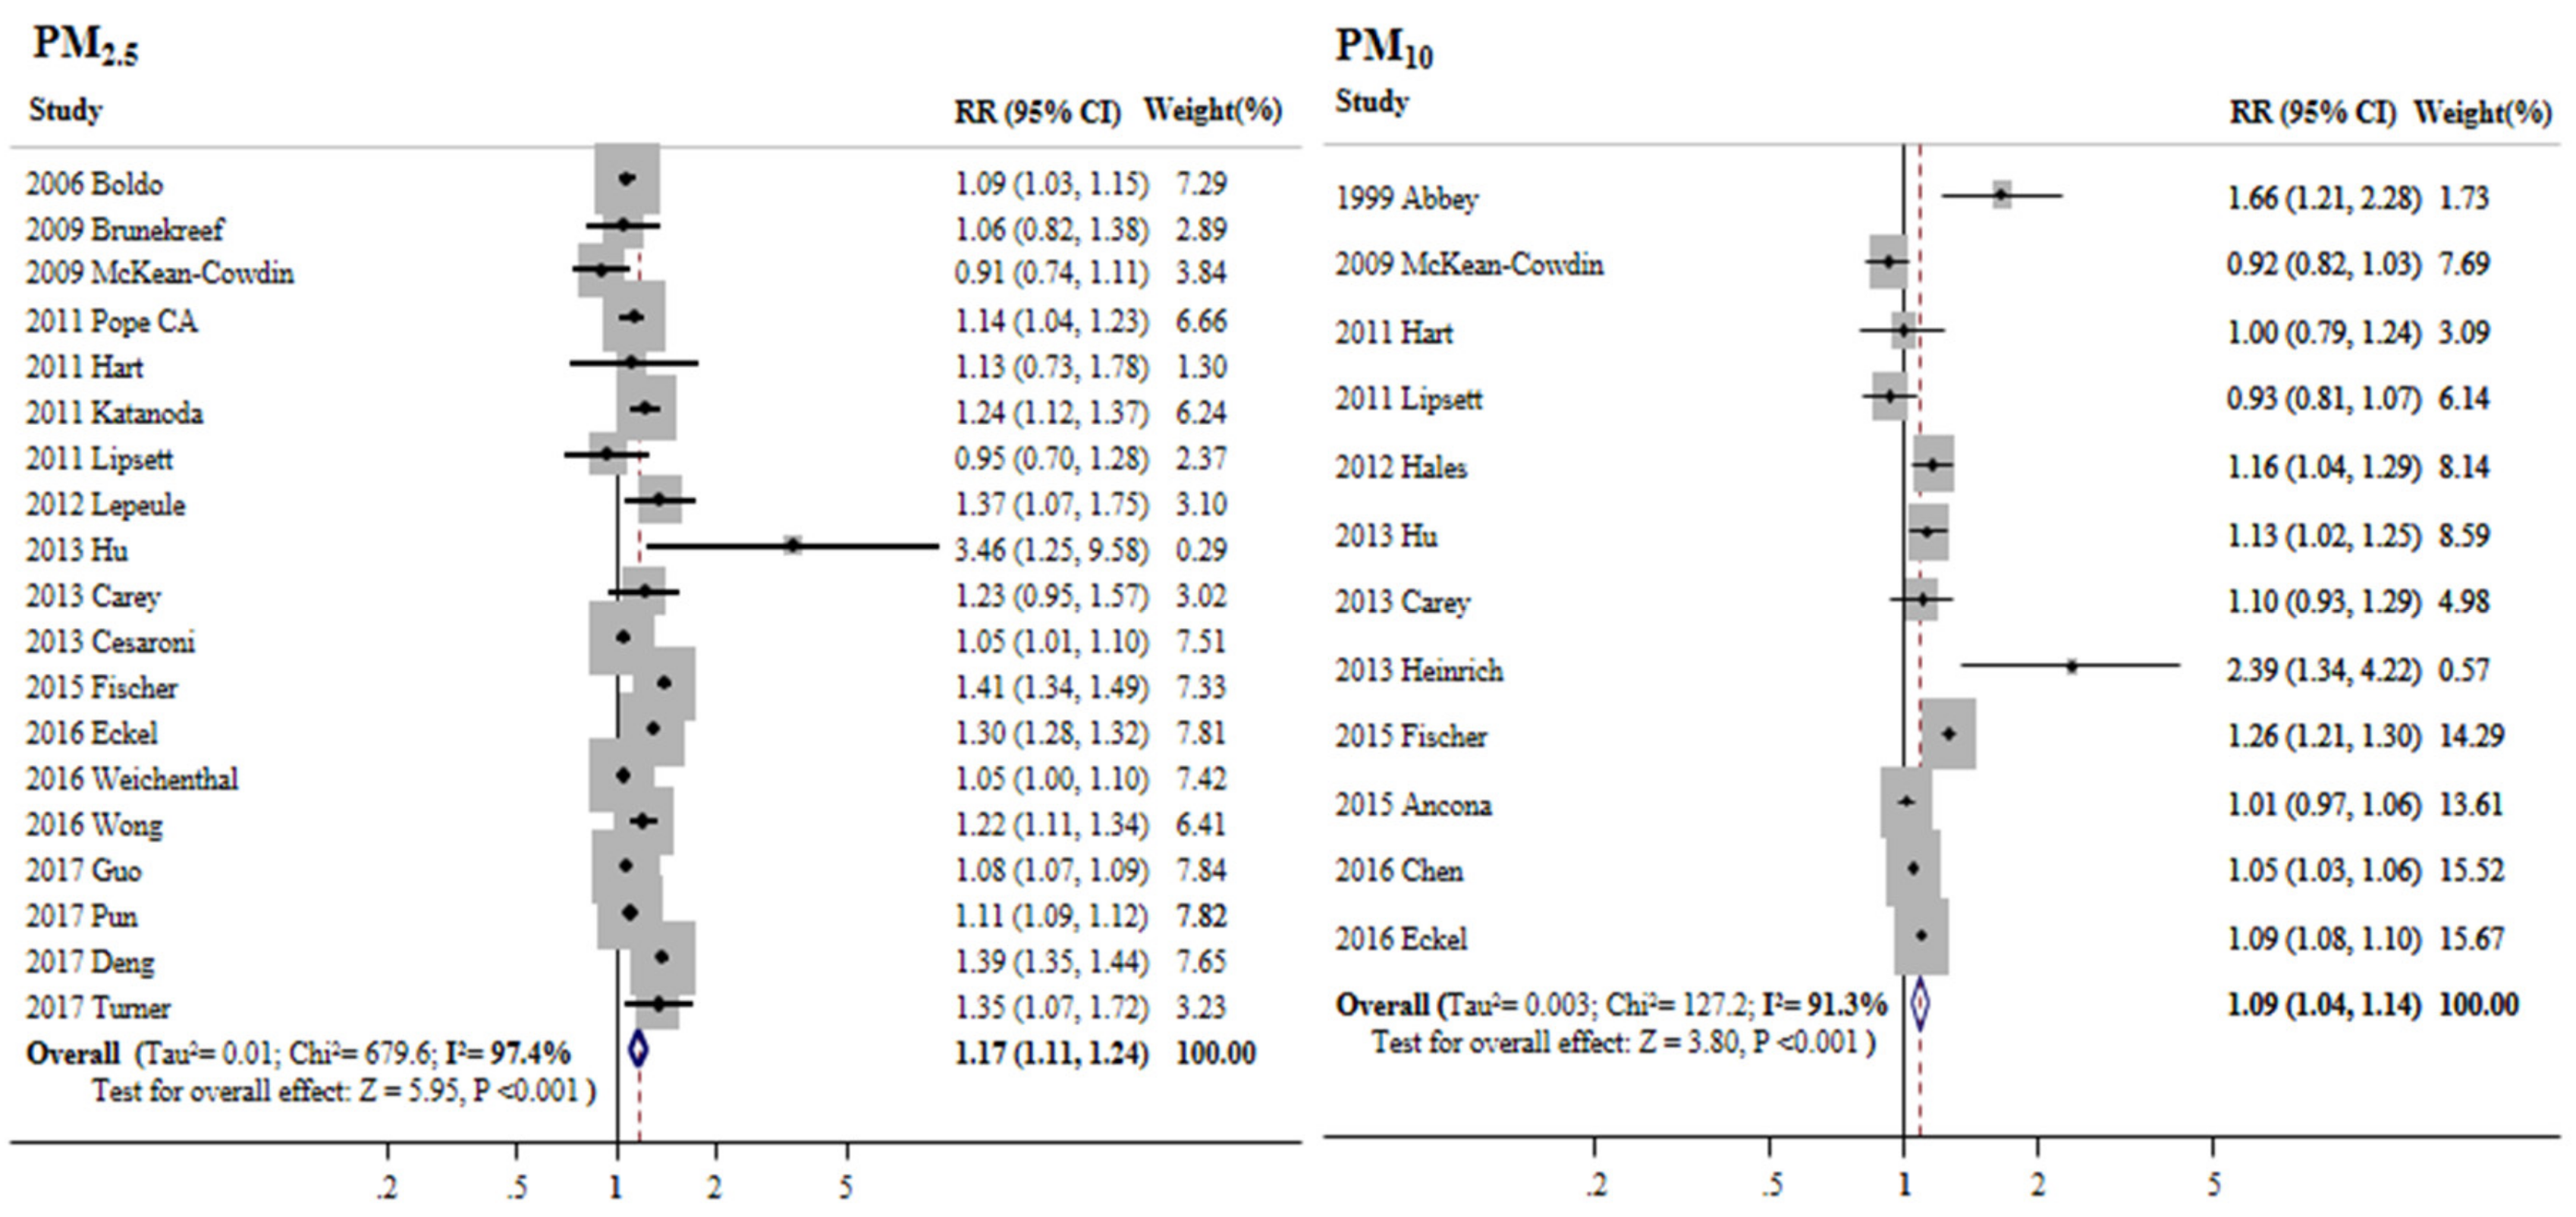
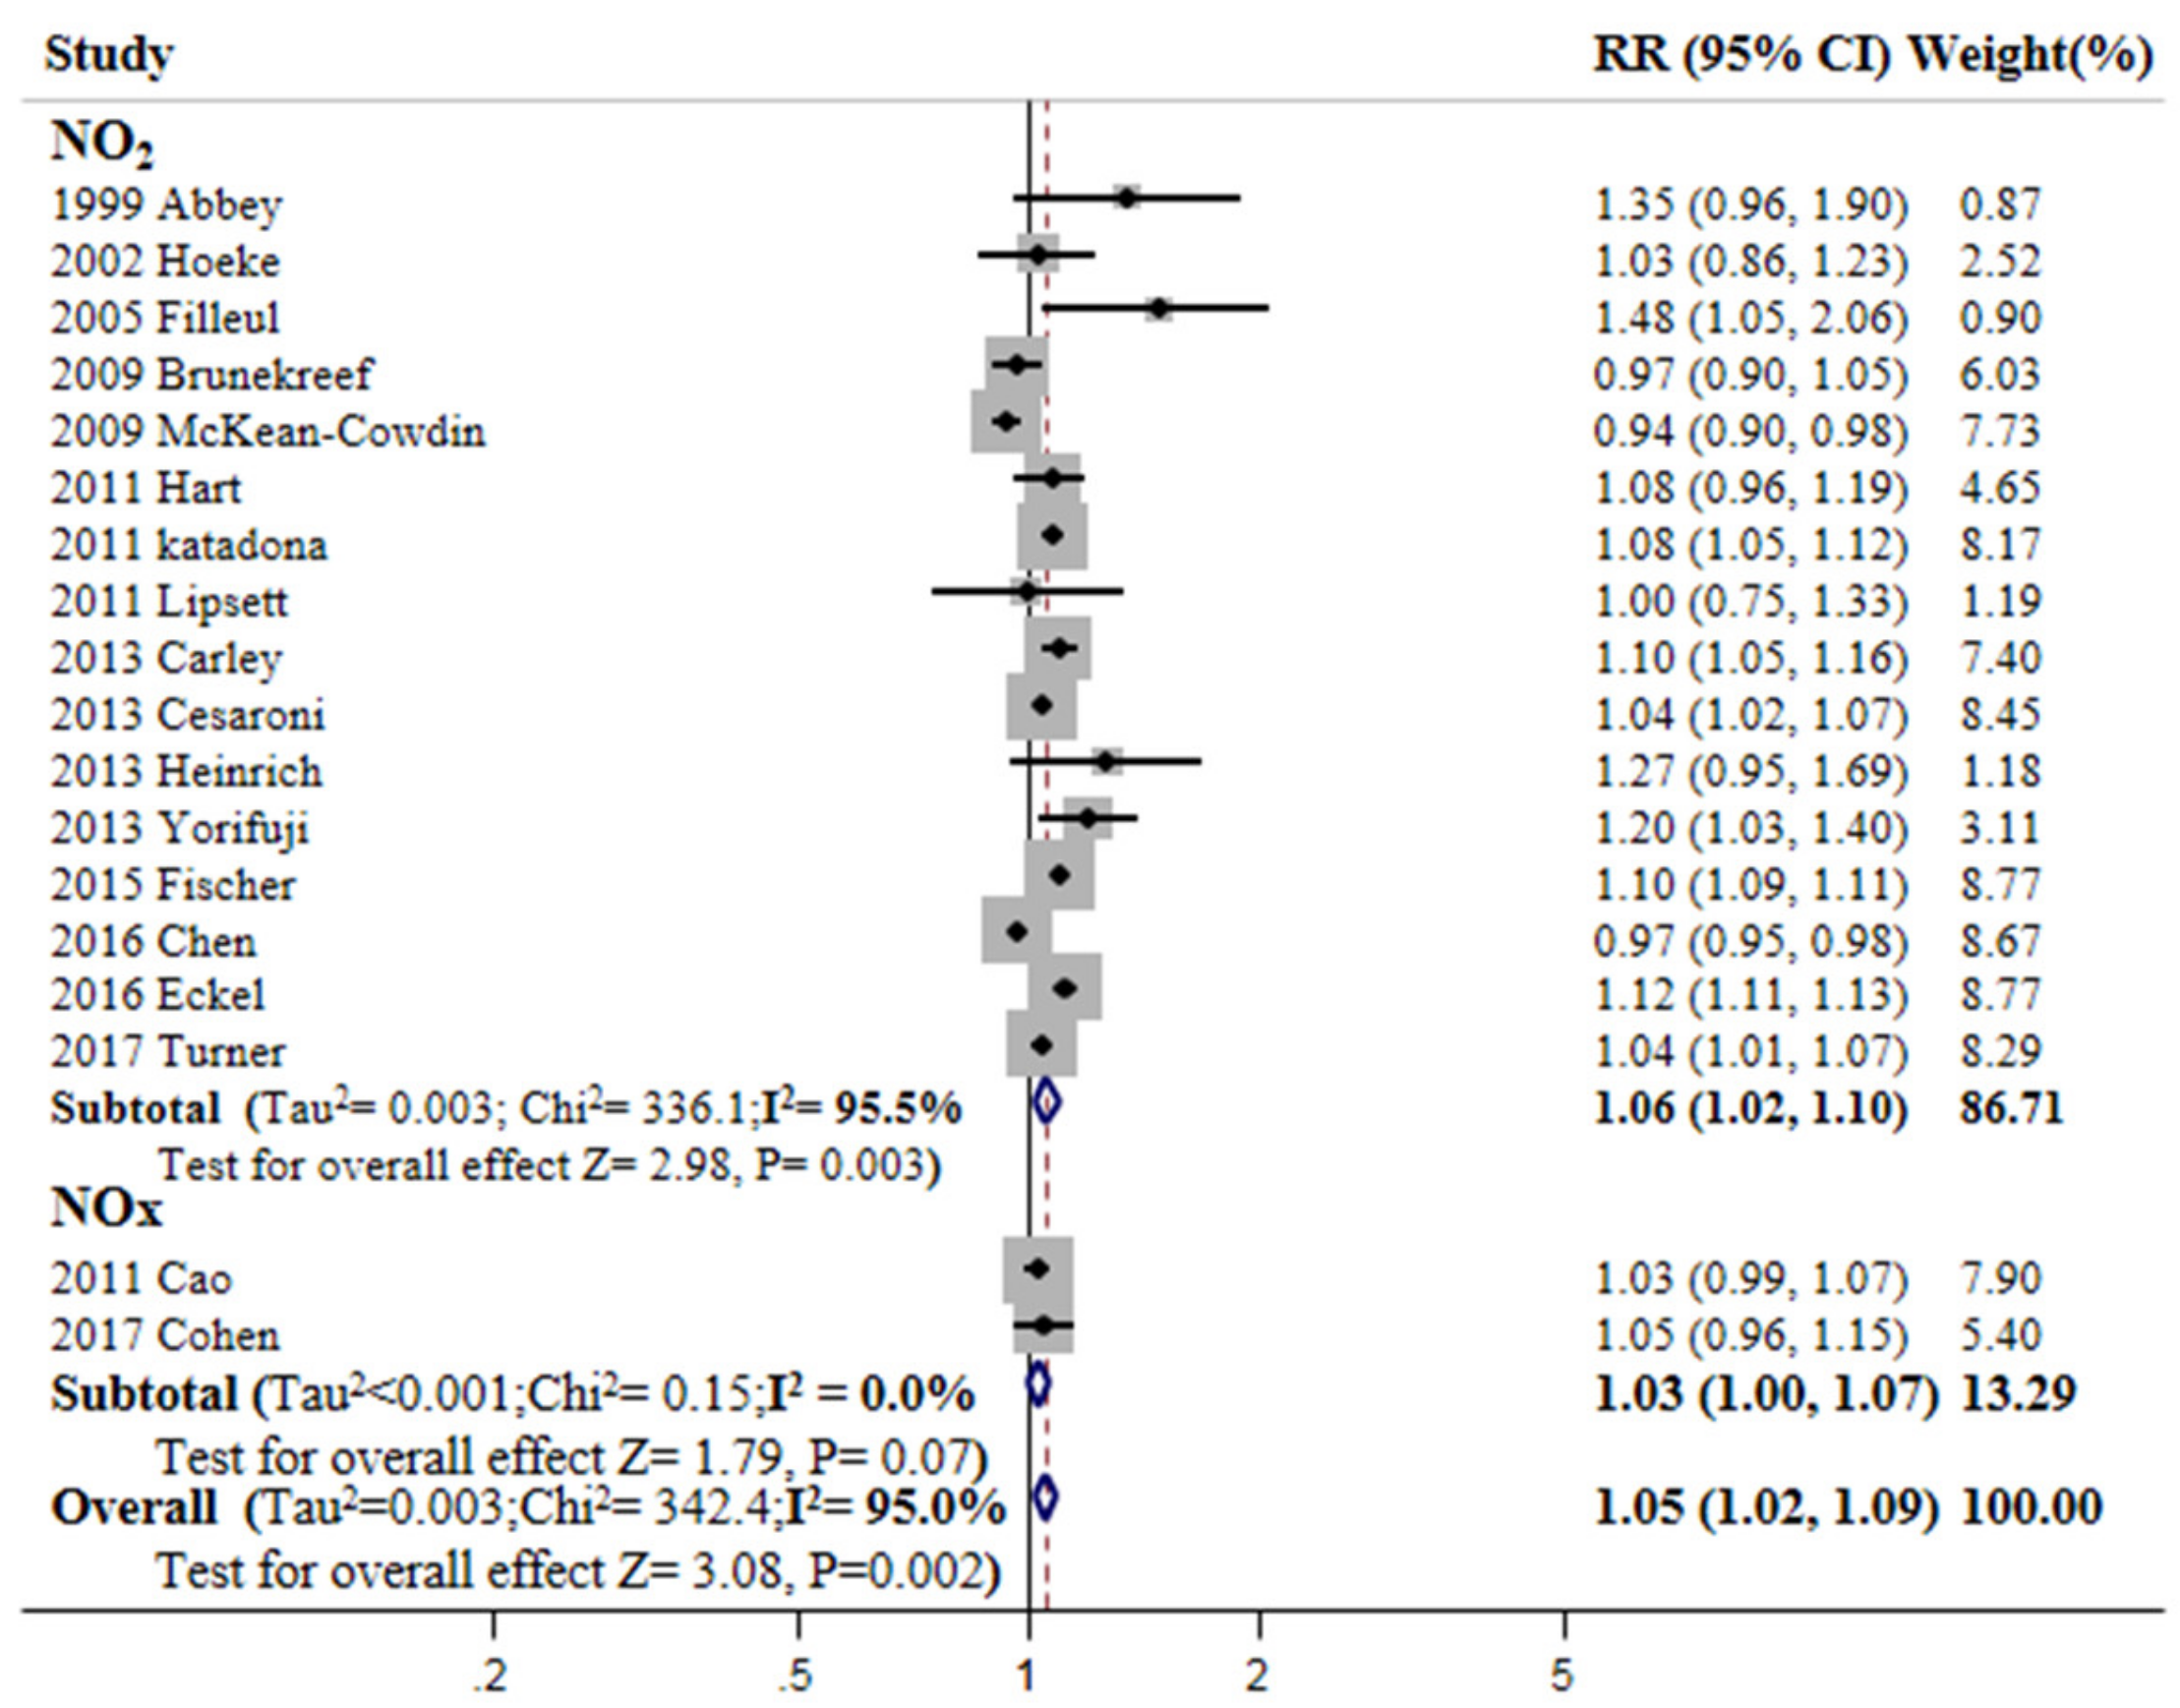
3.3. Overall Meta-Estimates and Publication Bias
3.4. Subgroup Analyses of the Association between PM2.5 and Cancer Mortality
3.5. Subgroup Analyses of the Association between PM10 and Cancer Mortality
4. Discussion
5. Conclusions
Author Contributions
Fundings
Acknowledgments
Conflicts of Interest
Appendix A

| Study | Adjusted Variables |
|---|---|
| Abbey et al. (1999) [15] | Education, smoking status, and alcohol use |
| Hoek et al. (2002) [16] | Age, sex, smoking status, education, occupation, SEP, BMI, alcohol consumption, total fat intake, vegetable consumption, and fruit consumption |
| Nafstad et al. (2004) [17] | Age, education, smoking habits, leisure-time physical activity, occupation, and risk groups for cardiovascular diseases |
| Filleul et al. (2005) [18] | Age; sex; smoking habits; educational level; BMI; and occupational exposure to dust, gases, and fumes |
| Boldo et al. (2006) [19] | Not available |
| Brunekreef et al. (2009) [20] | Age, sex, and smoking status |
| McKean-Cowdin et al. (2009) [21] | Age, sex, race, education level, number of colds in the past year, family history of brain cancer, previous radium treatment, number of head/neck X-rays, and use of vitamins |
| Cao et al. (2010) [22] | Age, sex, BMI, physical activity, education, smoking status, age at starting to smoke, years smoked, cigarettes per day, alcohol intake, and hypertension |
| Poppe CA et al. (2011) [23] | Age, sex, smoking status, education, marital status, BMI, alcohol consumption, occupational exposures, and diet |
| Hart et al. (2011) [24] | Age, calendar year, decade of hire, region of residence, race, ethnicity, census region of residence, the healthy worker survivor effect, and years of work in each of the job groups |
| Katanoda et al. (2011) [25] | Age, sex, smoking status, pack-years, smoking status of family members living together, daily green and yellow vegetable consumption, daily fruit consumption, and use of indoor charcoal or briquette braziers for heating |
| Lipsett et al. (2011) [26] | Age, race, smoking status, total pack-years, BMI, marital status, alcohol consumption, second-hand smoke exposure at home, dietary fat, dietary fiber, dietary calories, physical activity, menopausal status, hormone therapy use, family history of MI or stroke, blood pressure medication, aspirin use, and contextual variables (income, income inequality, education, population size, racial composition, and unemployment) |
| Lepeule et al. (2012) [27] | Age, sex, time in the study, BMI, education, and smoking history |
| Hales et al. (2013) [28] | Age, sex, ethnicity, social deprivation, income, education, smoking history, and ambient temperature |
| Hu et al. (2013) [29] | Age, race, marital status, cancer stage, year diagnosed, education, income, and accessibility to medical resources |
| Carey et al. (2013) [30] | Age, sex, smoking, BMI, and education |
| Cesaroni et al. (2013) [31] | Sex, marital status, place of birth, education, occupation, and SEP |
| Heinrich et al. (2013) [32] | Educational level and smoking history |
| Yorifuji et al. (2013) [33] | Age, sex, smoking category, BMI, hypertension, diabetes, financial capability, and area mean income |
| Fischer et al. (2015) [34] | Age, sex, marital status, region of origin, standardized household income, and neighborhood social status |
| Ancona et al. (2015) [35] | Age, gender, education, occupation, civil status, area-based SEP index, and outdoor nitrogen dioxide (NO2) concentration |
| Chen et al. (2016) [36] | Age, gender, marital status, education, BMI, smoking status, alcohol consumption, occupational exposures, and leisure exercise |
| Eckel et al. (2016) [37] | Age, sex, race/ethnicity, marital status, education index, SEP, rural-urban commuting area, distance to primary interstate highway, histology at diagnosis, year of diagnosis, and initial treatment |
| Weichenthal et al. (2016) [38] | Age, sex, aboriginal ancestry, visible minority status, immigrant status, marital status, highest level of education, employment status, occupational classification, and household income |
| Wong et al. (2016) [39] | Age, gender, BMI, smoking status, exercise frequency, education level, and personal monthly expenditure |
| Cohen et al. (2016) [40] | Age, sex, ethnicity, SEP, obesity at baseline, and smoking status |
| Guo et al. (2017) [41] | None |
| Pun et al. (2017) [42] | Race, smoking, diabetes, BMI, alcohol consumption, asthma, and median income |
| Deng et al. (2017) [43] | Age, sex, race/ethnicity, marital status, SEP, RUCA, distance to primary interstate highway, month and year of diagnosis, and initial treatments |
| Turner et al. (2017) [7] | Age, race/ethnicity, gender, education, marital status, BMI, smoking status, passive smoking, vegetable/fruit/fiber consumption, fat consumption, alcohol consumption, industrial exposures, occupation dirtiness index, and 1990 ecological covariates |
| Air Pollutants | p-Value from Egger’s Test | Begg’s Funnel Plot |
|---|---|---|
| PM2.5 | 0.40 | Symmetry |
| PM10 | 0.68 | Symmetry |
| NO2 | 0.41 | Symmetry |
References
- Cohen, A.J.; Brauer, M.; Burnett, R.; Anderson, H.R.; Frostad, J.; Estep, K.; Balakrishnan, K.; Brunekreef, B.; Dandona, L.; Dandona, R.; et al. Estimates and 25-year trends of the global burden of disease attributable to ambient air pollution: An analysis of data from the Global Burden of Diseases Study. Lancet 2017, 389, 1907–1918. [Google Scholar] [CrossRef]
- Loomis, D.; Grosse, Y.; Lauby-Secretan, B.; El Ghissassi, F.; Bouvard, V.; Benbrahim-Tallaa, L.; Guha, N.; Baan, R.; Mattock, H.; Straif, K. International Agency for Research on Cancer Monograph Working Group IARC. The carcinogenicity of outdoor air pollution. Lancet Oncol. 2013, 14, 1262–1263. [Google Scholar] [CrossRef]
- Hamra, G.B.; Guha, N.; Cohen, A.; Laden, F.; Raaschou-Nielsen, O.; Samet, J.M.; Vineis, P.; Forastiere, F.; Saldiva, P.; Yorifuji, T.; et al. Outdoor particulate matter exposure and lung cancer: A systematic review and meta-analysis. Environ. Health Perspect. 2014, 122, 906–911. [Google Scholar] [CrossRef] [PubMed]
- Cui, P.; Huang, Y.; Han, J.; Song, F.; Chen, K. Ambient particulate matter and lung cancer incidence and mortality: A meta-analysis of prospective studies. Eur. J. Public Health 2015, 25, 324–329. [Google Scholar] [CrossRef] [PubMed]
- Yang, W.S.; Zhao, H.; Wang, X.; Deng, Q.; Fan, W.Y.; Wang, L. An evidence-based assessment for the association between long-term exposure to outdoor air pollution and the risk of lung cancer. Eur. J. Cancer Prev. 2016, 25, 163–172. [Google Scholar] [CrossRef] [PubMed]
- Smittenaar, C.R.; Petersen, K.A.; Stewart, K.; Moitt, N. Cancer incidence and mortality projections in the UK until 2035. Br. J. Cancer 2016, 115, 1147–1155. [Google Scholar] [CrossRef] [PubMed]
- Turner, M.C.; Cohen, A.; Jerrett, M.; Gapstur, S.M.; Diver, W.R.; Pope, C.A., 3rd; Krewski, D.; Beckerman, B.S.; Samet, J.M. Ambient Air Pollution and Cancer Mortality in the Cancer Prevention Study II. Environ. Health Perspect. 2017, 125, 087013. [Google Scholar] [CrossRef] [PubMed] [Green Version]
- Stang, A. Critical evaluation of the Newcastle-Ottawa scale for the assessment of the quality of nonrandomized studies in meta-analyses. Eur. J. Epidemiol. 2010, 25, 603–605. [Google Scholar] [CrossRef] [PubMed] [Green Version]
- Mustafic, H.; Jabre, P.; Caussin, C.; Murad, M.H.; Escolano, S.; Tafflet, M.; Périer, M.C.; Marijon, E.; Vernerey, D.; Empana, J.P.; et al. Main air pollutants and myocardial infarction: A systematic review and meta-analysis. JAMA 2012, 307, 713–721. [Google Scholar] [CrossRef] [PubMed]
- Shah, A.S.; Langrish, J.P.; Nair, H.; McAllister, D.A.; Hunter, A.L.; Donaldson, K.; Newby, D.E.; Mills, N.L. Global association of air pollution and heart failure: A systematic review and meta-analysis. Lancet 2013, 382, 1039–1048. [Google Scholar] [CrossRef]
- Yang, W.S.; Wang, X.; Deng, Q.; Fan, W.Y.; Wang, W.Y. An evidence-based appraisal of global association between air pollution and risk of stroke. Int. J. Cardiol. 2014, 175, 307–313. [Google Scholar] [CrossRef] [PubMed]
- Higgins, J.P.; Thompson, S.G. Quantifying heterogeneity in a meta-analysis. Stat. Med. 2002, 21, 1539–1558. [Google Scholar] [CrossRef] [PubMed]
- Borenstein, M.; Hedges, L.V.; Higgins, J.P.; Rothstein, H.R. A basic introduction to fixed-effect and random-effects models for meta-analysis. Res. Synth. Methods 2010, 1, 97–111. [Google Scholar] [CrossRef] [PubMed]
- Egger, M.; Davey Smith, G.; Schneider, M.; Minder, C. Bias in meta-analysis detected by a simple, graphical test. BMJ 1997, 315, 629–634. [Google Scholar] [CrossRef] [PubMed] [Green Version]
- Abbey, D.E.; Nishino, N.; McDonnell, W.F.; Burchette, R.J.; Knutsen, S.F.; Lawrence Beeson, W.; Yang, J.X. Long-term inhalable particles and other air pollutants related to mortality in nonsmokers. Am. J. Respir. Crit. Care Med. 1999, 159, 373–382. [Google Scholar] [CrossRef] [PubMed]
- Hoek, G.; Brunekreef, B.; Goldbohm, S.; Fischer, P.; van den Brandt, P.A. Association between mortality and indicators of traffic-related air pollution in the Netherlands: A cohort study. Lancet 2002, 360, 1203–1209. [Google Scholar] [CrossRef]
- Nafstad, P.; Håheim, L.L.; Wisløff, T.; Gram, F.; Oftedal, B.; Holme, I.; Hjermann, I.; Leren, P. Urban air pollution and mortality in a cohort of Norwegian men. Environ. Health Perspect. 2004, 112, 610–615. [Google Scholar] [CrossRef] [PubMed]
- Filleul, L.; Rondeau, V.; Vandentorren, S.; Le Moual, N.; Cantagrel, A.; Annesi-Maesano, I.; Charpin, D.; Declercq, C.; Neukirch, F.; Paris, C.; et al. Twenty five year mortality and air pollution: Results from the French PAARC survey. Occup. Environ. Med. 2005, 62, 453–460. [Google Scholar] [CrossRef] [PubMed]
- Boldo, E.; Medina, S.; LeTertre, A.; Hurley, F.; Mücke, H.G.; Ballester, F.; Aguilera, I.; Eilstein, D.; Apheis Group. Apheis: Health impact assessment of long-term exposure to PM2.5 in 23 European cities. Eur. J. Epidemiol. 2006, 21, 449–458. [Google Scholar] [CrossRef] [PubMed]
- Brunekreef, B.; Beelen, R.; Hoek, G.; Schouten, L.; Bausch-Goldbohm, S.; Fischer, P.; Armstrong, B.; Hughes, E.; Jerrett, M.; van den Brandt, P. Effects of long-term exposure to traffic-related air pollution on respiratory and cardiovascular mortality in the Netherlands: The NLCS-AIR study. Res. Rep. Health Eff. Inst. 2009, 139, 5–71. [Google Scholar]
- McKean-Cowdin, R.; Calle, E.E.; Peters, J.M.; Henley, J.; Hannan, L.; Thurston, G.D.; Thun, M.J.; Preston Martin, S. Ambient air pollution and brain cancer mortality. Cancer Causes Control 2009, 20, 1645–1651. [Google Scholar] [CrossRef] [PubMed]
- Cao, J.; Yang, C.; Li, J.; Chen, R.; Chen, B.; Gu, D.; Kan, H. Association between long-term exposure to outdoor air pollution and mortality in China: A cohort study. J. Hazard. Mater. 2011, 186, 1594–1600. [Google Scholar] [CrossRef] [PubMed]
- Pope, C.A., 3rd; Burnett, R.T.; Turner, M.C.; Cohen, A.; Krewski, D.; Jerrett, M.; Gapstur, S.M.; Thun, M.J. Lung cancer and cardiovascular disease mortality associated with ambient air pollution and cigarette smoke: Shape of the exposure-response relationships. Environ. Health Perspect. 2011, 119, 1616–1621. [Google Scholar] [CrossRef] [PubMed]
- Hart, J.E.; Garshick, E.; Dockery, D.W.; Smith, T.J.; Ryan, L.; Laden, F. Long-term ambient multipollutant exposures and mortality. Am. J. Respir. Crit. Care Med. 2011, 183, 73–78. [Google Scholar] [CrossRef] [PubMed]
- Katanoda, K.; Sobue, T.; Satoh, H.; Tajima, K.; Suzuki, T.; Nakatsuka, H.; Takezaki, T.; Nakayama, T.; Nitta, H.; Tanabe, K.; et al. An association between long-term exposure to ambient air pollution and mortality from lung cancer and respiratory diseases in Japan. J. Epidemiol. 2011, 21, 132–143. [Google Scholar] [CrossRef] [PubMed]
- Lipsett, M.J.; Ostro, B.D.; Reynolds, P.; Goldberg, D.; Hertz, A.; Jerrett, M.; Smith, D.F.; Garcia, C.; Chang, E.T.; Bernstein, L. Long-term exposure to air pollution and cardiorespiratory disease in the California teachers study cohort. Am. J. Respir. Crit. Care Med. 2011, 184, 828–835. [Google Scholar] [CrossRef] [PubMed]
- Lepeule, J.; Laden, F.; Dockery, D.; Schwartz, J. Chronic exposure to fine particles and mortality: An extended follow-up of the Harvard Six Cities study from 1974 to 2009. Environ. Health Perspect. 2012, 120, 965–970. [Google Scholar] [CrossRef] [PubMed] [Green Version]
- Hales, S.; Blakely, T.; Woodward, A. Air pollution and mortality in New Zealand: Cohort study. J. Epidemiol. Community Health 2012, 66, 468–473. [Google Scholar] [CrossRef] [PubMed]
- Hu, H.; Dailey, A.B.; Kan, H.; Xu, X. The effect of atmospheric particulate matter on survival of breast cancer among US females. J. Epidemiol. Community Health 2012, 66, 468–473. [Google Scholar] [CrossRef] [PubMed]
- Carey, I.M.; Atkinson, R.W.; Kent, A.J.; van Staa, T.; Cook, D.G.; Anderson, H.R. Mortality associations with long-term exposure to outdoor air pollution in a national English cohort. Am. J. Respir. Crit. Care Med. 2013, 187, 1226–1233. [Google Scholar] [CrossRef] [PubMed]
- Cesaroni, G.; Badaloni, C.; Gariazzo, C.; Stafoggia, M.; Sozzi, R.; Davoli, M.; Forastiere, F. Long-term exposure to urban air pollution and mortality in a cohort of more than a million adults in Rome. Environ. Health Perspect. 2013, 121, 324–331. [Google Scholar] [CrossRef] [PubMed]
- Heinrich, J.; Thiering, E.; Rzehak, P.; Krämer, U.; Hochadel, M.; Rauchfuss, K.M.; Gehring, U.; Wichmann, H.E. Long-term exposure to NO2 and PM10 and all-cause and cause-specific mortality in a prospective cohort of women. Occup. Environ. Med. 2013, 70, 179–186. [Google Scholar] [CrossRef] [PubMed]
- Yorifuji, T.; Kashima, S.; Tsuda, T.; Ishikawa-Takata, K.; Ohta, T.; Tsuruta, K.; Doi, H. Long-term exposure to traffic-related air pollution and the risk of death from hemorrhagic stroke and lung cancer in Shizuoka, Japan. Sci. Total Environ. 2013, 443, 397–402. [Google Scholar] [CrossRef] [PubMed]
- Fischer, P.H.; Marra, M.; Ameling, C.B.; Hoek, G.; Beelen, R.; de Hoogh, K.; Breugelmans, O.; Kruize, H.; Janssen, N.A.; Houthuijs, D. Air Pollution and Mortality in Seven Million Adults: The Dutch Environmental Longitudinal Study (DUELS). Environ. Health Perspect. 2015, 123, 697–704. [Google Scholar] [CrossRef] [PubMed] [Green Version]
- Ancona, C.; Badaloni, C.; Mataloni, F.; Bolignano, A.; Bucci, S.; Cesaroni, G.; Sozzi, R.; Davoli, M.; Forastiere, F. Mortality and morbidity in a population exposed to multiple sources of air pollution: A retrospective cohort study using air dispersion models. Environ. Res. 2015, 137, 467–474. [Google Scholar] [CrossRef] [PubMed]
- Chen, X.; Zhang, L.W.; Huang, J.J.; Song, F.J.; Zhang, L.P.; Qian, Z.M.; Trevathan, E.; Mao, H.J.; Han, B.; Vaughn, M.; et al. Long-term exposure to urban air pollution and lung cancer mortality: A 12-year cohort study in Northern China. Sci. Total Environ. 2016, 571, 855–861. [Google Scholar] [CrossRef] [PubMed]
- Eckel, S.P.; Cockburn, M.; Shu, Y.H.; Deng, H.; Lurmann, F.W.; Liu, L.; Gilliland, F.D. Air pollution affects lung cancer survival. Thorax 2016, 71, 891–898. [Google Scholar] [CrossRef] [PubMed] [Green Version]
- Weichenthal, S.; Crouse, D.L.; Pinault, L.; Godri-Pollitt, K.; Lavigne, E.; Evans, G.; van Donkelaar, A.; Martin, R.V.; Burnett, R.T. Oxidative burden of fine particulate air pollution and risk of cause-specific mortality in the Canadian Census Health and Environment Cohort (CanCHEC). Environ. Res. 2016, 146, 92–99. [Google Scholar] [CrossRef] [PubMed] [Green Version]
- Wong, C.M.; Tsang, H.; Lai, H.K.; Thomas, G.N.; Lam, K.B.; Chan, K.P.; Zheng, Q.; Ayres, J.G.; Lee, S.Y.; Lam, T.H.; et al. Cancer Mortality Risks from Long-term Exposure to Ambient Fine Particle. Cancer Epidemiol. Biomark. Prev. 2016, 25, 839–845. [Google Scholar] [CrossRef] [PubMed] [Green Version]
- Cohen, G.; Levy, I.; Yuval; Kark, J.D.; Levin, N.; Broday, D.M.; Steinberg, D.M.; Gerber, Y. Long-term exposure to traffic-related air pollution and cancer among survivors of myocardial infarction: A 20-year follow-up study. Eur. J. Prev. Cardiol. 2017, 24, 92–102. [Google Scholar] [CrossRef] [PubMed]
- Guo, Y.; Zeng, H.; Zheng, R.; Li, S.; Pereira, G.; Liu, Q.; Chen, W.; Huxley, R. The burden of lung cancer mortality attributable to fine particles in China. Sci. Total Environ. 2017, 579, 1460–1466. [Google Scholar] [CrossRef] [PubMed]
- Pun, V.C.; Kazemiparkouhi, F.; Manjourides, J.; Suh, H.H. Long-Term PM2.5 Exposure and Respiratory, Cancer, and Cardiovascular Mortality in Older US Adults. Am. J. Epidemiol. 2017, 186, 961–969. [Google Scholar] [CrossRef] [PubMed]
- Deng, H.; Eckel, S.P.; Liu, L.; Lurmann, F.W.; Cockburn, M.G.; Gilliland, F.D. Particulate matter air pollution and liver cancer survival. Int. J. Cancer 2017, 141, 744–749. [Google Scholar] [CrossRef] [PubMed]
- Kreyling, W.G.; Semmler-Behnke, M.; Seitz, J.; Scymczak, W.; Wenk, A.; Mayer, P.; Takenaka, S.; Oberdörster, G. Size dependence of the translocation of inhaled iridium and carbon nanoparticle aggregates from the lung of rats to the blood and secondary target organs. Inhal. Toxicol. 2009, 21, 55–60. [Google Scholar] [CrossRef] [PubMed]
- Elder, A.; Gelein, R.; Silva, V.; Feikert, T.; Opanashuk, L.; Carter, J.; Potter, R.; Maynard, A.; Ito, Y.; Finkelstein, J.; et al. Translocation of inhaled ultrafine manganese oxide particles to the central nervous system. Environ. Health Perspect. 2006, 114, 114,1172–1178. [Google Scholar] [CrossRef] [PubMed]
- Pery, A.R.; Brochot, C.; Hoet, P.H.; Nemmar, A.; Bois, F.Y. Development of a physiologically based kinetic model for 99m-technetium-labelled carbon nanoparticles inhaled by humans. Inhal. Toxicol. 2009, 21, 1099–1107. [Google Scholar] [CrossRef] [PubMed] [Green Version]
- Møller, P.; Danielsen, P.H.; Karottki, D.G.; Jantzen, K.; Roursgaard, M.; Klingberg, H.; Jensen, D.M.; Christophersen, D.V.; Hemmingsen, J.G.; Cao, Y.; et al. Oxidative stress and inflammation generated DNA damage by exposure to air pollution particles. Mutat. Res. Rev. Mutat. Res. 2014, 762, 133–166. [Google Scholar] [CrossRef] [PubMed]
- Kruk, J.; Aboul-Enein, H.Y. Reactive Oxygen and Nitrogen Species in Carcinogenesis: Implications of Oxidative Stress on the Progression and Development of Several Cancer Types. Mini Rev. Med. Chem. 2017, 17, 904–919. [Google Scholar] [CrossRef] [PubMed]
- Zhu, M.; Du, J.; Liu, A.D.; Holmberg, L.; Tang, C.; Jin, H. Effect of endogenous sulfur dioxide in regulating cardiovascular oxidative stress. Histol. Histopathol. 2014, 29, 1107–1111. [Google Scholar] [PubMed]
- Kang, D.; Hamasaki, N. Mitochondrial oxidative stress and mitochondrial DNA. Clin. Chem. Lab. Med. 2003, 41, 1281–1288. [Google Scholar] [CrossRef] [PubMed]
- Kong, S.Y.; Goodman, M.; Judd, S.; Bostick, R.M.; Flanders, W.D.; McClellan, W. Oxidative balance score as predictor of all-cause, cancer, and noncancer mortality in a biracial US cohort. Ann. Epidmiol. 2015, 25, 256–262. [Google Scholar] [CrossRef] [PubMed]
- Veranth, J.M.; Moss, T.A.; Chow, J.C.; Labban, R.; Nichols, W.K.; Walton, J.C.; Watson, J.G.; Yost, G.S. Correlation of in vitro cytokine responses with the chemical composition of soil-derived particulate matter. Environ. Health Perspect. 2006, 114, 341–349. [Google Scholar] [CrossRef] [PubMed]
- Zhang, X.; Staimer, N.; Gillen, D.L.; Tjoa, T.; Schauer, J.J.; Shafer, M.M.; Hasheminassab, S.; Pakbin, P.; Vaziri, N.D.; Sioutas, C.; et al. Associations of oxidative stress and inflammatory biomarkers with chemically characterized air pollutant exposures in an elderly cohort. Environ. Res. 2016, 150, 306–319. [Google Scholar] [CrossRef] [PubMed]
- El-Omar, E.M.; Carrington, M.; Chow, W.H.; McColl, K.E.; Bream, J.H.; Young, H.A.; Herrera, J.; Lissowska, J.; Yuan, C.C.; Rothman, N.; et al. Interleukin-1 polymorphisms associated with increased risk of gastric cancer. Nature 2000, 404, 398–402. [Google Scholar] [CrossRef] [PubMed] [Green Version]
- Warzocha, K.; Ribeiro, P.; Bienvenu, J.; Roy, P.; Charlot, C.; Rigal, D.; Coiffier, B.; Salles, G. Genetic polymorphisms in the tumor necrosis factor locus influence non-Hodgkin’s lymphoma outcome. Blood 1998, 91, 3574–3581. [Google Scholar] [PubMed]
- Duncan, L.M.; Richards, L.A.; Mihm, M.C., Jr. Increased mast cell density in invasive melanoma. J. Cutan. Pathol. 1998, 25, 11–15. [Google Scholar] [CrossRef] [PubMed]
- Atkinson, R.W.; Butland, B.K.; Dimitroulopoulou, C.; Heal, M.R.; Stedman, J.R.; Carslaw, N.; Jarvis, D.; Heaviside, C.; Vardoulakis, S.; Walton, H.; et al. Long-term exposure to ambient ozone and mortality: A quantitative systematic review and meta-analysis of evidence from cohort studies. BMJ Open 2016, 6, e009493. [Google Scholar] [CrossRef] [PubMed]
- Chardon, B.; Host, S.; Lefranc, A.; Millard, F.; Gremy, I. What exposure indicator should be used to study the short-term respiratory health effect of photochemical air pollution? A case study in the Paris metropolitan area (2000–2003). Environ. Risques Sante 2007, 6, 345–353. [Google Scholar]
- Bräuner, E.V.; Andersen, Z.J.; Andersen, C.E.; Pedersen, C.; Gravesen, P.; Ulbak, K.; Hertel, O.; Loft, S.; Raaschou-Nielsen, O. Residential radon and brain tumour incidence in a Danish cohort. PLoS ONE 2013, 8, e74435. [Google Scholar] [CrossRef] [PubMed] [Green Version]
- Di, Q.; Wang, Y.; Zanobetti, A.; Wang, Y.; Koutrakis, P.; Choirat, C.; Dominici, F.; Schwartz, J.D. Air Pollution and Mortality in the Medicare Population. N. Engl. J. Med. 2017, 376, 2513–2522. [Google Scholar] [CrossRef] [PubMed] [Green Version]


| References (Publication Year) | Type of Cohort Study | Country | Years Enrolled | Number of Cases | Cancer Site | Definition of Pollutant Exposure (Incremental Increase) | RR (95% CI) | Quality Assessment (Newcastle–Ottawa Stars) |
|---|---|---|---|---|---|---|---|---|
| Abbey et al. (1999) [15] | Prospective | USA | 1977–1992 | 29 cases | Lung | PM10 24.08 µg/m3 increase | 3.36 (1.57–7.19) | 8 |
| Hoek et al. (2002) [16] | Prospective | Netherlands | 1986–1994 | 244 cases | Non-lung | NO2 30 µg/m3 increase | 1.08 (0.63–1.85) | 9 |
| Nafstad et al. (2004) [17] | Prospective | Norway | 1972–1998 | 382 cases | Lung | NOx 10 µg/m3 increase | 1.11 (1.03–1.19) | 8 |
| Filleul et al. (2005) [18] | Prospective | France | 1974–2000 | 178 cases | Lung | NO2 10 µg/m3 increase | 1.48 (1.05–2.06) | 9 |
| Boldo et al. (2006) [19] | Prospective | Spain | 1999–2003 | 1901 cases | Lung | PM2.5 15 µg/m3 increase | 1.14 (1.04–1.23) | 5 |
| Brunekreef et al. (2009) [20] | Prospective | Netherlands | 1987–1996 | 1935 cases | Lung | PM2.5 10 µg/m3 increase | 1.06 (0.82–1.38) | 8 |
| McKean-Cowdin et al. (2009) [21] | Prospective | USA | 1982–1988 | 1284 cases | Brain | PM2.5 10 µg/m3 increase | 0.91 (0.74–1.11) | 8 |
| Cao et al. (2010) [22] | Prospective | China | 1991–2000 | 624 cases | Lung | SO2 10 µg/m3 increase | 1.04 (1.02–1.06) | 8 |
| Poppe CA et al. (2011) [23] | Prospective | USA | 1983–1988 | 3194 cases | Lung | PM2.5 10 µg/m3 increase | 1.14 (1.04–1.23) | 8 |
| Hart et al. (2011) [24] | Prospective | USA | 1985–2000 | 800 cases | Lung | PM2.5 4 µg/m3 increase | 1.02 (0.95–1.10) | 6 |
| Katanoda et al. (2011) [25] | Prospective | Japan | 1983–1992 | 518 cases | Lung | PM2.5 10 µg/m3 increase | 1.24(1.12–1.37) | 8 |
| Lipsett et al. (2011) [26] | Prospective | USA | 1996–2005 | 234 cases | Lung | PM2.5 10 µg/m3 increase | 0.95 (0.70–1.28) | 8 |
| Lepeule et al. (2012) [27] | Prospective | USA | 1974–2009 | 350 cases | Lung | PM2.5 10 µg/m3 increase | 1.37 (1.07–1.75) | 9 |
| Hales et al. (2013) [28] | Prospective | New Zealand | 1996–1998 | 1686 cases | Lung | PM10 1 µg/m3 increase | 1.02 (1.00–1.03) | 8 |
| Hu et al. (2013) [29] | Prospective | USA | 1999–2009 | 255,128 women | Breast | PM10 10 µg/m3 increase | 1.13 (1.02–1.25) | 6 |
| Carey et al. (2013) [30] | Prospective | United Kingdom | 2003–2007 | 5273 cases | Lung | PM2.5 1.9 µg/m3 increase | 1.04 (0.99–1.09) | 6 |
| Cesaroni et al. (2013) [31] | Prospective | Italy | 2001–2010 | 12,208 cases | Lung | PM2.5 10 µg/m3 increase | 1.05 (1.01–1.10) | 8 |
| Heinrich et al. (2013) [32] | Prospective | Germany | 1990-2008 | 41 cases | Lung | PM10 7 µg/m3 increase | 1.84 (1.23–2.74) | 8 |
| Yorifuji et al. (2013) [33] | Prospective | Japan | 1999–2009 | 116 cases | Lung | NO2 10 µg/m3 increase | 1.20(1.03–1.40) | 8 |
| Fischer et al. (2015) [34] | Prospective | Netherlands | 2004–2011 | 53,735 cases | Lung | PM10 10 µg/m3 increase | 1.26 (1.21–1.30) | 8 |
| Ancona et al. (2015) [35] | Retrospective | Italy | 2001–2010 | 2196 cases | All | PM10 27 µg/m3 increase | 1.04 (0.92–1.17) | 8 |
| Chen et al. (2016) [36] | Prospective | China | 1998–2009 | 140 cases | Lung | PM10 10 µg/m3 increase | 1.05 (1.03–1.06) | 9 |
| Eckel et al. (2016) [37] | Prospective | USA | 1988–2009 | 352,053 cases | Lung | PM2.5 5.3 µg/m3 increase | 1.15 (1.14–1.16) | 7 |
| Weichenthal et al. (2016) [38] | Prospective | Canada | 1991–2009 | 3200 cases | Lung | PM2.5 10 µg/m3 increase | 1.05 (1.00–1.10) | 7 |
| Wong et al. (2016) [39] | Prospective | Hong Kong | 1998–2011 | 4531 cases | All | PM2.5 10 µg/m3 increase | 1.22 (1.11–1.34) | 8 |
| Cohen et al. (2016) [40] | Prospective | Israel | 1992–2013 | 105 cases | All | NOx 10 ppb increase | 1.08 (0.93–1.26) | 9 |
| Guo et al. (2017) [41] | Prospective | China | 1990–2009 | 315,530 cases | Lung | PM2.5 10 µg/m3 increase | 1.08 (1.07–1.09) | 5 |
| Pun et al. (2017) [42] | Prospective | USA | 2000–2008 | 255,544 cases | All | PM2.5 10 µg/m3 increase | 1.11 (1.09–1.12) | 7 |
| Deng et al. (2017) [43] | Prospective | USA | 2000–2009 | 20,221 cases | Liver | PM2.5 10 µg/m3 increase | 1.18 (1.16–1.20) | 8 |
| Turner et al. (2017) [7] | Prospective | Canada | 1982–2004 | 43,320 cases | Non-lung | NO2 6.5 ppb increase | 1.06 (1.02–1.10) | 8 |
| Subgroups | PM2.5 | PM10 | ||||
|---|---|---|---|---|---|---|
| No. of Studies | Summary RR (95% CI) | I2 (%) | No. of Studies | Summary RR (95% CI) | I2 (%) | |
| Gender | ||||||
| Male only | 5 | 1.14 (1.00, 1.29) | 80.5 | 4 | 1.06 (0.93, 1.22) | 69.1 |
| Female only | 6 | 1.13 (1.05, 1.21) | 32.0 | 6 | 1.03 (0.92, 1.15) | 72.3 |
| Male and Female | 16 | 1.18 (1.11, 1.25) | 97.8 | 6 | 1.10 (1.05, 1.16) | 94.9 |
| Region | ||||||
| America | 11 | 1.18 (1.08, 1.29) | 97.2 | 6 | 1.05 (1.05. 1.23) | 76.5 |
| Europe | 5 | 1.16 (1.00, 1.35) | 94.9 | 4 | 1.18 (0.99, 1.41) | 95.3 |
| Asia | 3 | 1.17 (1.05, 1.30) | 85.1 | 1 | 1.05 (1.03, 1.06) | NA |
| Follow-up period | ||||||
| <10 years | 10 | 1.17 (1.07, 1.27) | 96.3 | 4 | 1.11 (0.96, 1.29) | 89.6 |
| ≥10 years | 9 | 1.19 (1.07, 1.32) | 98.1 | 9 | 1.06 (1.03, 1.09) | 82.1 |
| Mean levels of pollutant concentration according to the WHO guideline | ||||||
| Below the standard | 4 | 1.20 (1.04, 1.39) | 98.3 | 1 | 1.16 (1.04, 1.29) | NA |
| Above the standard | 12 | 1.18 (1.09, 1.28) | 91.1 | 9 | 1.09 (1.04, 1.15) | 93.1 |
| Types of cancer | ||||||
| Lung cancer | 14 | 1.14 (1.07, 1.21) | 97.1 | 9 | 1.07 (1.03, 1.11) | 83.3 |
| Cancers other than lung cancer | 5 | 1.16 (1.04, 1.30) | 90.9 | 3 | 1.05 (0.99, 1.11) | 44.1 |
| Brain cancer | 2 | 1.00 (0.84, 1.19) | 36.1 | 2 | 0.93 (0.83, 1.03) | 0.0 |
| Lymphatic & hematopoietic cancer | 2 | 1.06 (0.90, 1.25) | 10.6 | 1 | 1.04 (0.93, 1.16) | NA |
| Breast cancer | 3 | 1.60 (0.94, 2.72) | 83.4 | 2 | 1.06 (0.93, 1.21) | 64.6 |
| Liver cancer | 2 | 1.29 (1.06, 1.58) | 67.8 | 1 | 1.11 (0.84, 1.46) | NA |
| Pancreas cancer | 1 | 0.96 (0.91, 1.02) | NA | 1 | 1.05 (1.04, 1.28) | NA |
| Larynx cancer | 1 | 1.09 (0.66, 1.79) | NA | 1 | 1.27 (1.06, 1.54) | NA |
| Stomach cancer | 2 | 1.17 (0.83, 1.65) | 73.4 | 1 | 0.99 (0.84, 1.16) | NA |
| Colorectal cancer | 2 | 1.08 (1.00, 1.17) | 0.0 | 1 | 0.87 (0.71, 1.07) | NA |
| Bladder cancer | 1 | 1.32 (1.07, 1.60) | NA | 1 | 1.17 (0.88, 1.57) | NA |
| Kidney cancer | 1 | 1.35 (1.07, 1.72) | NA | 1 | 1.03 (0.84, 1.26) | NA |
| Stage of cancer | ||||||
| Localized | 3 | 1.81 (1.63, 2.01) | 74.0 | 2 | 1.20 (1.12, 1.28) | 45.1 |
| Regional | 3 | 1.47 (1.36, 1.59) | 55.2 | 2 | 1.12 (1.11, 1.13) | 0.0 |
| Metastasis | 3 | 1.17 (1.05, 1.30) | 71.2 | 2 | 1.08 (1.02, 1.14) | 49.3 |
| No. of participants | ||||||
| Small (<100,000) [15,16,17,18,22,24,25,27,32,33,35,36,39,40] | 5 | 1.22 (1.15, 1.30) | 0.0 | 6 | 1.05 (0.97, 1.13) | 77.0 |
| Large (>100,000) [7,19,20,21,23,28,29,30,31,34,37,38,41,42,43] | 14 | 1.17 (1.10, 1.24) | 98.1 | 6 | 1.11 (1.02, 1.21) | 92.8 |
| Methodological quality | ||||||
| Low quality (<8) | 9 | 1.14 (1.06, 1.22) | 98.1 | 4 | 1.09 (1.08, 1.10) | 0.0 |
| High quality (≥8) | 10 | 1.20 (1.08, 1.33) | 93.5 | 8 | 1.10 (1.01, 1.21) | 94.2 |
| Smoking status | ||||||
| Non-smokers | 3 | 1.14 (1.01, 1.28) | 0.0 | 1 | 1.66 (1.22, 2.28) | NA |
| Ex-smokers | 3 | 1.47 (1.17, 1.84) | 51.4 | |||
| Current smokers | 2 | 1.33 (1.20, 1.49) | 0.0 | |||
© 2018 by the authors. Licensee MDPI, Basel, Switzerland. This article is an open access article distributed under the terms and conditions of the Creative Commons Attribution (CC BY) license (http://creativecommons.org/licenses/by/4.0/).
Share and Cite
Kim, H.-B.; Shim, J.-Y.; Park, B.; Lee, Y.-J. Long-Term Exposure to Air Pollutants and Cancer Mortality: A Meta-Analysis of Cohort Studies. Int. J. Environ. Res. Public Health 2018, 15, 2608. https://0-doi-org.brum.beds.ac.uk/10.3390/ijerph15112608
Kim H-B, Shim J-Y, Park B, Lee Y-J. Long-Term Exposure to Air Pollutants and Cancer Mortality: A Meta-Analysis of Cohort Studies. International Journal of Environmental Research and Public Health. 2018; 15(11):2608. https://0-doi-org.brum.beds.ac.uk/10.3390/ijerph15112608
Chicago/Turabian StyleKim, Hong-Bae, Jae-Yong Shim, Byoungjin Park, and Yong-Jae Lee. 2018. "Long-Term Exposure to Air Pollutants and Cancer Mortality: A Meta-Analysis of Cohort Studies" International Journal of Environmental Research and Public Health 15, no. 11: 2608. https://0-doi-org.brum.beds.ac.uk/10.3390/ijerph15112608