The External Performance Appraisal of China Energy Regulation: An Empirical Study Using a TOPSIS Method Based on Entropy Weight and Mahalanobis Distance


Abstract
:1. Introduction
2. Literature Review
2.1. Research on the Energy Regulation
2.2. Research Related to TOPSIS Appraisal Method
3. The Method for Appraising the External Performance of Energy Regulation
3.1. Traditional TOPSIS Method
3.2. An Improved TOPSIS Method Based on Entropy Weight and Mahalanobis Distance
3.2.1. Definition of Mahalanobis Distance
3.2.2. E-M-TOPSIS Method
3.2.3. Properties of the E-M-TOPSIS Method
4. Appraisal Indexes and Data Concerning External Performances of Energy Regulation
4.1. The Appraisal Indexes Concerning External Performance of Energy Regulation
4.2. Descriptive Statistical Analysis
5. Empirical Results of the External Performance Appraisal of China Energy Regulation
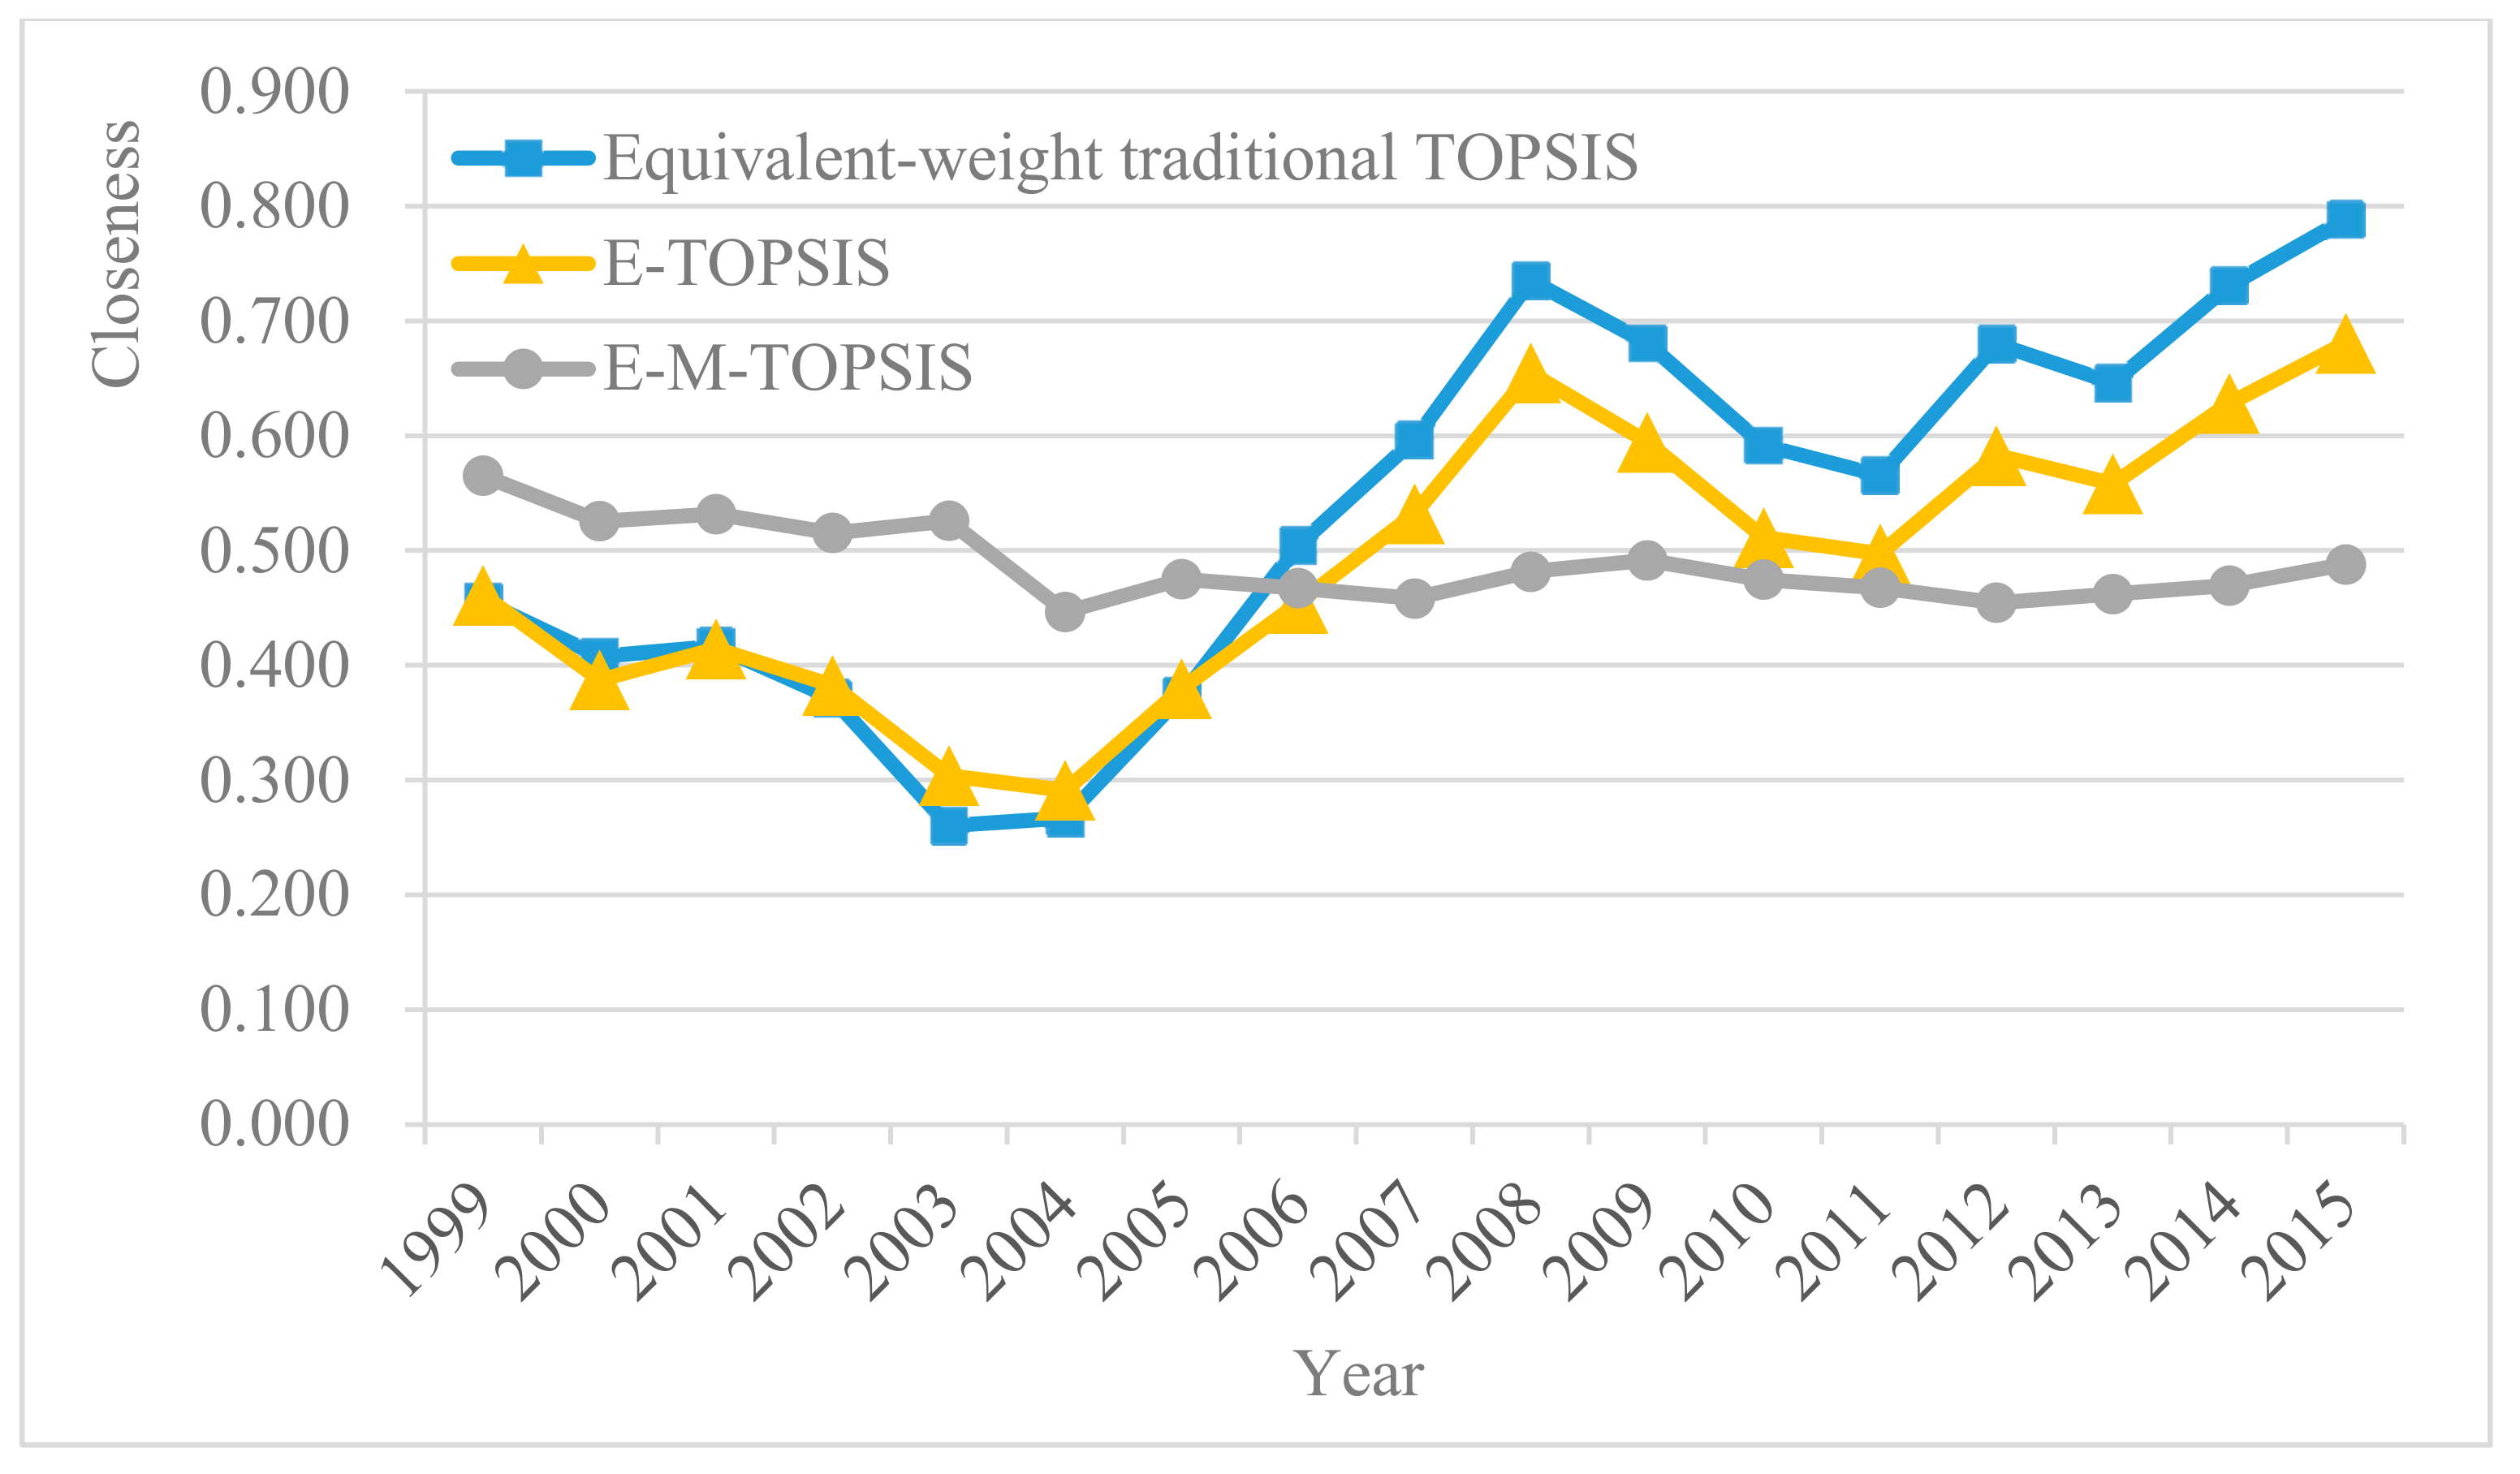
5.1. The External Performance Appraisal of China Energy Regulation Based on the E-M-TOPSIS Method
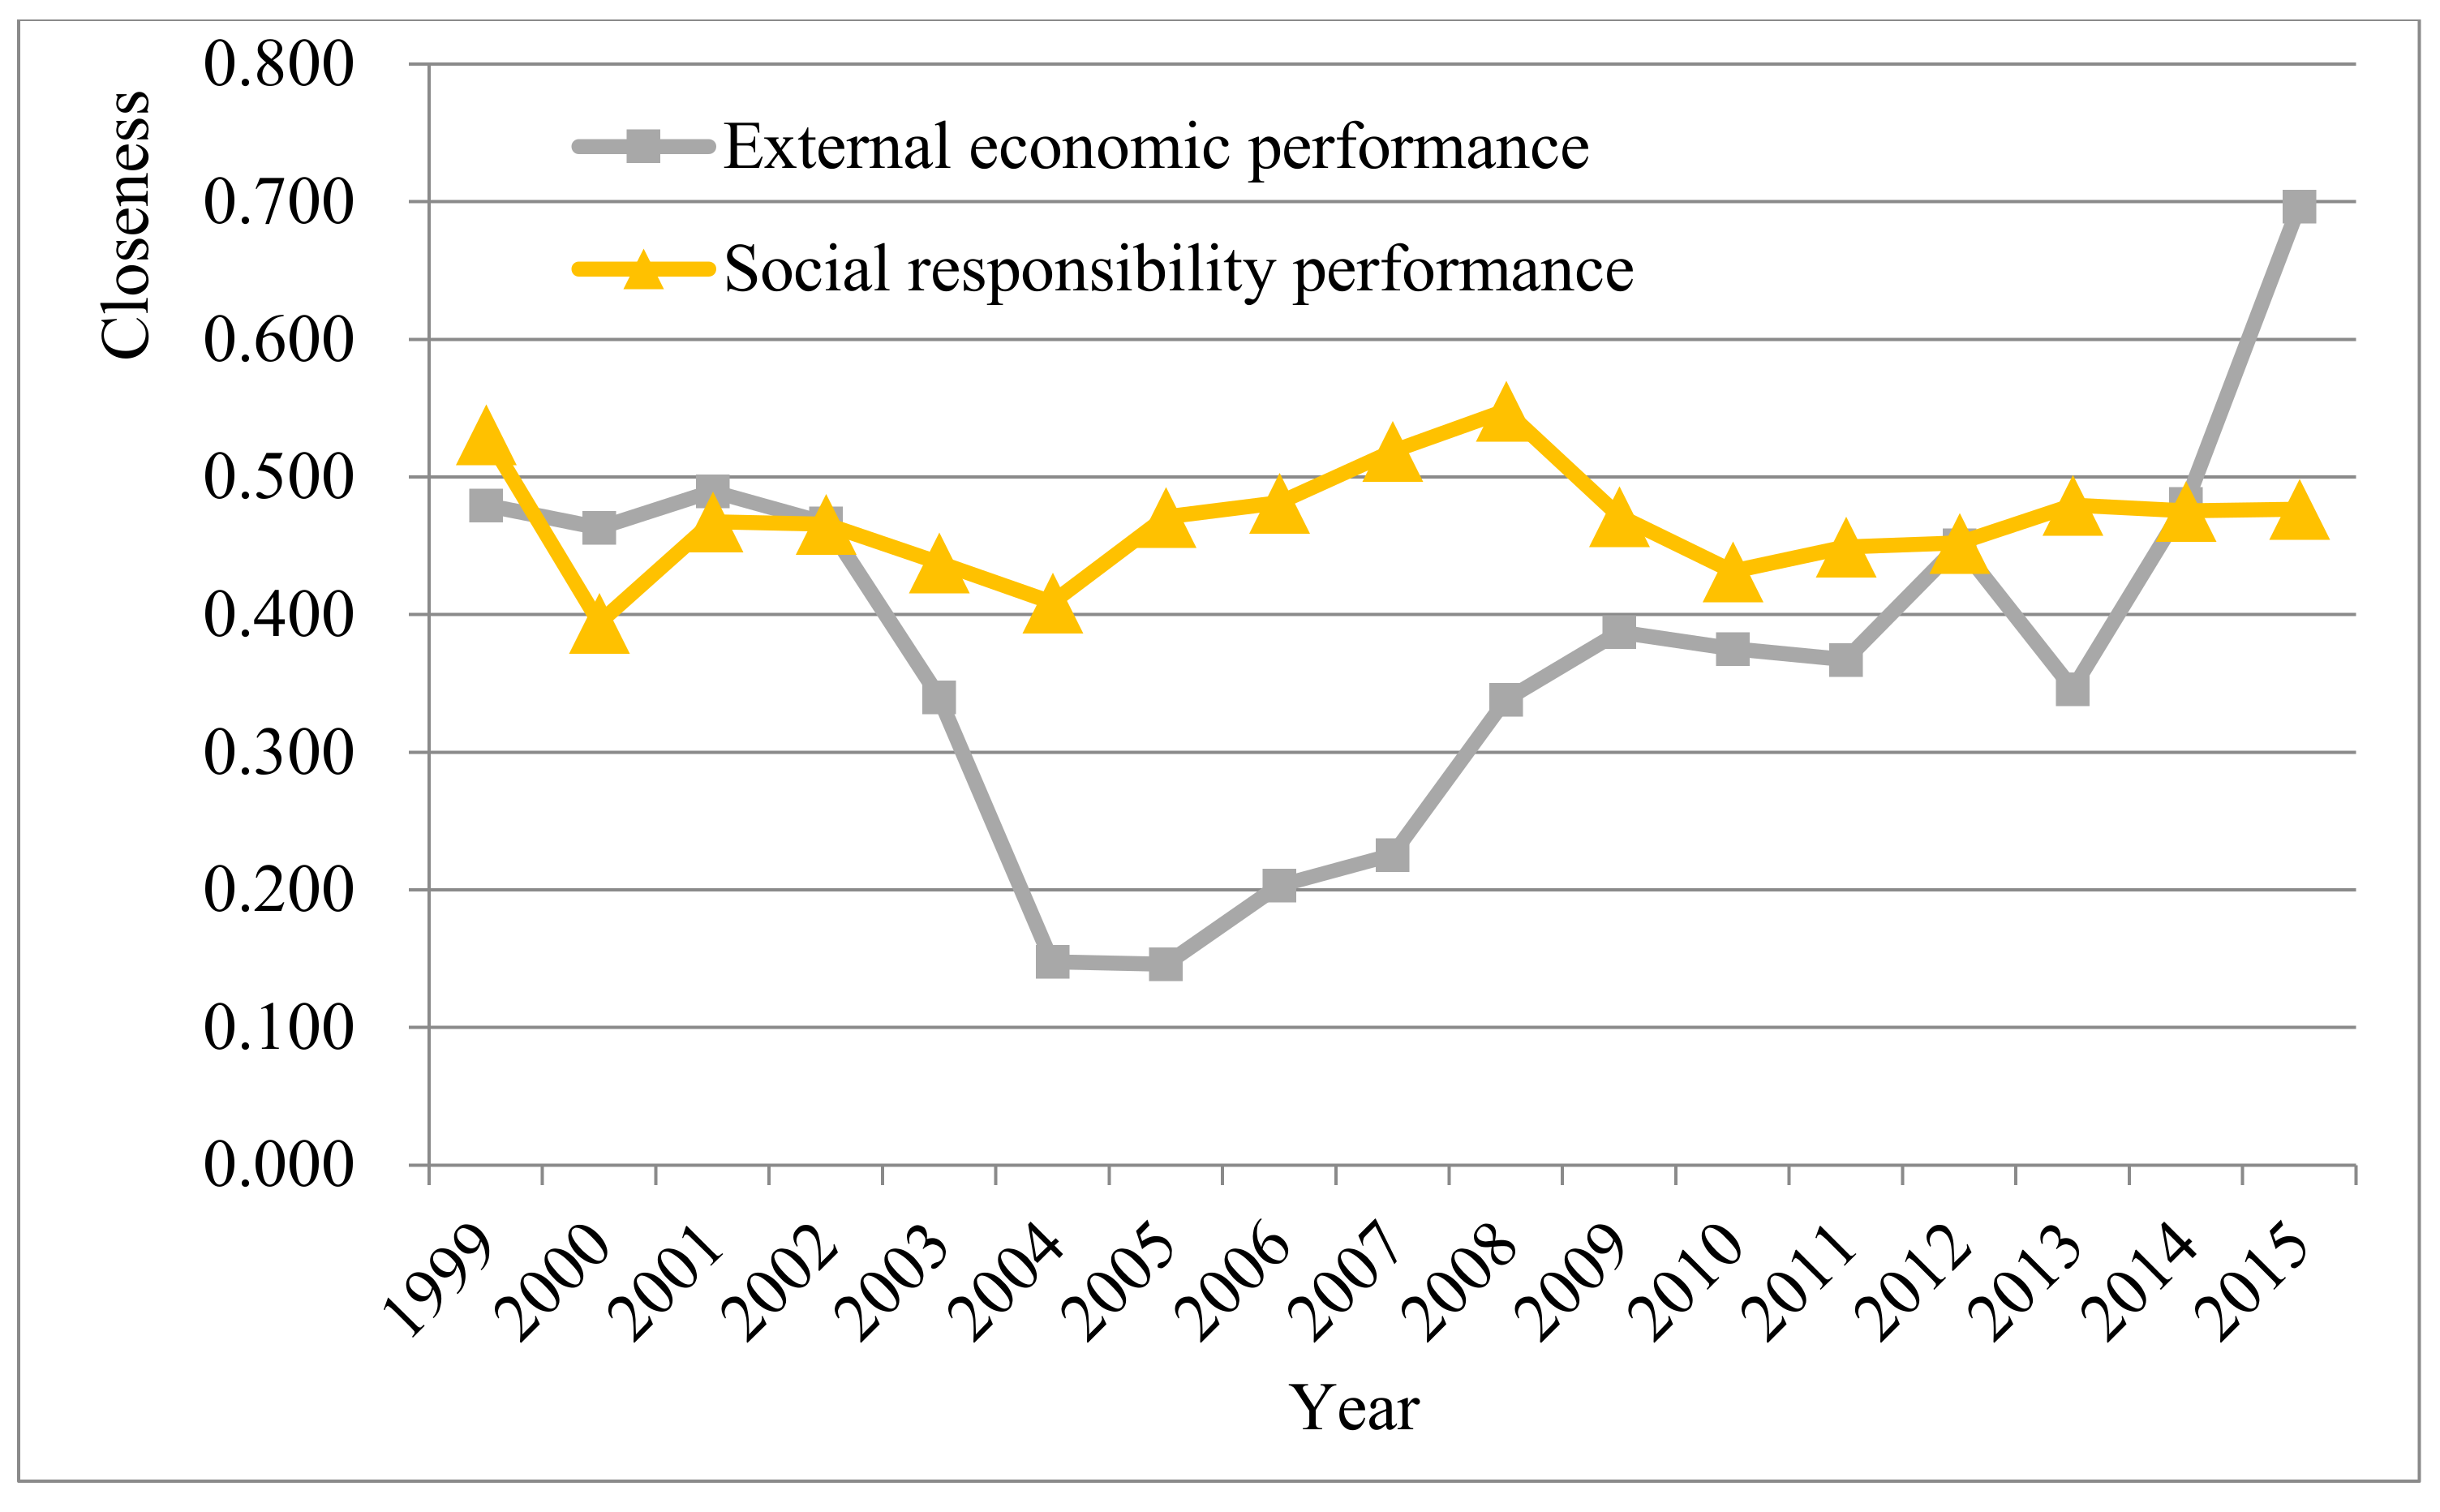
5.2. Discussion and Policy Implications
6. Conclusions
Future Work
Acknowledgments
Author Contributions
Conflicts of Interest
References
- Ates, S.A.; Durakbasa, N.M. Evaluation of corporate energy management practices of energy intensive industries in Turkey. Energy 2012, 45, 81–91. [Google Scholar] [CrossRef]
- Fernando, Y.; Hor, W.L. Impacts of energy management practices on energy efficiency and carbon emissions reduction: A survey of Malaysian manufacturing firms. Resour. Conserv. Recyc. 2017, 126, 62–73. [Google Scholar] [CrossRef]
- Cubbin, J.; Stern, J. The Impact of Regulatory Governance and Privatization on Electricity Industry Generation Capacity in Developing Economies. World Bank Econ. Rev. 2006, 20, 115–141. [Google Scholar] [CrossRef]
- Matsumura, T.; Yamagishi, A. Long-run welfare effect of energy conservation regulation. Econ. Lett. 2017, 154, 64–68. [Google Scholar] [CrossRef]
- Zhao, X.; Luo, D. Driving force of rising renewable energy in China: Environment, regulation and employment. Renew. Sustain. Energy Rev. 2017, 68, 48–56. [Google Scholar] [CrossRef]
- Bradshaw, A. Regulatory change and innovation in Latin America: The case of renewable energy in Brazil. Util. Policy 2017, 49, 156–164. [Google Scholar] [CrossRef]
- Ju, K.; Su, B.; Zhou, D.; Wu, J. Does energy-price regulation benefit China’s economy and environment Evidence from energy-price distortions. Energy Policy 2017, 105, 108–119. [Google Scholar] [CrossRef]
- Shi, X.; Sun, S. Energy price, regulatory price distortion and economic growth: A case study of China. Energy Econ. 2017, 63, 261–271. [Google Scholar] [CrossRef]
- Abrardi, L.; Cambini, C. Tariff regulation with energy efficiency goals. Energy Econ. 2015, 49, 122–131. [Google Scholar] [CrossRef]
- Mandel, B.H. Performance-Based Regulation to Improve Upstream Energy Efficiency. Electr. J. 2014, 27, 20–35. [Google Scholar] [CrossRef]
- Cai, W.; Liu, F.; Xie, J.; Zhou, X. An energy management approach for the mechanical manufacturing industry through developing a multi-objective energy benchmark. Energy Convers. Manag. 2017, 132, 361–371. [Google Scholar] [CrossRef]
- Thamae, L.Z.; Thamae, R.I.; Thamae, T.M. Assessing a decade of regulatory performance for the Lesotho electricity industry. Util. Policy 2015, 35, 91–101. [Google Scholar] [CrossRef]
- Duan, Y.; Mu, H.; Li, N.; Li, L.; Xue, Z. Research on Comprehensive Evaluation of Low Carbon Economy Development Level Based on AHP-Entropy Method: A Case Study of Dalian. Energy Procedia 2016, 104, 468–474. [Google Scholar] [CrossRef]
- Yin, K.; Wang, P.; Li, X. The Multi-Attribute Group Decision-Making Method Based on Interval Grey Trapezoid Fuzzy Linguistic Variables. Int. J. Environ. Res. Public Health 2017, 14, 1561. [Google Scholar] [CrossRef] [PubMed]
- Shirazi, A.; Najafi, B.; Aminyavari, M.; Rinaldi, F.; Taylor, R.A. Thermal–economic–environmental analysis and multi-objective optimization of an ice thermal energy storage system for gas turbine cycle inlet air cooling. Energy 2014, 69, 212–226. [Google Scholar] [CrossRef]
- Adibi, N.; Ataeepour, M.; Rahmanpour, M. Integration of sustainable development concepts in open pit mine design. J. Clean. Prod. 2015, 108, 1037–1049. [Google Scholar] [CrossRef]
- Chen, S.; Lu, C. Appraising Marketing Performance for Insurance Businesses through Improved Fuzzy Modified GRA. J. Grey Syst. 2014, 26, 96–116. [Google Scholar]
- Mohammadi, A.; Shojaei, P.; Kaydan, B.; Akabari, Z. Prioritizing the Performance of Civil Development Projects in Governmental Administration Agencies, using Gray Relational Analysis (GRA) and TOPSIS Approach. Decis. Sci. Lett. 2016, 5, 487–498. [Google Scholar] [CrossRef]
- Lima-Junior, F.R.; Carpinetti, L.C.R. Combining SCOR model and fuzzy TOPSIS for supplier evaluation and management. Int. J. Prod. Econ. 2016, 174, 128–141. [Google Scholar] [CrossRef]
- You, P.; Guo, S.; Zhao, H.; Zhao, H. Operation Performance Evaluation of Power Grid Enterprise Using a Hybrid BWM-TOPSIS Method. Sustainability 2017, 9, 2329. [Google Scholar] [CrossRef]
- Hwang, C.L.; Yoon, K. Multiple Attribute Decision Making: Methods and Applications; Springer: New York, NY, USA, 1981; ISBN 978-3-642-48318-9C. [Google Scholar]
- Zavadskas, E.K.; Peldschus, F.; Kaklauskas, A. Multiple Criteria Evaluation of Projects in Construction; Technika: Vilnius, Lithuania, 1994; ISBN 9985-05-046-4. [Google Scholar]
- Triantaphyllou, E. Multi-Criteria Decision Making Methods: A Comparative Study; Kluwer Academic Publishers: Dordrecht, The Netherlands, 2000; ISBN 9780792366072. [Google Scholar]
- Chen, T.Y.; Tsao, C.Y. Experimental analysis of the intuitionistic fuzzy TOPSIS method on distance measures. In Proceedings of the 10th Joint Conference on Information Sciences, Salt Lake City, UT, USA, 18–24 July 2007; pp. 1057–1063. [Google Scholar]
- Chang, C.H.; Lyn, J.J.; Chiang, M.C.; Ho, W.R. Domestic open-end equity mutual fund performance evaluation using extended TOPSIS method with different distance approaches. In Proceedings of the 2nd International Multi-Conference on Society, Cybernetic and Informatics, Orlando, FL, USA, 29 June–2 July 2008; Volume 3, pp. 151–156. [Google Scholar]
- Antuchevičienė, J.; Zavadskas, E.K.; Zakarevičius, A. Multiple criteria construction management decisions considering relations between criteria. Technol. Econ. Dev. Econ. 2010, 16, 109–125. [Google Scholar] [CrossRef]
- Wang, Z.X.; Wang, Y.Y. Evaluation of the provincial competitiveness of the Chinese high-tech industry using an improved TOPSIS method. Expert Syst. Appl. 2014, 41, 2824–2831. [Google Scholar] [CrossRef]
- Wang, E.; Alp, N.; Shi, J.; Wang, C.; Zhang, X.; Chen, H. Multi-criteria building energy performance benchmarking through variable clustering based compromise TOPSIS with objective entropy weighting. Energy 2017, 125, 197–210. [Google Scholar] [CrossRef]
- Chauhan, R.; Singh, T.; Tiwari, A.; Patnaik, A.; Thakur, N.S. Hybrid entropy—TOPSIS approach for energy performance prioritization in a rectangular channel employing impinging air jets. Energy 2017, 134, 360–368. [Google Scholar] [CrossRef]
- Xin, L.; Xie, Y.; Zhe, X. Social Security Performance Evaluation Based on Principal Component Analysis and TOPSIS Approach. Public Financ. Res. 2017, 7, 50–52. [Google Scholar]
- Zanakis, S.H.; Solomon, A.; Wishart, N.; Dublish, S. Multi-attribute decision making: A simulation comparison of select methods. Eur. J. Oper. Res. 1998, 107, 507–529. [Google Scholar] [CrossRef]
- Olsen, D.L. Comparison of weights in TOPSIS models. Math. Comput. Model. 2004, 40, 721–727. [Google Scholar] [CrossRef]
- Paxkan, C.; Wu, M.L. On the equivalence of operational performance measurement and multiple attribute decision making. Int. J. Prod. Res. 1997, 35, 2963–2988. [Google Scholar]
- Li, P.; Qian, H.; Wu, J.; Chen, J. Sensitivity analysis of TOPSIS method in water quality assessment: I. Sensitivity to the parameter weights. Environ. Monit. Assess. 2013, 185, 2453–2461. [Google Scholar] [CrossRef] [PubMed]
- Li, P.; Wu, J.; Qian, H. Assessment of groundwater quality for irrigation purposes and identification of hydrogeochemical evolution mechanisms in Pengyang county, China. Environ. Earth Sci. 2013, 69, 2211–2225. [Google Scholar] [CrossRef]
- Mahalanobis, P.C. On the generalised distance in statistics. Proc. Natl. Inst. Sci. 1936, 2, 49–55. [Google Scholar]
- Xiang, S.; Nie, F.; Zang, C. Learning a Mahalanobis distance metric for data clustering and classification. Pattern Recognit. 2008, 41, 3600–3612. [Google Scholar] [CrossRef]
- Ghosh-Dastidar, S.; Adeli, H. Wavelet-clustering-neural network model for freeway incident detection. Comput.-Aided Civ. Infrastruct. Eng. 2003, 18, 325–338. [Google Scholar] [CrossRef]
- Taguchi, G.; Jugulum, R. The Mahalanobis-Taguchi Strategy: A Pattern Technology System; John Wiley & Sons: Hoboken, NJ, USA, 2002; ISBN 9780471023333. [Google Scholar]
- Williams, C.J.; Heglund, P.J. A method for assigning species into groups based on generalized Mahalanobis distance between habitat model coefficients. Environ. Ecol. Stat. 2009, 16, 495–513. [Google Scholar] [CrossRef]
- Shannon, C.E. A mathematical theory of communication. Bell Syst. Tech. J. 1948, 27, 379–656. [Google Scholar] [CrossRef]
- Zhang, H.; Gu, C.L.; Zhang, Y. The evaluation of tourism destination competitiveness by TOPSIS & information entropy—A case in the Yangtze River Delta of China. Tour. Manag. 2011, 32, 443–451. [Google Scholar]
- Li, L. The performance evaluation system of American urban pubic utilities regulation. Chin. Public Admin. 2014, 6, 114–119. [Google Scholar]
- Wang, J.H. Study on the Innovation of Government Regulation System of Urban Public Utilities in China; China Social Sciences Press: Beijing, China, 2016; ISBN 978-7-5161-7962-8. [Google Scholar]


| Methods | Properties | Advantages | Limitations |
|---|---|---|---|
| Traditional TOPSIS | The relative closeness degree is changed for non-singular linear transformation | 1.Rational and understandable logic 2. Limited subjective input 3.The ability to identify the best alternative quickly and incorporate relative weights of criterion importance | 1. Subjective weight-determining process 2. The correlation between indexes cannot be eliminated |
| E-TOPSIS | The relative closeness degree is unchanged for non-singular linear transformation | 1. Objective weight-determining process 2. Other advantages are the same as traditional TOPSIS | The correlation between indexes cannot be eliminated |
| E-M-TOPSIS | 1. The relative closeness degree is unchanged for non-singular linear transformation 2.When the appraisal indexes are independent of each other, the weighted Mahalanobis distance is equivalent to the weighted Euclidean distance | 1. Objective weight-determining process 2. Scale-invariant property 3. Elimination of the linear correlation among indicators 4. Other advantages are the same as traditional TOPSIS | The nonlinear correlation between indexes cannot be eliminated |
| Class | Index | Calculation Method | Unit | |
|---|---|---|---|---|
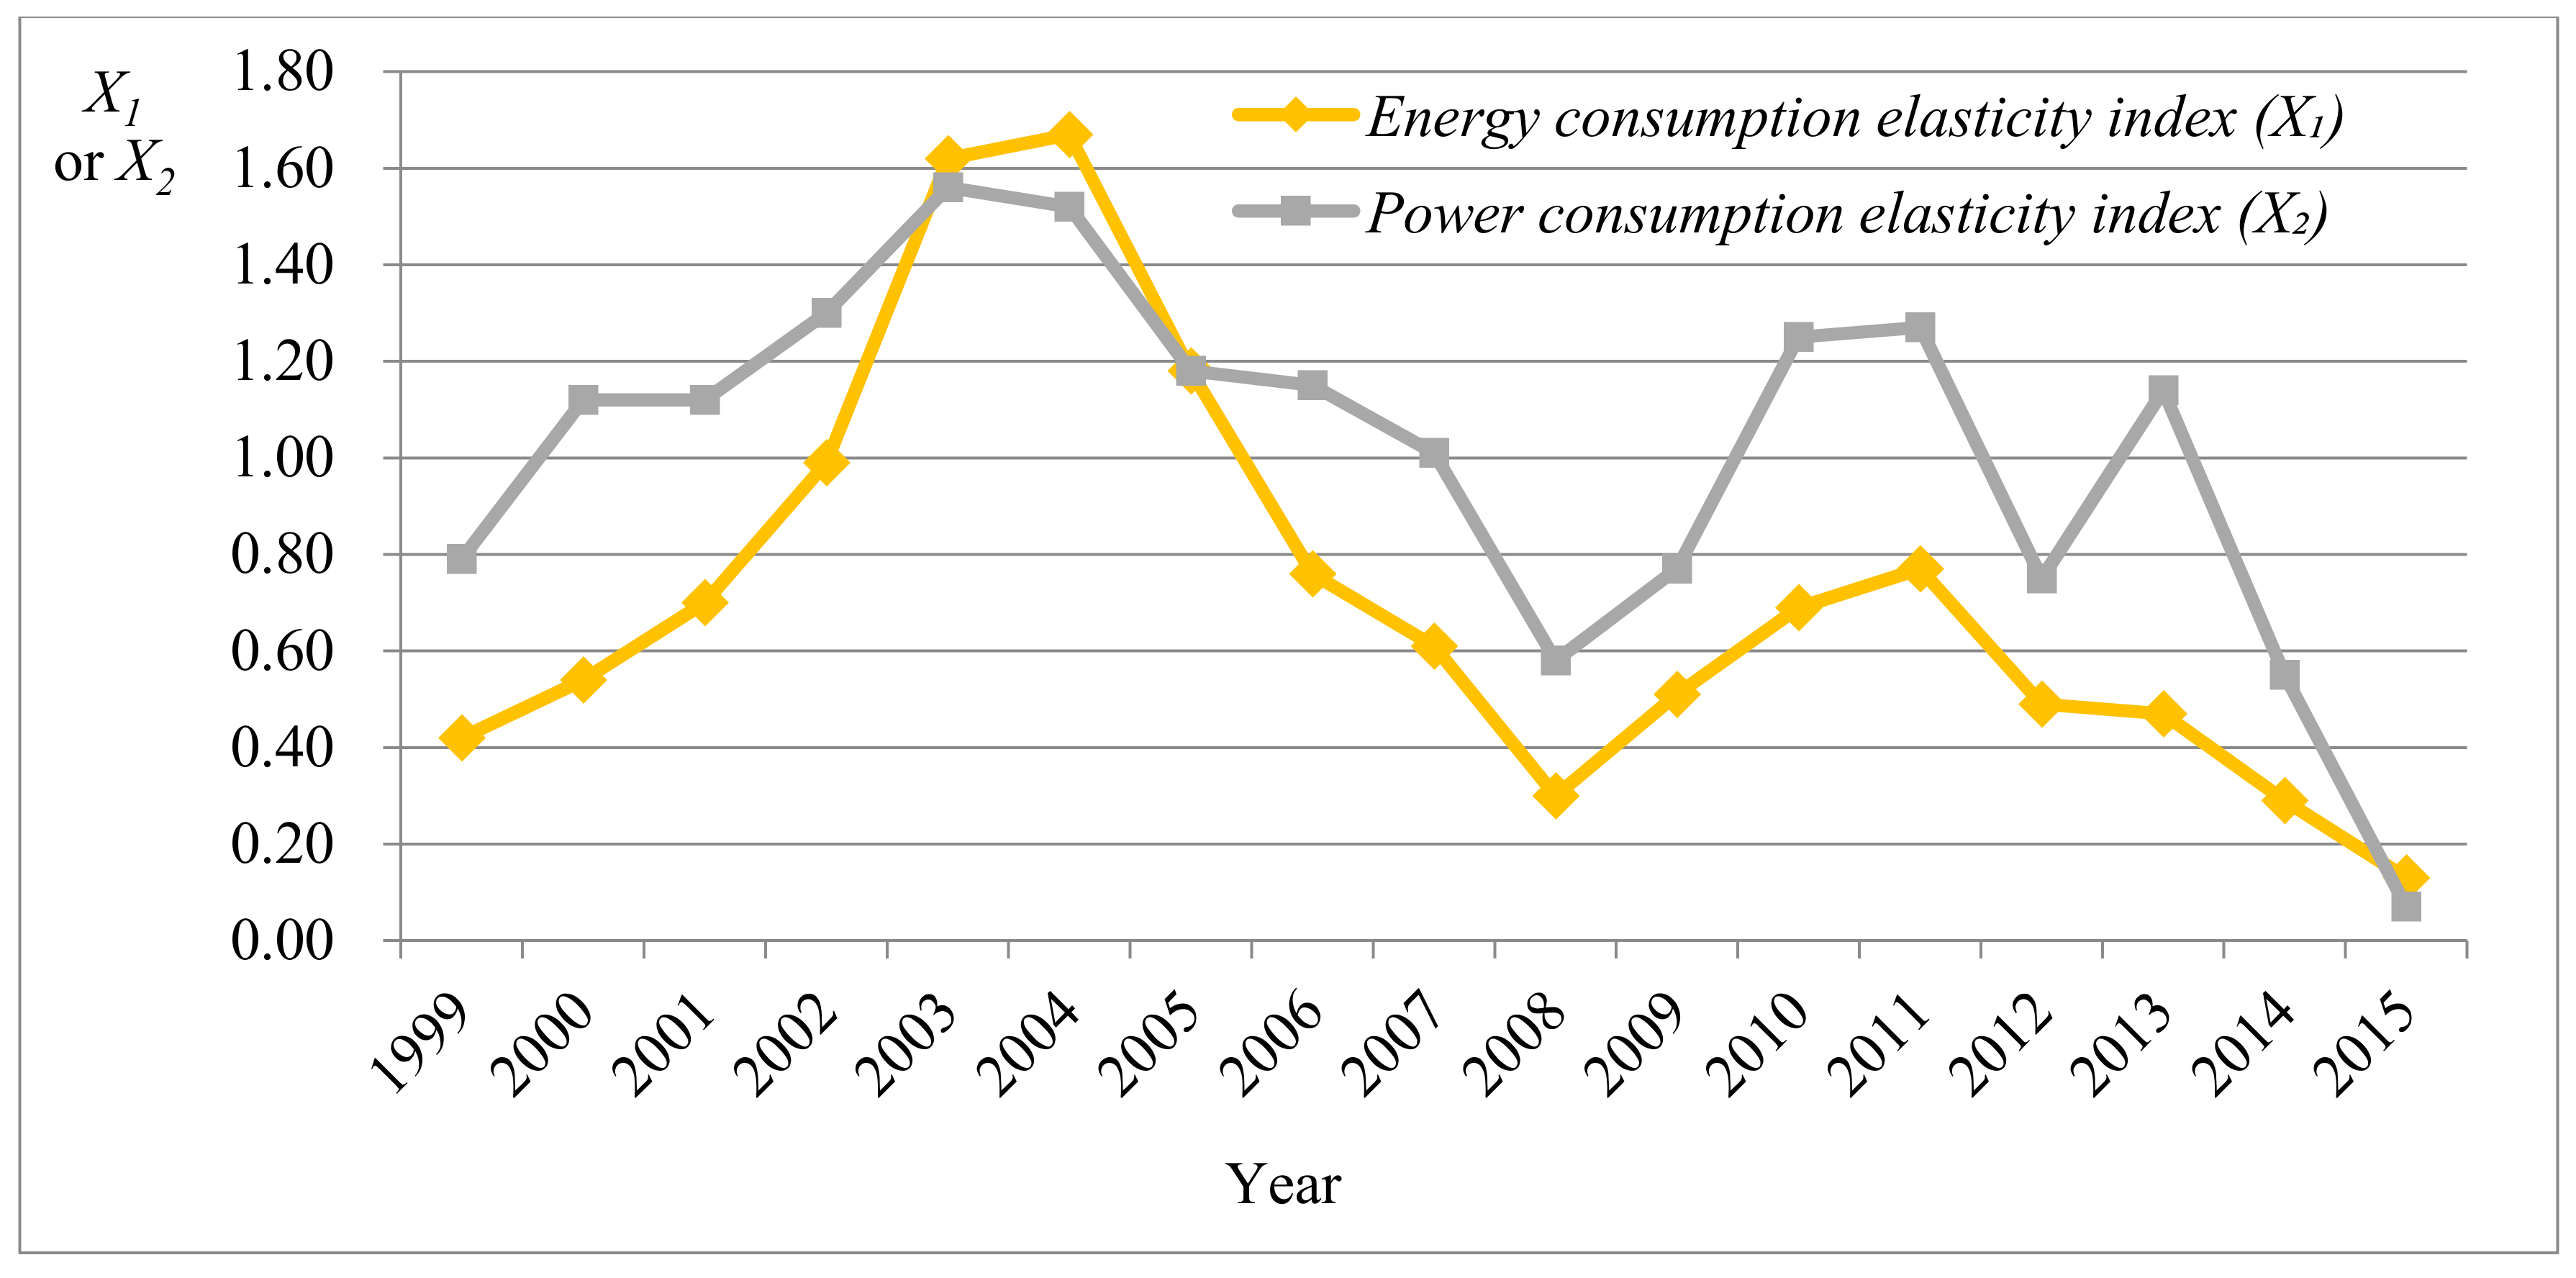
| External economic performance | Energy consumption elasticity index | Average annual growth rate of energy consumptions/average annual growth rate of GDP | No | |
| Power consumption elasticity index | Average annual growth rate of power consumptions/average annual growth rate of GDP | No | ||
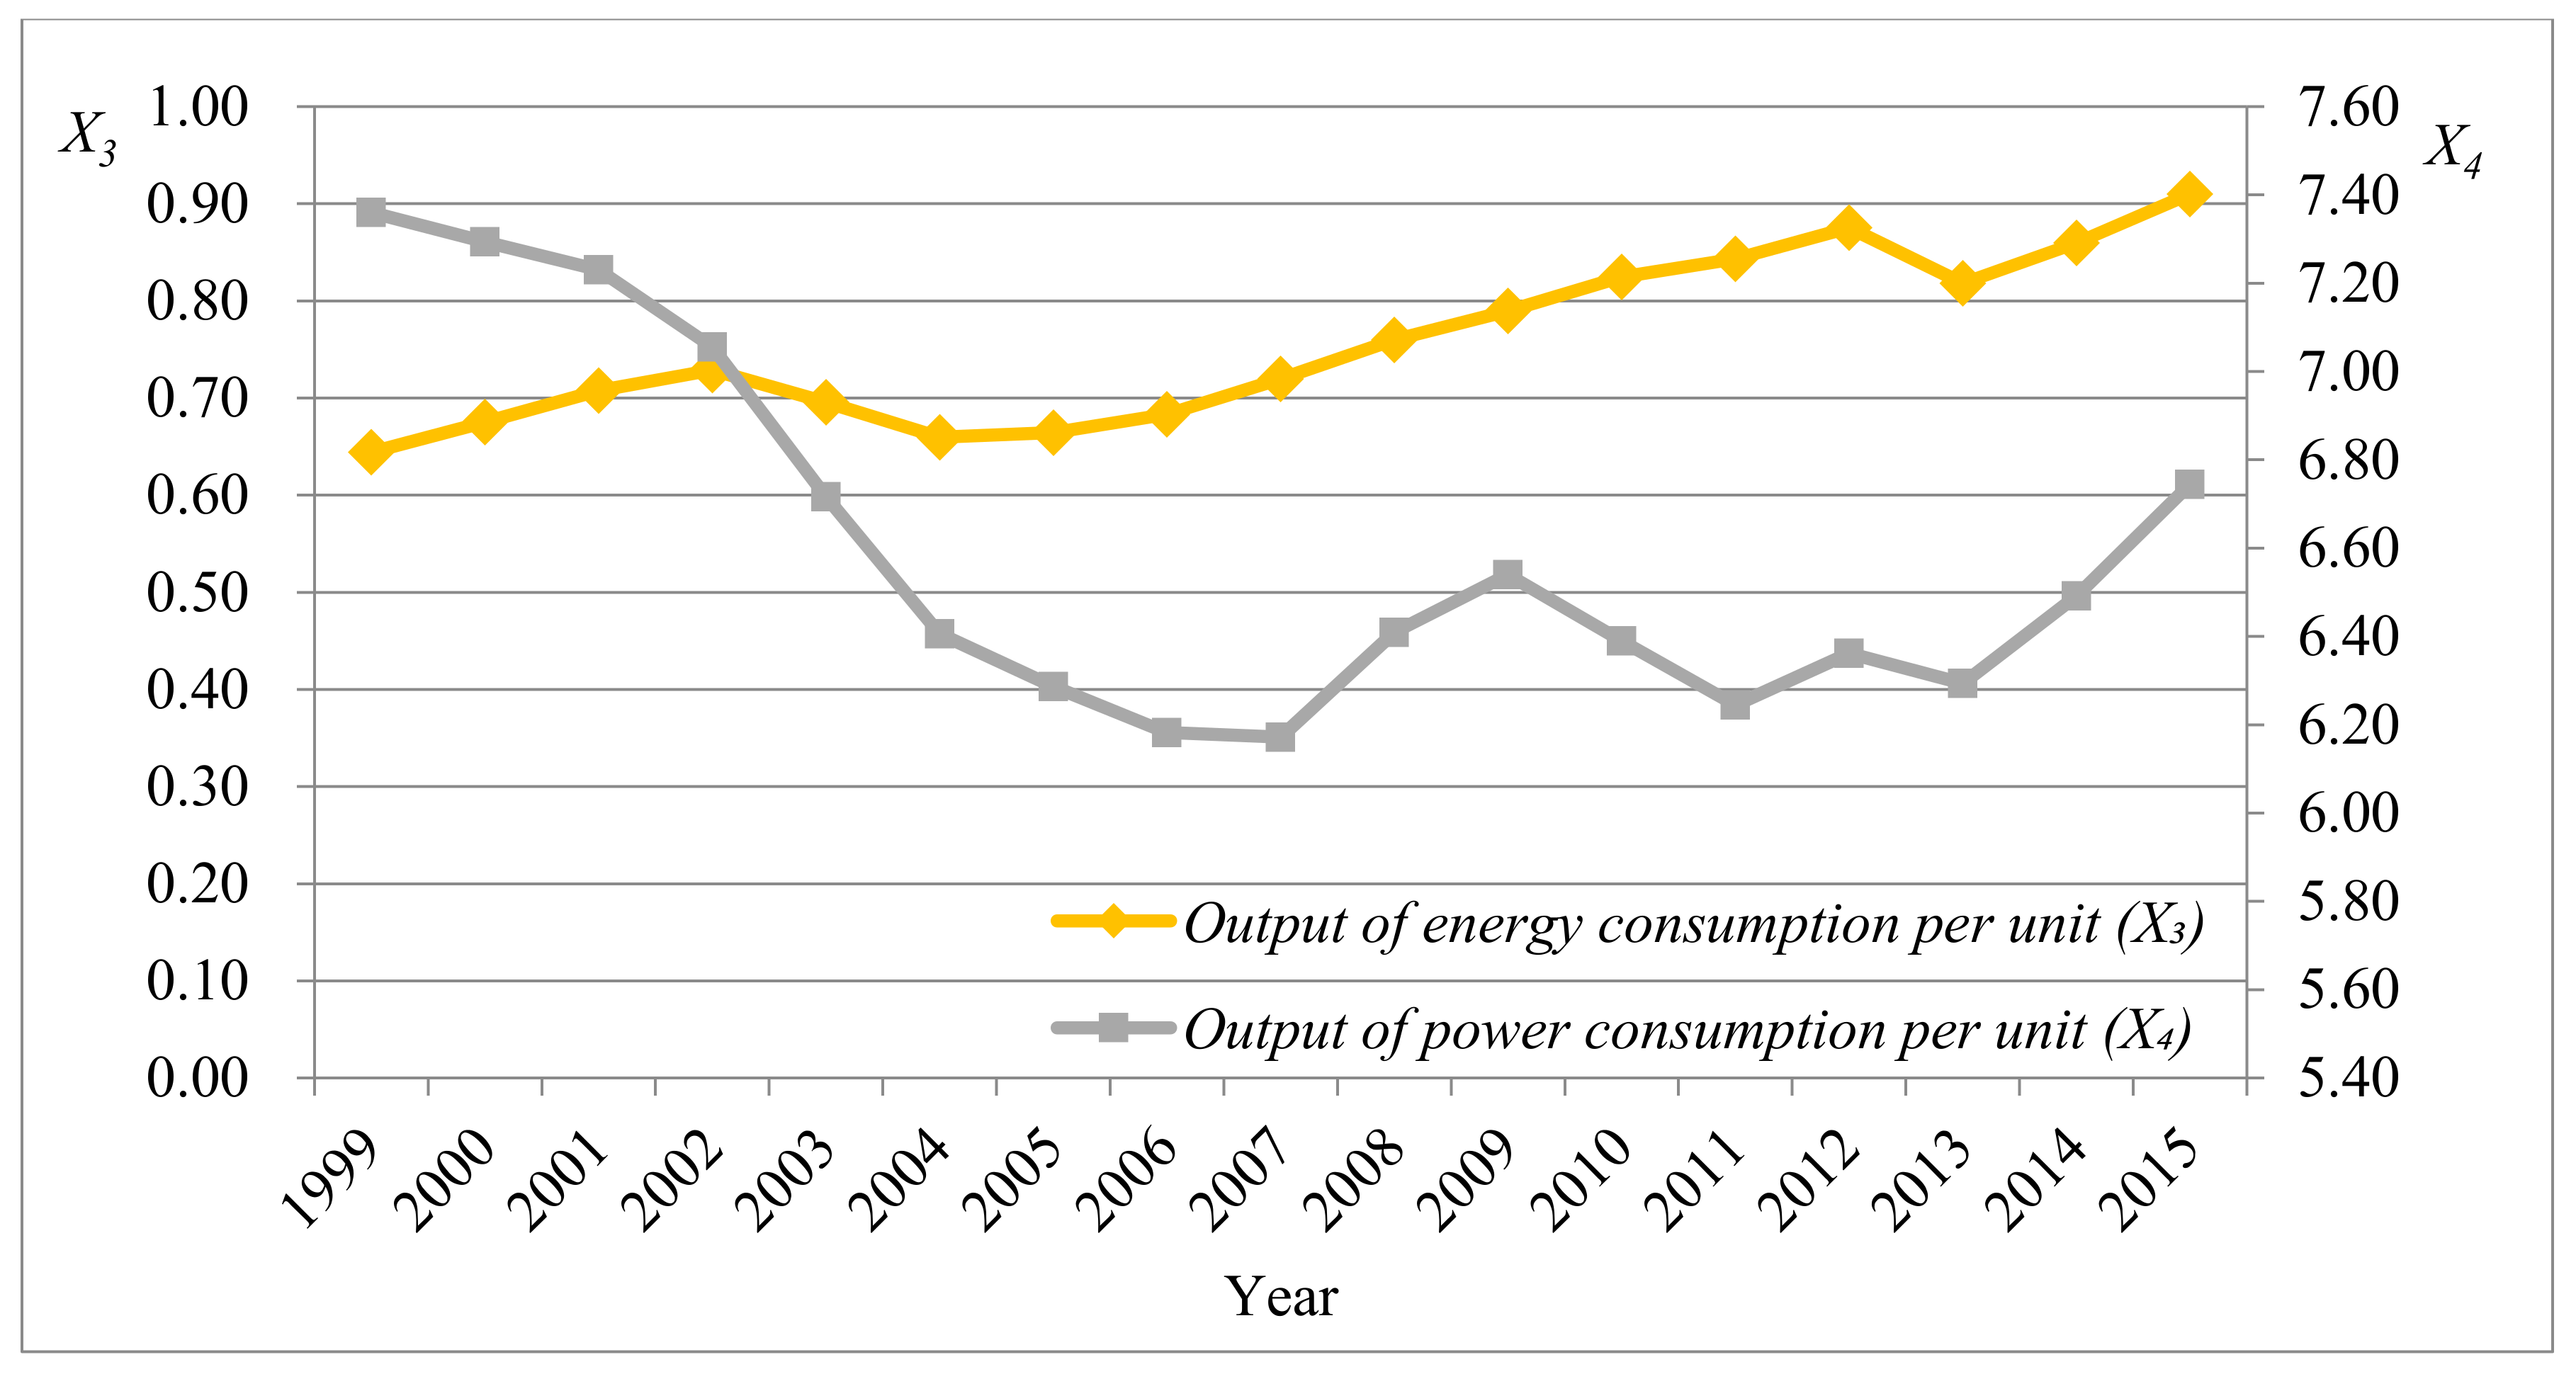
| Output of energy consumption per unit | GDP/total energy consumption | 104 CNY/tons standard coal | ||
| Output of power consumption per unit | GDP/total power consumptions | CNY/kW·h | ||
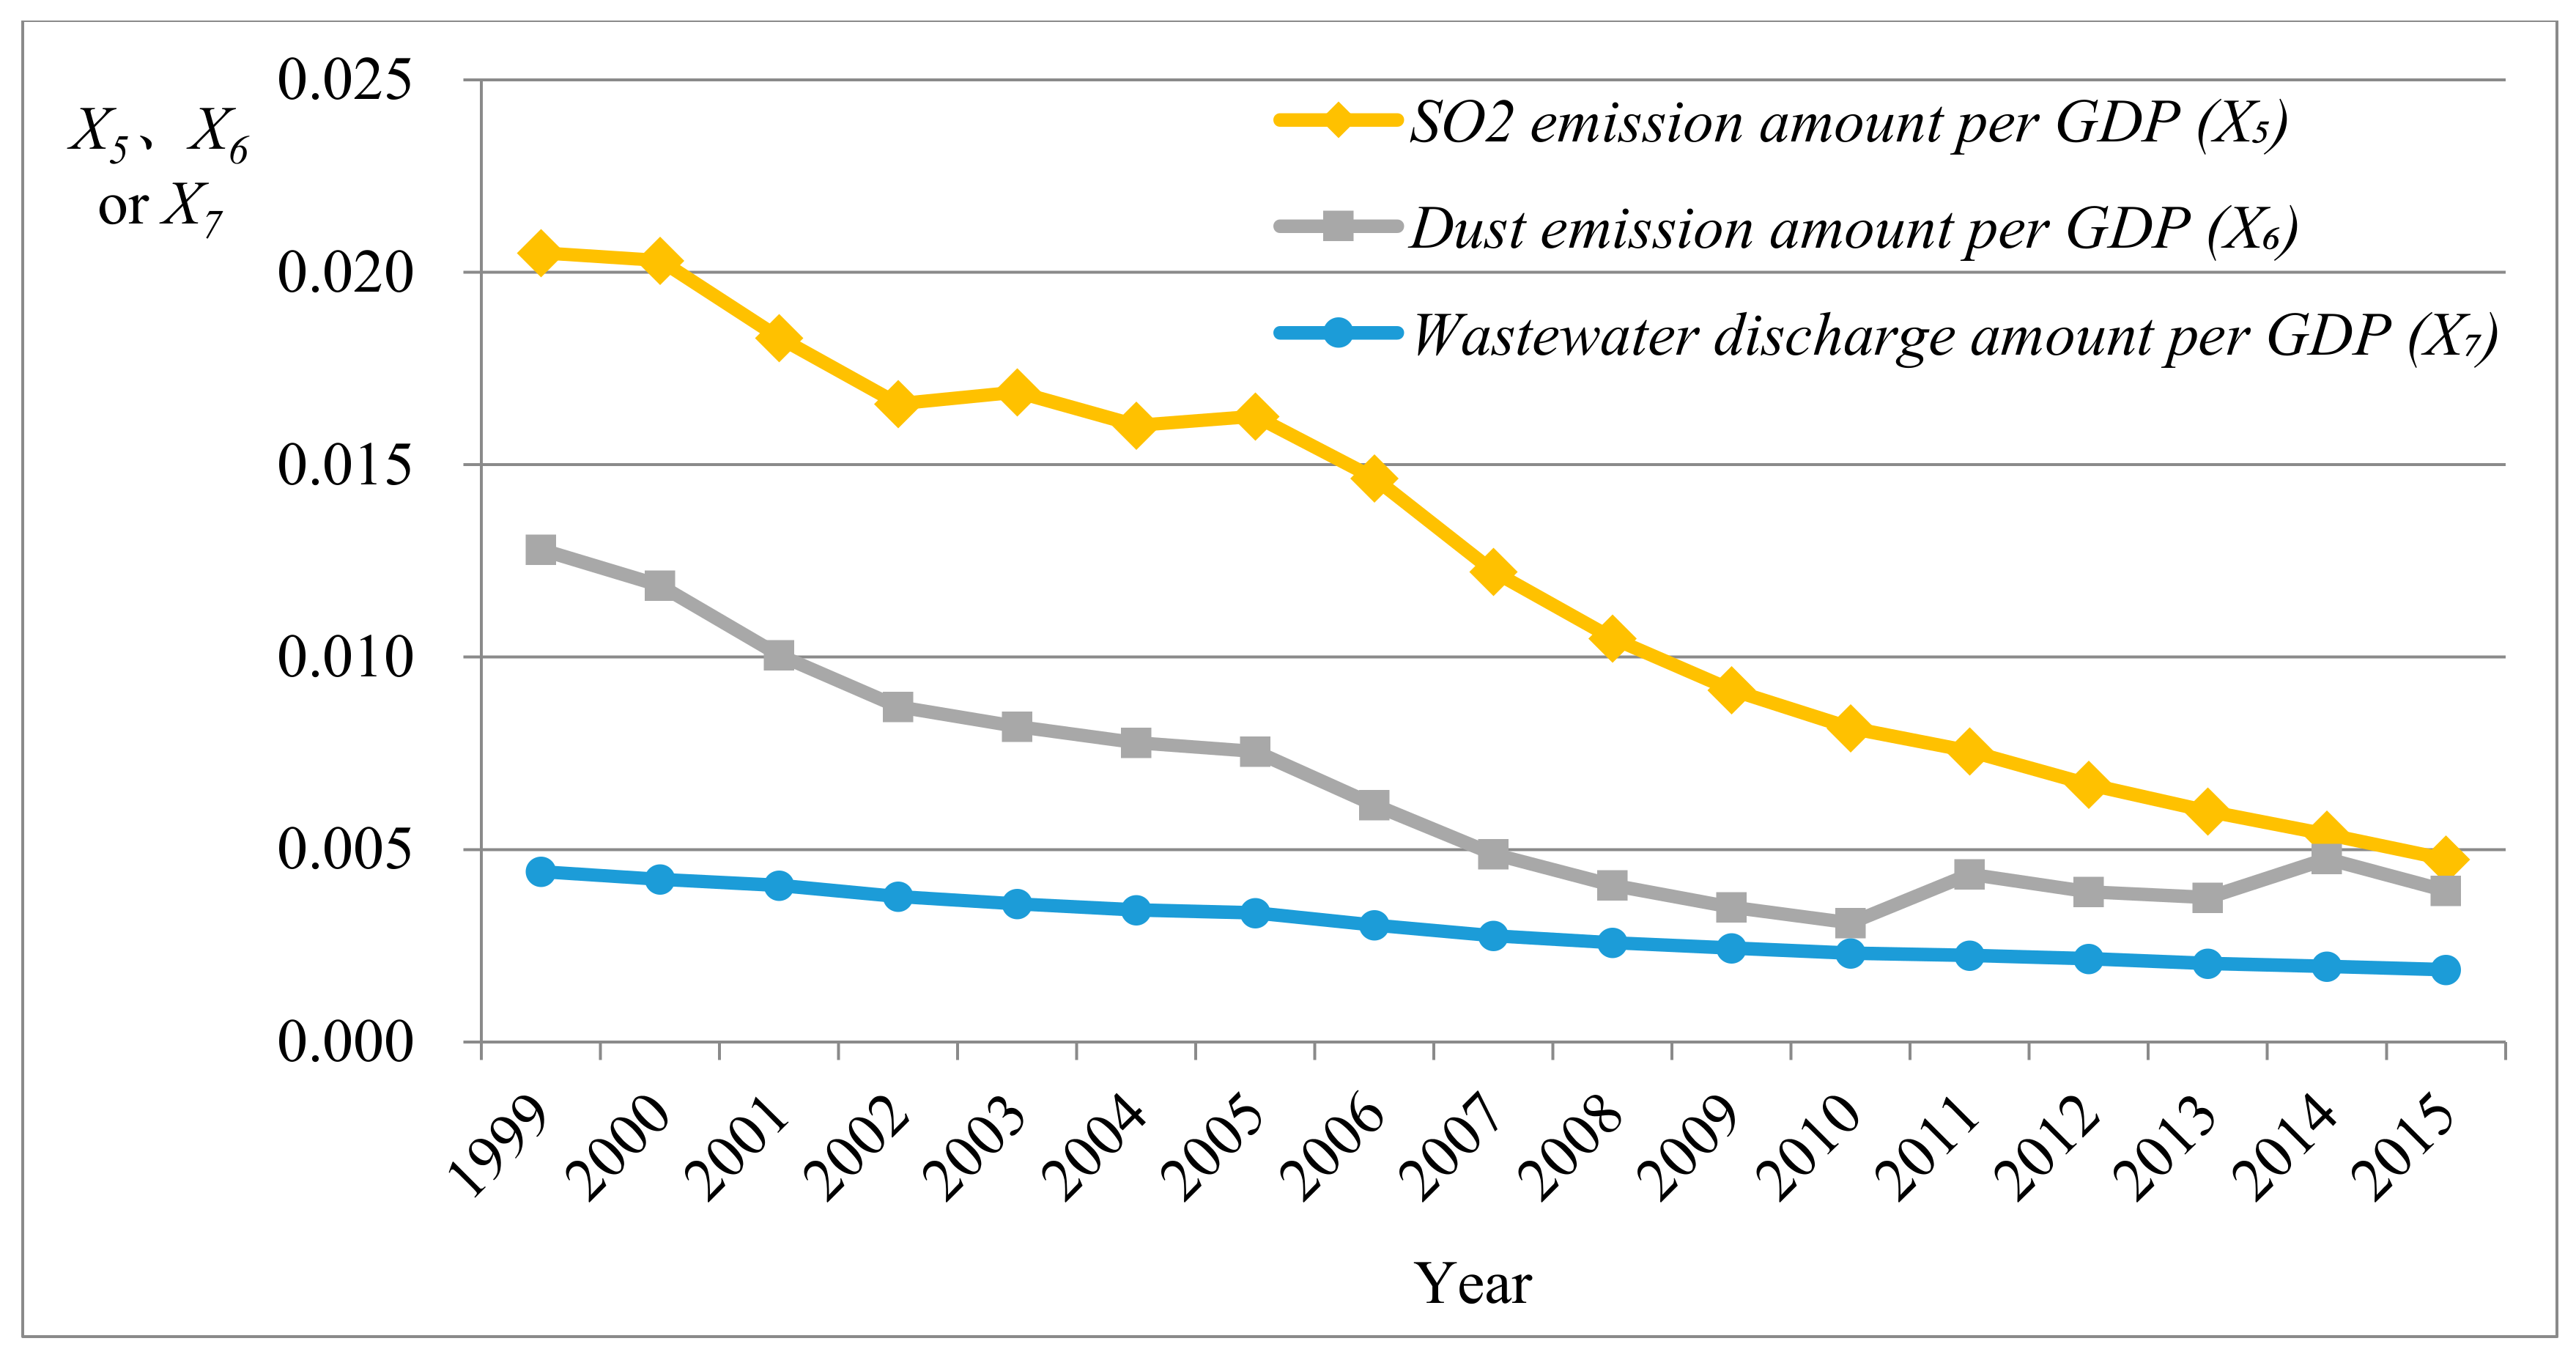
| Social responsibility performance | Environmental performance | SO2 emission amount per GDP | SO2 emission amount/GDP | Tons/104 CNY |
| Dust emission amount per GDP | Dust emission amount/GDP | Tons/104 CNY | ||
| Wastewater discharge amount per GDP | Wastewater discharge amount/GDP | Tons/CNY | ||
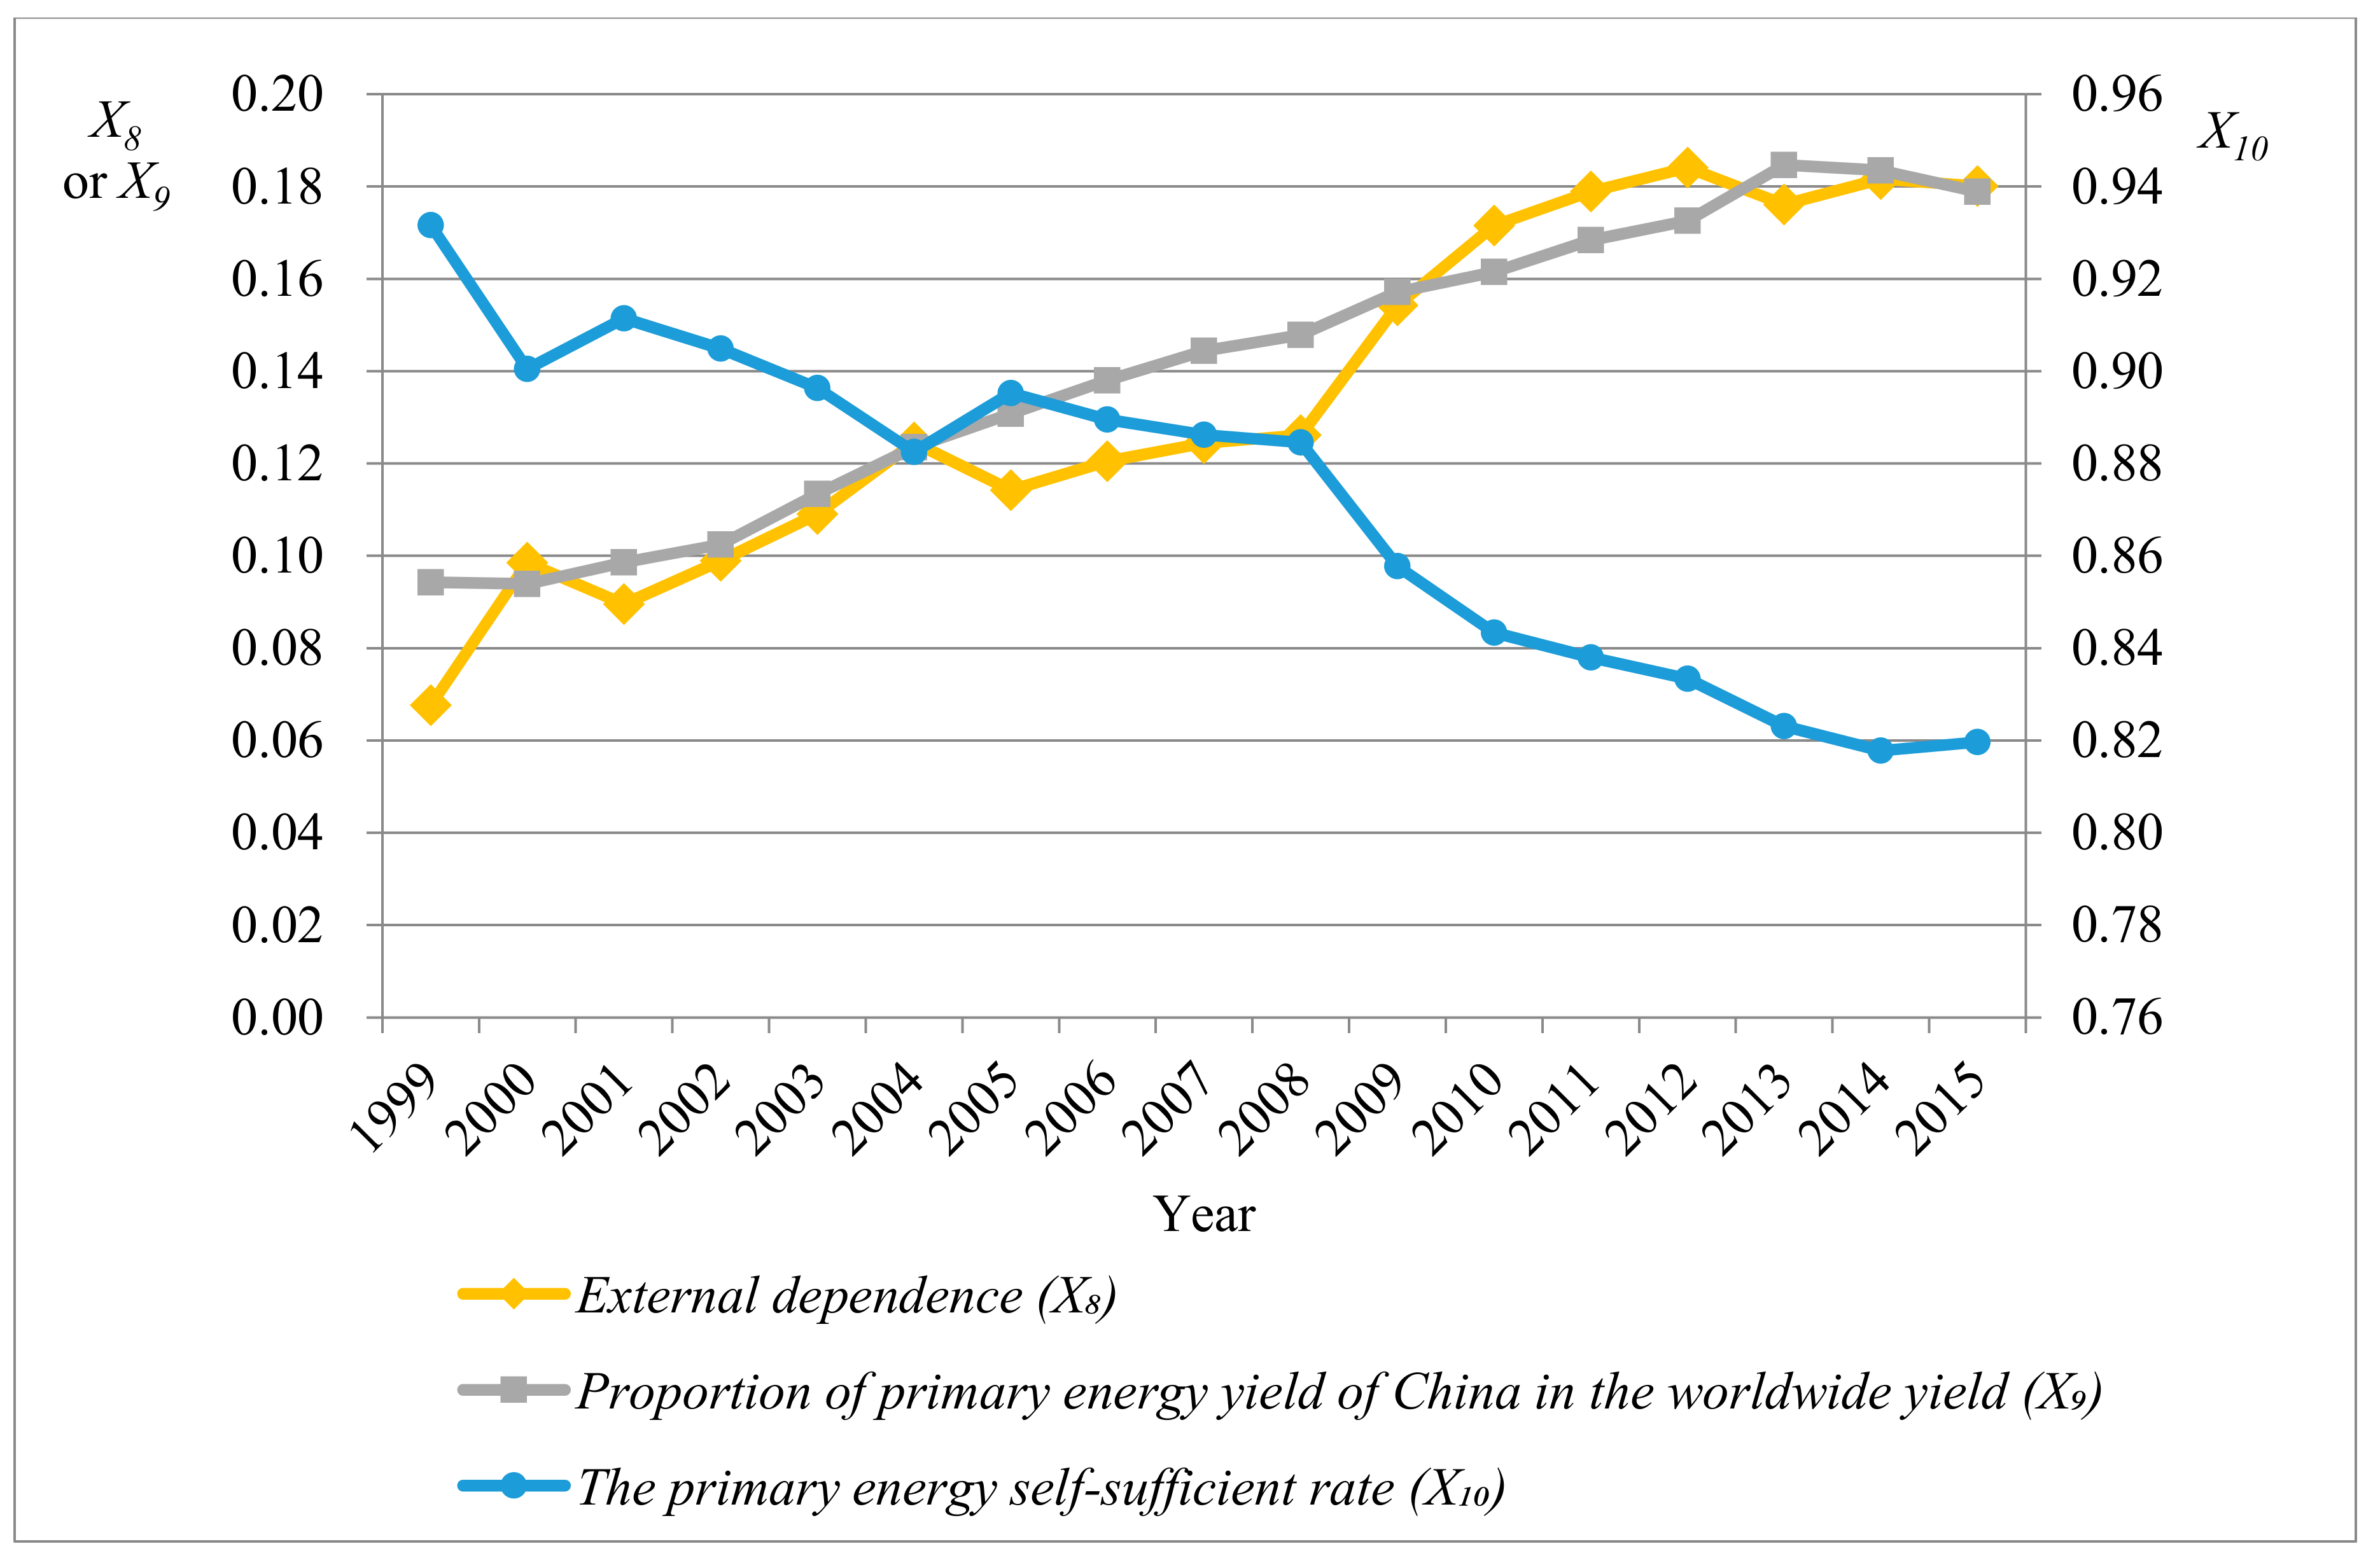
| Energy safety performance | External dependence | Energy import amount/total energy consumption | No | |
| Proportion of primary energy yield in the worldwide yield | Primary energy yield/total world energy yield | No | ||
| Primary energy self-sufficient rate | No | |||
| Index | Mean | Median | Mode | Standard Deviation | Minimum | Maximum | Skewness | Kurtosis |
|---|---|---|---|---|---|---|---|---|
| Energy consumption elasticity index | 0.714 | 0.610 | 0.130 a | 0.433 | 0.130 | 1.670 | 1.154 | 0.875 |
| Power consumption elasticity index | 1.008 | 1.120 | 1.120 | 0.380 | 0.070 | 1.560 | −0.857 | 0.865 |
| Output of energy consumption per unit | 0.756 | 0.729 | 0.644 a | 0.085 | 0.644 | 0.910 | 0.368 | −1.276 |
| Output of power consumption per unit | 6.599 | 6.409 | 6.172 a | 0.400 | 6.172 | 7.360 | 0.925 | −0.547 |
| SO2 emission amount per GDP | 0.012 | 0.012 | 0.005 | 0.005 | 0.005 | 0.021 | 0.051 | −1.535 |
| Dust emission amount per GDP | 0.006 | 0.005 | 0.003 | 0.003 | 0.003 | 0.013 | 0.851 | −0.394 |
| Wastewater discharge amount per GDP | 0.003 | 0.003 | 0.002 | 0.001 | 0.002 | 0.004 | 0.373 | −1.277 |
| External dependence | 0.135 | 0.125 | 0.068 a | 0.038 | 0.068 | 0.184 | −0.035 | −1.314 |
| Proportion of primary energy yield in the worldwide yield | 0.141 | 0.144 | 0.094 a | 0.032 | 0.094 | 0.185 | −0.169 | −1.387 |
| Primary energy self-sufficient rate | 0.872 | 0.885 | 0.818 a | 0.036 | 0.818 | 0.932 | −0.218 | −1.276 |
| 1 | 0 .835 ** | − 0 .559 * | − 0 .094 | 0 .487 * | 0 .295 | 0 .423 | − 0 .350 | − 0 .440 | 0 .397 | |
| 0 .835 ** | 1 | − 0 .563 * | − 0 .060 | 0 .504 * | 0 .316 | 0 .455 | − 0 .356 | − 0 .458 | 0 .408 | |
| − 0 .559 * | − 0 .563 * | 1 | − 0 .334 | − 0 .932 ** | − 0 .768 ** | − 0 .873 ** | 0 .908 ** | 0 .859 ** | − 0 .916 ** | |
| − 0 .094 | − 0 .060 | − 0 .334 | 1 | 0 .609 ** | 0 .798 ** | 0 .718 ** | − 0 .625 ** | − 0 .708 ** | 0 .539 * | |
| 0 .487 * | 0 .504 * | − 0 .932 ** | 0 .609 ** | 1 | 0 .917 ** | 0 .986 ** | − 0 .961 ** | − 0 .979 ** | 0 .954 ** | |
| 0 .295 | 0 .316 | − 0 .768 ** | 0 .798 ** | 0 .917 ** | 1 | 0 .955 ** | − 0 .873 ** | − 0 .914 ** | 0 .819 ** | |
| 0 .423 | 0 .455 | − 0 .873 ** | 0 .718 ** | 0 .986 ** | 0 .955 ** | 1 | − 0 .954 ** | − 0 .988 ** | 0 .933 ** | |
| − 0 .350 | − 0 .356 | 0 .908 ** | − 0 .625 ** | − 0 .961 ** | − 0 .873 ** | − 0 .954 ** | 1 | 0 .956 ** | − 0 .986 ** | |
| − 0 .440 | − 0 .458 | 0 .859 ** | − 0 .708 ** | − 0 .979 ** | − 0 .914 ** | − 0 .988 ** | 0 .956 ** | 1 | − 0 .946 ** | |
| 0 .397 | 0 .408 | − 0 .916 ** | 0 .539 * | 0 .954 ** | 0 .819 ** | 0 .933 ** | − 0 .986 ** | − 0 .946 ** | 1 |
| Year | Mahal+ | Mahal− | E-M-TOPSIS | E-TOPSIS | Traditional TOPSIS | |||
|---|---|---|---|---|---|---|---|---|
| Closeness | Order | Closeness | Order | Closeness | Order | |||
| 1999 | 10.307 | 13.397 | 0.565 | 1 | 0.461 | 10 | 0.456 | 11 |
| 2000 | 11.416 | 12.644 | 0.526 | 4 | 0.387 | 13 | 0.408 | 13 |
| 2001 | 11.044 | 12.544 | 0.532 | 2 | 0.414 | 12 | 0.417 | 12 |
| 2002 | 11.482 | 12.202 | 0.515 | 5 | 0.383 | 14 | 0.371 | 15 |
| 2003 | 11.198 | 12.420 | 0.526 | 3 | 0.304 | 16 | 0.260 | 17 |
| 2004 | 13.080 | 10.555 | 0.447 | 17 | 0.291 | 17 | 0.267 | 16 |
| 2005 | 12.302 | 11.128 | 0.475 | 9 | 0.380 | 15 | 0.374 | 14 |
| 2006 | 12.530 | 10.987 | 0.467 | 13 | 0.454 | 11 | 0.504 | 10 |
| 2007 | 12.753 | 10.783 | 0.458 | 15 | 0.532 | 7 | 0.596 | 7 |
| 2008 | 12.198 | 11.329 | 0.482 | 8 | 0.655 | 2 | 0.735 | 2 |
| 2009 | 12.016 | 11.607 | 0.491 | 6 | 0.594 | 4 | 0.680 | 4 |
| 2010 | 12.398 | 11.204 | 0.475 | 10 | 0.511 | 8 | 0.592 | 8 |
| 2011 | 12.587 | 11.057 | 0.468 | 12 | 0.497 | 9 | 0.565 | 9 |
| 2012 | 12.860 | 10.713 | 0.454 | 16 | 0.583 | 5 | 0.680 | 5 |
| 2013 | 12.631 | 10.854 | 0.462 | 14 | 0.558 | 6 | 0.646 | 6 |
| 2014 | 12.442 | 11.015 | 0.470 | 11 | 0.628 | 3 | 0.731 | 3 |
| 2015 | 11.999 | 11.433 | 0.488 | 7 | 0.681 | 1 | 0.788 | 1 |
© 2018 by the authors. Licensee MDPI, Basel, Switzerland. This article is an open access article distributed under the terms and conditions of the Creative Commons Attribution (CC BY) license (http://creativecommons.org/licenses/by/4.0/).
Share and Cite
Wang, Z.-X.; Li, D.-D.; Zheng, H.-H. The External Performance Appraisal of China Energy Regulation: An Empirical Study Using a TOPSIS Method Based on Entropy Weight and Mahalanobis Distance. Int. J. Environ. Res. Public Health 2018, 15, 236. https://0-doi-org.brum.beds.ac.uk/10.3390/ijerph15020236
Wang Z-X, Li D-D, Zheng H-H. The External Performance Appraisal of China Energy Regulation: An Empirical Study Using a TOPSIS Method Based on Entropy Weight and Mahalanobis Distance. International Journal of Environmental Research and Public Health. 2018; 15(2):236. https://0-doi-org.brum.beds.ac.uk/10.3390/ijerph15020236
Chicago/Turabian StyleWang, Zheng-Xin, Dan-Dan Li, and Hong-Hao Zheng. 2018. "The External Performance Appraisal of China Energy Regulation: An Empirical Study Using a TOPSIS Method Based on Entropy Weight and Mahalanobis Distance" International Journal of Environmental Research and Public Health 15, no. 2: 236. https://0-doi-org.brum.beds.ac.uk/10.3390/ijerph15020236