Article

Comparison of Toxic Metal Distribution Characteristics and Health Risk between Cultured and Wild Fish Captured from Honghu City, China

1
Research Center for Environment and Health, Zhongnan University of Economics and Law, Wuhan 430073, China
2
School of Information and Safety Engineering, Zhongnan University of Economics and Law, Wuhan 430073, China
*
Author to whom correspondence should be addressed.
Int. J. Environ. Res. Public Health 2018, 15(2), 334; https://0-doi-org.brum.beds.ac.uk/10.3390/ijerph15020334
Submission received: 9 January 2018 / Revised: 4 February 2018 / Accepted: 5 February 2018 / Published: 14 February 2018
(This article belongs to the Collection Environmental Risk Assessment)

Abstract

:
Honghu Lake, which listed in the “Ramsar Convention”, is the seventh largest freshwater lake in China and is regarded as one of the biggest freshwater product output areas in China. The toxic element distribution in cultured and wild fish and the corresponding health risks through fish consumption from Honghu area were investigated. The mean concentration in the muscle of cultured and wild fish (Carassius auratus and Ctenopharyngodon idellus) decreased in the order: Zn (18.94) > Cu (0.8489) > Cr (0.2840) > Pb (0.2052) and Zn (16.30) > Cr (1.947) > Cu (0.4166) > Pb (0.0525) > Cd (0.0060) (mean; mg/kg, wet weight). Scales (Multi factor pollution index (MPI) = 3.342) and the liver (MPI = 1.276) were regarded as the main accumulation tissues for cultured fish, and the bladder (MPI = 0.640) and intestine (MPI = 0.477) were regarded as the main accumulation tissues for wild fish. There were no obvious health risks associated with the consumption of cultured and wild fish based on the calculated results of the target hazard quotient (THQ), carcinogenic risk (CR), and estimated weekly intake (EWI). Pb and Cr were recognized as the major health risk contributors for inhabitants through wild and cultured fish consumption. Cultured fish had a greater health risk than wild fish based on the calculation results of THQ and CR. Muscle consumption resulted in more health risks than mixed edible tissues for cultured fish, but for wild fish, the conclusion was the opposite. Mixed fish (cultured:wild = 1:1) muscle consumption had relatively lower risks than the consumption of cultured or wild fish muscle separately. Consuming no more than 465 g/day (wet wt) of cultured fish muscle, 68 g/day (wet wt) of wild fish muscle, 452 g/day (wet wt) of mixed cultured fish edible tissues or 186 g/day (wet wt) of mixed wild fish edible tissues from the Honghu area can assure human health.

1. Introduction

Based on aquaculture statistical data from the U.N.’s Food and Agricultural Organization (FAO, Rome, Italy), China is one of the most important contributors to global fishery production, with a total amount of 62,575 thousand tons, accounting for 37.42% of the global amount (167,228 thousand tons) in 2014 [1,2]. Freshwater aquaculture production is an important component of fisheries production, and the output value of freshwater aquaculture was 581,318 million yuan (approximately 89,606 million dollars), which accounted for 48.4% of the total fishery output value (approximately 185,016 million dollars) in 2016. Hence, the safety of freshwater aquaculture production from China affects the health of humans across the world [3].
Water used in aquaculture generally comes from surrounding river diversion, natural precipitation or well-water [4]. Recently, with agricultural non-point source pollution worsening and fishermen’s unscientific management, polluted water from livestock farms, farmland, and even chemical product factories has entered aquaculture through polluted river water [5]. Previous research on pollutants of freshwater fish mostly focused on antibiotics [6,7] and pesticides [8,9]. However, heavy metals and metalloids are also common pollutants in water or other environmental media and have attracted considerable attention due to their persistence, recalcitrance, bioaccumulation and potential toxicity, especially in some developing countries like China, Pakistan and India [10,11,12,13]. Heavy metals and metalloids that exceed standard concentrations will disturb the normal life activities of fish and even cause poisoning or death [14,15,16]. Heavy metals and metalloids can easily accumulate in fish through two main routes: a. through absorption by gills or ionic exchange of dissolved contaminants in water through biological membranes; b. through ingestion of contaminants in food or sediment particles [17,18]. Residual heavy metals and metalloids in fish will be amplified and enriched up the food chain, posing a serious threat to human health and the ecological environment. Thus, it is necessary to investigate heavy metals and metalloid distribution in cultured fish and analyze the corresponding health risks to humans.
Honghu city was recognized as the largest freshwater aquaculture production area in 2012 by the China aquatic products circulation and processing association. The freshwater aquaculture industry is an important part of the local economy. In 2016, the output value of fisheries in Honghu area reached 7249 million yuan, accounting for 57% of the total output value of local agriculture (12,712 million yuan). The yield of freshwater aquaculture production reached 485 thousand ton, and the freshwater aquaculture area covered 58.5 thousand hectares [19]. Recent research revealed that the surface water in Honghu Lake has been gradually polluted by heavy metals and metalloids due to anthropogenic activities [5,20,21], especially with respect to aquaculture activity [22]. Fish are popular in local inhabitants’ regular diet, not only for fish muscle, but also for some other edible fish tissues like the skin, bladder and liver, which have numerous nutrients and a pleasant taste sensation [23,24,25]. However, previous research on cultured fish consumption risk for human health mainly focused on fish muscle consumption [26,27,28]. Thus, it is necessary to investigate and compare the corresponding human health risk associated with fish muscle consumption and mixed edible fish tissues consumption. In order to analyze the factors affecting the heavy metal distribution in cultured fish, 2 popular fish species, wild Carassius auratus (abbreviated as Crucian carp) and Ctenopharyngodon idellus (abbreviated as Grass carp), which have been proved to have relatively higher trace element accumulation abilities in fish studies and some related studies [29,30], captured from Honghu Lake, were selected to make comparisons of toxic metal distributions and health risk assessments.
Overall, the specific objectives of this study are: (1) to investigate the trace element distributions in muscle and other tissues of cultured fish from local Honghu fishponds; (2) to compare the trace element distribution differences in muscles and tissues of cultured and wild fish; (3) to assess human health risks through cultured and wild fish consumption, to provide optimized fish consumption suggestions for local inhabitants; and (4) to analyze the fish daily consumption limit for local inhabitants with respect to cultured fish muscle, wild fish muscle, mixed cultured fish edible tissues and mixed wild fish edible tissues.

2. Materials and Methods

2.1. Study Area

Honghu city (E 113–114°, N 29–30°) is located in the middle of Hubei province. Honghu Lake (E 113°16–27′, N 29°46–55′, which covers about 348.3 km2 and has a length of 23.4 km from east to west and a width of 20.8 km from north to south), is the seventh largest freshwater lake in China and the largest nature wetland reserve in Hubei province. The climate of Honghu city belongs to subtropical monsoon; the annual mean precipitation is 1061–1331 mm, and the annual mean air temperature is 16.6 °C. The sampling fish farms are sporadically distributed around Honghu Lake, and the specific location of each fish farm is marked in Figure S1. The water temperature in Honghu Lake ranges from 27 °C–29 °C, and the mean pH value is 7.59 [31].

2.2. Sample Collection and Preparation

Cultured fish were bought from local fish farms. Wild fish were captured from Honghu Lake by local fishermen. All fish samples were carefully preserved in polyethylene sealing bags, and both fish length and weight were recorded and are presented in Tables S1 and S2. Samples were cryopreserved at −20 °C and transported to the laboratory as soon as possible. Essential information, i.e., the collected cultured and wild fish species and amounts, is presented in Tables S1 and S2.
All fish samples were carefully cleaned by ultra pure water and dissected into 7 parts (bladder, gill, intestine, liver, muscle, scale and skin) using stainless steel tools. Each part was gently dried using disposable filter paper and homogenized by a meat masher. All of the homogenized parts of fish samples were carefully preserved in small polyethylene bottles with category labels and transferred to a refrigerator at a temperature of −20 °C.

2.3. Sample Digestion and Analysis

The digestion procedures carefully followed the individual trace element detection methods from the national food safety standards [32,33,34,35,36,37]. Approximately 0.5 g of fish tissue was weighted into a digestion vessel containing 8 mL nitric acid (65%) and 2 mL hydrogen peroxide (30%). Vessels with mixed solutions were closed and allowed to stand for 20–30 min at room temperature and were then transferred to a microwave digestion system with a designated heated programming. After digestion, all solutions were placed into small porcelain mugs on an electric plate containing a base solution (0.2% diluent nitric acid), followed by heating at 120 °C until only 2–3 mL of the digestion solution remained to reduce the residual acid. Then, the solutions were diluted into 10 mL colorimetric tubes for storage and further detection by the base solution (0.2% diluent nitric acid). Cu, Zn, Cr, Cd, Pb were detected by Atomic Absorption Spectroscopy (AAS ZEEnit 700P, Jena, Germany) and As was detected by Atomic Fluorescence Spectrometry (AFS-9730, Haiguang, China) under appropriate analytical conditions. Instrument Limits of Detection (LODs, mg/kg) were 0.001 for Cd and As, 0.002 for Cr, 0.01 for Pb, 0.02 for Cu, and 0.1 for Zn.
All regents used, including nitric acid (65%) and hydrogen peroxide (30%), were of ultra-pure grade (Shanghai Sinopharm Group Chemical Reagent Limited Company, Shanghai, China). All experimental vessels for sample storage, digestion and detection were immersed overnight in nitric acid (20–30%) solution, rinsed in ultrapure water and dried in a clean laboratory oven. Quality assurance and quality control were carried out with parallel tests, blank tests and recovery tests [38,39,40]. Blank tests accompanied every batch of sample processing. A standard curve was drawn when the correlation coefficient was higher than 0.999 for all sample detection. The detection results were reliable when relative deviations of parallel sample analysis were below 10%, and the recovery rate ranged from 95% to 105%.
The single factor pollution index (abbreviated as Pi) method is generally used to evaluate the pollution level of a single heavy metal [41,42]. The calculation equation is as follows:
P i = C i S i
where Ci is the measured mean concentration of a single heavy metal (mg/kg, wet wt); Si is the standard limit concentration for a single heavy metal (mg/kg, wet wt).
The multi factor pollution index (also called metal pollution index, and abbreviated as MPI) method is generally used to evaluate the total pollution level of multiple heavy metals [42,43]. The calculation equation is as follows:
MPI = C 1 × C 2 × × C n n
where Cn is the measured mean concentration of the nth heavy metal (mg/kg, wet wt).

2.4. Health Risk Assessment

Target hazard quotient (abbreviated as THQ) is a kind of assessment method to evaluate the possible non-carcinogenic health risks due to chemical pollutant intake and was established by the United States Environmental Protection Agency [43]. This method assumes the intake dose is equal to the absorption dose, and cooking has no effect on the pollutants [44]. A THQ value less than 1 means there will be no obvious risk in consuming the studied fish sample, i.e., the exposure level of the study element is less than the reference dose. The calculation equation is listed as follows:
THQ = E F × E D × F IR × C R FD × W AB × T A × 10 3
where EF is the population exposure frequency (350 day/year); ED is the exposure time (30 year); FIR is the food daily consumption (54.33 g/day) [45]; C is the heavy metal concentration in food (mg/kg); RFD is the reference oral dose (mg/kg/day); WAB is the population average weight (61.6 kg) [46]; TA is the non-carcinogenic average exposure time (365 day/year × ED) [47].
Carcinogenic risk (abbreviated as CR) is a kind of assessment method to evaluate the possible carcinogenic health risks due to chemical pollutant intake, such as As and Pb, and was also established by the United States Environmental Protection Agency [43]. The acceptable carcinogen risk level ranges from 10−4 (risk of developing cancer over a human lifetime is 1 in 10,000) to 10−6 (risk of developing cancer over a human lifetime is 1 in 1,000,000). The calculation equation is listed as follows:
CR = E F × E D × F IR × C × CSFO W AB × T A × 10 3
where EF is the population exposure frequency (day/year); ED is the exposure time (year); FIR is the food daily consumption (g/day); C is the heavy metal concentration in food (mg/kg); CSFO is the oral carcinogenic slope factor from the Integrated Risk Information System database (mg/kg/day)−1 [48]; WAB is the population average weight (kg); TA is the non-carcinogenic average exposure time (day).
Estimated weekly intake (abbreviated as EWI) is employed to calculate the weekly trace element intake from food and was established by the World Health Organization (WHO) [49] and the United Nations Food and Agriculture Organization (FAO) [50]. Provisional tolerable weekly intake (abbreviated as PTWI) refers to the tentatively accepted weekly trace element intake. When the calculated value of EWI is lower than PTWI, it means there is no significant health risk for exposed population through food consumption. The calculation equation is listed as follows:
EWI = F IR × C × 7 W AB
where FIR is the food daily consumption (g/day); C is the heavy metal concentration in food (mg/kg); WAB is the population average weight (kg).
FIR lim is the maximum allowable fish daily consumption for adults to assure their health. FIR lim ( THQ ) is the maximum allowable fish daily consumption, which is calculated by the equation of THQ, FIR lim ( CR ) is calculated by the equation of CR, and FIR lim ( EWI ) is calculated by the equation of EWI.
FIR lim ( THQ ) = R FD × W AB × T A × 1 E F × E D × C × 10 3
where RFD is the reference oral dose (mg/kg/day); WAB is the population average weight (kg); TA is the non-carcinogenic average exposure time (day); 1 is the limitation of THQ, THQ > 1 means the corresponding health risk is significant; EF is the population exposure frequency (day); ED is the exposure time (year); C is the heavy metal concentration in food (mg/kg).
FIR lim ( CR ) = W AB × T A × 10 4 E F × E D × C × CSFO × 10 3
where WAB is the population average weight (kg); TA is the non-carcinogenic average exposure time (day); 10−4 is the limitation of CR, CR > 10−4 means the corresponding health risk is unacceptable; EF is the population exposure frequency (day/year); ED is the exposure time (year); C is the heavy metal concentration in food (mg/kg); CSFO is the oral carcinogenic slope factor from the Integrated Risk Information System database (mg/kg/day)−1.
FIR lim ( EWI ) = W AB × PTWI C × 7
where WAB is the population average weight (kg); PTWI is the allowed heavy metal weekly intake, EWI > PTWI means the corresponding health risk is significant; C is the heavy metal concentration in food (mg/kg).

3. Results and Discussion

Table 1 shows the calculation results of the single factor pollution index (Pi) and multi factor pollution index (MPI) of trace elements in cultured fish muscle. From the calculation results of MPI, the polluted levels of different species of cultured fish decreased in the following order: Grass carp > Catfish carp > Crucian carp > Carp.
Grass carp (regarded as cultured fish) has relatively high heavy metal accumulation ability. In addition, according to some published references [29,30], Crucian carp (regarded as wild fish) has relatively high heavy metal accumulation ability. Therefore, wild Grass carp and Crucian carp (captured from Honghu Lake) were selected as two typical fish species to make comparisons with cultured Grass carp and Crucian carp in trace element distribution and health risk assessment through consumption.

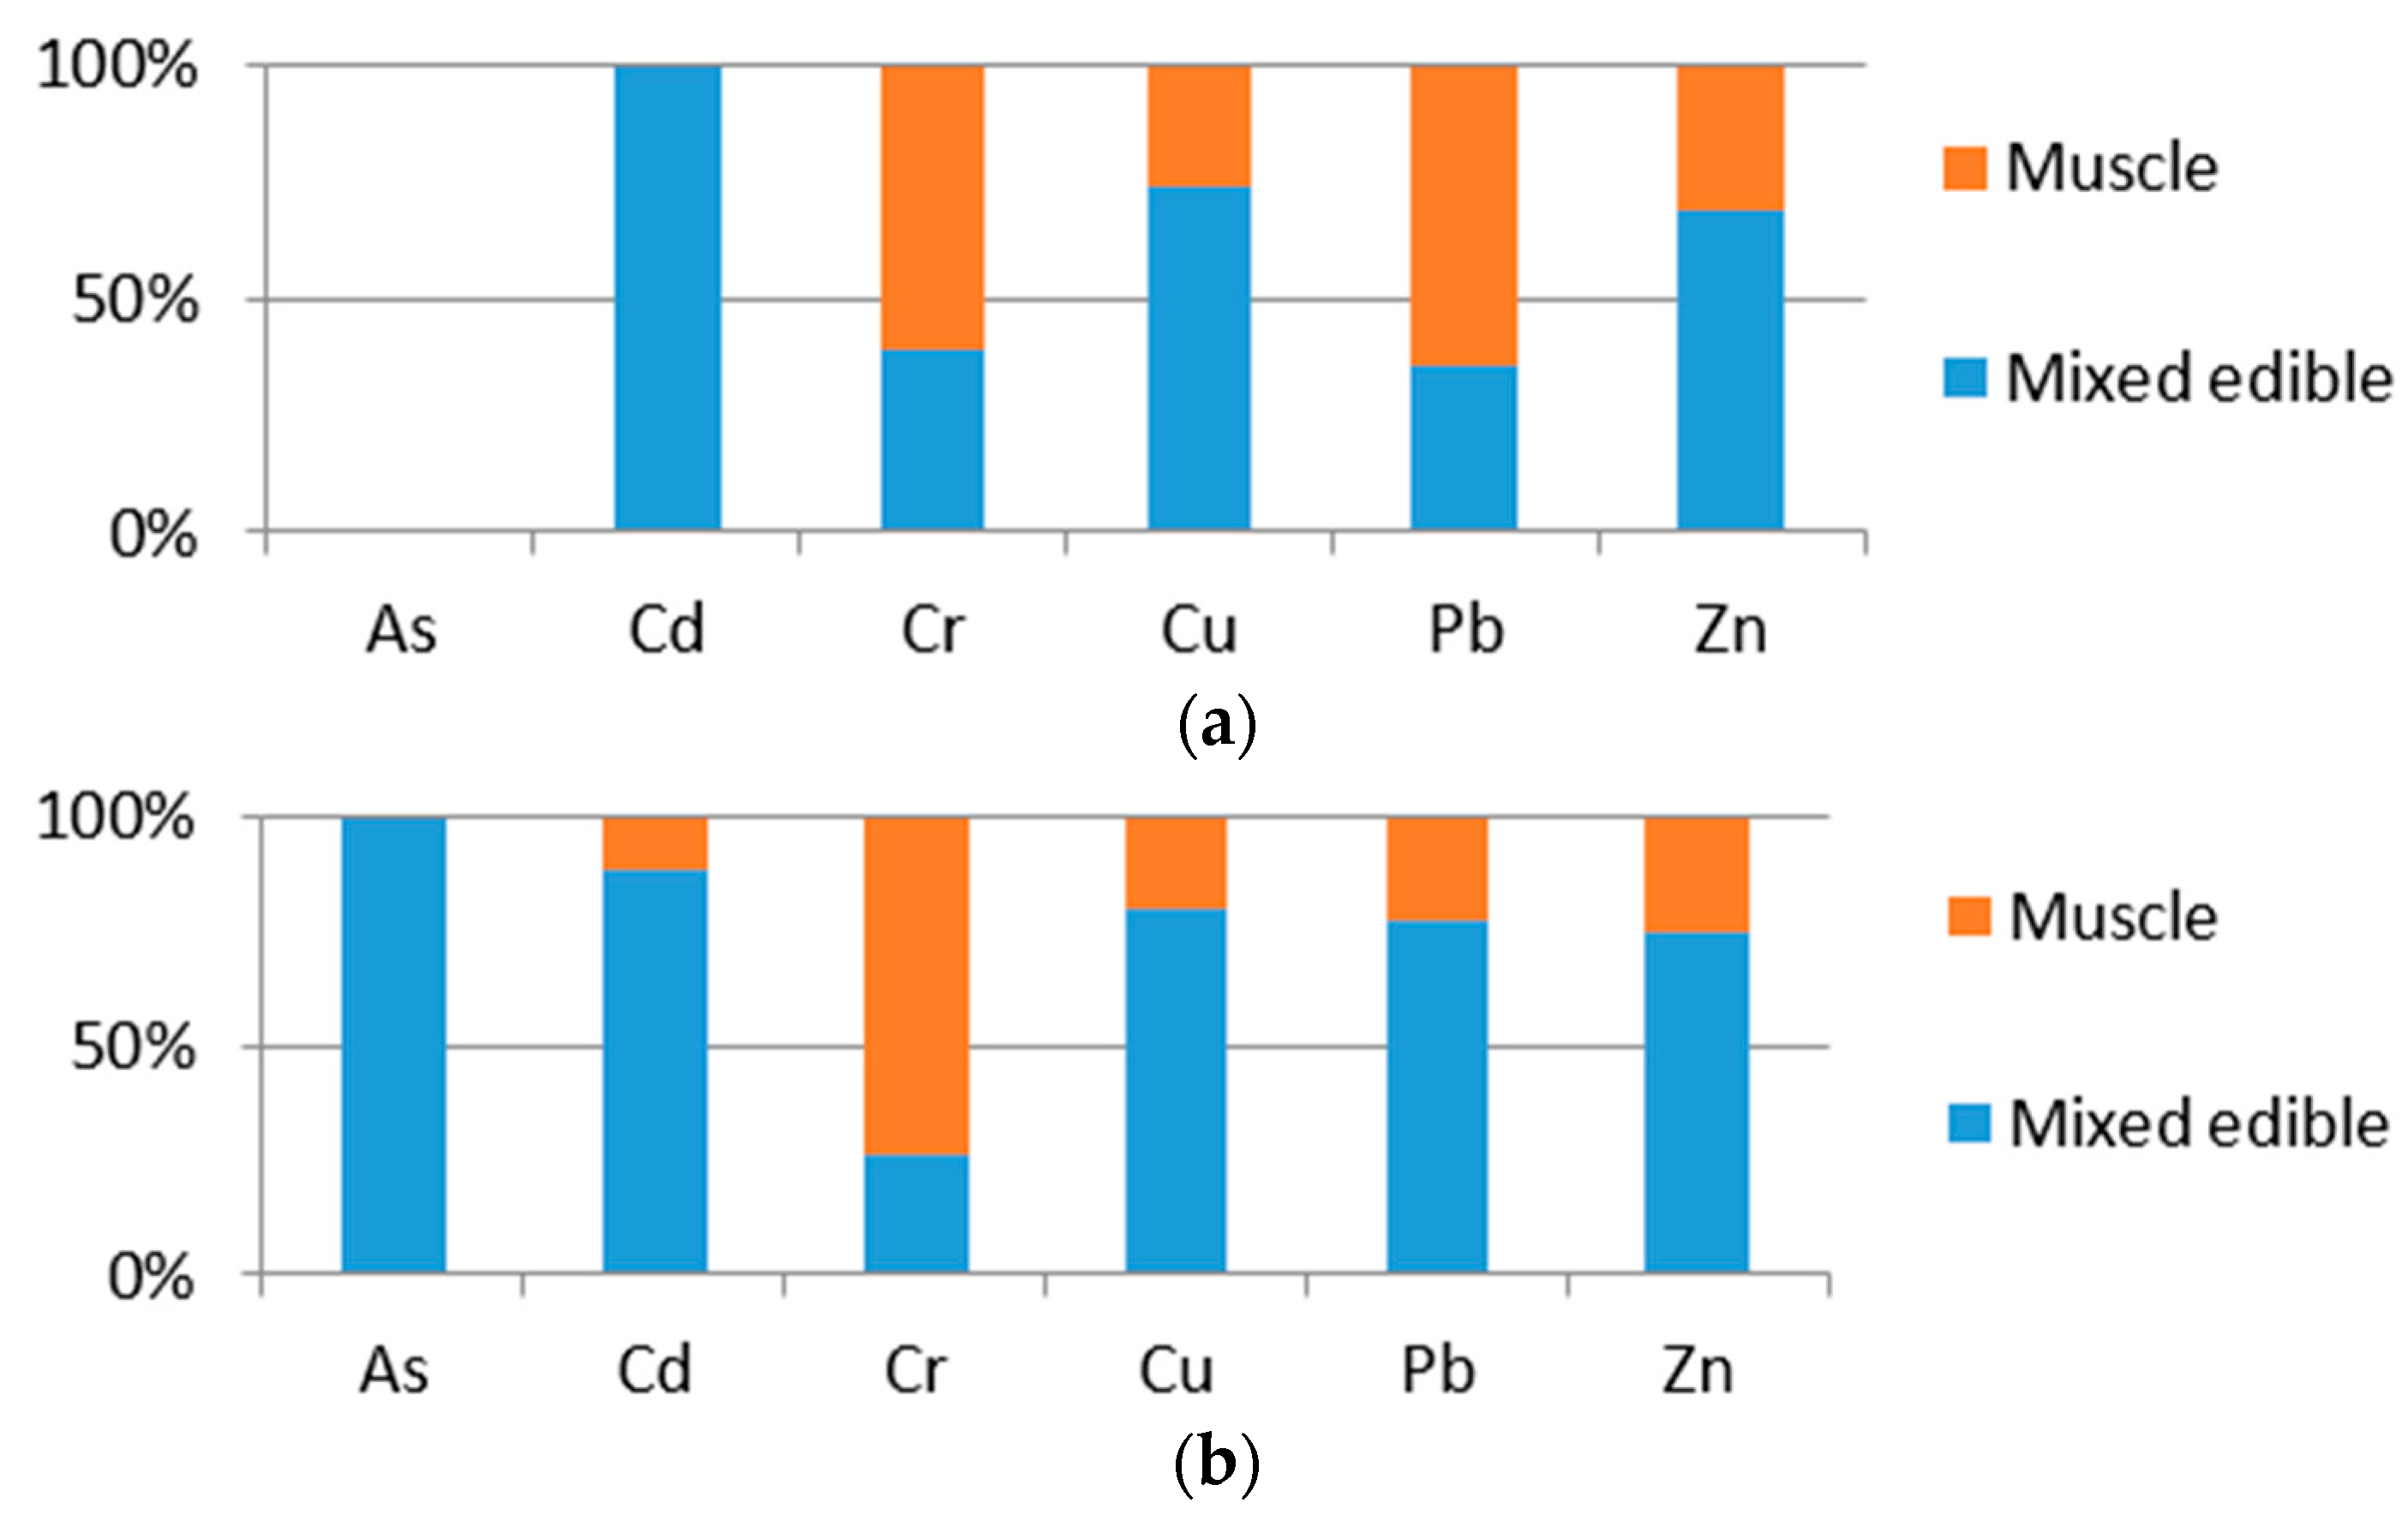
3.1. Trace Element Distributions in Muscle of Cultured and Wild Fish

The heavy metal (As, Cd, Cr, Cu, Pb and Zn) concentrations in muscle of cultured fish captured from fishponds around Honghu Lake and wild fish captured from Honghu Lake are listed in Table 2. The concentrations of As were lower than the limit of detection in both cultured and wild fish. Cd could not be detected in cultured fish muscles. The concentrations of Cu, Pb and Zn in muscles of cultured fish were relatively higher than those in wild fish; by contrast, the concentrations of Cr and Cd were higher in wild fish than in cultured fish.
Honghu Lake, located on the northern bank of the middle reach of the Yangtze River, is the seventh largest freshwater lake in China. Poyang Lake, located on the southern bank of the middle and lower reaches of the Yangtze River, is the largest freshwater Lake in China. Taihu Lake, located on the southern margin of the Yangtze River Delta, is the third largest freshwater Lake in China. Table 3 shows the trace element concentrations in wild fish muscles of those typical lakes that are linked to the Yangtze River. The concentrations of Cd, Cu and Pb in Honghu Lake wild fish muscles were close to the corresponding concentrations in Poyang Lake (Crucian carp and Grass carp); however, the concentrations of Cr and Zn were higher than those in Poyang Lake. The concentrations of all detected trace elements in Honghu Lake wild fish muscles except Cr were much lower than the corresponding concentrations in Taihu Lake (wild Crucian carp). The total concentrations of trace elements in the Yangtze River wild fish (Crucian carp and Grass carp) muscles were higher in 2013 than in 2011 and were higher than in Honghu Lake except for Cr.
Huizhou, located in the northeast of the Pearl River Delta, is a typical and famous freshwater aquaculture area for its various fishponds like mulberry-based fishponds, fruit-based fishponds and sugarcane-based fishponds. Table 3 also shows the trace element concentrations in cultured fish muscles of typical areas in Asia, like Korea (in East Asia), Bangladesh (in South Asia), and Malaysia (in Southeast Asia). The concentrations of Cr, Cu, Zn in cultured fish muscles around Honghu Lake were higher than in the other study areas, and the concentration of Pb were also higher than the other areas except Bangladesh.
Table 3 also shows the trace element concentrations of wild and cultured fish from the same areas like Korea and Aegean Sea. The concentrations of Cr and Zn were higher in Korea-cultured fish, and the concentration of Cu was higher in wild fish. The concentrations of Cd, Cr, Cu, Pb, and Zn were slightly higher in Aegean Sea wild fish than in cultured fish. Combining the conclusion of Honghu Lake, living habits (cultured or wild) did not show an obvious influence on trace element distribution in fish muscles. In order to conduct further studies on the factors that influence heavy metal distributions in fish, edible tissues (including the bladder, liver and skin) and some other high enriched organs (including gills, scales and intestines) have been studied.

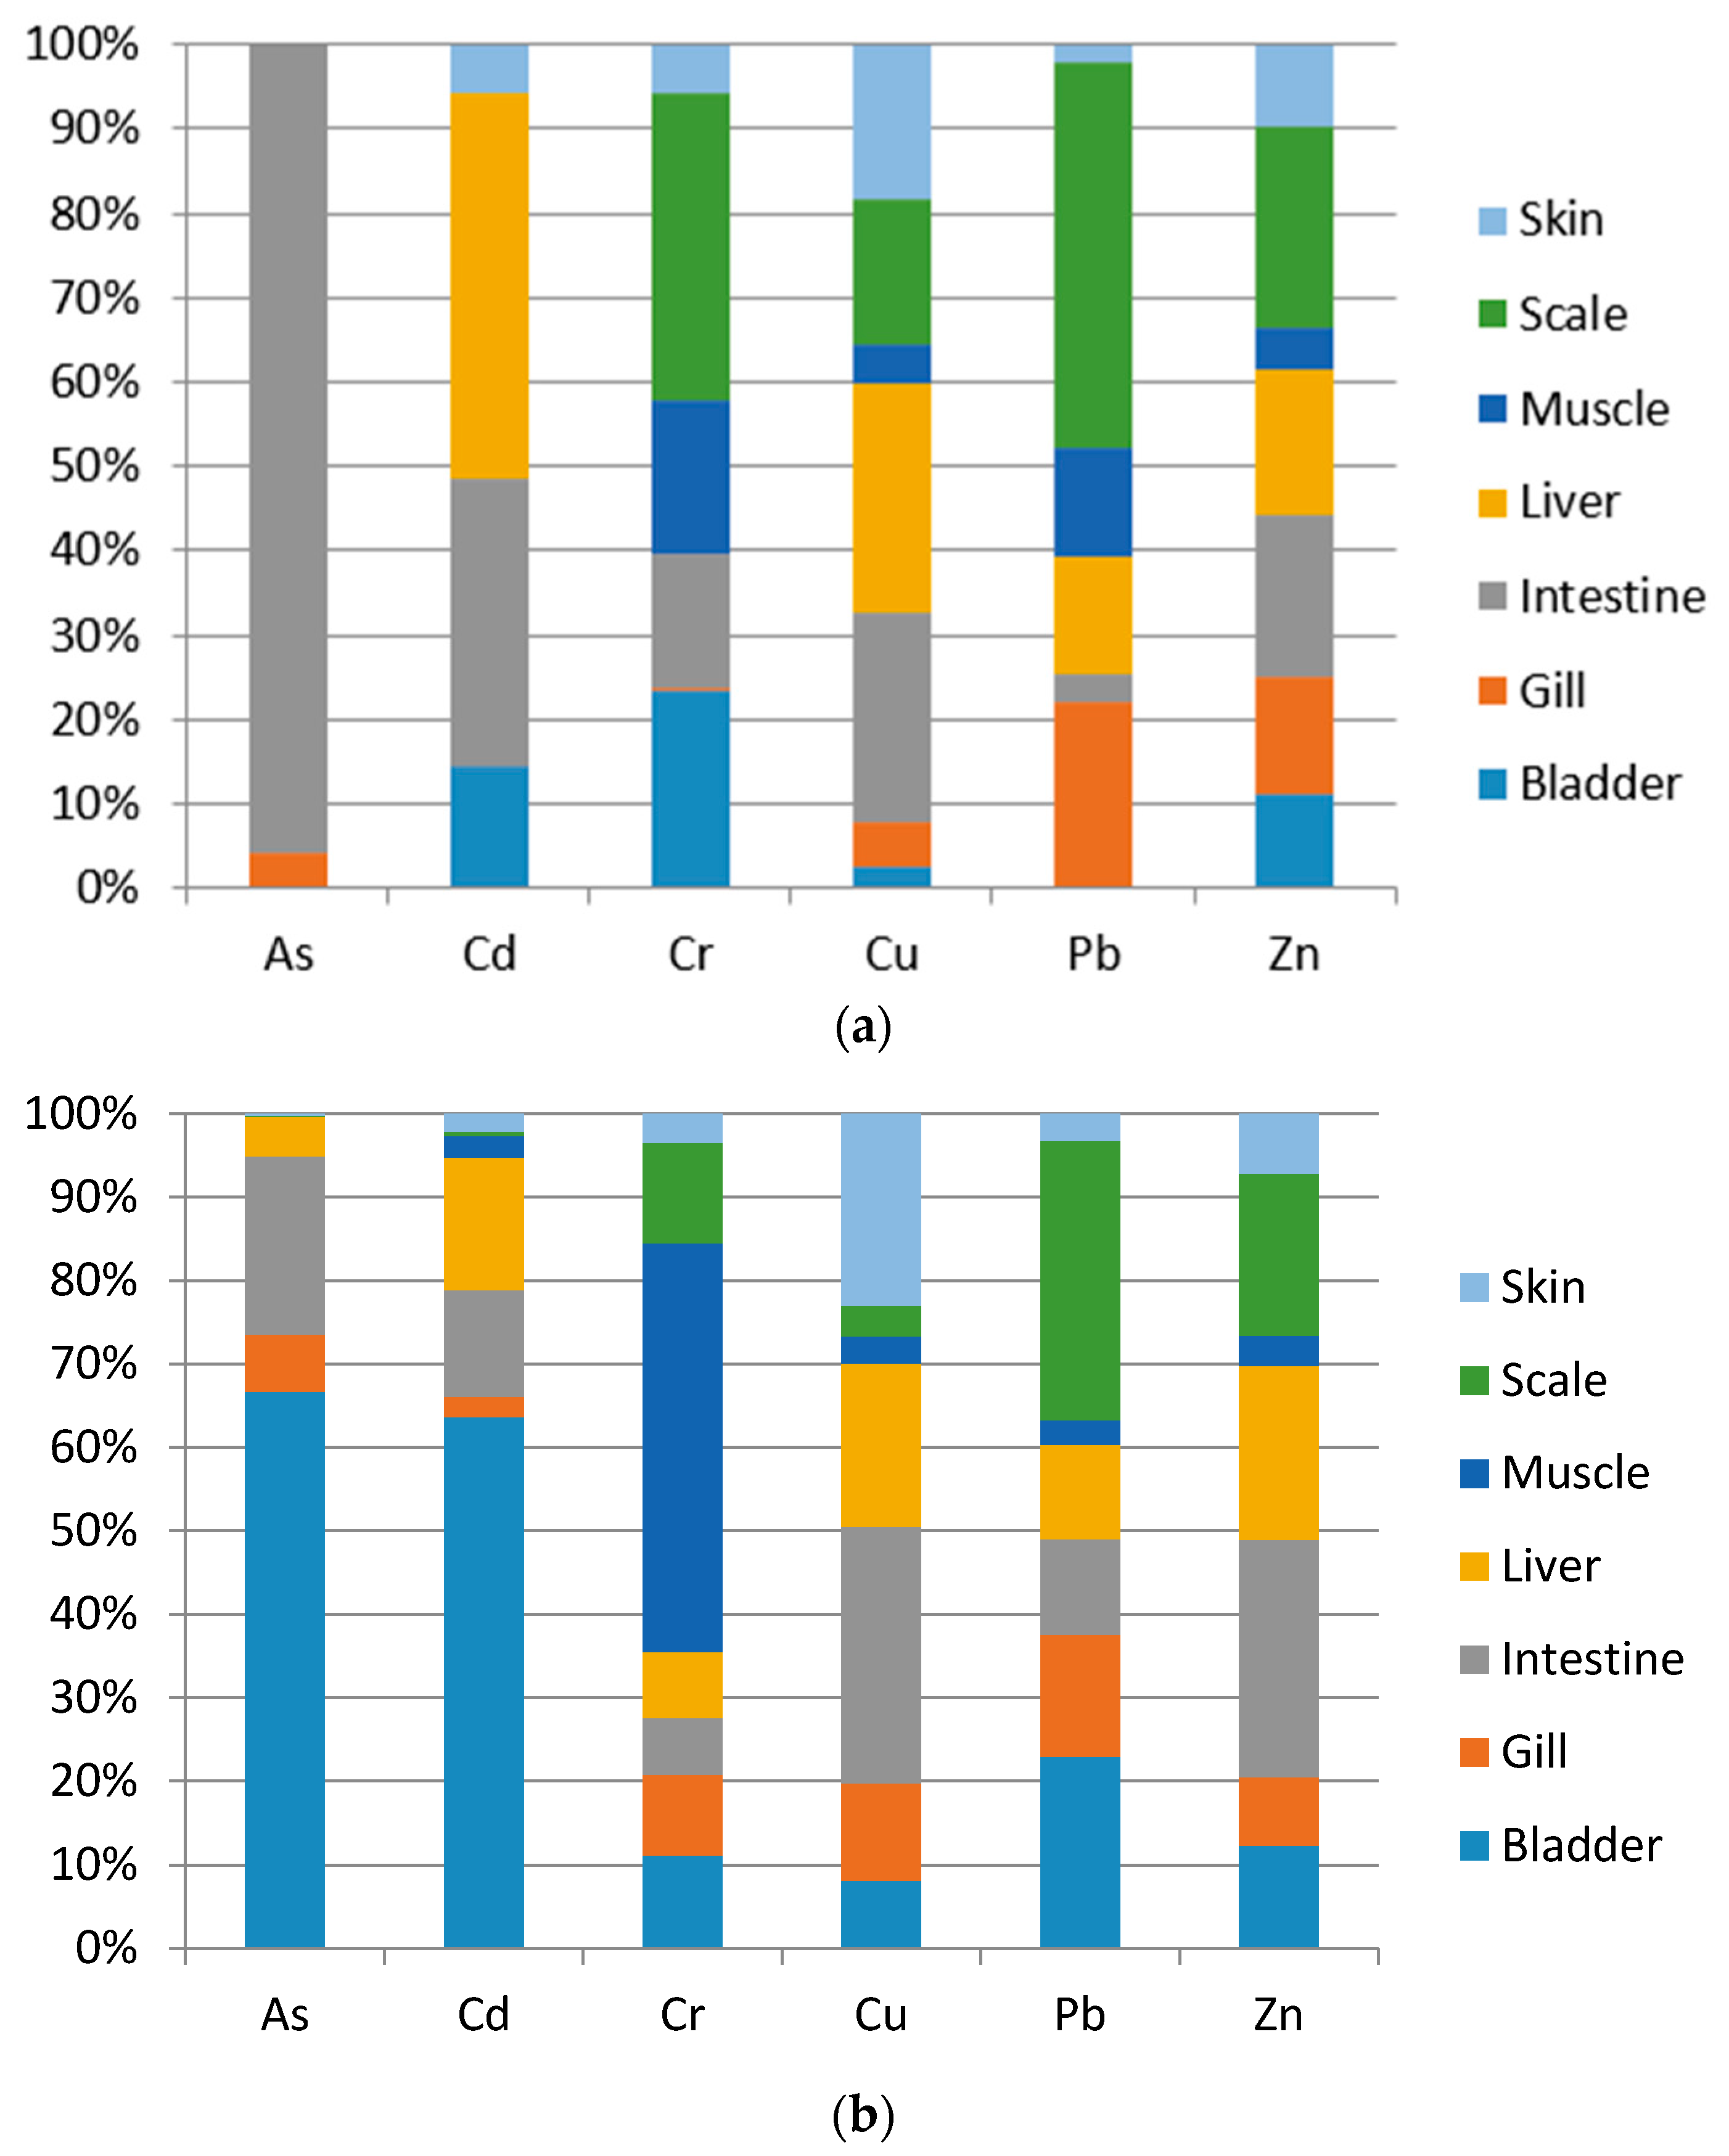
3.2. Trace Element Distributions in Different Tissues of Cultured and Wild Fish

Figure 1a illustrates the proportion of heavy metal distributions in cultured fish (Grass carp and Crucian carp) muscle and mixed edible tissues (bladder, liver, muscle and skin). Figure 1b illustrates the proportion of heavy metal distributions in wild fish (Grass carp and Crucian carp) muscle and mixed edible tissues (bladder, liver, muscle and skin).
With respect to the distribution comparison in fish muscle and mixed fish edible tissues, As was not found in cultured fish muscle or in mixed edible tissues. The concentration proportions of Cd, Cu and Zn in mixed edible tissues were obviously higher than in muscles of both cultured and wild fish. On the contrary, the concentration proportion of Cr was much higher in muscles than in mixed edible tissues of both cultured and wild fish. The concentration proportion of Pb in cultured fish was much higher in muscles than in mixed edible tissues, and in wild fish, was higher in mixed edible tissues. Thus, we can deduce that organs like the liver, bladder, intestine and gill were more likely have higher trace element accumulation abilities in both cultured and wild fish, except for Cr.
Figure 2a,b compare the heavy metal distributions in different tissues of cultured (Grass carp and Crucian carp) and wild fish (Grass carp and Crucian carp).
With respect to the distribution comparison among different fish tissues, scales (MPI = 3.342) and liver (MPI = 1.276) were regarded as the main accumulation tissues for cultured fish. As could only be detected in cultured fish intestine and gill, Cd and Cu accumulated mainly in cultured fish intestine and liver, Pb and Cr accumulated mainly in scales, and Zn accumulated evenly in scales, intestines, liver and gills. For wild fish, the bladder (MPI = 0.640) and intestine (MPI = 0.477) were regarded as the main accumulation tissues for wild fish. As and Cd accumulated mainly in wild fish bladder, Cr accumulated mainly in wild fish muscle, Cu and Zn accumulated mainly in intestine and liver, and Pb accumulated mainly in scales and the bladder. To summarize, in both cultured and wild fish, Cu accumulated mainly in the intestine and liver, and Pb accumulated in the scales. This conclusion shows consistency with the results of previous studies [60,61]. Fish can accumulate trace elements through ion exchange with the aquatic environment (like water and sediment) and food ingestion (like water grass, plankton, and feed) [62,63]. The main accumulation tissues for cultured fish were the scales and liver, and for wild fish, the bladder and intestine. This conclusion may reveal that the heavy metal concentration in an aquatic environment may influence cultured fish more than wild fish, and the heavy metal concentration in fish food more than in wild fish. To demonstrate this conclusion, aquaculture water and sediment, lake water and sediment, plankton, typical grass and artificial feed can be included in the investigation subjects for further studies of trace element distributions.

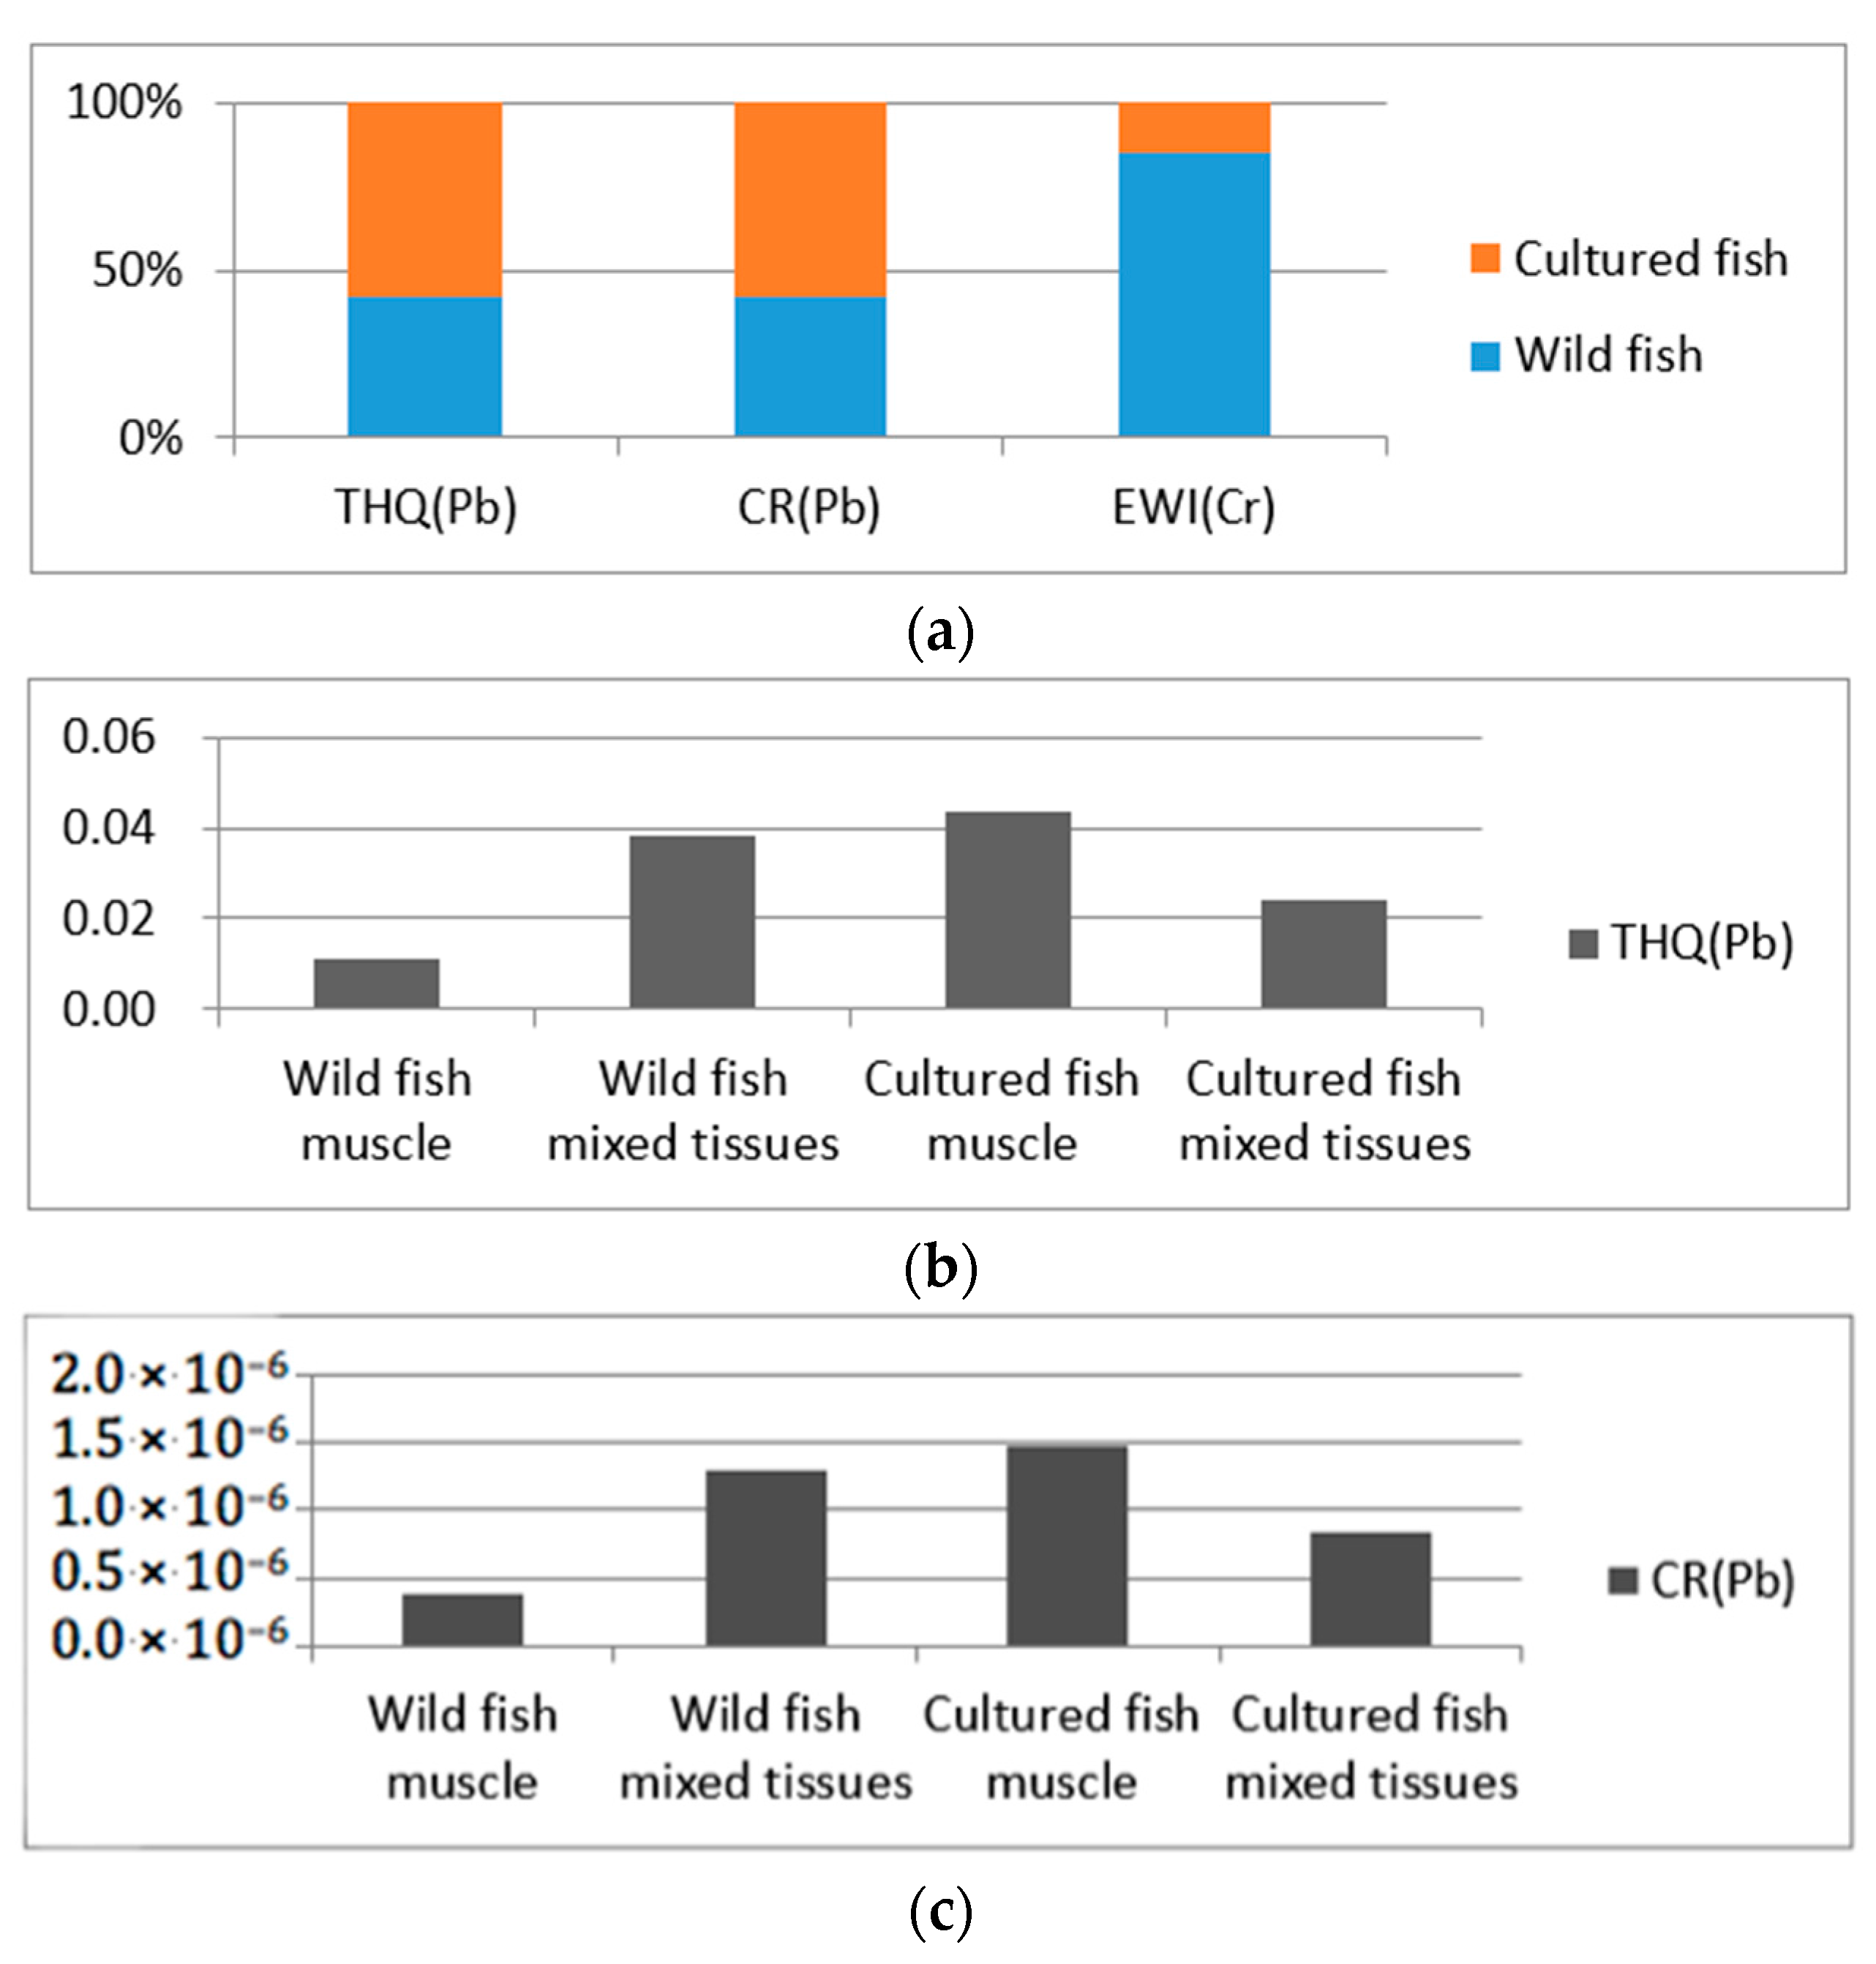
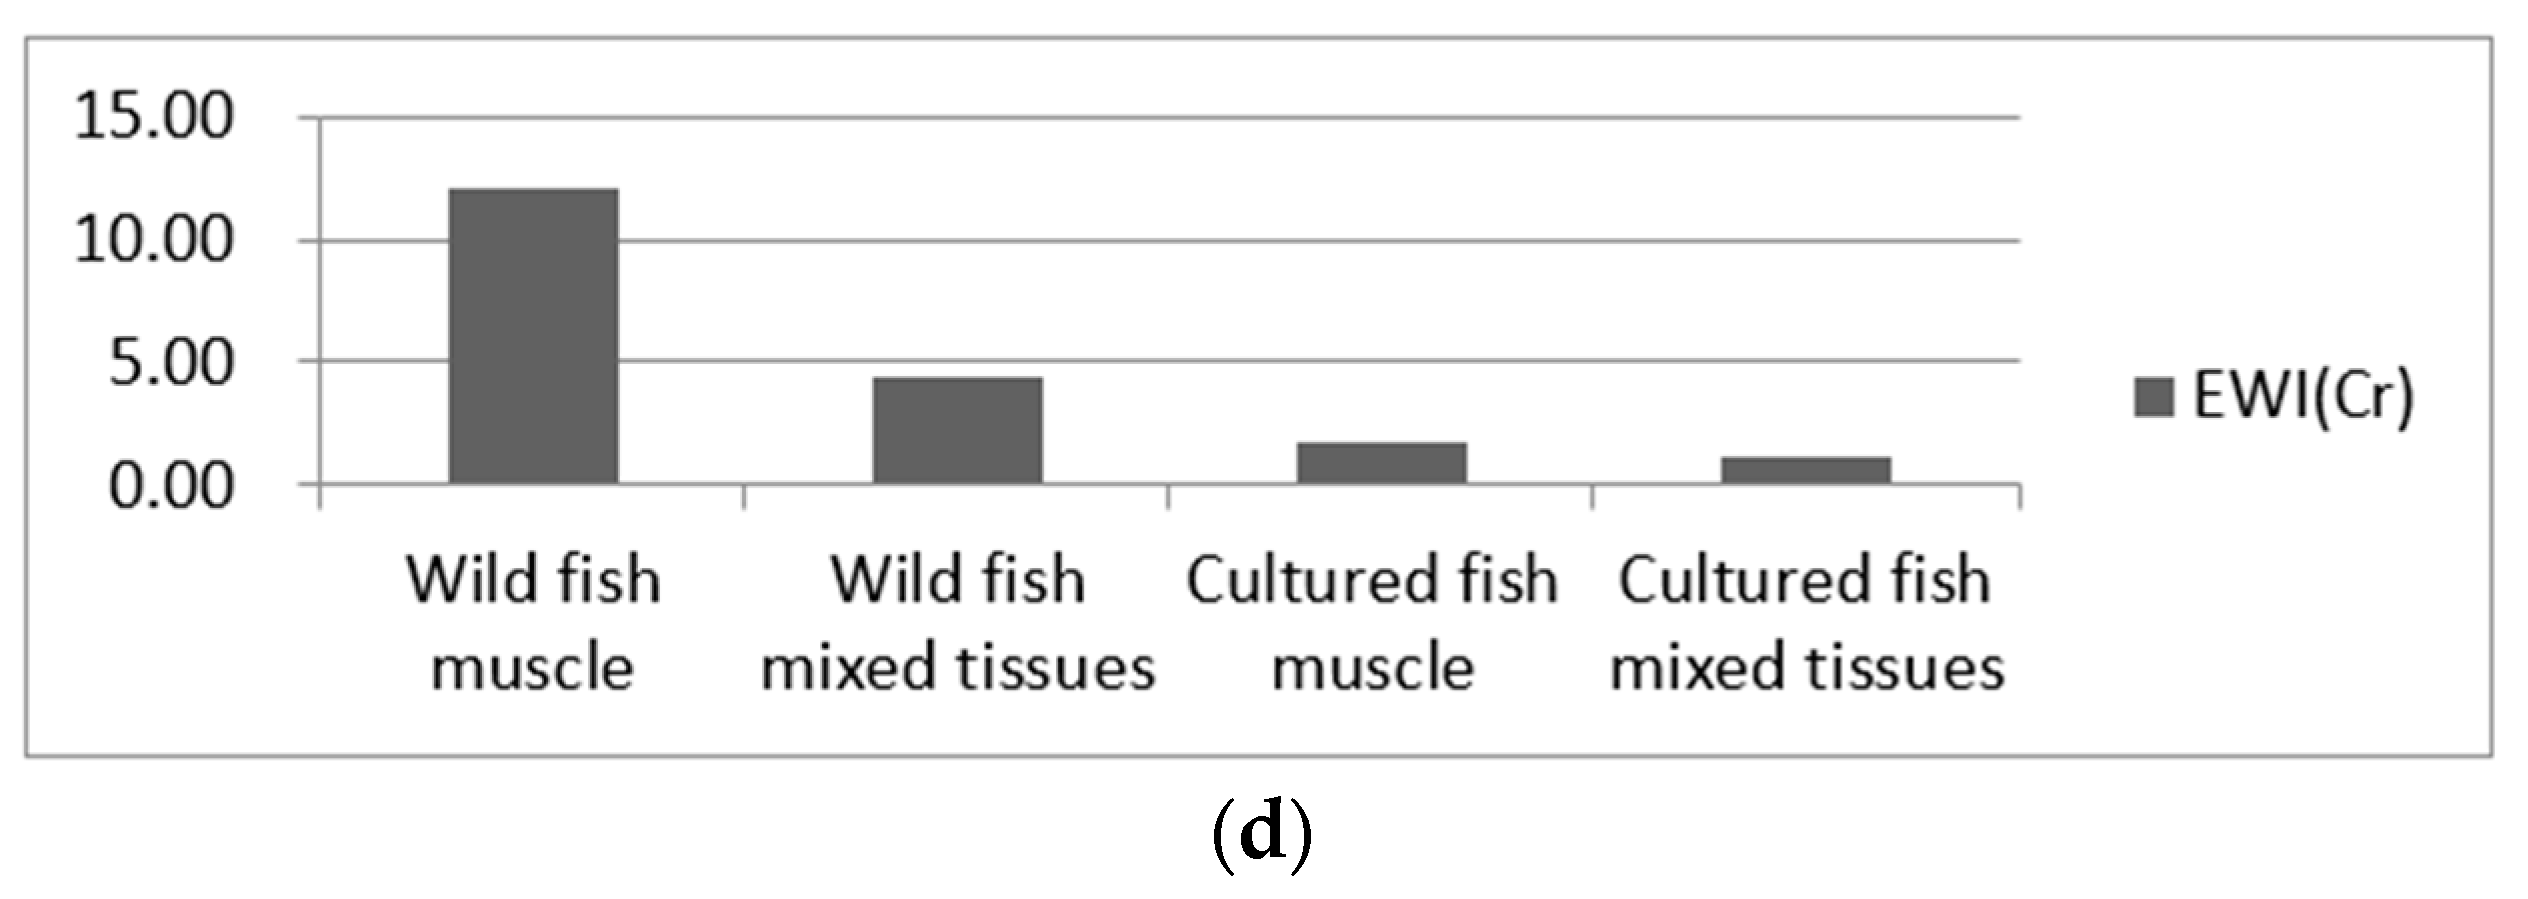
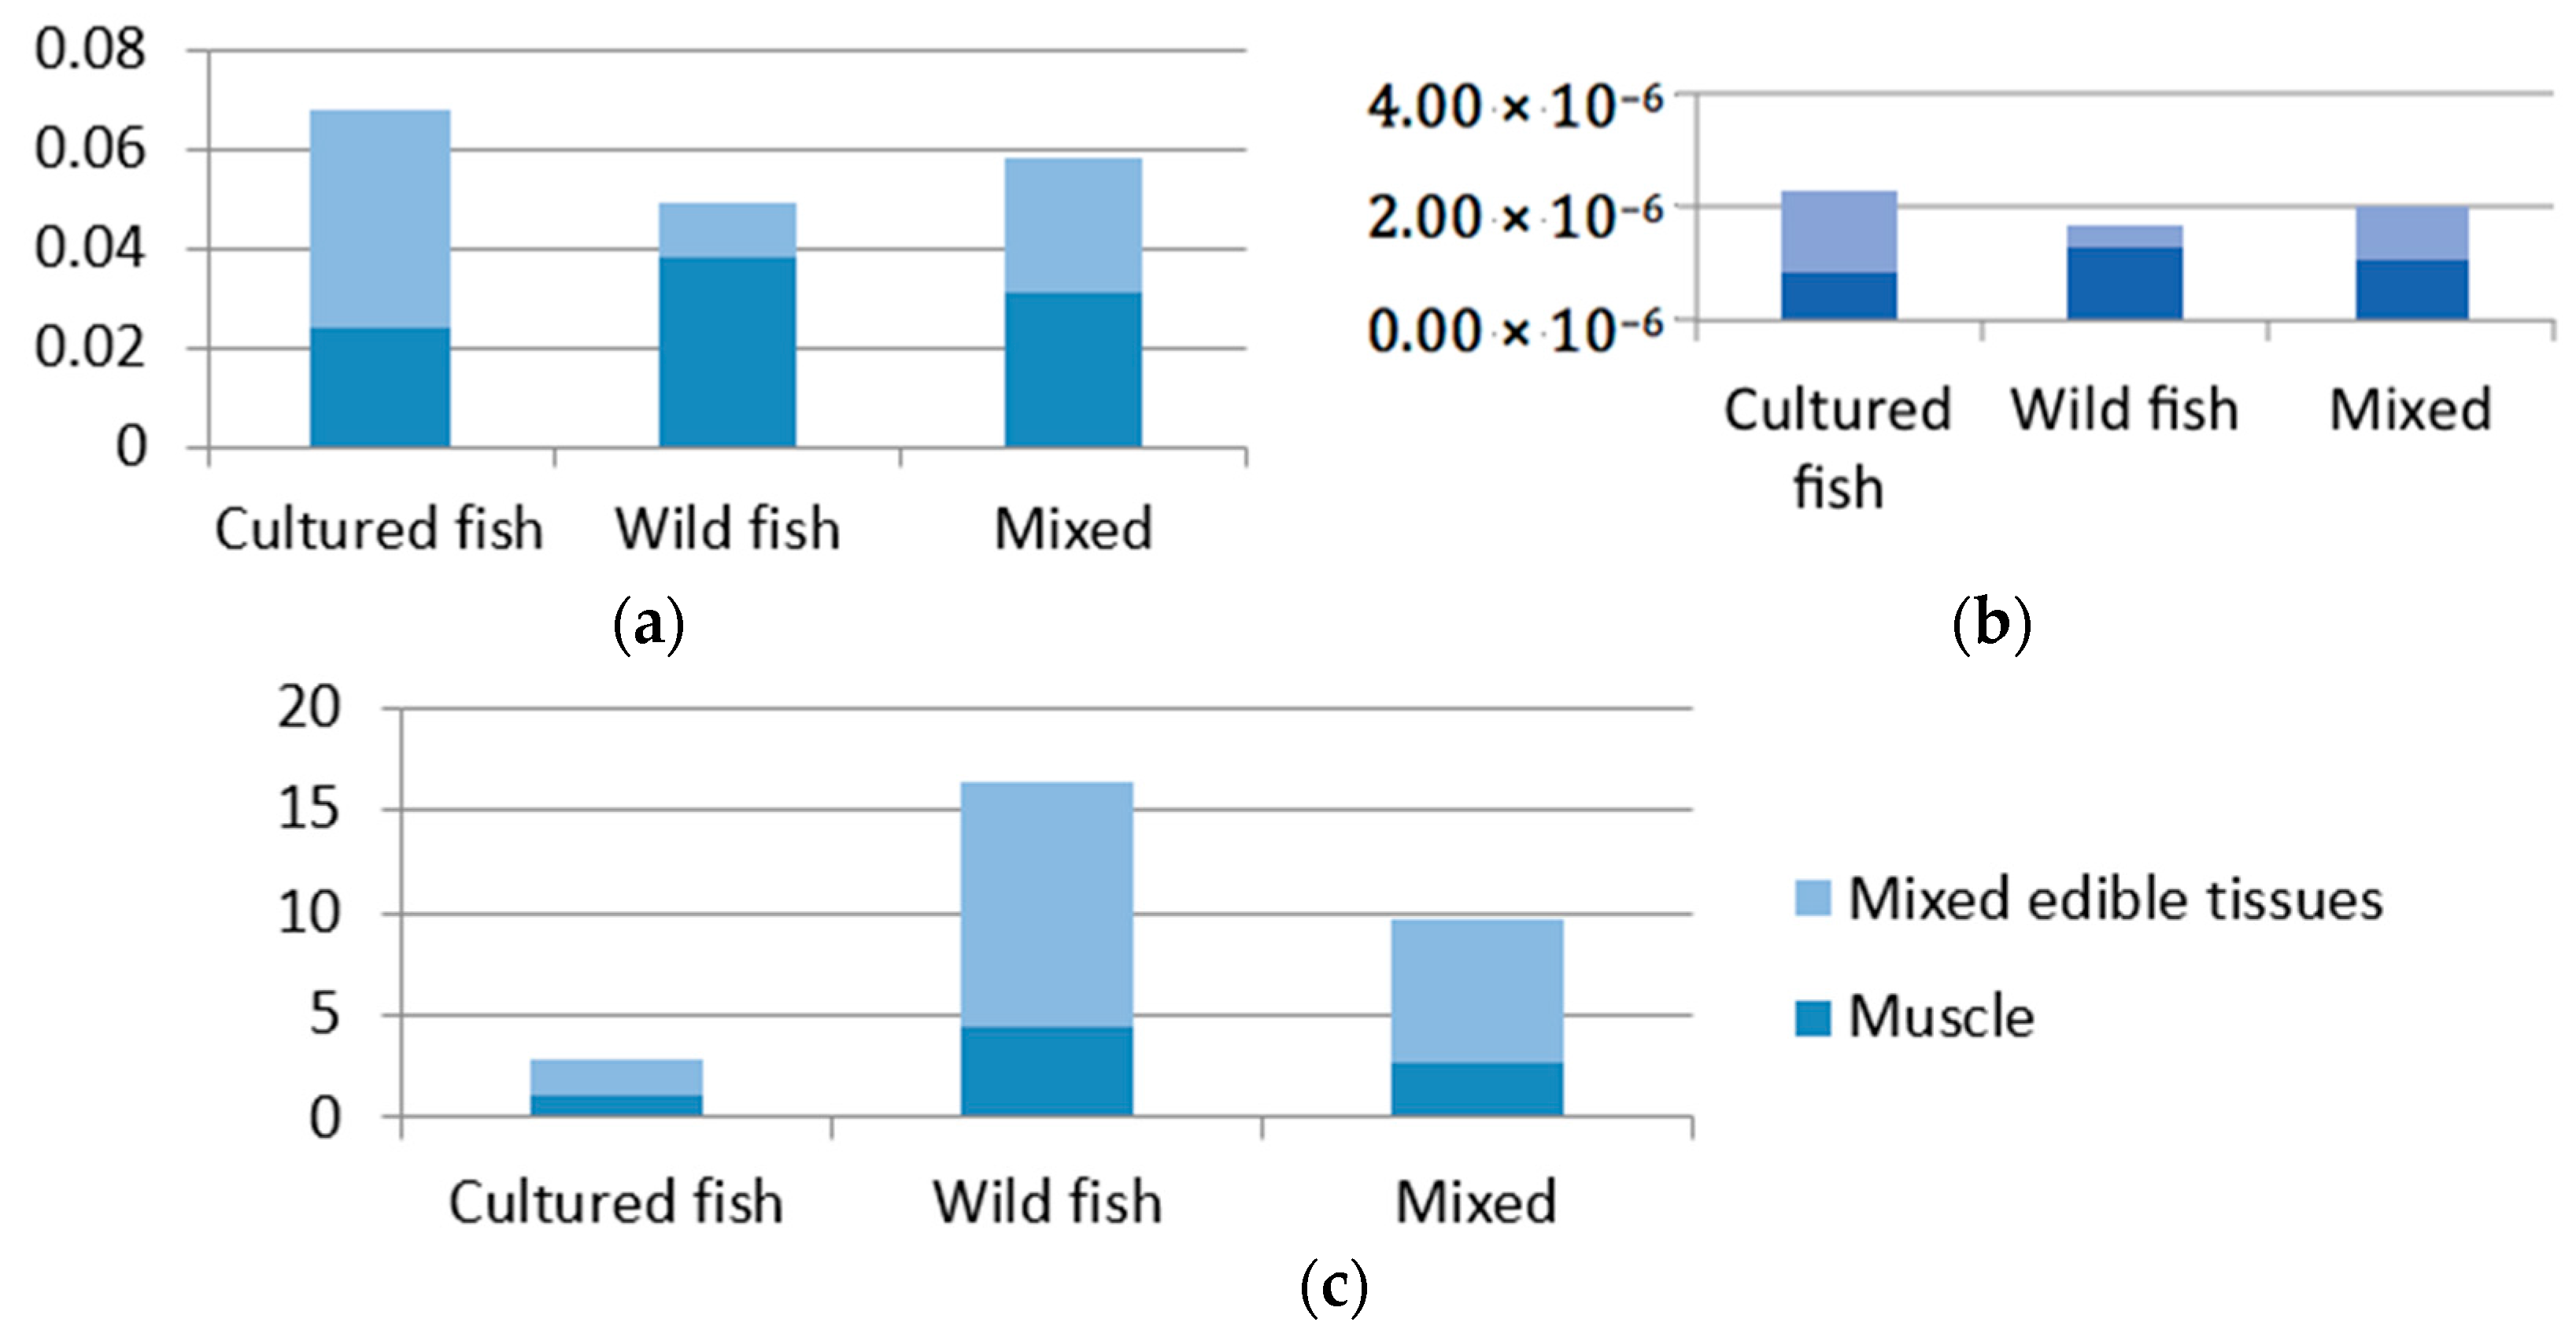
3.3. Comparison of Health Risk Assessment for Cultured and Wild Fish

Residual heavy metals and metalloids in fish will be amplified and enriched by the food chain, posing a serious threat to human health and the ecological environment. Thus, it is necessary to assess the corresponding health risk brought about by cultured and wild fish consumption. The daily fish muscle consumption of inhabitants in Hubei province is 54.33 g/day [46]. Table 4 shows the calculation results of target hazard quotients (THQ), carcinogenic risk (CR) and estimated weekly intake (EWI) from cultured and wild fish (muscle and mixed edible tissues) consumption. All the calculated results of THQ, CR and EWI were based on the mean heavy metal concentrations of cultured and wild fish (Grass carp and Crucian carp) muscle and mixed edible tissues (bladder, liver, muscle and skin).
For cultured fish, the calculation results of THQ for all trace elements through cultured fish muscle and mixed edible tissue consumption were less than 1, which means there were no significant health risks through cultured fish consumption. The health risk levels of cultured fish muscle calculated by THQ decreased in the following order, Zn > Pb > Cu > Cr. The health risk levels for mixed edible tissues of cultured fish calculated by THQ decreased in the following order, Zn > Cu > Pb > Cd > Cr. The above calculation results of THQ reveal that without considering the nutrient elements (Zn and Cu), Pb (accounts more than 70% of the total target hazard quotient in muscle) was recognized as the major contributor of non-carcinogenic risk to the local inhabitants for both cultured fish muscle and mixed edible tissue consumption. The calculation results of CR for Pb through cultured fish muscle consumption was recognized as acceptable (1.0 × 10⁻⁶ < 1.47 × 10⁻⁶ < 1.0 × 10⁻⁴), and through mixed edible tissues consumption was recognized as negligible (8.30 × 10⁻⁷ < 1.0 × 10⁻⁶). The calculation results of EWI for all trace elements through cultured fish muscle and mixed edible tissues were less than the corresponding PTWIs (the limitations of EWI), which means there were no significant health risks through cultured fish consumption. EWI/PTWI values were selected to compare the health risks of different trace metals. The EWI/PTWI values in cultured fish muscles decreased in the following order: Cr > Pb > Zn > Cu. The EWI/PTWI values in mixed edible tissues of cultured fish decreased in the following order, Cr > Zn > Pb > Cd > Cu. The above calculation results of EWI/PTWI revealed that Cr was recognized as the major contributor of non-carcinogenic risk to the local inhabitants for both cultured fish muscle and mixed edible tissue consumption.
For wild fish, the calculation results of THQ for all trace elements through wild fish muscle and mixed edible tissue consumption were less than 1, which means there were no significant health risks through wild fish consumption. The health risk levels of wild fish muscle calculated by THQ decreased in the following order, Zn > Pb > Cu > Cd > Cr. The health risk levels in mixed edible tissues of wild fish calculated by THQ decreased in the following order, Zn > Cd > Pb > Cu > As > Cr. The above calculation results of THQ reveal that without considering the nutrient elements (Zn and Cu), Pb (accounts for nearly 70% of the total target hazard quotient) was recognized as the major contributor of non-carcinogenic risk for wild fish muscle consumption to the local inhabitants. Cd, Pb, Cu and As had nearly equal potential non-carcinogenic risks in mixed edible tissues of wild fish consumption. The calculation results of CR for As and Pb through mixed edible tissue consumption of wild fish were recognized as acceptable (1.0 × 10⁻⁶ < 1.60 × 10⁻⁵ < 1.0 × 10⁻⁴, 1.0 × 10⁻⁶ < 1.30 × 10⁻⁶ < 1.0 × 10⁻⁶), and for Pb through muscle consumption, negligible (3.77 × 10⁻⁷ < 1.0 × 10⁻⁶). The above calculated results of CR reveal that As was recognized as the major contributor of carcinogenic risk for local inhabitants through wild fish mixed edible tissue consumption, and Pb was recognized as the major contributor through wild fish muscle consumption. The calculation results of EWI for all trace elements in wild fish muscle and mixed edible tissues were less than the corresponding PTWIs, and that means there were no significant health risks associated with wild fish consumption. The EWI/PTWI values for wild fish muscles decreased in the following order, Cr > Zn > Pb > Cd > Cu. The EWI/PTWI values for mixed edible tissues of wild fish decreased in the following order, Cr > Pb > Zn > Cd > As > Cu. The above calculation results of EWI/PTWI reveal that Cr was recognized as the major contributor of non-carcinogenic risk to the local inhabitants for both wild fish muscle and mixed edible tissue consumption.
Overall, for both cultured and wild fish, Pb was recognized as the major contributor for non-carcinogenic risk and carcinogenic risk assessment based on the calculation results of THQ and CR, and Cr was recognized as the major contributor for non-carcinogenic risk based on the calculation results of EWI. Therefore, Pb and Cr were selected as the representative trace elements to compare the potential health risk between cultured fish and wild fish, and between muscle consumption and mixed edible tissue consumption.
Figure 3a shows that cultured fish was associated with more health risks than wild fish based on the calculation results of THQ and CR, and wild fish was associated with more risk than cultured fish based on the calculation results of EWI. Figure 3b–d shows that in cultured fish, muscle consumption had higher potential health risk than mixed edible tissues, based on the calculation results of THQ, CR and EWI. However, in wild fish, mixed edible tissues had higher potential health risk than muscle.
In order to explore the method for minimizing health risks through fish consumption, this study calculated the health risk associated with mixed fish (wild:cultured =1:1) consumption to balance the risks calculated by three different models. The total fish ingestion rate remained 54.33 g/day. The calculation results of consuming cultured fish mixed with wild fish compared with consuming cultured fish or wild fish separately are shown in Figure 4a–c.
Figure 4 shows that, for fish muscle, consuming cultured fish separately brought relatively lower health risks than wild and mixed fish through fish consumption. When the study objectives involved all edible fish tissues besides muscle, consuming cultured fish mixed with wild fish brought relatively lower health risks than consuming wild and mixed fish separately, considering the comprehensive assessment results based on THQ, CR and EWI.

3.4. Comparison of the Maximum Allowable Fish Daily Consumption Limit for Cultured and Wild Fish

Table 5 shows the calculation results of the maximum allowable fish daily consumption ( FIR lim ) based on target hazard quotients (THQ), carcinogenic risk (CR) and estimated weekly intake (EWI).
Based on the health risk calculation model of THQ, for fish muscle, people should consume less than 1018 g/day cultured fish muscle or 1183 g/day wild fish muscle from Honghu Lake to assure their health. For mixed edible fish tissues, people were suggested to consume less than 425 g/day cultured fish mixed tissues or 396 g/day wild fish mixed tissues to assure their health. Based on the health risk calculation model of CR, for fish muscle, people should consume less than 3684 g/day cultured fish muscle or 14,396 g/day wild fish muscle to assure their health. For mixed edible fish tissues, people should consume less than 6550 g/day cultured fish mixed tissues or 340 g/day wild fish mixed tissues to assure their health. Based on the health risk calculation model of EWI, for fish muscle, people should consume less than 465 g/day cultured fish muscle or 68 g/day wild fish muscle to assure their health. For mixed edible fish tissues, people should consume less than 721 g/day cultured fish mixed tissues or 186 g/day wild fish mixed tissues to assure their health. Considering the comprehensive calculated results based on THQ, CR and EWI, people should consume no more than 465 g/day cultured fish muscle, 68 g/day wild fish muscle, 452 g/day mixed cultured fish edible tissues or 186 g/day mixed wild fish edible tissues to assure their health to the greatest extent.

4. Conclusions

This study provides valuable information concerning comparison of toxic metal distributions, health risk assessment and fish consumption limitation for cultured and wild fish around Honghu area. In general, all detected trace elements in studied fish were within the corresponding standards (GB2762-2012 and NY5073-2006). High levels of Cr accumulated in wild fish muscles (1.947 mg/kg), and relatively high levels of Pb accumulated in cultured fish muscles (0.2052 mg/kg). Gills, intestines, the liver and scales were the main heavy metal accumulation organs for cultured fish, compared with the bladder, intestines, liver and scales for wild fish. Pb and Cr were recognized as the major contributors of non-carcinogenic risk to the local inhabitants for both wild and cultured fish consumption. For local government, the Cr concentration in Honghu Lake should be regularly monitored because the corresponding health risk calculated by EWI was almost close to the limitation (EWICr/PTWICr = 80.13%). Cultured fish had more health risks than wild fish based on the calculation results of THQ and CR; in contrast, wild fish had the opposite results based on the calculation results of EWI. Thus, for local inhabitants, consuming muscle of cultured fish separately had relatively lower potential health risks, and when the consumption objectives were mixed edible fish tissues, a ratio of 1:1 for cultured fish mixed with wild fish was recommended. In addition, people should consume no more than 465 g/day of cultured fish muscle, 68 g/day of wild fish muscle, 452 g/day of mixed cultured fish edible tissues or 186 g/day of mixed wild fish edible tissues from Honghu Lake to assure their health to the greatest extent.

Supplementary Materials

The following are available online at https://0-www-mdpi-com.brum.beds.ac.uk/1660-4601/15/2/334/s1; Figure S1: Map of cultured fishes sampling fishponds (red points S1-6) around Honghu Lake, Table S1: Species, feeding habits, lengths (Mean ± SD) and weights (Mean ± SD) for cultured fishes, Table S2: Species, feeding habits, lengths (Mean ± SD) and weights (Mean ± SD) for wild fishes.

Acknowledgments

This study was financially supported by Humanities and Social Sciences Foundation of Ministry of Education of China (Youth Fund: 17YJCZH081), Nature Science Foundation of Hubei Province and Science and Technology Research Project of Hubei Provincial Education Department (B2017601).

Author Contributions

Fei Li organized this study, conducted the study design, and drafted the manuscript. Jingdong Zhang and Liyun Zhu contributed to the study design, prepared datasets, performed the statistical analysis, and drafted the manuscript. Chaoyang Liu, Zhenzhen Qiu, Minsi Xiao and Ying Cai contributed to study design, interpretation of analysis, and revision of the manuscript.

Conflicts of Interest

The authors declare no conflict of interest.

References

  1. China Fishery Government Network. 2016 National Fisheries Statistics Bulletin. 2017. Available online: http://www.moa.gov.cn/sjzz/yzjzw/yyywyzj/201707/t20170725_5759859.htm (accessed on 25 July 2017). (In Chinese)
  2. Food and Agriculture Organization (FAO). Fishery and Aquaculture Statistics for 2014; Food and Agriculture Organization: Rome, Italy, 2016. [Google Scholar]
  3. Zhang, L.; Zhang, D.W.; Wei, Y.H.; Luo, L.G.; Dai, T.C. Risk assessment of trace elements in cultured freshwater fish from Jiangxi province, China. Environ. Monit. Assess. 2014, 186, 2185–2194. [Google Scholar] [CrossRef] [PubMed]
  4. Omar, W.A.; Zaghloul, K.H.; Abdel-Khalek, A.A.; Abo-Hegab, S. Risk assessment and toxic effects of metal pollution in two cultured and wild fish species from highly degraded aquatic habitats. Arch. Environ. Contam. Toxicol. 2013, 65, 753–764. [Google Scholar] [CrossRef] [PubMed]
  5. Makokha, V.A.; Qi, Y.L.; Shen, Y.; Wang, J. Concentrations, distribution, and ecological risk assessment of heavy metals in the east Dongting and Honghu Lake, China. Expo. Health 2016, 8, 31–41. [Google Scholar] [CrossRef]
  6. Chen, H.; Liu, S.; Xu, X.R.; Diao, Z.H.; Sun, K.F.; Hao, Q.W.; Liu, S.S.; Ying, G.G. Tissue distribution, bioaccumulation characteristics and health risk of antibiotics in cultured fish from a typical aquaculture area. J. Hazard. Mater. 2017, 343, 140–148. [Google Scholar] [CrossRef] [PubMed]
  7. Song, C.; Li, L.; Zhang, C.; Kamira, B.; Qiu, L.P.; Fan, L.M.; Wu, W.; Meng, S.L.; Hu, G.D.; Chen, J.Z. Occurrence and human dietary assessment of sulfonamide antibiotics in cultured fish around Tai Lake, China. Environ. Sci. Pollut. Res. Int. 2017, 24, 17493–174997. [Google Scholar] [CrossRef] [PubMed]
  8. Cheng, Z.; Mo, W.Y.; Man, Y.B.; Nie, X.P.; Li, K.B.; Wong, M.H. Replacing fish meal by food waste in feed pellets to culture lower trophic level fish containing acceptable levels of organochlorine pesticides: Health risk assessments. Environ. Int. 2014, 73, 22–27. [Google Scholar] [CrossRef] [PubMed]
  9. Abdallah, M.A.M.; Morsy, F.A.E. Persistent organochlorine pollutants and metals residues in sediment and freshwater fish species cultured in a shallow lagoon, Egypt. Environ. Technol. 2013, 34, 2389–2399. [Google Scholar] [CrossRef] [PubMed]
  10. Ahmed, M.K.; Shaheen, N.; Islam, M.S.; Habibullah-al-Mamun, M.; Islam, S.; Mohiduzzaman, M.; Bhattacharjee, L. Dietary intake of trace elements from highly consumed cultured fish (Labeo rohita, Pangasius pangasius and Oreochromis mossambicus) and human health risk implications in Bangladesh. Chemosphere 2015, 128, 284–292. [Google Scholar] [CrossRef] [PubMed]
  11. Huang, J.H.; Li, F.; Zeng, G.M.; Liu, W.C.; Huang, X.L.; Xiao, Z.H.; Wu, H.P.; Gu, Y.L.; Li, X.; He, X.X.; et al. Integrating hierarchical bioaccessibility and population distribution into potential eco-risk assessment of heavy metals in road dust: A case study in Xiandao District, Changsha city, China. Sci. Total Environ. 2016, 541, 969–976. [Google Scholar] [CrossRef] [PubMed]
  12. Li, F.; Zhang, J.D.; Jiang, W.; Liu, C.Y.; Zhang, Z.M.; Zhang, C.D.; Zeng, G.M. Spatial health risk assessment and hierarchical risk management for mercury in soils from a typical contaminated site, China. Environ. Geochem. Health 2017, 39, 923–934. [Google Scholar] [CrossRef] [PubMed]
  13. Li, F.; Cai, Y.; Zhang, J.D. Spatial Characteristics, Health Risk Assessment and Sustainable Management of Heavy Metals and Metalloids in Soils from Central China. Sustainability 2018, 10, 91. [Google Scholar] [CrossRef]
  14. Gastro-Gonzalez, M.I.; Mendez-Armenta, M. Heavy metals: Implications associated to fish consumption. Environ. Toxicol. Chem. 2008, 26, 263–271. [Google Scholar] [CrossRef] [PubMed]
  15. Guardiola, F.A.; Cuesta, A.; Meseguer, J.; Martinez, S.; Martinez-Sanchez, M.J.; Perez-Sirvent, C.; Esteban, M.A. Accumulation, histopathology, and immunotoxicological effects of waterborne cadmium on gilthead seabream (Sparus aurata). Fish Shellfish Immunol. 2013, 35, 792–800. [Google Scholar] [CrossRef] [PubMed]
  16. Su, S.L.S.; Ramos, G.B.; Su, M.L.L.S. Bioaccumulation and histopathological alteration of total lead in selected fish from Manila Bay, Philippines. Saudi J. Biol. Sci. 2013, 20, 353–355. [Google Scholar] [CrossRef] [PubMed]
  17. Bervotes, L.; Blust, R.; Verheyen, R. Accumulation of metals in the tissue of three spined sticklebacks (Gasterosteus aculeatus) from natural fresh waters. Ecotoxicol. Environ. Saf. 2001, 48, 117–127. [Google Scholar] [CrossRef] [PubMed]
  18. Burger, J.; Gaines, K.F.; Boring, S.; Syephans, L.; Snodgrass, J.; Dixon, C. Metals levels in fish from the Savannah River: Potential hazards to fish and other receptors. Environ. Res. 2002, 89, 95–97. [Google Scholar] [CrossRef] [PubMed]
  19. Honghu City Government China. Statistical Communique on National Economic and Social Development of Honghu Municipality in 2016. 2017. Available online: http://www.honghu.gov.cn/z/xxgk/tjgb/2017-04-10/38966.html (accessed on 10 April 2017).
  20. Hu, Y.; Qi, S.H.; Wu, C.X.; Ke, Y.P.; Chen, J.; Chen, W.; Gong, X.Y. Preliminary assessment of heavy metal contamination in surface water and sediments from Honghu Lake, East Central China. Front. Earth Sci. 2012, 6, 39–47. [Google Scholar] [CrossRef]
  21. Li, F.; Qiu, Z.Z.; Zhang, J.D.; Liu, C.Y.; Cai, Y.; Xiao, M.S. Spatial distribution and fuzzy health risk assessment of trace elements in surface water from Honghu Lake. Int. J. Environ. Res. Public Health 2017, 14, 1011. [Google Scholar] [CrossRef] [PubMed]
  22. Ban, X.; Yu, C.; Wei, K.; Du, Y. Analysis of influence of enclosure aquaculture on water quality of Honghu Lake. Environ. Sci. Technol. 2010, 9, 125–129. [Google Scholar]
  23. Hu, Y.; Zhou, C.S.; Hu, L.H.; Pan, Q.C.; Jiang, Q.Q.; Wu, Y.; Wang, Y.H.; Zheng, Y.N.; Dai, Y. Comparative analysis of the nutritional composition in the muscles and skins of Anguilla Japonica cultured in the seawater and freshwater. Acta Hydrobiol. Sin. 2015, 1, 730–739. (In Chinese) [Google Scholar]
  24. Su, S. Fish is also a kind of delicacies. Food Nutr. China 2001, 5, 49–50. (In Chinese) [Google Scholar]
  25. Phoenix News. The Rank List of the Most Popular Food in Hubei. 2017. Available online: http://share.iclient.ifeng.com/news/shareNews?forward=1&aid=118727110#backhead (accessed on 9 February 2017). (In Chinese).
  26. Cheng, Z.; Lam, C.L.; Mo, W.Y.; Nie, X.P.; Choi, W.M.; Man, Y.B.; Wong, M.H. Food wastes as fish feeds for polyculture of low-trophic-level fish: Bioaccumulation and health risk assessments of heavy metals in the cultured fish. Environ. Sci. Pollut. Res. 2016, 23, 7195–7203. [Google Scholar] [CrossRef] [PubMed]
  27. Jiang, H.F.; Qin, D.L.; Chen, Z.X.; Tang, S.Z.; Bai, S.Y.; Mou, Z.B. Heavy metal levels in fish from Heilongjiang River and potential health risk assessment. Bull. Environ. Contam. Toxicol. 2016, 97, 536–542. [Google Scholar] [CrossRef] [PubMed]
  28. Yipel, M.; Türk, E.; Tekeli, I.O.; Oğuz, H. Heavy metal levels in farmed and wild fish of aegean sea and assessment of potential risks to human health. Kafkas Univ. Vet. Fak. Derg. 2016, 22, 889–894. [Google Scholar]
  29. Chi, Q.Q.; Zhu, G.W.; Alan, L. Bioaccumulation of heavy metals in fish from Taihu Lake, China. J. Environ. Sci. 2007, 19, 1500–1504. [Google Scholar] [CrossRef]
  30. Wei, Y.H.; Zhang, J.Y.; Zhang, D.W.; Tu, T.H.; Luo, L.G. Metal concentrations in various fish organs of different fish species from Poyang Lake, China. Ecotoxicol. Environ. Saf. 2014, 104, 182–188. [Google Scholar] [CrossRef] [PubMed]
  31. Li, F.; Xiao, M.S.; Zhang, J.D.; Liu, C.Y.; Qiu, Z.Z.; Cai, Y. Spatial distribution, chemical fraction and fuzzy comprehensive risk assessment of heavy metals in surface sediments from the Honghu Lake, China. Int. J. Environ. Res. Public Health 2018, 15, 207. [Google Scholar] [CrossRef] [PubMed]
  32. Ministry of Health of the People’s Republic of China. China GB 5009.12-2000; National Food Safety Standard: Determination of Lead in Foods; Ministry of Health: Beijing, China, 2010. (In Chinese)
  33. Ministry of Health and Family Planning Commission of the People’s Republic of China. GB 5009.15-2014; National Food Safety Standard: Determination of Cadmiumin Foods; Ministry of Health and Family Planning Commission: Beijing, China, 2014. (In Chinese)
  34. Ministry of Health and Family Planning Commission of the People’s Republic of China. GB 5009.123-2014; National Food Safety Standard: Determination of Chromium in Foods; Ministry of Health and Family Planning Commission: Beijing, China, 2014. (In Chinese)
  35. Ministry of Health and Family Planning Commission of the People’s Republic of China. GB 5009.11-2014; National Food Safety Standard: Determination of Total Arsenic and Inorganic Arsenic in Foods; Ministry of Health and Family Planning Commission: Beijing, China, 2014. (In Chinese)
  36. Ministry of National Standardization Management Committee of the People’s Republic of China. GB/T 5009.13-2003; National Food Safety Standard: Determination of Copper in Foods; Ministry of National Standardization Management Committee: Beijing, China, 2003. (In Chinese)
  37. Ministry of National Standardization Management Committee of the People’s Republic of China. GB/T 5009.14-2003; National Food Safety Standard: Determination of Zinc in Foods; Ministry of National Standardization Management Committee: Beijing, China, 2003. (In Chinese)
  38. Liang, P.; Wu, S.C.; Zhang, J.; Cao, Y.C.; Yu, S.; Wong, M.H. The effects of mariculture on heavy metal distribution in sediments and cultured fish around the Pearl River Delta region, south China. Chemosphere 2016, 148, 171–177. [Google Scholar] [CrossRef] [PubMed]
  39. Ullah, A.K.M.A.; Maksud, M.A.; Khan, S.R.; Lutfa, L.N.; Quraishi, S.B. Dietary intake of heavy metals from eight highly consumed species of cultured fish and possible human health risk implications in Bangladesh. Toxicol. Rep. 2017, 4, 574–579. [Google Scholar] [CrossRef] [PubMed]
  40. Alamdar, A.; Equani, S.A.M.A.S.; Hanif, N.; Ali, S.M.; Fasola, M.; Bokhari, H.; Katsoyiannis, I.A.; Shen, H.Q. Huaman exposure to trace metals and arsenic via consumption of fish from river Chenab, Pakistan and associated health risks. Chemosphere 2017, 168, 1004–1012. [Google Scholar] [CrossRef] [PubMed]
  41. Cai, S.W.; Ni, Z.H.; Liu, B.; Yan, X.; Fan, L.L.; Liu, Y. Concentration an risk assessment of heavy metals in the main economic fish from Chishui River. Freshw. Fish. 2017, 47, 105–112. (In Chinese) [Google Scholar]
  42. Zhang, F.F.; Yang, S.Q.; Xu, Y.P.; Zhou, Z.; Huang, Q.H. Contamination of heavy metals in game fish in Shanghai and fish consumption safety assessment. China Environ. 2017, 37, 754–760. (In Chinese) [Google Scholar]
  43. United States Environmental Protection Agency (USEPA). Risk Assessment Guidance for Superfund Volume 1: Human Health Evaluation Manual (Part A); United States Environmental Protection Agency: Washington, DC, USA, 1989.
  44. Cooper, C.B.; Doyle, M.E.; Kipp, K. Risk of consumption of contaminated seafood, the Quincy Bay Case Study. Environ. Health Perspect. 1991, 90, 133–140. [Google Scholar] [CrossRef] [PubMed]
  45. Environmental Protection Department. The fish and shrimps intake rate in different provinces of China. In Exposure Factors Handbook of Chinese Pollution; Duan, X.L., Ed.; China Environmental Publishing, Inc.: Beijing, China, 2013; Volume 1, pp. 246–247. (In Chinese) [Google Scholar]
  46. Environmental Protection Department. The weight of Chinese population divided by provinces (municipalities, autonomous regions), urban/rural, and sex. In Exposure Factors Handbook of Chinese Pollution; Duan, X.L., Ed.; China Environmental Publishing, Inc.: Beijing, China, 2013; Volume 1, p. 761. (In Chinese) [Google Scholar]
  47. Islam, M.S.; Ahmed, M.K.; Al-Mamun, M.H.; Masunaga, S. Assessment of trace metals in fish species of urban rivers in Bangladesh and health implications. Environ. Toxicol. Pharmacol. 2015, 39, 347–357. [Google Scholar] [CrossRef] [PubMed]
  48. United States Environmental Protection Agency (USEPA). Risk-Based Concentration Table; United States Environmental Protection Agency: Philadelphia, PA, USA, 2010.
  49. World Health Organization (WHO). Guidelines for Drinking Water Quality, 3rd ed.; World Health Organization: Geneva, Switzerland, 2004. [Google Scholar]
  50. Food and Agriculture Organization (FAO). Arsenic Contamination of Irrigation Water, Soil and Crops in Bangladesh: Risk Implications for Sustainable Agriculture and Food Safety in Asia; Food and Agriculture Organization of the United Nations Regional Office for Asia and the Pacific: Bangkok, Tailand, 2006. [Google Scholar]
  51. Ministry of Health of the People’s Republic of China. GB 2762-2012; National Food Safety Standard: Contaminants Limitation in Foods; Ministry of Health: Beijing, China, 2012. (In Chinese)
  52. Ministry of Agriculture of the People’s Republic of China. NY 5073-2006; Harmless Food—The Limit of Toxic and Harmful Substances in Aquatic Products; Ministry of Agriculture: Beijing, China, 2006. (In Chinese)
  53. Fu, J.; Hu, X.; Tao, X.C.; Yu, H.X.; Zhang, X.W. Risk and toxicity assessments of heavy metals in sediments and fish from the Yangtze River and Taihu Lake, China. Chemosphere 2013, 93, 1887–1895. [Google Scholar] [CrossRef] [PubMed]
  54. Yi, Y.J.; Yang, Z.F.; Zhang, S.H. Ecological risk assessment of heavy metals in sediment and human health risk assessment of heavy metals in fish in the middle and lower reaches of the Yangtze River basin. Environ. Pollut. 2011, 159, 2575–2585. [Google Scholar] [CrossRef] [PubMed]
  55. Wang, L.; Chen, F.; Ma, Q.L.; Yao, L.A.; Xu, Z.C.; Zhao, X.M.; Liang, R.C. Heavy metal pollution and health risk assessment of fish in Hizhou Section of the Dongjiang River. J. Ecol. Rural Environ. 2017, 33, 70–76. (In Chinese) [Google Scholar]
  56. Kim, K.H.; Kim, Y.J.; Heu, M.S.; Kim, J.S. Contamination and risk assessment of Lead and Cadmium in commonly consumed fish as affected by habitat. Korean J. Fish. Aquat. Sci. 2016, 49, 541–555. [Google Scholar]
  57. Raknuzzaman, M.; Ahamed, M.K.; Islam, M.; Habibullah-Al-Mamun, M.; Tokumura, M.; Sekine, M.; Masunaga, S. Trace metal contamination in commercial fish and crustaceans collected from coastal area of Bangladesh and health risk assessment. Environ. Sci. Pollut. Res. 2016, 23, 17298–17310. [Google Scholar] [CrossRef] [PubMed]
  58. Low, K.H.; Zain, S.M.; Abas, M.R.; Salleh, K.M.; Teo, Y.Y. Distribution and health risk assessment of trace metals in freshwater tilapia from three different aquaculture sites in Jelebu Region (Malaysia). Food Chem. 2015, 177, 390–396. [Google Scholar] [CrossRef] [PubMed]
  59. Mok, J.S.; Shim, K.B.; Lee, T.S.; Song, K.C.; Lee, K.J.; Kim, S.G.; Kim, J.H. Heavy metal contents in wild and cultured fish from the Korean Coasts. Korean J. Fish. Aquat. Sci. 2009, 42, 561–568. (In Korean) [Google Scholar]
  60. Jayaprakash, M.; Kumar, R.S.; Giridharan, L.; Sujitha, S.B.; Sarkar, S.K.; Jonathan, M.P. Bioaccumulation of metals in fish species from water and sediments in macrotidal Ennore creek, Chennai, SE coast of India: A metropolitan city effect. Ecotoxicol. Environ. Saf. 2015, 120, 243–255. [Google Scholar] [CrossRef] [PubMed]
  61. Dhanakumar, S.; Solaraj, G.; Mohanraj, R. Heavy metal partitioning in sediments and bioaccumulation in commercial fish species of three major reservoirs of river Cauvery delta region, India. Ecotoxicol. Environ. Saf. 2015, 113, 145–151. [Google Scholar] [CrossRef] [PubMed]
  62. Mazej, Z.; Sayegh-Petkovsek, S.A.; Pokorny, B. Heavy metal concentrations in food chain of Lake velenjsko jezero, Slovenia: An artificial lake from mining. Arch. Environ. Contam. Toxicol. 2010, 58, 998–1007. [Google Scholar] [CrossRef] [PubMed]
  63. Lu, W.Y.; Li, J.; Xue, M.M.; Yang, M.X.; Liu, J.Y. Accumulation and migration regularity of heavy metals in plankton and aristichthys nobilis. Food Mach. 2016, 3, 96–100. (In Chinese) [Google Scholar]
  64. Joint Food and Agriculture Organization/World Health Organization Expert Committee on Food Additives (JECFA). Evaluation of Certain Food Additives and Contaminants; Fifty-Third Report of the Joint FAO/WHO Expert Committee on Food Additives; WHO Technical Report Series, No. 896; World Health Organization: Geneva, Switzerland, 1993. [Google Scholar]
Figure 1. Heavy metals and metalloid concentration (mg/kg wet wt) distribution proportion in muscle and mixed edible tissues of cultured fish (a) and wild fish (b).
Ijerph 15 00334 g001
Figure 2. Heavy metals and metalloid concentration (mg/kg wet wt) distribution proportion in different tissues of cultured fish (a) and wild fish (b).
Ijerph 15 00334 g002
Figure 3. Calculation results of health risks of wild and cultured fish (a) through fish consumption based on target hazard quotients (b), carcinogenic risk (c) and estimated weekly intake (d).
Ijerph 15 00334 g003aIjerph 15 00334 g003b
Figure 4. Calculation results of health risks through cultured, wild and mixed (wild:cultured = 1:1) fish muscle and mixed edible tissue consumption based on THQ (a), CR (b) and EWI (c).
Ijerph 15 00334 g004
Table 1. Single and multi factor pollution indexes of trace elements in cultured fish muscle.
Fish SpeciesPiMPI
AsCdCrCuPbZn
Crucian carp0.00000.00000.09570.01360.25180.27880.0977
Grass carp0.00000.00000.18840.02040.56880.47860.1798
Carp0.00000.02600.05130.01140.19000.64780.0921
Catfish0.00000.07200.07050.01330.93160.29760.1269
MPI: multi factor pollution index.
Table 2. Trace element concentrations in cultured and wild fish muscles (mg/kg).
Fish SpeciesAsCdCrCuPbZn
CulturedCrucian carp0.00000.00000.19130.67970.125913.94
Grass carp0.00000.00000.37671.0180.284423.93
Mean0.00000.00000.28400.84890.205218.94
WildCrucian carp0.00000.00873.3570.38290.093815.31
Grass carp0.00000.00320.53690.45020.011117.29
Mean0.00000.00601.9470.41660.052516.30
LOD *0.0010.0010.0010.020.010.1
Chinese standard [51,52]0.10.12.0500.550
* LOD: Limit of Detection.
Table 3. Trace element concentrations in fish muscles of typical areas (mg/kg; wet wt).
SpeciesNationLake/RiverAsCdCrCuPbZnReference
WildChinaHonghu Lake0.00000.00601.9470.41660.052516.30This study
Cultured0.00000.00000.28400.84890.205218.94
WildChinaPoyang Lake0.02750.00450.25100.41650.05057.785[30]
Taihu Lake0.63000.47401.18201.11605.814081.3[53]
Yangtze River0.01450.11200.17500.98000.57006.800[54]
0.56400.16050.62551.38751.486535.57[53]
CulturedChinaHuizhou--0.15920.15200.06065.140[55]
Korea--0.033--0.069-[56]
Bangladesh-0.3320.0170.193-0.593-[57]
Malaysia-0.79670.0297-0.210.01373.7[58]
WildKorea--0.00000.101.150.00006.18[59]
Cultured--0.00000.510.960.00006.92
WildAegean Sea--0.110.371.310.4814.38[28]
Cultured--0.050.330.560.457.53
Table 4. Calculation results of target hazard quotients (THQ), carcinogenic risk (CR) and estimated weekly intake (EWI) from cultured and wild fish consumption.
Trace ElementsAsCdCrCuPbZn
CulturedMuscleMean concentration (mg/kg)000.2840.84890.205118.94
Mixed tissues00.01240.18312.4300.115442.63
WildMuscle00.00601.9470.41660.052516.30
Mixed tissues0.01260.04750.7111.7060.180948.68
RFD 1 (mg/kg/day)0.00030.0011.50.040.0040.3
CulturedMuscleTHQ000.00020.01790.04340.0534
Mixed tissues00.01050.00010.05140.02440.1202
WildMuscle00.00500.00110.00880.01110.0459
Mixed tissues0.03550.04020.00040.03610.03820.1372
CulturedMuscleCR0---1.47 × 10⁻⁶-
Mixed tissues0---8.30 × 10⁻⁷-
WildMuscle0---3.77 × 10⁻⁷-
Mixed tissues1.60 × 10−5---1.30 × 10⁻⁶-
PTWI 2 (µg/kg)157153500257000
CulturedMuscleEWI (µg/kg)001.7545.2411.267117
Mixed tissues00.07681.13115.010.7124263
WildMuscle00.036812.022.5720.3238101
Mixed tissues0.07780.29334.39010.531.117301
CulturedMuscleEWI/PTWI0011.69%0.15%5.07%1.67%
Mixed tissues01.10%7.54%0.43%2.85%3.76%
WildMuscle00.53%80.13%0.07%1.30%1.44%
Mixed tissues0.52%4.19%29.26%0.30%4.47%4.29%
1 RFD values referenced from USEPA, 2010 [39]; 2 PTWI values referenced from FAO, 2006 [64].
Table 5. Calculation results of food daily consumption (FIR) limitation based on THQ, CR and EWI.
Food Ingestion Rate (FIR) Limitation (g/day)AsCdCrCuPbZn
Based on target hazard quotients (THQ)
Cultured fishMuscle//339,296302712531018
Mixed tissues/5162526,22510572227452
Wild fishMuscle/10,70749,497616848941183
Mixed tissues15291352135,52715061420396
Based on carcinogenic risk (CR)
Cultured fishMuscle////3684/
Mixed tissues////6550/
Wild fishMuscle////14,396/
Mixed tissues340///4178/
Based on estimated weekly intake (EWI)
Cultured fishMuscle//46536,28410723253
Mixed tissues/495072112,67319071445
Wild fishMuscle/10,2676873,93241903780
Mixed tissues10,475129718618,05212161265

