Analysis of Health Behaviors and Personal Values of Childless Women, Pregnant Women and Women Who Recently Delivered

 ,
,  ,
,
Abstract
:1. Introduction
2. Materials and Methods
2.1. Study Design
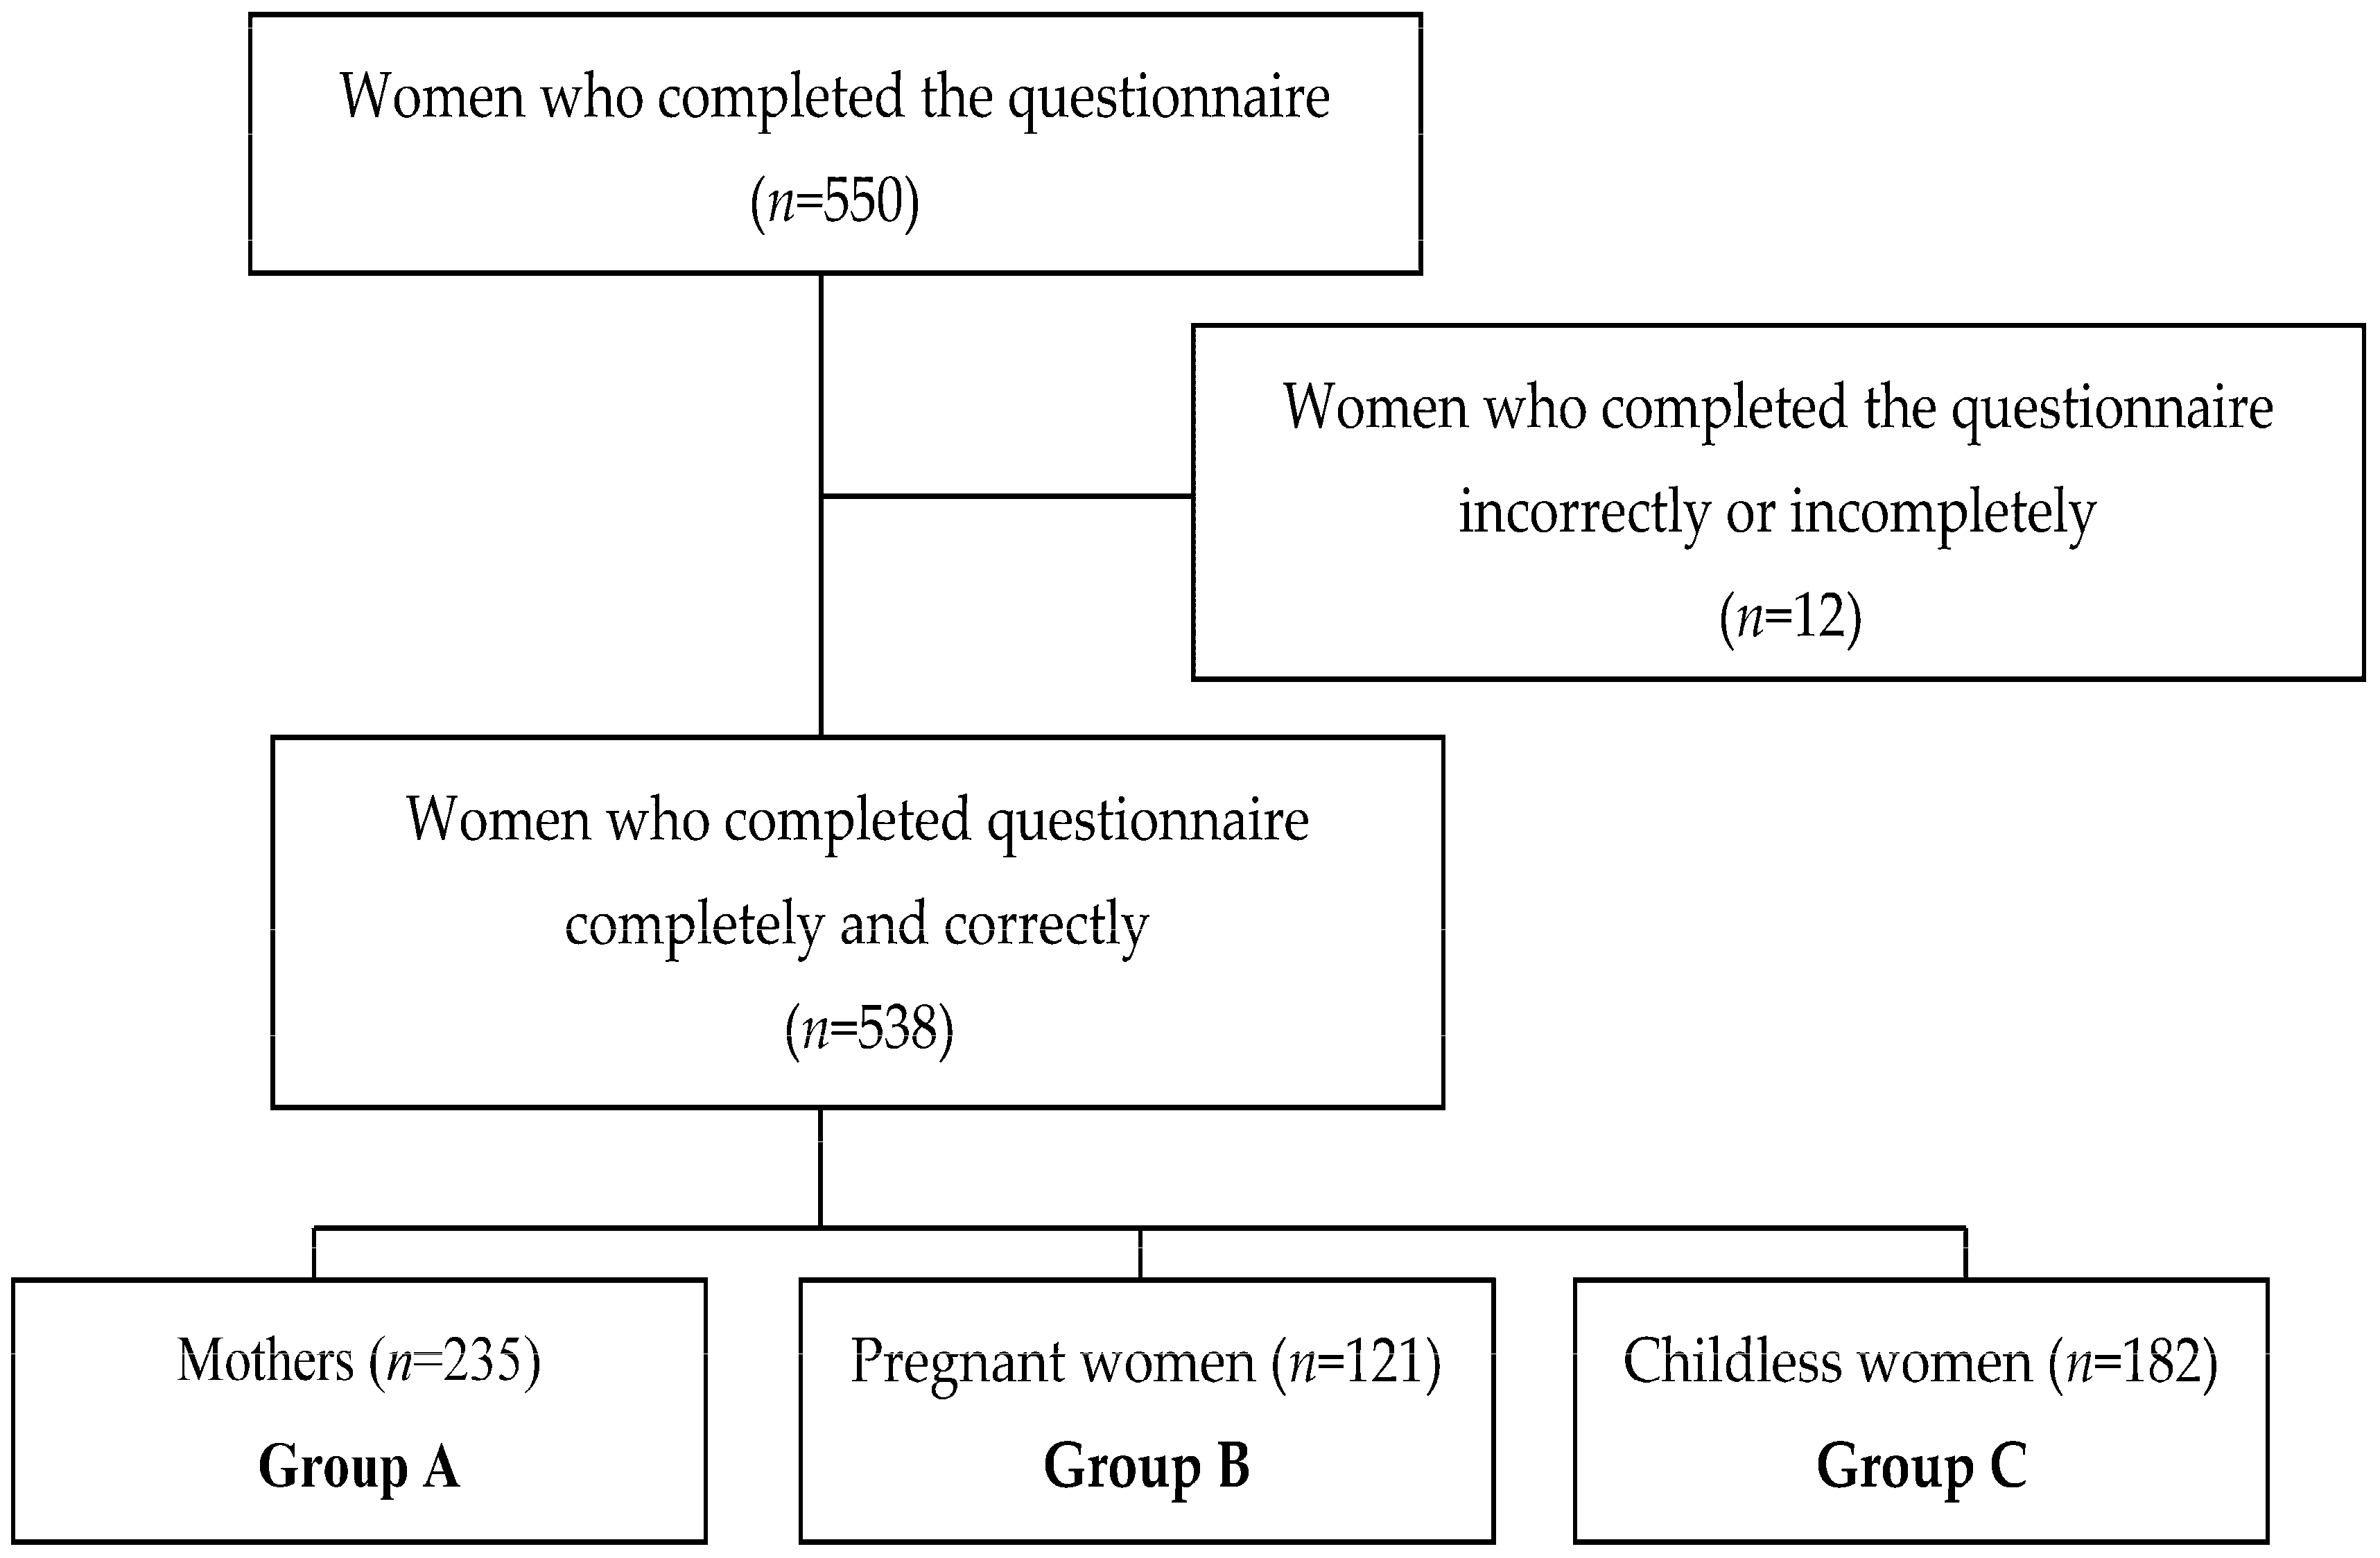
2.2. Participants
2.3. Ethics Approval
2.4. Questionnaires
- Health Behavior Inventory (HBI) is a self-assessment tool that consists of 24 statements defining different health behaviors. In this inventory, an appropriate numeric value was assigned for each test item depending on how the data applied to a given respondent. These values were coded as 1, “almost never”; 2, “rarely”; 3, “from time to time”; 4, “often”; and 5, “almost always”. HBI also allows evaluation of subscales of health behaviors in four categories called “healthy dietary habits”; it also includes data on the type of food consumed. The evaluated factors included frequency of consumption of whole meal bread, fruit and vegetables, salt, and avoidance of eating food containing preservatives, “prophylactics”, or behaviors related to disease prevention, i.e., compliance with health recommendations, regular medical examinations and medical information. Next, two evaluated subscales included “health practices”, meaning everyday behaviors associated with the appropriate amount of sleep, exercise, monitoring of body weight or past times, and a “positive mental attitude”, which meant “avoidance of excessively strong emotions”, “stress” or “situations that can cause depression”. The overall result of the questionnaire, called “the index of health behaviors”, consists of a value ranging from 24 to 120 points. In general, the higher the score on this index, the higher the number of positive health behaviors. The values on this index are further subdivided into “low”, “medium” or “high” scores [40].
- Personal Value List (PVL) was used to estimate the value that is attributed to “health” in relation to other values and personal interests important to an individual. This research tool consists of two parts: the first part includes nine symbols of happiness, defining different forms of human values, whereas the other lists 10 personal values which are rated. Respondents had to select only five out of nine symbols that were most important for them and were asked to assign the values a score from five points (the most important) to one point (the least important) for each chosen symbol. Following this selection, participants were asked to assign scores to 10 personal values, according to the above described rules. Symbols of happiness and personal values, which were not selected, were given a value of “0”. Ranks assigned by the respondent to “health” reflected the value given in this category in comparison with other values and personal properties [40].
- Questionnaire collecting data about the respondents: a separate sheet of paper was prepared for responders’ socio-demographic data, such as age, place of residence, education, occupational status, marital status and material situation. Additionally, women who had recently delivered were asked to provide the number of children they had, whereas, mothers and pregnant women provided their preferred number of children, and childless women provided indicate the reasons behind not wanting children.
2.5. Statistical Analysis
3. Results
3.1. Participants’ Characteristics
3.2. Health Behavior of Women (HBI)
3.3. Symbols of Happiness and Personal Values in the Studied Groups (PVL)
3.4. Relationship between Personal Values (PVL) and Health Behaviours (HBI) of Examined Women
4. Discussion
Study Limitations
5. Conclusions
Author Contributions
Conflicts of Interest
References
- Bidmon, S.; Terlutter, R. Gender differences in searching for health information on the Internet and the virtual patient-physician relationship in Germany: Exploratory results on how men and women differ and why. J. Med. Internet Res. 2015, 17, e156. [Google Scholar] [CrossRef] [PubMed]
- Gillen, M. Associations between positive body image and indicators of men’s and women’s mental and physical health. Body Image 2015, 13, 67–74. [Google Scholar] [CrossRef] [PubMed]
- Jankowski, G.S.; Diedrichs, P.C.; Halliwell, E. Can appearance conversations explain differences between gay and heterosexual men’s body dissatisfaction? Psychol. Men Masc. 2013, 15, 68–77. [Google Scholar] [CrossRef]
- World Health Organization. Environment and Health Risks: A Review of the Influence and Effects of Social Inequalities; World Health Organization: Geneva, Switzerland, 2010. [Google Scholar]
- Królikowska, S. The role of gender stereotypes in shaping men’s and women’s attitudes towards health. Now. Lek. 2011, 80, 387–393. [Google Scholar]
- Binkowska-Bury, M.; Iwanowicz-Palus, G.; Kruk, W.; Perenc, L.; Mazur, A.; Filip, R.; Januszewicz, P. Pro-health behaviours—A sense of coherence as the key to a healthy lifestyle in rural areas? Ann. Agric. Environ. Med. 2016, 23, 345–349. [Google Scholar] [CrossRef] [PubMed]
- Keyes, K.M.; Grant, B.F.; Hasin, D.S. Evidence for a closing gender gap in alcohol use, abuse, and dependence in the United States population. Drug Alcohol Depend. 2008, 93, 21–29. [Google Scholar] [CrossRef] [PubMed]
- Lyons, A.C.; Willott, S.A. Alcohol consumption, gender identities, and women’s changing social position. Sex Roles 2008, 59, 649–712. [Google Scholar] [CrossRef]
- Hutton, F.C. ‘Up for it, mad for it?’ Women, drug use, and participation in club scenes. Health Risk Soc. 2004, 6, 223–237. [Google Scholar] [CrossRef]
- Toll, B.A.; Ling, P.M. The Virginia Slims identity crisis: An inside look at tobacco industry marketing to women. Tob. Control 2005, 14, 172–180. [Google Scholar] [CrossRef] [PubMed]
- Sygit-Kowalkowska, E. The health behaviour of people in late adulthood—Sociodemographic correlations and differences between social environments. Ann. Acad. Med. Stetin. 2013, 59, 103–113. [Google Scholar] [PubMed]
- Ślusarska, B.; Nowicki, G. Health behaviours in prophylaxis of cardiovascular diseases among occupationally active population. Probl. Hig. Epidemiol. 2010, 91, 34–40. [Google Scholar]
- Cebulska, V.; Koźlak, V.; Rzempowska, J.; Jerzyk-Raibiś, M. Level of knowledge and skills of middle-aged women in the field of health self-assessment. Hygeia Public Health 2011, 46, 372–375. [Google Scholar]
- Lazzarino, A.I.; Yiengprugsawan, V.; Seubsman, S.A.; Steptoe, A.; Sleigh, A.C. The associations between unhealthy behaviours, mental stress, and low socio-economic status in an international comparison of representative samples from Thailand and England. Glob. Health 2014, 10, 10. [Google Scholar] [CrossRef] [PubMed]
- De Morais Sato, P.; Unsain, P.F.; Gittelsohn, J.; Sanches Tavares da Silva, J.G.; Gonçalves Perez, I.C.; Baeza Scagliusi, F. Strategies used by overweight and obese low-income mothers to feed their families in urban Brazil. Appetite 2017, 111, 63–70. [Google Scholar] [CrossRef] [PubMed]
- Huffman, S.; Szafron, M. Social correlates of leisure-time sedentary behaviours in Canadian adults. Prev. Med. Rap. 2017, 20, 268–274. [Google Scholar] [CrossRef] [PubMed]
- Veromaa, V.; Kautiainen, H.; Saxen, U.; Malmberg-Ceder, K.; Bergman, E.; Korhonen, P.E. Ideal cardiovascular health and psychosocial risk factors among Finnish female municipal workers. Scand. J. Public Health 2017, 45, 50–56. [Google Scholar] [CrossRef] [PubMed]
- Segar, M.L.; Eccles, J.S.; Richardson, C.R. Rebranding exercise: Closing the gap between values and behavior. Int. J. Behav. Nutr. Phis. Act. 2011, 8, 94. [Google Scholar] [CrossRef] [PubMed]
- Borkowski, N. Organizational Behavior in Health Care; Jonas & Bartlett Publishers: Sudbury, MA, USA, 2016. [Google Scholar]
- Kane, S.; Kok, M.; Rial, M.; Matere, A.; Dieleman, M.; Broerse, J.E. Social norms and family planning decisions in South Sudan. BMC Public Health 2016, 16, 1183. [Google Scholar] [CrossRef] [PubMed]
- Tanturri, M.L.; Mills, M.; Rotkirch, A.; Sobotka, T.; Takács, J.; Miettinen, A.; Faludi, C.; Kantsa, V.; Nasiri, D. State-of-the-Art-Report, Childessness in Europe. Families and Societies, 2015. Available online: http://www.familiesandsocieties.eu/wp-content/uploads/2015/03/WP32TanturriEtAl2015.pdf (accessed on 20 November 2017).
- Malina, A.; Błaszkiewicz, A.; Owczarz, U. Psychosocial aspects of infertility and its treatment. Ginekol. Pol. 2016, 87, 527–531. [Google Scholar] [CrossRef] [PubMed]
- Gouveia, V.V.; Milfont, T.L.; Guerra, V.M. The functional theory of human values: From intentional overlook to first acknowledgement—A reply to Schwartz. Pers. Individ. Dif. 2014, 68, 250–253. [Google Scholar] [CrossRef]
- Olver, J.M.; Mooradian, T.A. Personality traits and personal values: A conceptual and empirical integration. Pers. Individ. Dif. 2003, 35, 109–125. [Google Scholar] [CrossRef]
- Schwartz, S. Universals in the content and structure of values. Theory and empirical tests in 20 countries. In Advances in Experimental Social Psychology; Zanna, M., Ed.; Academic Press: New York, NY, USA, 1992; p. 4. [Google Scholar]
- Lopes, G.S.; Barbaro, N.; Sela, Y.; Jeffery, A.J.; Pham, M.N.; Shackelford, T.K.; Zeigler-Hill, V. Endorsement of social and personal values predicts the desirability of men and women as long-term partners. Evol. Psychol. 2017. [Google Scholar] [CrossRef] [PubMed]
- Francescato, D.; Mebane, M.E.; Vecchione, M. Gender differences in personal values of national and local Italian politicians, activists and voters. Int. J. Psychol. 2017, 52, 406–414. [Google Scholar] [CrossRef] [PubMed]
- Worsley, A.; Wang, W.C.; Hunter, W. Baby boomers’ food shopping habits. Relationships with demographics and personal values. Appetite 2010, 55, 466–472. [Google Scholar] [CrossRef] [PubMed]
- Wang, W.C.; Worsley, A.; Hunter, W. Similar but different. Health behaviour pathways differ between men and women. Appetite 2012, 58, 760–766. [Google Scholar] [CrossRef] [PubMed]
- Public Opinion Research Center (CBOS). Values and Standards. Available online: http://www.cbos.pl/SPISKOM.POL/2013/K_111_13.PDF (accessed on 18 January 2018).
- Public Opinion Research Center (CBOS). Family Relationships. Message from Research. Available online: http://www.cbos.pl/SPISKOM.POL/2008/K_004_08.PDF (accessed on 18 January 2018).
- Lin, Y.H.; Tsai, E.M.; Chan, T.F.; Chou, F.H.; Lin, Y.L. Health promoting lifestyles and related factors in pregnant women. Chang Gung Med. J. 2009, 32, 650–661. [Google Scholar] [PubMed]
- Thaewpia, S.; Clark, M.J.; Howland, L.C.; James, K.S. Factors predicting health promoting behaviors among older pregnant Thais. Pac. Rim Int. J. Nurs. Res. 2012, 16, 113–123. [Google Scholar]
- Lathrop, B. A systematic review comparing group prenatal care to traditional prenatal care. Nurs. Women’s Health 2013, 17, 118–130. [Google Scholar] [CrossRef] [PubMed]
- Wilkinson, S.A.; Miller, Y.D. Improving health behaviours during pregnancy: A new direction for the pregnancy handheld record. Aust. N. Z. J. Obstet. Gynaecol. 2007, 47, 464–467. [Google Scholar] [CrossRef] [PubMed]
- Benediktsson, I.; McDonald, S.W.; Vekved, M.; McNeil, D.A.; Dolan, S.M.; Tough, S.C. Comparing Centering Pregnancy® to standard prenatal care plus prenatal education. BMC Pregnancy Childbirth 2013, 13 (Suppl. 1), S5. [Google Scholar] [PubMed]
- Sheeder, J.; Weber Yorga, K.; Kabir-Greher, K. A review of prenatal group care literature: The need for a structured theoretical framework and systematic evaluation. Matern. Child Health J. 2012, 16, 177–187. [Google Scholar] [CrossRef] [PubMed]
- Reberte, L.M.; Hoga, L.A.; Gomes, A.L. Process of construction of an educational booklet for health promotion of pregnant women. Rev. Lat. Am. Enfermagem 2012, 20, 101–108. [Google Scholar] [CrossRef] [PubMed]
- Central Statistical Office (GUS). Population in Poland. Size and Structure by Territorial Division as of 30 June 2012. Available online: https://stat.gov.pl/cps/rde/xbcr/gus/l_ludnosc_stan_struktura_30062012.pdf (accessed on 18 January 2018).
- Juczyński, Z. Measurement Tool in Health Promotion and Psychology, 2nd ed.; Laboratory of Psychological Tests: Warsaw, Poland, 2012. [Google Scholar]
- Cisek, M.; Gniadek, A.; Richter, B.; Chmiel, I. Socio-cultural factors of health behaviour within a family. Ann. UMCS Sect. D Med. 2004, 59, 359–363. [Google Scholar]
- Świerzewska, P.; Kosiński, M.; Wójcik, M.; Dworacka, M.; Cypryk, K. Family, anthropometric and biochemical factors affecting birth weight of infants born to GDM women. Ginekol. Pol. 2015, 86, 499–503. [Google Scholar] [CrossRef] [PubMed]
- Kaczyńska-Witkowska, A.; Kopeć, D.; Nowak, Z. Health-related behavior and health attitudes among physically active women. Rozprawy Naukowe AWF We Wrocławiu 2013, 43, 22–28. [Google Scholar]
- Weber-Rajek, M.; Lubomska, M.; Radzimińska, A.; Lulińska-Kuklik, E.; Goch, A.; Żukow, W. The health behavior of women during menopausal period. J. Educ. Health Sport 2016, 6, 151–162. [Google Scholar]
- Borrell, C.; Palencia, L.; Muntaner, C.; Urquía, M.; Malmusi, D.; O’Campo, P. Influence of macrosocial policies on women’s health and gender inequalities in health. Epidemiol. Rev. 2014, 36, 31–48. [Google Scholar] [CrossRef] [PubMed]
- Nowicki, A.; Borowa, I.; Maruszak, M. Women health behaviours regarding prevention and early detection of precancerous lesions and cervical carcinoma. Ginekol. Pol. 2008, 79, 840–849. [Google Scholar] [PubMed]
- Anderson, C.; Sandler, D.P.; Weinberg, C.R.; Houck, K.; Chunduri, M.; Hodgson, M.E.; Sabatino, S.A.; White, M.C.; Rodriguez, J.L.; Nichols, H.B. Age- and treatment-related associations with health behavior change among breast cancer survivors. Brest 2017, 33, 1–7. [Google Scholar] [CrossRef] [PubMed]
- Thomson, C.A.; McCullough, M.L.; Wertheim, B.C.; Chlebowski, R.T.; Martinez, M.E.; Stefanick, M.L.; Rohan, T.E.; Mnsoan, J.E.; Tindle, H.A.; Ockene, J.; et al. Nutrition and physical activity cancer prevention guidelines, cancer risk, and mortality in the women’s health initiative. Cancer Prev. Res. 2014, 7, 42–53. [Google Scholar] [CrossRef] [PubMed]
- Brzozowska, A.; Duma, D.; Mazurkiewicz, T.; Brzozowski, W.; Mazurkiewicz, M. Reasons for delay in treatment of breast cancer detected due to breast self-examination in women from the Lubelskie Region. Ginekol. Pol. 2014, 85, 14–17. [Google Scholar] [CrossRef] [PubMed]
- Młynarska, M.; Nowicki, G.; Rudnicka-Drożak, E.; Zagaja, A.; Misztal-Okońska, P.; Dyndur, J.; Majcher, P. Health behaviors of people over 65 years of age and their socio-demographic factors. Gerontol. Pol. 2015, 4, 165–200. [Google Scholar]
- Bojar, I.; Humeniuk, E.; Wdowiak, L.; Miotła, P.; Warchoł-Skarbek, E.; Włoch, K. Nutritional behaviours of pregnant women. Probl. Hig. Epidemiol. 2007, 88, 74–75. [Google Scholar]
- Wierzejska, R.; Jarosz, M.; Sawicki, W.; Stelmach, J.; Siuba, M. Risky health attitudes of pregnant women. Smoking, alcohol, caffeine. Żyw. Człow. 2011, 38, 84–98. [Google Scholar]
- Pohjanheimo, T.; Passovaara, R.; Lucomala, H.; Sandell, M. Food choice motives and bread liking of consumers embracing hedonistic and traditional value. Appetite 2010, 54, 170–180. [Google Scholar] [CrossRef] [PubMed]
- Duncan, L.R.; Hall, C.R.; Wilson, P.M.; Janny, O. Exercise motivation: A cross-sectional analysis examining its relationships with frequency, intensity, and duration of exercise. Int. J. Behav. Nutr. Phys. Act. 2010, 7, 7. [Google Scholar] [CrossRef] [PubMed]
- Ślusarska, B.; Barczak, S.; Zarzycka, D.; Dobrowolska, B.; Cuber, T. The importance of personal values and symbols of happiness among vocationally active nurses. Probl. Pielęg. 2011, 19, 219–227. [Google Scholar]
- Derkacz, M.; Chmiel-Perzyńska, I.; Grywalska, E.; Nowakowski, A. Health as a value for diabetic patients. Curr. Probl. Psychiatry 2011, 12, 576–577. [Google Scholar]
- Rasińska, R.; Nowakowska, I. The perception of health for nurses in their fourties. Pielęg. Pol. 2014, 2, 111–116. [Google Scholar]
- Rudnicka-Drożak, E.; Krawczyk, W.; Młynarska, M.; Misztal, P. Health as a value declared and realized by the citizens of Lublin Voivodeship. In Selected Medical Problems of the 21st Century Man; Juszczyk, M., Wysokiński, M., Eds.; Wydawnictwo Wyższej Szkoły Ekonomii i Prawa im. prof. Edwarda Lipińskiego w Kielcach: Kielce, Poland, 2012; pp. 83–97. ISBN 978-83-60056-75-2. [Google Scholar]


| Variable | Group A (n = 235) | Group B (n = 121) | Group C (n = 182) |
|---|---|---|---|
| Age, years: | 28.9 ± 4.3 | 28.7 ± 3.7 | 28.3 ± 4.5 |
| <26 years | 69 (29.36) | 34 (28.10) | 62 (34.07) |
| 27–30 years | 76 (32.34) | 54 (44.63) | 60 (32.97) |
| >31 years | 90 (38.30) | 33 (27.27) | 60 (32.97) |
| Place of residence: | |||
| City > 20.000 | 139 (59.15) | 94 (77.69) | 116 (63.74) |
| City < 20.000 | 47 (20.0) | 10 (8.26) | 33 (18.13) |
| Countryside | 49 (20.85) | 17 (14.05) | 33 (18.13) |
| Education: | |||
| Primary | 0 (0.0) | 1 (0.83) | 1 (0.55) |
| Vocation | 16 (6.81) | 1 (0.83) | 1 (0.55) |
| High school | 63 (26.81) | 8 (6.61) | 34 (18.68) |
| Partial high school education | 37 (15.74) | 10 (8.26) | 35 (19.23) |
| University | 119 (50.64) | 101 (83.47) | 111 (60.99) |
| Employment status: | |||
| White-collar worker | 111 (47.23) | 90 (74.38) | 94 (51.65) |
| Manual-laborer | 47 (20.0) | 17 (14.05) | 44 (24.18) |
| Physical and white-collar worker | 9 (3.83) | 7 (5.79) | 11 (6.04) |
| Student | 19 (8.09) | 3 (2.48) | 22 (12.09) |
| Unemployed | 49 (20.85) | 4 (3.31) | 11 (6.04) |
| Marital status | |||
| Single | 13 (5.53) | 7 (5.79) | 98 (53.85) |
| Married | 207 (88.09) | 114 (94.21) | 77 (42.31) |
| Divorced | 15 (6.38) | 0 (0) | 7 (3.85) |
| Material situation | |||
| Very good | 17 (7.23) | 8 (6.61) | 11 (6.04) |
| Good | 96 (40.85) | 60 (49.59) | 76 (41.76) |
| Average | 100 (42.55) | 51 (42.15) | 92 (50.55) |
| Bad | 22 (9.36) | 2 (1.65) | 3 (1.65) |
| Very bad | 0 (0) | 0 (0) | 0 (0) |
| Number of children | |||
| 1 child | 147 (62.55) | - | - |
| 2 children | 74 (31.49) | - | - |
| 3 children | 11 (4.68) | - | - |
| 4 children | 3 (1.28) | - | - |
| Preferred number of children | |||
| 1 child | 18 (7.66) | 9 (7.44) | - |
| 2 children | 122 (51.91) | 72 (59.50) | - |
| 3 children | 80 (34.04) | 36 (29.75) | - |
| 4 children | 15 (6.38) | 4 (3.31) | - |
| I do not have children at the moment because * | |||
| No employment, low income | - | - | 155 (85.16) |
| Little social support | - | - | 74 (40.66) |
| Negative attitude of employers to sick leave or maternity leave due to pregnancy and postnatal leave | - | - | 78 (42.86) |
| The challenge of raising and educating children | - | - | 35 (19.23) |
| Fears associated with pregnancy and childbirth | - | - | 29 (15.93) |
| Others | - | - | 9 (4.95) |
| Group | General Indicator of HBI | Health Eating Habits | Prophylactic Behaviors | Positive Mental Attitude | Health Practices | |
|---|---|---|---|---|---|---|
| A | M ± SD | 81.93 ± 14.51 | 3.450.77 | 3.41 ±0.78 | 3.57 ± 0.73 | 3.22 ± 0.68 |
| Min–Max | 36.00–116.00 | 1.5–5.00 | 1.17–5.00 | 1.17–5.00 | 1.17–4.83 | |
| Med | 83.00 | 3.50 | 3.50 | 3.67 | 3.17 | |
| B | M ± SD | 86.13 ± 10.30 | 3.54 ± 0.60 | 3.51 ± 0.53 | 3.62 ± 0.52 | 3.68 ± 0.56 |
| Min–Max | 54.00–108.00 | 1.50–4.67 | 2.33–4.83 | 2.00–5.00 | 2.17–5.00 | |
| Med | 88.00 | 3.50 | 3.50 | 3.67 | 3.67 | |
| C | M ± SD | 82.44 ± 11.80 | 3.53 ± 0.75 | 3.43 ± 0.67 | 3.38 ± 0.69 | 3.40 ± 0.57 |
| Min–Max | 56.00–113.00 | 1.67–5.00 | 1.50–4.83 | 1.50–4.83 | 1.67–4.83 | |
| Med | 83.00 | 3.67 | 3.50 | 3.33 | 3.50 | |
| Test statistic | F = 4.64 * | F = 0.99 | F = 0.87 | F = 6.32 ** | F = 21.89 *** | |
| Intergroup differences | A–B, B–C | - | - | A–C, B–C | A–B, A–C, B–C | |
| Symbols of Happiness | Group | Mean Weight | Range (Choices in %) | |||||
|---|---|---|---|---|---|---|---|---|
| 1 | 2 | 3 | 4 | 5 | 0 | |||
| Major circle of friends | A | 1.24 | 13.62 | 11.49 | 14.04 | 5.96 | 4.25 | 50.64 |
| B | 1.16 | 13.22 | 10.74 | 15.70 | 7.44 | 0.83 | 52.07 | |
| C | 1.23 | 14.29 | 9.89 | 18.68 | 6.04 | 1.65 | 49.45 | |
| Test statistic | H = 0.185 | |||||||
| Successful family life | A | 4.60 | 2.13 | 4.68 | 3.40 | 17.45 | 69.36 | 2.98 |
| B | 4.57 | 2.48 | 0.0 | 3.31 | 18.18 | 74.38 | 1,65 | |
| C | 3.80 | 7.69 | 4.95 | 4.95 | 20.87 | 52.75 | 8.79 | |
| Test statistic | H = 23.987 *** (ID: A–C, B–C) | |||||||
| Working in a dream job/profession | A | 1.88 | 17.87 | 15.32 | 22.55 | 13.62 | 3.40 | 27.24 |
| B | 2.15 | 13.22 | 31.40 | 21.49 | 12.40 | 4.96 | 16.53 | |
| C | 2.30 | 14.84 | 28.02 | 23.63 | 16.48 | 4.39 | 12.64 | |
| Test statistic | H = 8.396 * (ID: A–C) | |||||||
| Success in education/work | A | 1.13 | 9.79 | 10.21 | 10.21 | 9.36 | 2.98 | 57.45 |
| B | 0.56 | 16.53 | 14.05 | 1.65 | 1.65 | 0.0 | 66.12 | |
| C | 1.20 | 20.34 | 8.79 | 7.15 | 5.49 | 7.69 | 50.54 | |
| Test statistic | H = 10.946 ** (ID: B–C) | |||||||
| Good health | A | 3.75 | 3.83 | 9.79 | 11.49 | 42.13 | 29.78 | 2.98 |
| B | 3.60 | 3.31 | 9.92 | 22.31 | 43.80 | 19.01 | 1.65 | |
| C | 3.64 | 3.30 | 11.53 | 14.84 | 34.07 | 31.32 | 4.94 | |
| Test statistic | H = 3.474 | |||||||
| Being needed by other people | A | 1.55 | 14.47 | 20.00 | 11.06 | 6.81 | 8.08 | 39.58 |
| B | 1.10 | 13.22 | 9.09 | 10.74 | 7.44 | 3.31 | 56.20 | |
| C | 1.50 | 8.79 | 13.19 | 20.34 | 6.59 | 5.49 | 45.60 | |
| Test statistic | H = 7.726 * (ID: A–B) | |||||||
| Good substantive condition | A | 2.18 | 13.62 | 12.77 | 25.53 | 14.89 | 8.51 | 24.68 |
| B | 1.83 | 25.62 | 18.18 | 19.84 | 13.22 | 1.65 | 21.49 | |
| C | 1.35 | 18.13 | 15.38 | 9.89 | 12.09 | 1.65 | 42.86 | |
| Test statistic | H = 27.432 *** (ID: A–C, B–C) | |||||||
| Adventurous life | A | 0.69 | 16.17 | 5.96 | 8.51 | 3.40 | 0.43 | 65.53 |
| B | 0.31 | 9.92 | 2.48 | 2.48 | 0.0 | 1.65 | 83.47 | |
| C | 0.57 | 8.79 | 7.14 | 1.65 | 1.65 | 4.40 | 76.37 | |
| Test statistic | H = 14.215 *** (ID: A–B) | |||||||
| Fame, popularity | A | 0.22 | 6.81 | 3.40 | 0.85 | 0.43 | 0.85 | 87.66 |
| B | 0.02 | 1.65 | 0.0 | 0.0 | 0.0 | 0.0 | 98.35 | |
| C | 0.13 | 1.10 | 1.65 | 2.20 | 0.55 | 0.0 | 94.50 | |
| Test statistic | H = 14.443 *** (ID: A–B) | |||||||
| Personal Values | Group | Mean Weight | Range (Choices in %) | |||||
|---|---|---|---|---|---|---|---|---|
| 1 | 2 | 3 | 1 | 5 | 0 | |||
| Love and friendship | A | 4.29 | 4.68 | 2.13 | 3.41 | 19.57 | 66.38 | 3.83 |
| B | 4.58 | 2.48 | 0.83 | 3.31 | 14.87 | 76.86 | 1.65 | |
| C | 4.03 | 3.85 | 1.10 | 6.04 | 21.98 | 58.24 | 8.79 | |
| Test statistic | H = 12.662 ** (ID: B–C) | |||||||
| Good health, physical and mental efficiency | A | 3.79 | 2.55 | 5.11 | 8.08 | 45.11 | 32.34 | 6.81 |
| B | 3.97 | 0.0 | 4.96 | 8.26 | 63.64 | 21.49 | 1.65 | |
| C | 3.70 | 4.95 | 6.59 | 9.89 | 37.91 | 34.07 | 6.59 | |
| Test statistic | H = 0.228 | |||||||
| Sense of humor, wit | A | 1.00 | 9.79 | 5.53 | 14.89 | 6.39 | 1.70 | 61.70 |
| B | 0.55 | 15.71 | 6.61 | 6.61 | 1.65 | 0.0 | 69.42 | |
| C | 1.04 | 17.03 | 6.59 | 10.44 | 7.15 | 2.75 | 56.04 | |
| Test statistic | H = 7.801 * (ID: A–B) | |||||||
| Intelligence, sharp mind | A | 1.80 | 8.08 | 17.87 | 24.26 | 11.07 | 3.83 | 34.89 |
| B | 1.40 | 12.40 | 19.01 | 23.14 | 4.96 | 0.0 | 40.49 | |
| C | 2.06 | 11.54 | 18.13 | 25.82 | 15.39 | 3.85 | 25.27 | |
| Test statistic | H = 13.351 *** (ID: B–C) | |||||||
| Knowledge and wisdom | A | 1.39 | 9.36 | 14.89 | 17.45 | 7.66 | 3.41 | 47.23 |
| B | 1.00 | 10.75 | 10.75 | 11.57 | 4.13 | 3.30 | 59.50 | |
| C | 1.39 | 7.14 | 15.94 | 15.38 | 9.34 | 3.30 | 48.90 | |
| Test statistic | H = 6.255 * (ID: A–B) | |||||||
| Happiness, contentment | A | 1.97 | 7.23 | 19.58 | 26.81 | 8.08 | 7.66 | 30.64 |
| B | 2.02 | 7.44 | 31.40 | 27.27 | 8.26 | 3.31 | 22.32 | |
| C | 1.74 | 13.74 | 29.67 | 14.84 | 6.59 | 6.04 | 29.12 | |
| Test statistic | H = 4.297 | |||||||
| Courage, firmness | A | 0.69 | 11.49 | 6.38 | 5.11 | 4.26 | 2.55 | 70.21 |
| B | 0.40 | 9.92 | 5.78 | 3.31 | 0.0 | 1.65 | 79.34 | |
| C | 0.62 | 7.14 | 3.30 | 2.74 | 4.40 | 4.40 | 78.02 | |
| Test statistic | H = 4.832 | |||||||
| Kindness, consideration | A | 1.21 | 17.02 | 15.32 | 7.66 | 6.81 | 4.68 | 48.51 |
| B | 0.97 | 18.18 | 9.92 | 13.22 | 1.65 | 2.48 | 54.55 | |
| C | 0.96 | 12.09 | 9.34 | 9.89 | 5.49 | 2.75 | 60.44 | |
| Test statistic | H = 4.831 | |||||||
| Fine appearance, presence | A | 0.46 | 6.81 | 2.55 | 3.40 | 1.28 | 3.83 | 82.13 |
| B | 0.14 | 7.44 | 0.83 | 1.65 | 0.0 | 0.0 | 90.08 | |
| C | 0.38 | 6.59 | 5.49 | 4.40 | 1.10 | 0.55 | 81.87 | |
| Test statistic | H = 5.296 | |||||||
| Wealth, fortune | A | 0.63 | 11.06 | 5.11 | 5.53 | 4.26 | 1.70 | 72.34 |
| B | 0.50 | 13.22 | 7.43 | 4.96 | 0.83 | 0.83 | 72.73 | |
| C | 0.45 | 8.24 | 3.84 | 4.95 | 2.20 | 1.10 | 79.67 | |
| Test statistic | H = 3.168 | |||||||
| Symbols of Happiness | Group | Health Behaviors | |||||||||
|---|---|---|---|---|---|---|---|---|---|---|---|
| General Indicator of HBI | Health Eating Habits | Prophylactic Behaviors | Positive Mental Attitude | Health Practices | |||||||
| b(SE) | b A(SE) | b(SE) | b A(SE) | b(SE) | b A(SE) | b(SE) | b A(SE) | b(SE) | b A(SE) | ||
| Major circle of friends | A | 0.26(0.62) | 0.27(0.63) | 0.01(0.03) | −0.03(0.02) | −0.009(0.03) | −0.02(0.02) | 0.02(0.03) | 0.01(0.03) | 0.03(0.03) | 0.02(0.03) |
| B | −1.68(0.64) ** | −2.17(0.66) ** | −0.11(0.04) ** | −0.14(0.04) ** | −0.02(0.03) | −0.03(0.03) | −0.07(0.03) * | −0.10(0.03) ** | −0.08(0.04) * | −0.07(0.04) * | |
| C | −0.44(0.60) | −0.51(0.59) | −0.04(0.04) | −0.04(0.04) | −0.03(0.03) | −0.04(0.03) | 0.01(0.04) | 0.02(0.03) | −0.01(0.03) | −0.02(0.03) | |
| Successful family life | A | 0.07(0.27) | 0.03(0.27) | 0.01(0.01) | 0.01(0.01) | −0.007(0.01) | −0.01(0.01) | −0.003(0.01) | −0.004(0.01) | 0.01(0.01) | 0.004(0.01) |
| B | −0.11(0.97) | −0.15(1.04) | 0.06(0.06) | 0.06(0.06) | −0.004(0.05) | −0.03(0.05) | −0.006(0.05) | −0.01(0.05) | −0.07(0.05) | −0.04(0.06) | |
| C | 0.81(0.52) | 0.86(0.53) | 0.03(0.03) | 0.03(0.03) | 0.02(0.03) | 0.03(0.03) | 0.09(0.03) ** | 0.07(0.03) ** | −0.001(0.02) | 0.008(0.03) | |
| Working in a dream job/profession | A | −0.32(0.62) | −0.33(0.62) | −0.004(0.03) | −0.009(0.03) | 0.004(0.03) | 0.003(0.03) | −0.03(0.03) | −0.03(0.03) | −0.02(0.03) | −0.02(0.03) |
| B | 0.19(0.68) | 0.39(0.68) | −0.01(0.04) | −0.004(0.04) | −0.007(0.03) | 0.007(0.03) | −0.03(0.03) | −0.02(0.03) | 0.08(0.04) * | 0.08(0.04) * | |
| C | −0.15(0.64) | −0.73(0.64) | 0.04(0.04) | 0.02(0.04) | −0.005(0.04) | −0.04(0.03) | −0.03(0.04) | −0.06(0.04) | −0.03(0.03) | −0.04(0.03) | |
| Success in education/work | A | 0.15(0.61) | 0.11(0.62) | −0.04(0.03) | −0.03(0.03) | 0.05(0.03) | 0.04(0.03) | 0.02(0.03) | 0.01(0.03) | 0.001(0.03) | −0.004(0.03) |
| B | −0.34(1.03) | −0.14(1.05) | −0.004(0.06) | 0.02(0.06) | 0.04(0.05) | 0.07(0.05) | −0.04(0.05) | −0.03(0.05) | −0.07(0.06) | −0.08(0.06) | |
| C | −0.68(0.54) | −0.56(0.53) | −0.005(0.03) | −0.00001(0.03) | −0.01(0.03) | −0.007(0.03) | −0.03(0.03) | −0.02(0.03) | −0.07(0.03) * | −0.07(0.03) * | |
| Good health | A | 2.05(0.75) ** | 2.22(0.75) ** | 0.12(0.04) ** | 0.12(0.04) ** | 0.13(0.04) ** | 0.13(0.04) *** | 0.04(0.04) | 0.05(0.04) | 0.06(0.04) | 0.06(0.04) |
| B | 0.02(0.85) | −0.11(0.88) | 0.038(0.05) | 0.02(0.05) | −0.06(0.04) | −0.06(0.04) | 0.006(0.04) | 0.009(0.04) | 0.02(0.05) | 0.02(0.05) | |
| C | 0.18(0.64) | 0.32(0.63) | −0.05(0.04) | −0.04(0.04) | 0.03(0.04) | 0.04(0.03) | 0.01(0.04) | 0.02(0.03) | 0.04(0.03) | 0.04(0.03) | |
| Being needed by other people | A | 1.93(0.57) *** | 1.99(0.58) *** | 0.12(0.03) *** | 0.13(0.03) *** | 0.11(0.03) *** | 0.11(0.03) *** | 0.07(0.03) * | 0.07(0.03) * | 0.02(0.03) | 0.02(0.03) |
| B | 0.09(0.62) | 0.23(0.64) | 0.006(0.037) | −0.03(0.03) | 0.01(0.03) | 0.02(0.03) | −0.01(0.03) | −0.007(0.03) | 0.006(0.03) | −0.003(0.04) | |
| C | 0.58(0.54) | 0.75(0.53) | 0.05(0.03) | 0.04(0.04) | 0.03(0.03) | 0.04(0.03) | 0.004(0.03) | 0.008(0.03) | 0.02(0.03) | 0.02(0.03) | |
| Good substantive condition | A | −0.96(0.57) | −0.97(0.57) | −0.03(0.03) | −0.03(0.03) | 0.005(0.03) | 0.002(0.03) | −0.06(0.03) * | −0.06(0.03) * | −0.07(0.03) ** | −0.07(0.03) ** |
| B | 0.63(0.67) | 0.75(0.70) | 0.03(0.04) | 0.04(0.04) | −0.04(0.03) | −0.03(0.03) | 0.05(0.03) | 0.07(0.03) | 0.05(0.04) | 0.04(0.04) | |
| C | −0.39(0.59) | −0.69(0.59) | −0.05(0.04) | −0.06(0.04) | −0.02(0.03) | −0.05(0.03) | −0.05(0.03) | −0.04(0.03) | 0.05(0.03) | 0.04(0.03) | |
| Adventurous life | A | 1.44(0.81) | 1.24(0.83) | 0.08(0.04) | 0.08(0.04) | 0.08(0.04) | 0.06(0.04) | 0.04(0.04) | 0.03(0.04) | 0.04(0.04) | 0.04(0.04) |
| B | 0.60(1.09) | 0.71(1.11) | 0.05(0.06) | 0.07(0.06) | −0.08(0.06) | −0.06(0.06) | 0.03(0.06) | 0.03(0.06) | 0.09(0.06) | 0.08(0.06) | |
| C | 1.13(0.70) | 0.86(0.68) | 0.07(0.04) | 0.06(0.04) | 0.03(0.04) | 0.02(0.04) | 0.05(0.04) | 0.03(0.04) | 0.04(0.03) | 0.04(0.03) | |
| Fame, popularity | A | −0.75(1.32) | −1.40(1.37) | −0.03(0.07) | −0.05(0.07) | 0.002(0.07) | −0.02(0.07) | −0.07(0.07) | −0.12(0.07) | −0.02(0.06) | −0.04(0.06) |
| B | −7.25(7.35) | −7.24(7.77) | −0.38(0.43) | −0.30(0.45) | −0.69(0.38) | −0.60(0.39) | −0.46(0.37) | −0.49(0.40) | 0.33(0.04) | 0.17(0.43) | |
| C | −0.76(1.49) | −0.78(1.46) | −0.09(0.09) | −0.10(0.09) | −0.05(0.08) | −0.05(0.08) | 0.09(0.09) | 0.08(0.08) | −0.07(0.07) | −0.06(0.07) | |
| Personal Values | Group | Health Behaviors | |||||||||
|---|---|---|---|---|---|---|---|---|---|---|---|
| General Indicator of HBI | Health Eating Habits | Prophylactic Behaviors | Positive Mental Attitude | Health Practices | |||||||
| b(SE) | b A(SE) | b(SE) | b A(SE) | b(SE) | b A(SE) | b(SE) | b A(SE) | b(SE) | b A(SE) | ||
| Love and friendship | A | 1.17(0.72) | 1.25(0.73) | 0.05(0.04) | 0.07(0.04) | 0.06(0.04) | 0.06(0.04) | 0.04(0.04) | 0.04(0.04) | 0.04(0.03) | 0.03(0.03) |
| B | −0.18(0.95) | −0.24(0.95) | −0.04(0.05) | −0.04(0.05) | −0.01(0.05) | −0.02(0.05) | −0.01(0.05) | −0.02(0.05) | 0.03(0.05) | 0.03(0.05) | |
| C | 0.60(0.56) | 0.99(0.56) | 0.004(0.03) | 0.01(0.04) | 0.01(0.03) | 0.05(0.03) | 0.09(0.03) ** | 0.10(0.03) ** | −0.01(0.03) | 0.006(0.03) | |
| Good health, physical and mental efficiency | A | 2.38(0.67) *** | 2.58(0.68) *** | 0.12(0.03) *** | 0.12(0.04) *** | 0.16(0.03) *** | 0.18(0.03) *** | 0.07(0.03) * | 0.08(0.03) * | 0.04(0.03) | 0.05(0.03) |
| B | 1.22(1.07) | 1.15(1.14) | 0.04(0.06) | 0.001(0.07) | 0.03(0.05) | 0.03(0.06) | 0.09(0.05) | 0.10(0.06) | 0.05(0.06) | 0.05(0.06) | |
| C | 0.55(0.60) | 0.54(0.60) | 0.006(0.04) | 0.008(0.04) | 0.10(0.03) ** | 0.10(0.03) ** | −0.03(0.03) | −0.03(0.03) | 0.02(0.03) | 0.01(0.03) | |
| Sense of humor, wit | A | −0.67(0.65) | −0.73(0.65) | −0.04(0.03) | −0.04(0.03) | −0.005(0.03) | −0.009(0.03) | −0.01(0.03) | −0.02(0.03) | −0.05(0.03) | −0.05(0.03) |
| B | −0.80(0.95) | −0.90(0.95) | −0.07(0.05) | −0.07(0.05) | −0.08(0.05) | −0.09(0.05) | −0.05(0.05) | −0.05(0.05) | 0.06(0.05) | 0.07(0.05) | |
| C | −2.15(0.58) *** | −2.38(0.57) *** | −0.13(0.04) *** | −0.14(0.04) *** | −0.11(0.03) ** | −0.12(0.03) *** | −0.07(0.03) | −0.08(0.03) * | −0.05(0.03) | −0.06(0.03) | |
| Intelligence, sharp mind | A | −0.40(0.60) | −0.42(0.60) | −0.02(0.03) | −0.02(0.03) | −0.005(0.03) | −0.003(0.03) | −0.007(0.03) | −0.01(0.03) | −0.03(0.03) | −0.03(0.03) |
| B | −0.85(0.69) | −0.65(0.72) | −0.03(0.04) | −0.02(0.04) | −0.02(0.04) | −0.01(0.04) | −0.02(0.03) | −0.01(0.04) | −0.06(0.04) | −0.06(0.04) | |
| C | −1.18(0.57) * | −1.20(0.56) * | −0.02(0.04) | −0.03(0.04) | −0.05(0.03) | −0.05(0.03) | −0.06(0.03) | −0.07(0.03) * | −0.06(0.03) * | −0.05(0.03) | |
| Knowledge and wisdom | A | −1.01(0.61) | −0.97(0.62) | −0.05(0.03) | −0.05(0.03) | −0.005(0.03) | −0.005(0.03) | −0.07(0.03) * | −0.07(0.03) * | −0.04(0.03) | −0.04(0.03) |
| B | 0.80(0.65) | 0.89(0.67) | 0.05(0.04) | 0.05(0.04) | 0.02(0.03) | 0.03(0.03) | 0.007(0.03) | 0.01(0.03) | 0.06(0.03) | 0.05(0.04) | |
| C | −1.04(0.55) | −1.06(0.54) | −0.02(0.03) | −0.02(0.04) | −0.02(0.03) | −0.02(0.03) | −0.06(0.03) | −0.06(0.03) * | −0.06(0.03) * | −0.07(0.03) * | |
| Happiness, contentment | A | 1.26(0.58) * | 1.25(0.59) * | 0.04(0.03) | 0.04(0.03) | 0.05(0.03) | 0.04(0.03) | 0.05(0.03) | 0.05(0.03) | 0.07(0.03) ** | 0.07(0.03) * |
| B | 0.20(0.69) | 0.14(0.70) | 0.01(0.04) | 0.01(0.04) | −0.01(0.03) | −0.01(0.03) | −0.05(0.03) | −0.05(0.03) | 0.08(0.04) * | 0.08(0.04) * | |
| C | 1.37(0.58) * | 0.98(0.58) | 0.03(0.04) | 0.05(0.04) | 0.03(0.03) | 0.008(0.03) | 0.09(0.03) ** | 0.06(0.03) | 0.05(0.03) | 0.04(0.03) | |
| Courage, firmness | A | −1.22(0.73) | −1.33(0.74) | −0.08(0.04) * | −0.07(0.04) | −0.03(0.04) | −0.04(0.04) | −0.04(0.04) | −0.05(0.04) | −0.06(0.03) | −0.06(0.03) |
| B | −0.52(0.10) | −0.39(1.05) | −0.02(0.06) | 0.005(0.06) | −0.0009(0.05) | 0.02(0.05) | −0.04(0.05) | −0.05(0.05) | −0.02(0.05) | −0.04(0.06) | |
| C | 0.42(0.64) | −0.09(0.64) | −0.001(0.04) | −0.02(0.04) | 0.02(0.04) | −0.006(0.03) | 0.06(0.04) | 0.03(0.04) | −0.01(0.03) | −0.02(0.03) | |
| Kindness, consideration | A | 0.34(0.63) | 0.37(0.64) | 0.02(0.03) | 0.027(0.03) | 0.04(0.03) | 0.03(0.03) | −0.008(0.03) | −0.006(0.03) | 0.007(0.03) | 0.005(0.03) |
| B | −0.40(0.72) | −0.50(0.72) | −0.007(0.04) | −0.01(0.04) | −0.03(0.04) | −0.03(0.04) | −0.04(0.04) | −0.04(0.04) | 0.004(0.04) | −0.002(0.04) | |
| C | −0.93(0.61) | −1.04(0.60) | −0.11(0.04) ** | −0.11(0.04) ** | −0.05(0.03) | −0.05(0.03) | 0.04(0.03) | 0.03(0.03) | −0.03(0.03) | −0.03(0.03) | |
| Fine appearance, presence | A | −0.39(0.79) | −0.44(0.80) | −0.06(0.04) | −0.06(0.04) | 0.04(0.04) | 0.03(0.04) | −0.006(0.04) | −0.007(0.04) | −0.03(0.04) | −0.04(0.04) |
| B | −2.63(1.92) | −2.09(1.97) | −0.11(0.11) | −0.06(0.11) | −0.22(0.10) * | −0.18(0.10) | 0.007(0.10) | 0.03(0.10) | −0.12(0.10) | −0.14(0.11) | |
| C | −1.40(0.94) | −1.27(0.92) | −0.14(0.06) * | −0.14(0.06) * | −0.04(0.05) | −0.02(0.05) | −0.07(0.05) | −0.07(0.05) | 0.01(0.04) | 0.02(0.04) | |
| Fortune, wealth | A | −1.53(0.76) * | −1.73(0.77) * | −0.10(0.04) * | −0.11(0.04) ** | −0.02(0.04) | −0.03(0.04) | −0.07(0.04) | −0.08(0.04) * | −0.06(0.03) | −0.07(0.04) |
| B | −2.49(0.93) ** | −2.38(0.96) * | −0.10(0.05) | −0.09(0.06) | −0.11(0.05) * | −0.11(0.05) * | −0.04(0.05) | −0.04(0.05) | −0.15(0.05) ** | −0.16(0.05) ** | |
| C | −0.60(0.83) | −1.13(0.82) | −0.11(0.05) * | −0.13(0.05) * | 0.03(0.05) | −0.002(0.05) | −0.02(0.05) | −0.04(0.05) | 0.005(0.04) | −0.01(0.04) | |
© 2018 by the authors. Licensee MDPI, Basel, Switzerland. This article is an open access article distributed under the terms and conditions of the Creative Commons Attribution (CC BY) license (http://creativecommons.org/licenses/by/4.0/).
Share and Cite
Nowicki, G.J.; Misztal-Okońska, P.; Ślusarska, B.; Rudnicka-Drożak, E.; Młynarska, M.; Czekierdowski, A. Analysis of Health Behaviors and Personal Values of Childless Women, Pregnant Women and Women Who Recently Delivered. Int. J. Environ. Res. Public Health 2018, 15, 411. https://0-doi-org.brum.beds.ac.uk/10.3390/ijerph15030411
Nowicki GJ, Misztal-Okońska P, Ślusarska B, Rudnicka-Drożak E, Młynarska M, Czekierdowski A. Analysis of Health Behaviors and Personal Values of Childless Women, Pregnant Women and Women Who Recently Delivered. International Journal of Environmental Research and Public Health. 2018; 15(3):411. https://0-doi-org.brum.beds.ac.uk/10.3390/ijerph15030411
Chicago/Turabian StyleNowicki, Grzegorz Józef, Patrycja Misztal-Okońska, Barbara Ślusarska, Ewa Rudnicka-Drożak, Magdalena Młynarska, and Artur Czekierdowski. 2018. "Analysis of Health Behaviors and Personal Values of Childless Women, Pregnant Women and Women Who Recently Delivered" International Journal of Environmental Research and Public Health 15, no. 3: 411. https://0-doi-org.brum.beds.ac.uk/10.3390/ijerph15030411