WHO Environmental Noise Guidelines for the European Region: A Systematic Review on Environmental Noise and Effects on Sleep


Abstract
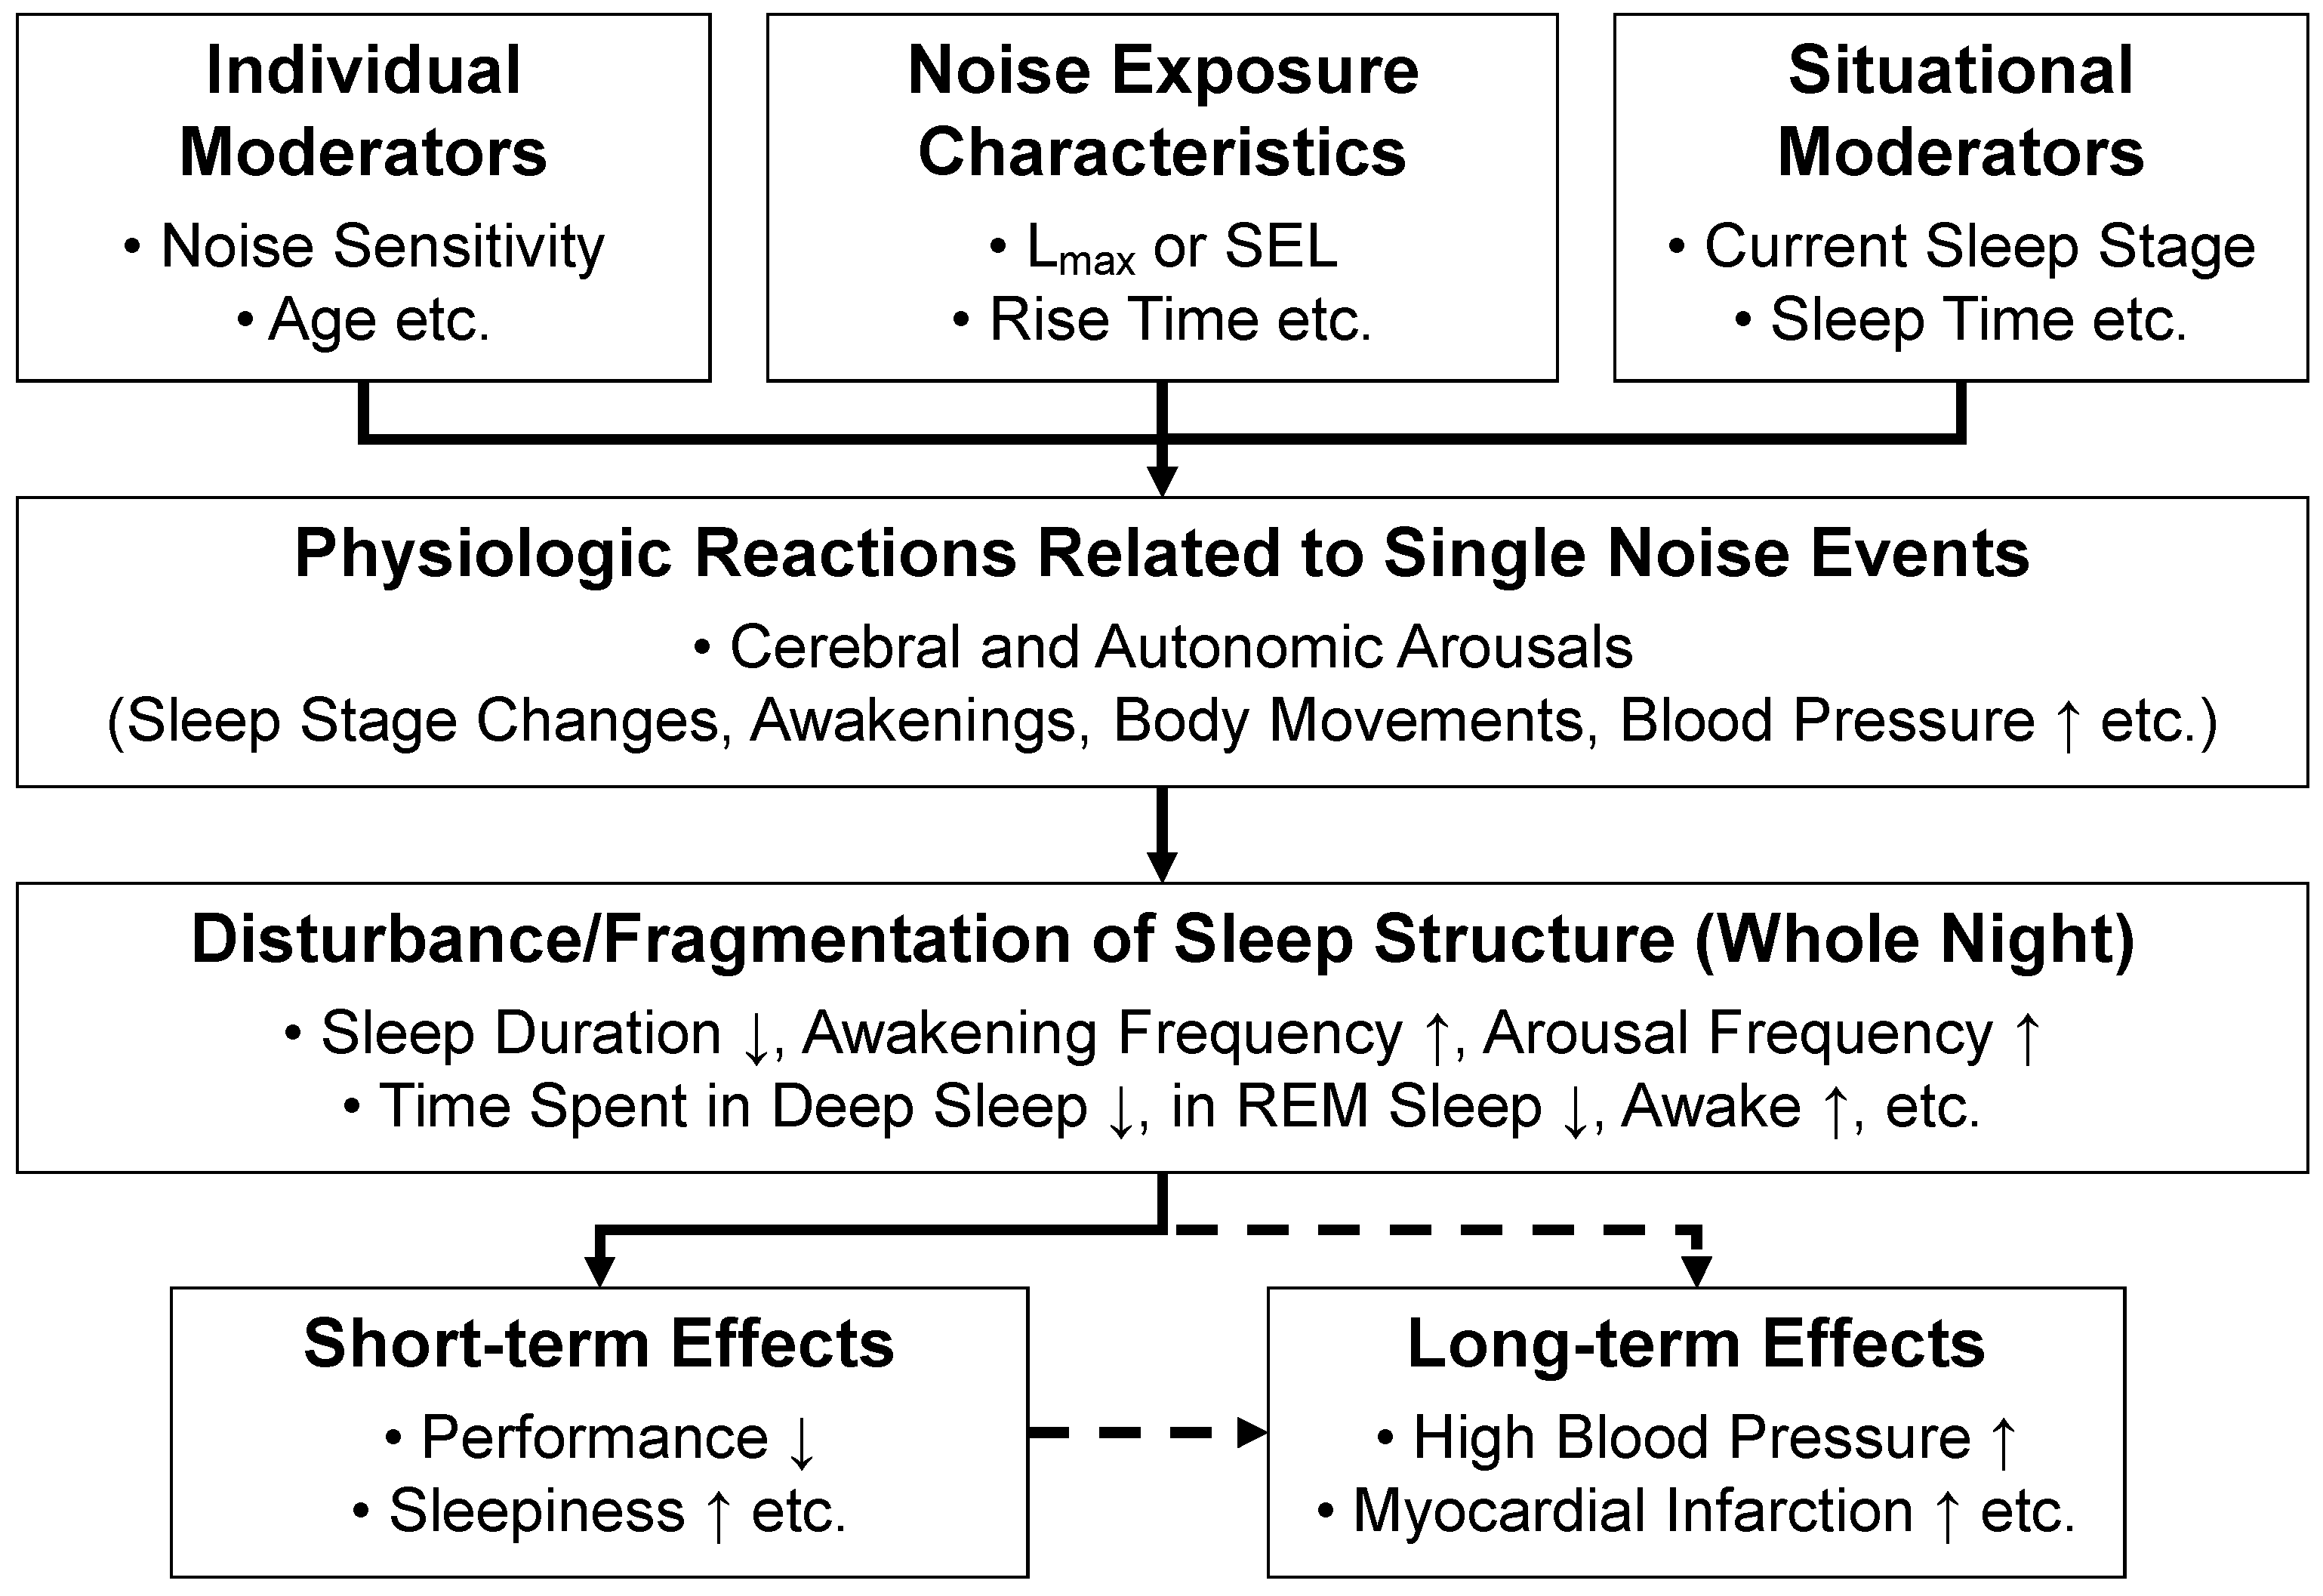
:1. Introduction
2. Methods
2.1. Mapping of Identified Reviews
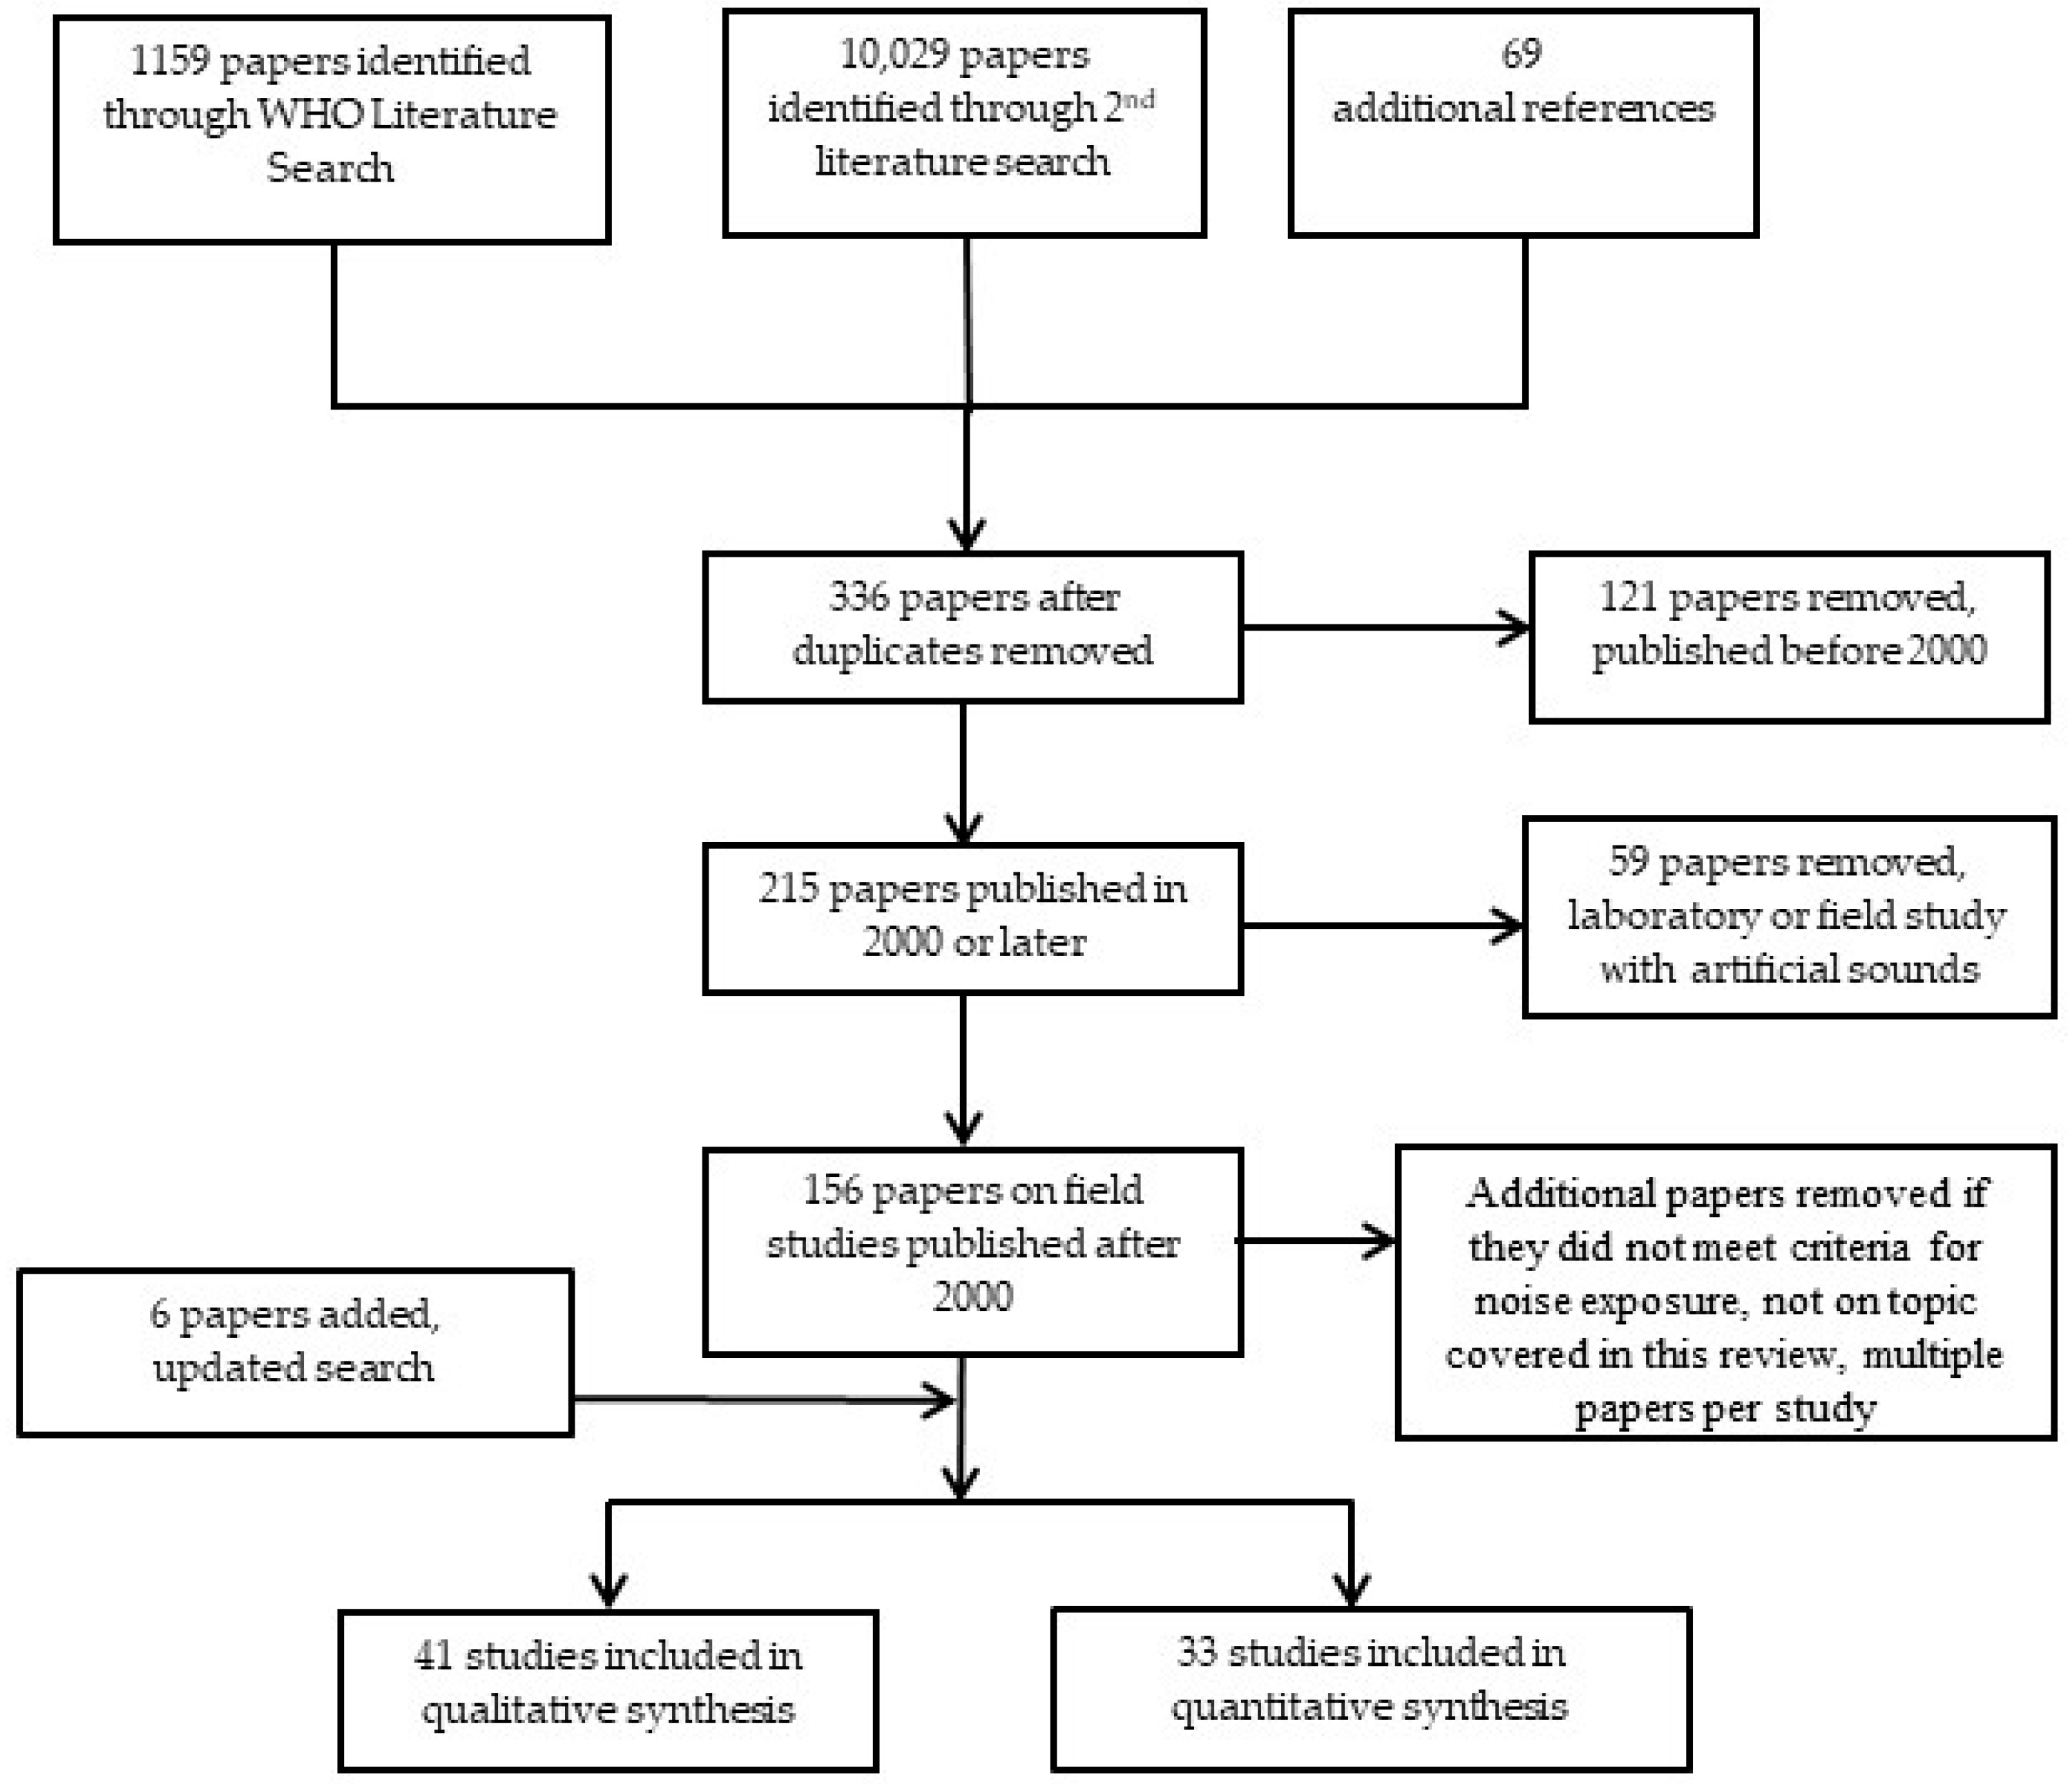
2.2. Search for Individual Studies
2.3. Inclusion and Exclusion Criteria
2.4. Risk of Bias and Quality Assessment
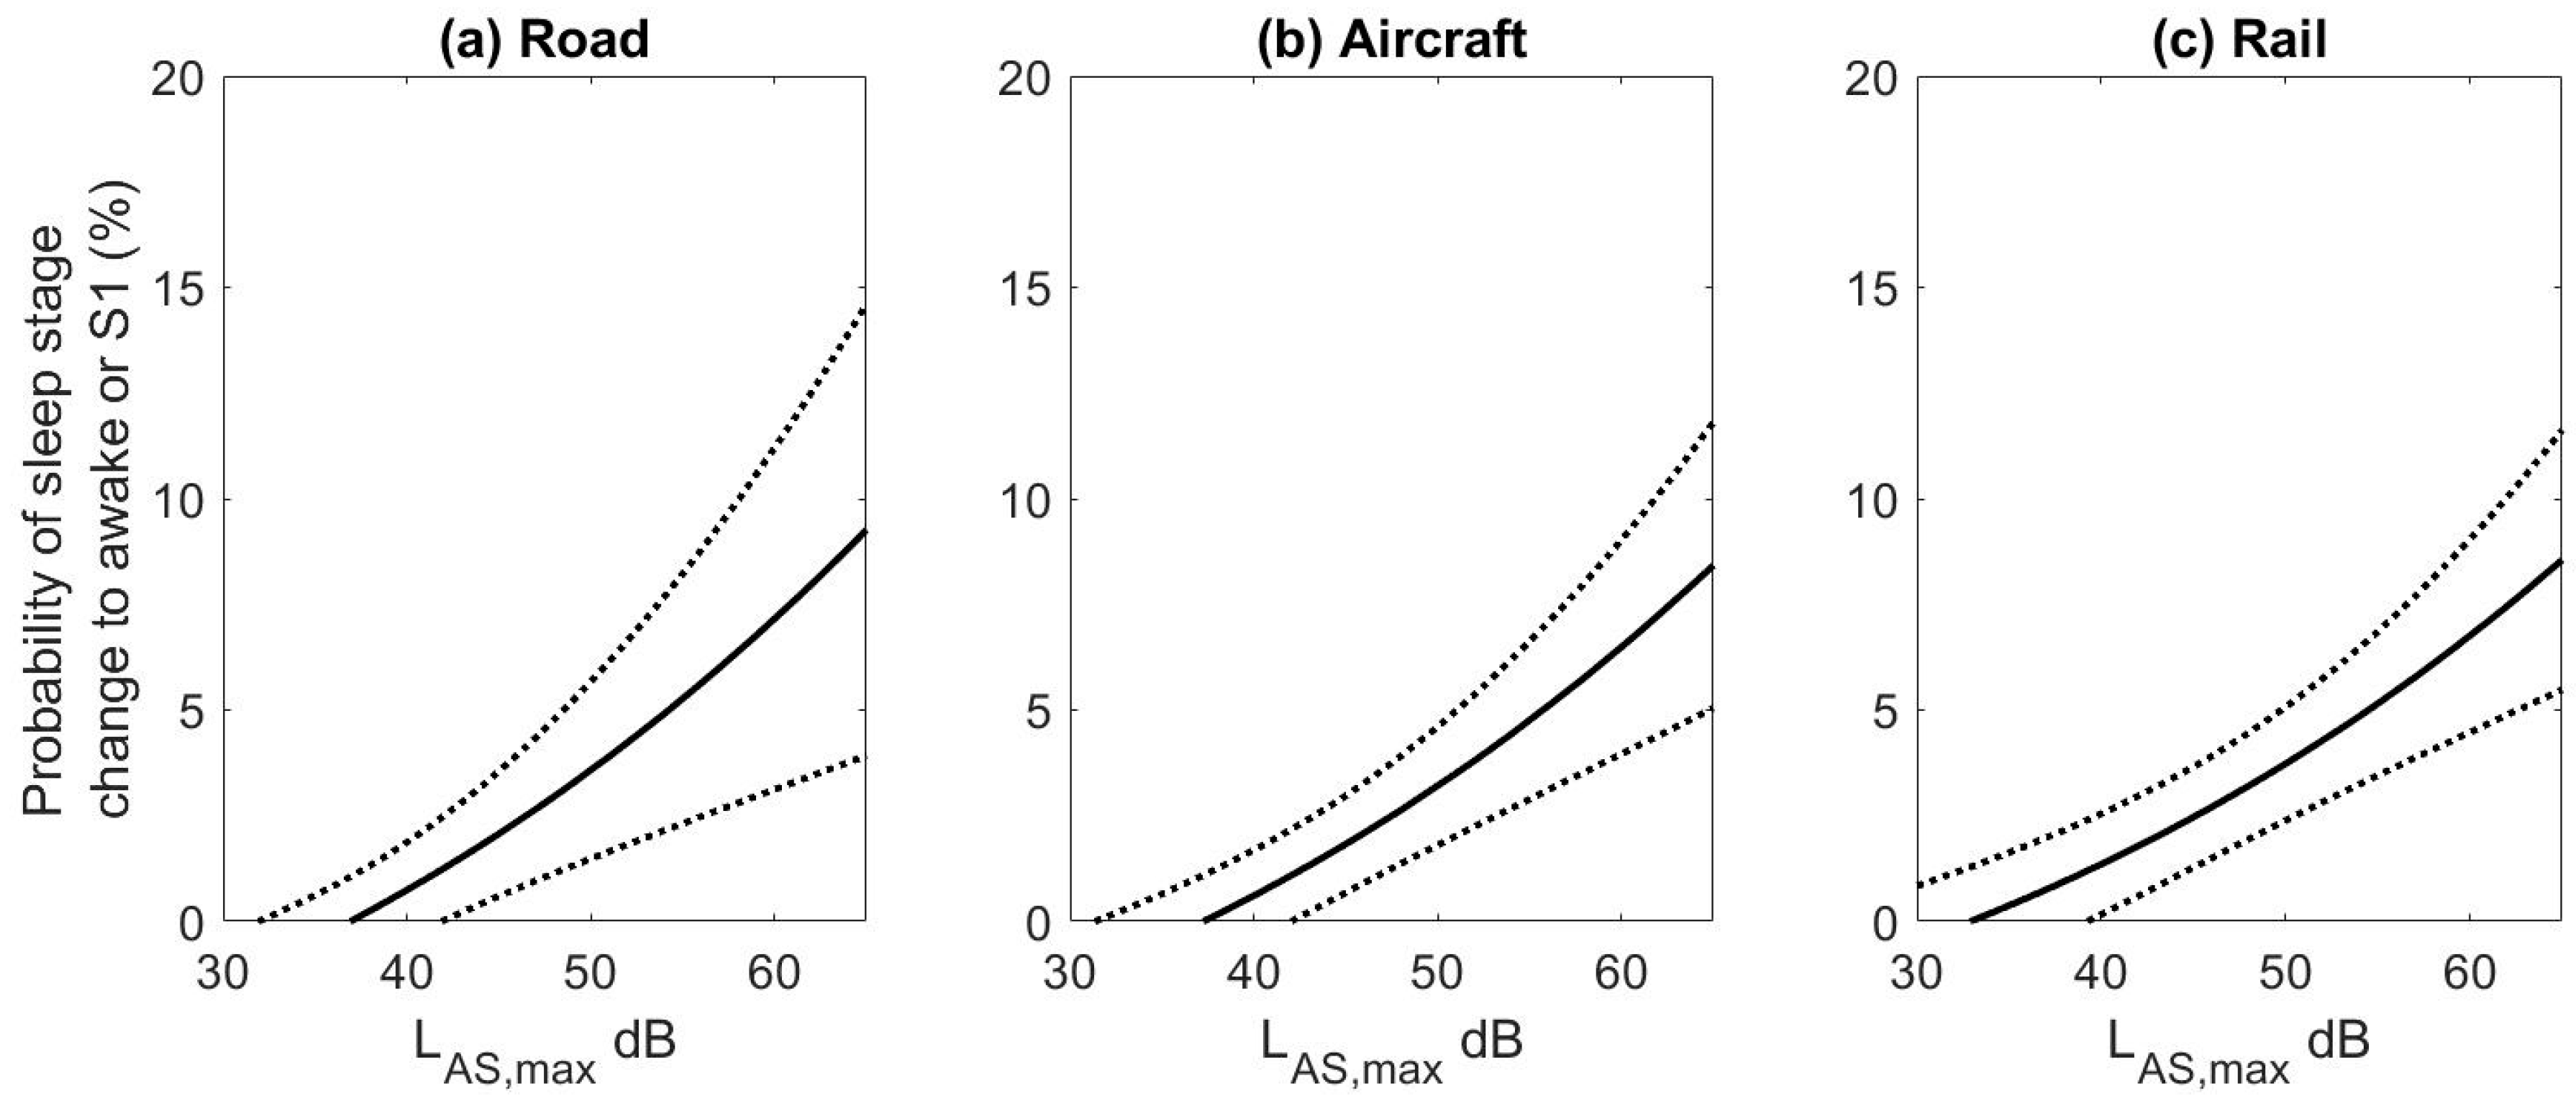
3. Polysomnography Measured Cortical Awakenings for Road, Rail, and Aircraft Noise
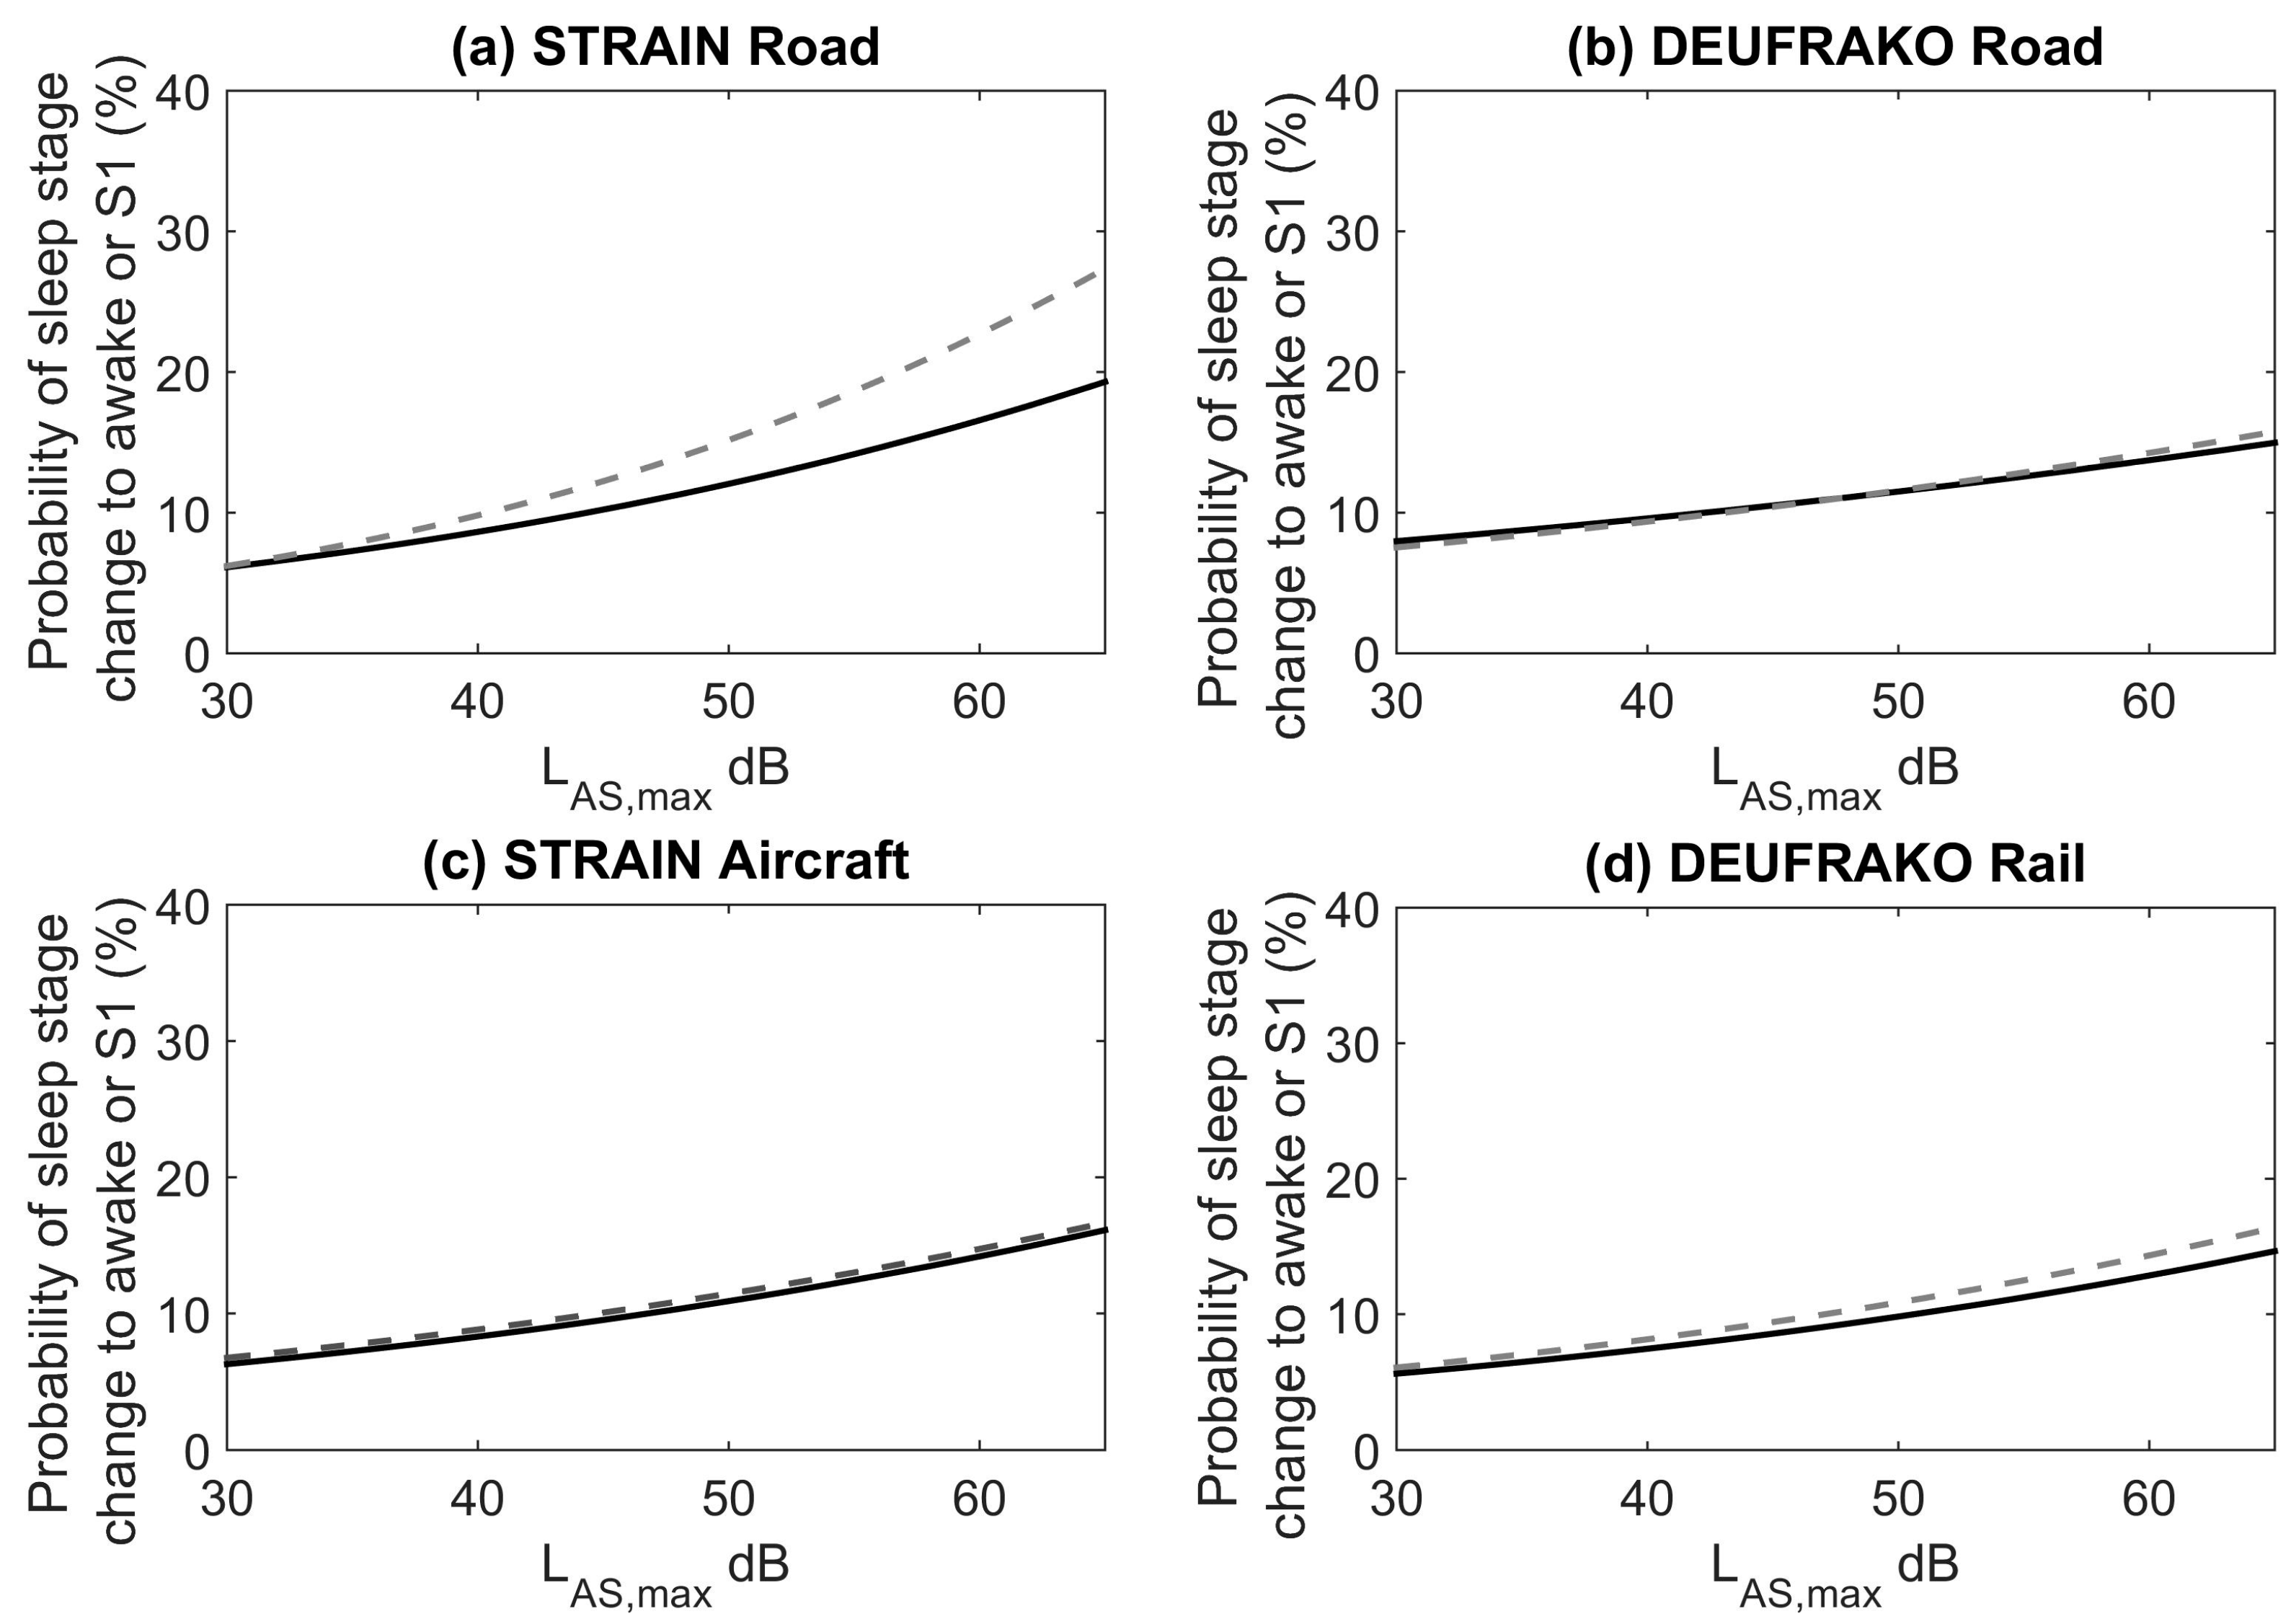
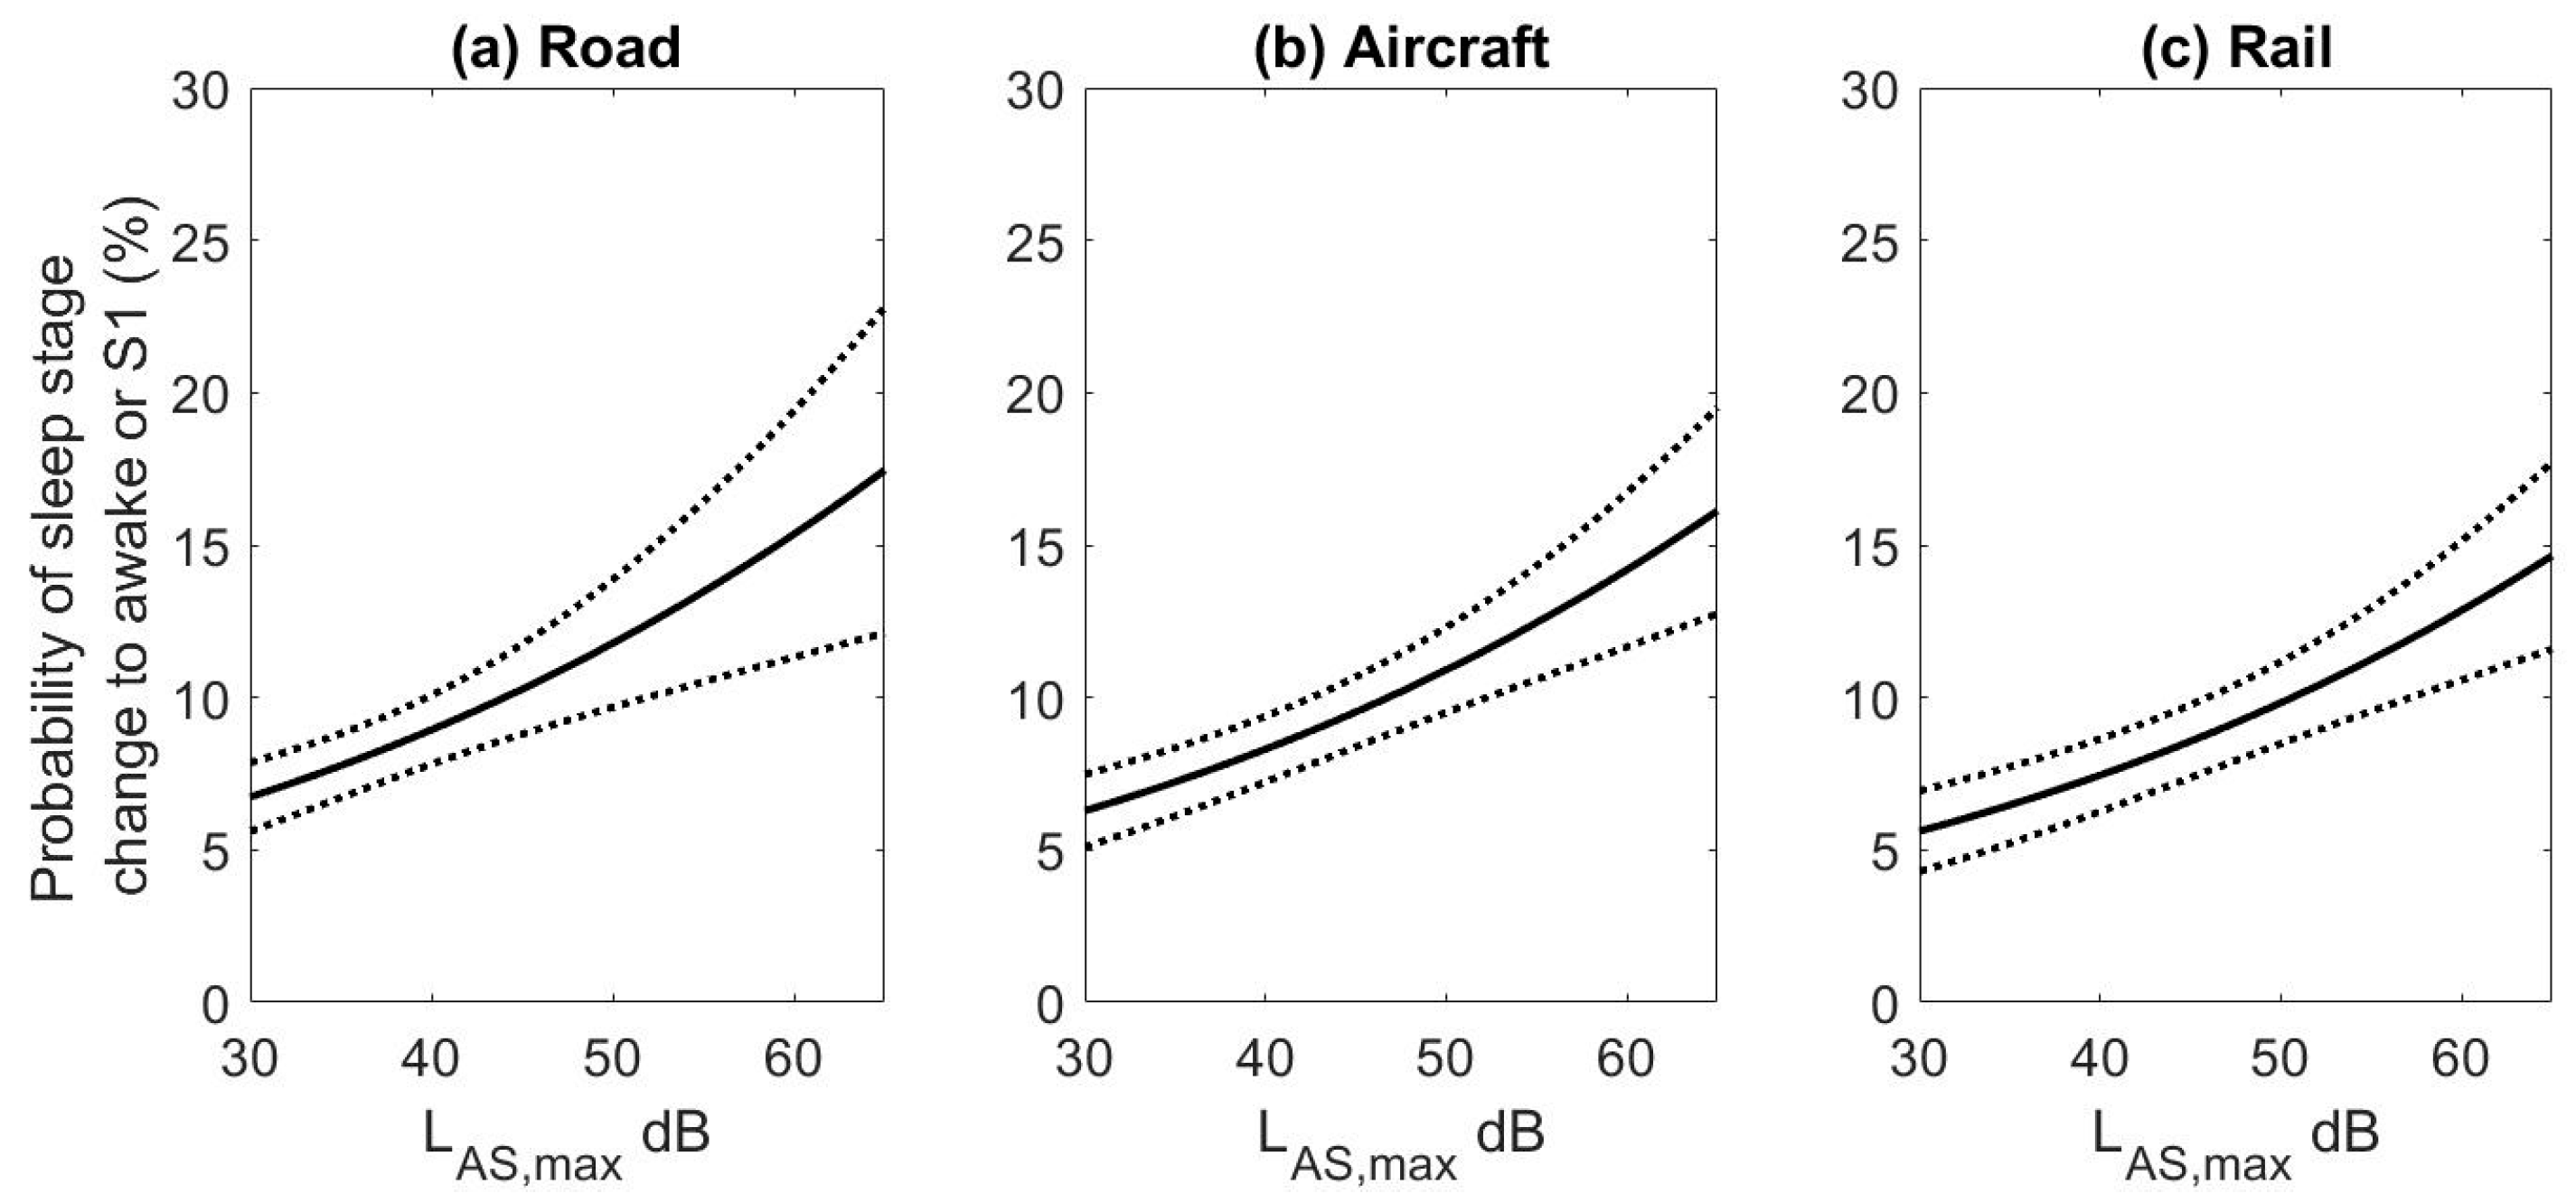
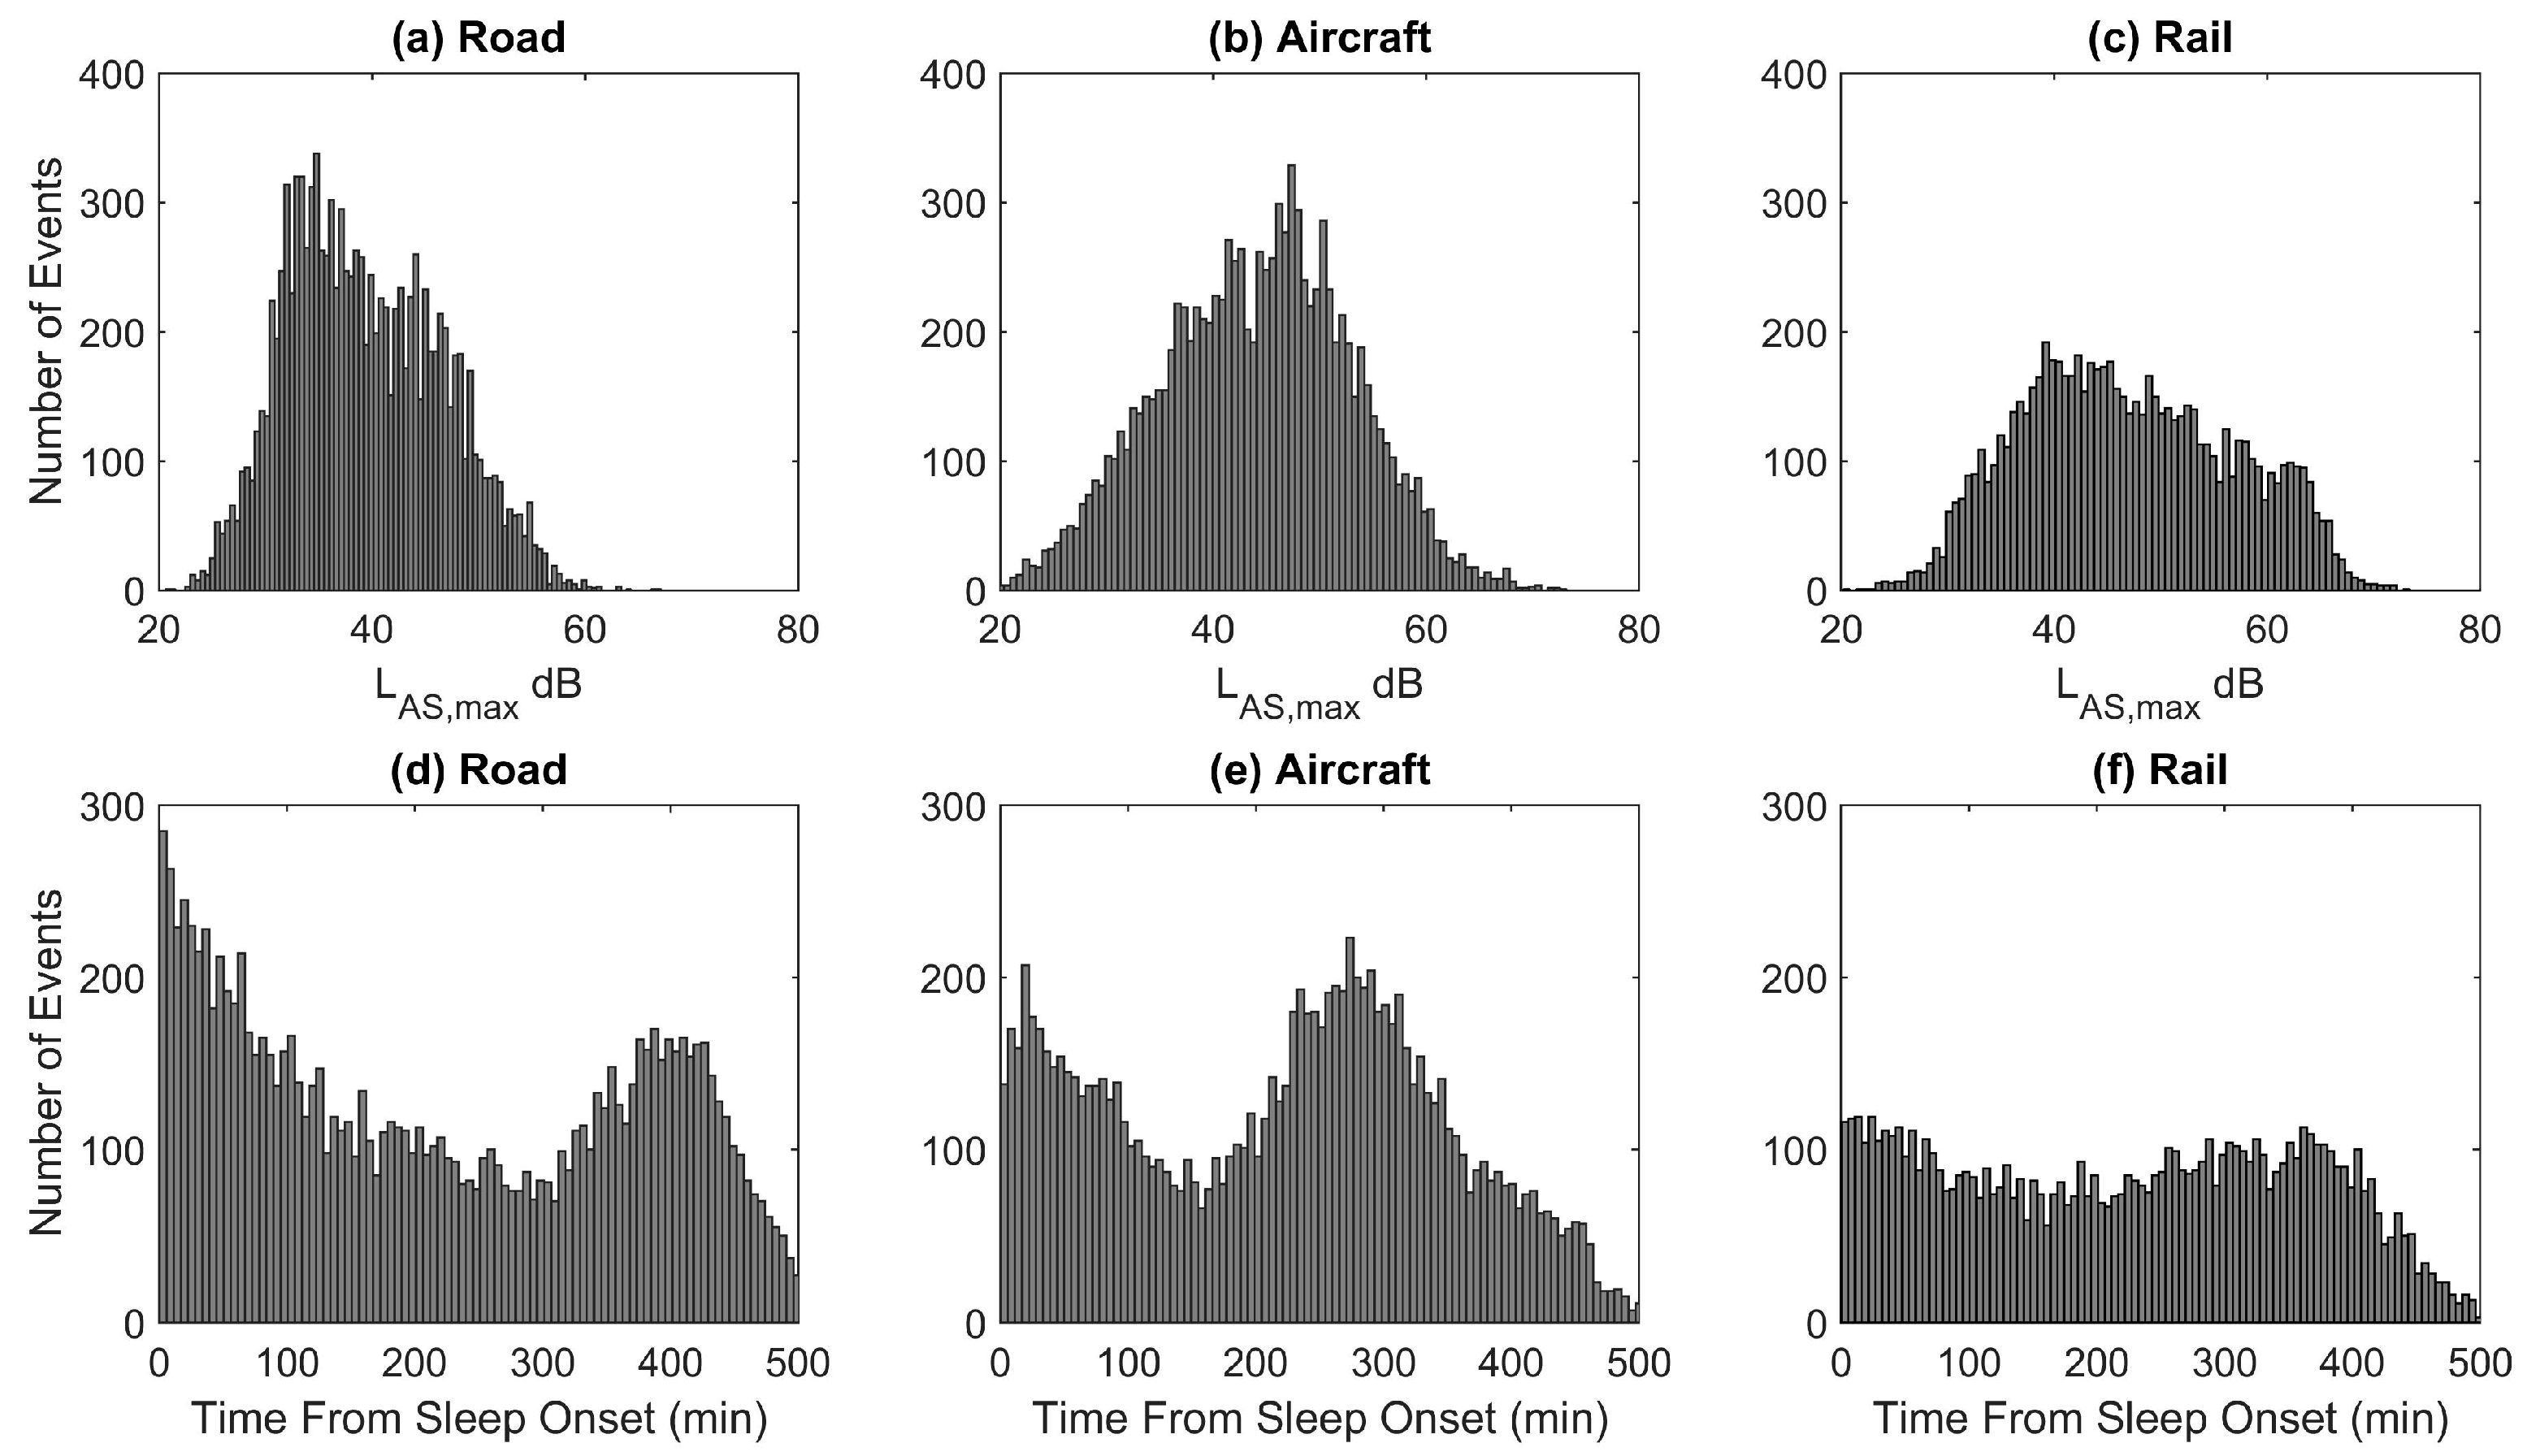
3.1. Event-Related Analysis
3.2. Statistical Analysis
3.3. Conclusions
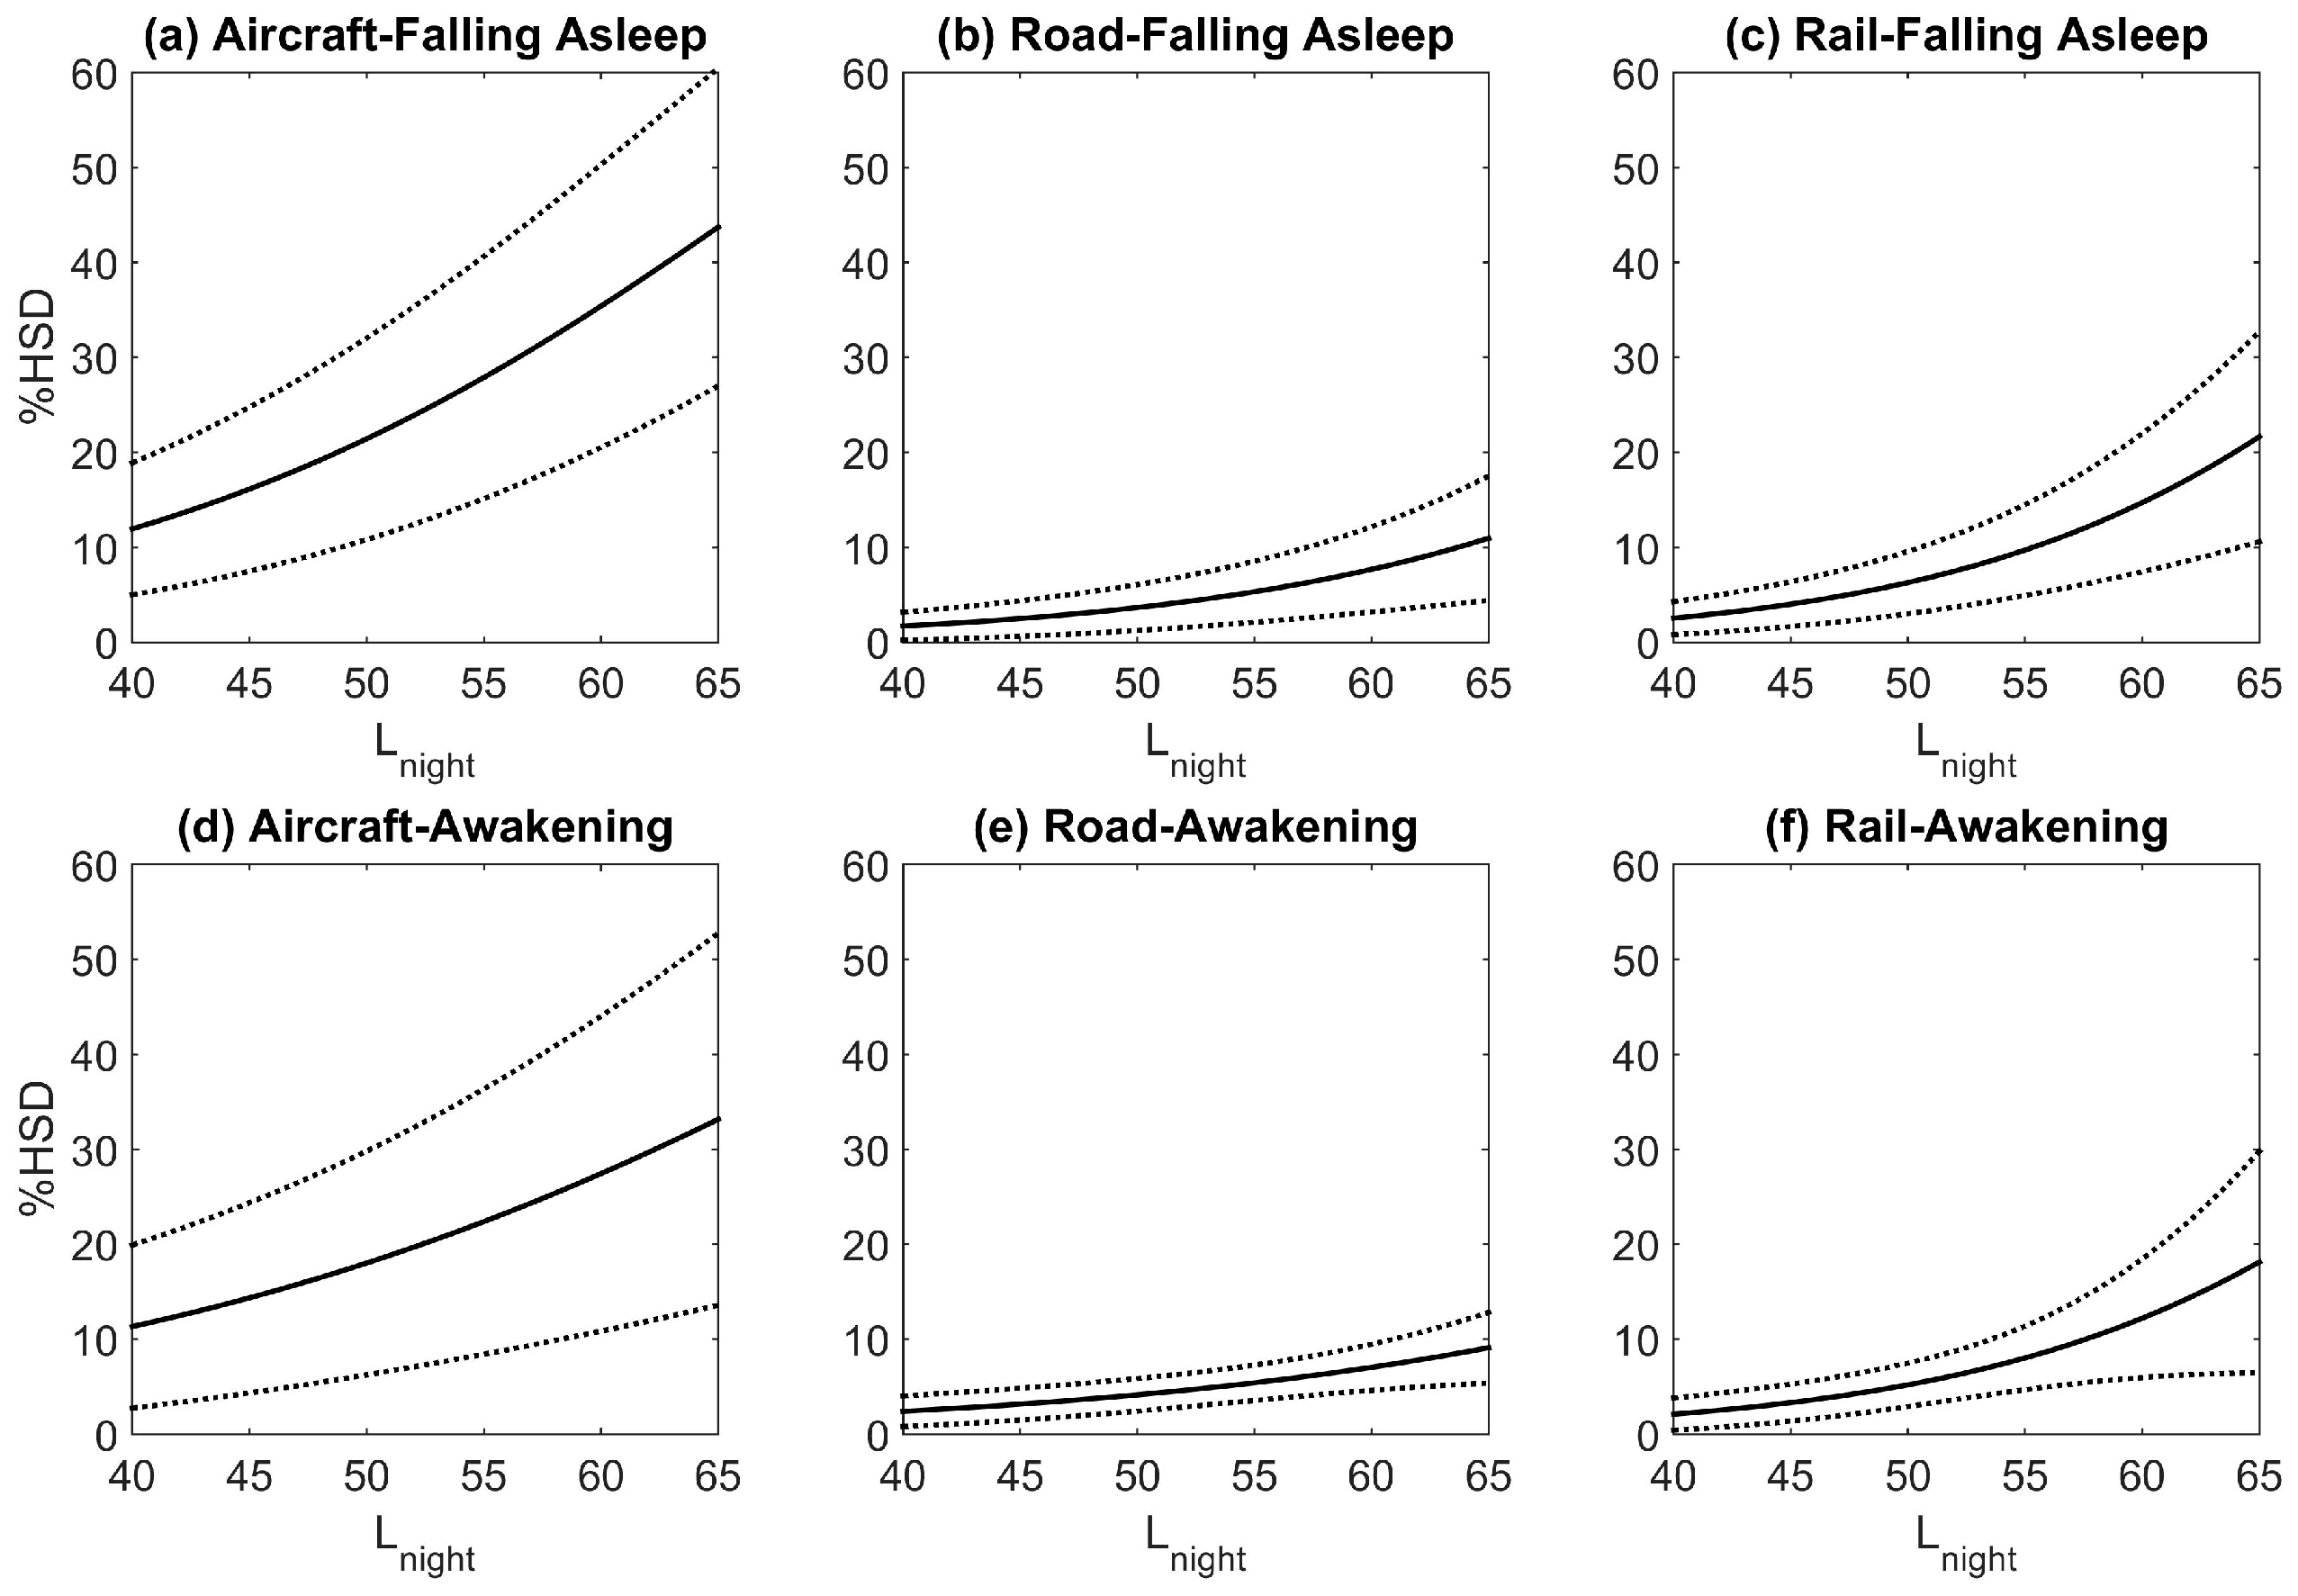
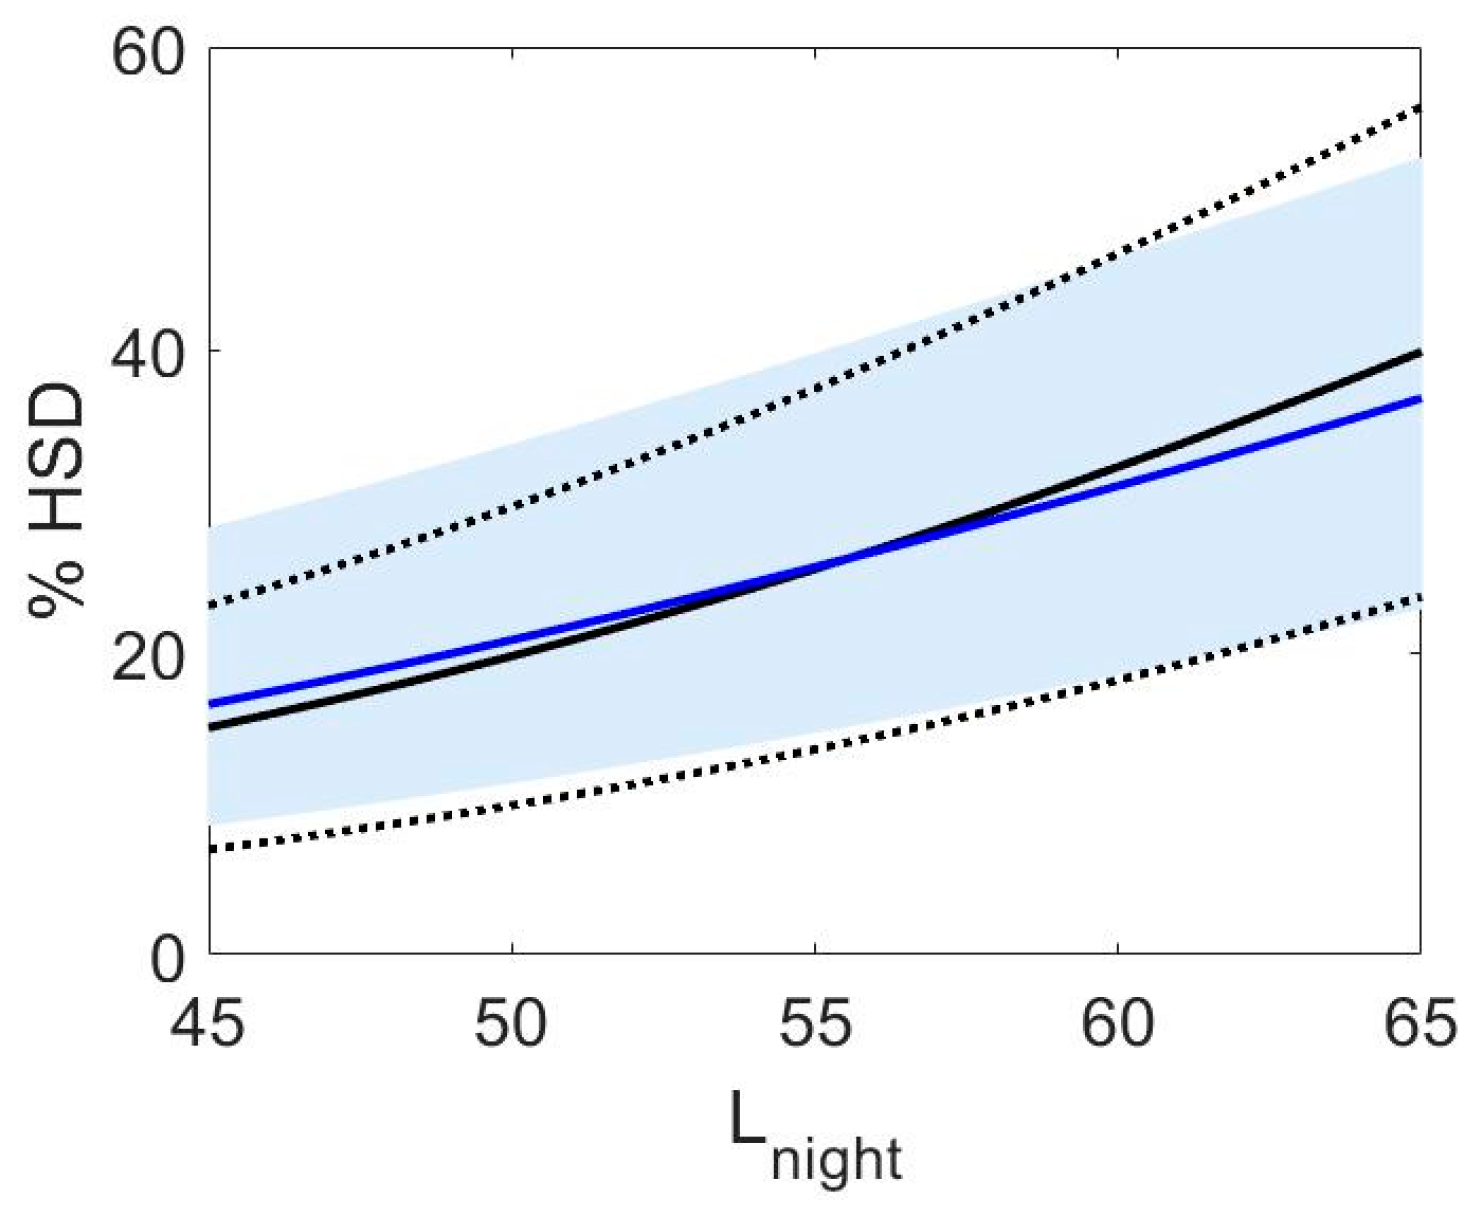
4. Self-Reported Sleep Outcomes for Road, Rail, and Aircraft Noise
- Awakenings from sleep, which refers to the period after sleep onset and before the final awakening. They are defined as events where a subject wakes up from sleep, regains consciousness, and recalls the awakening in the next morning.
- The process of falling asleep, which is defined as the transition from wakefulness into sleep.
- Sleep disturbance refers to internal/external interference with sleep onset or sleep continuity (sleep maintenance).
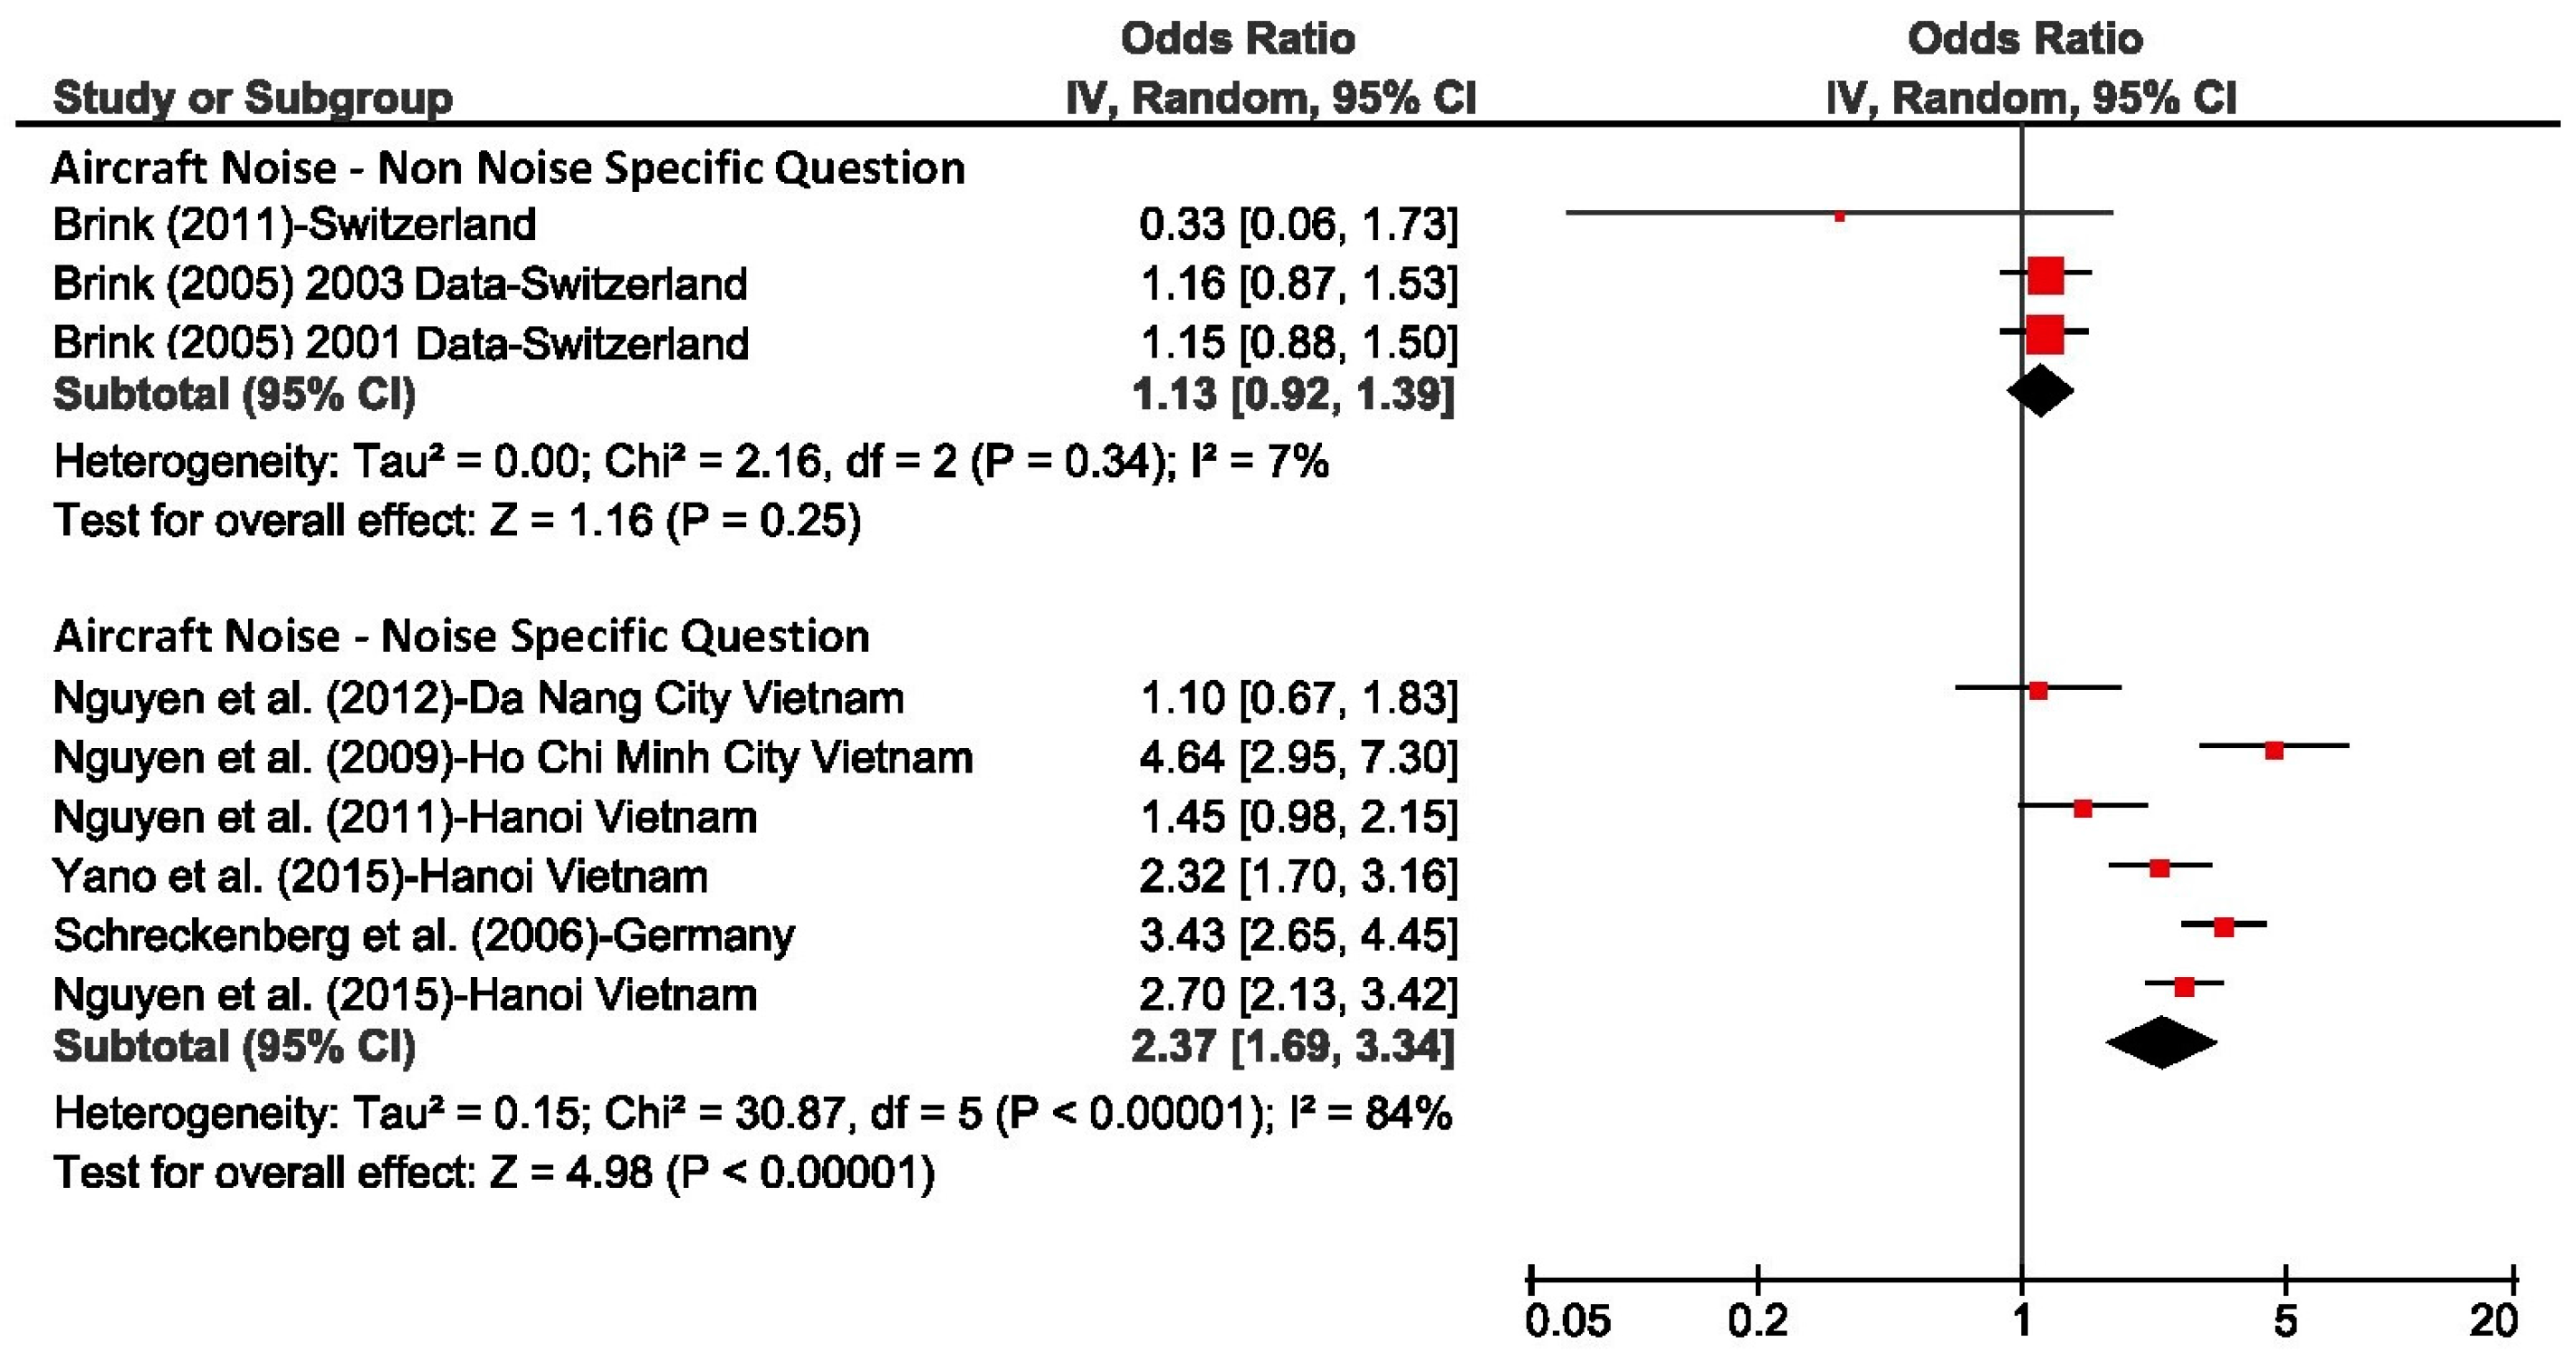
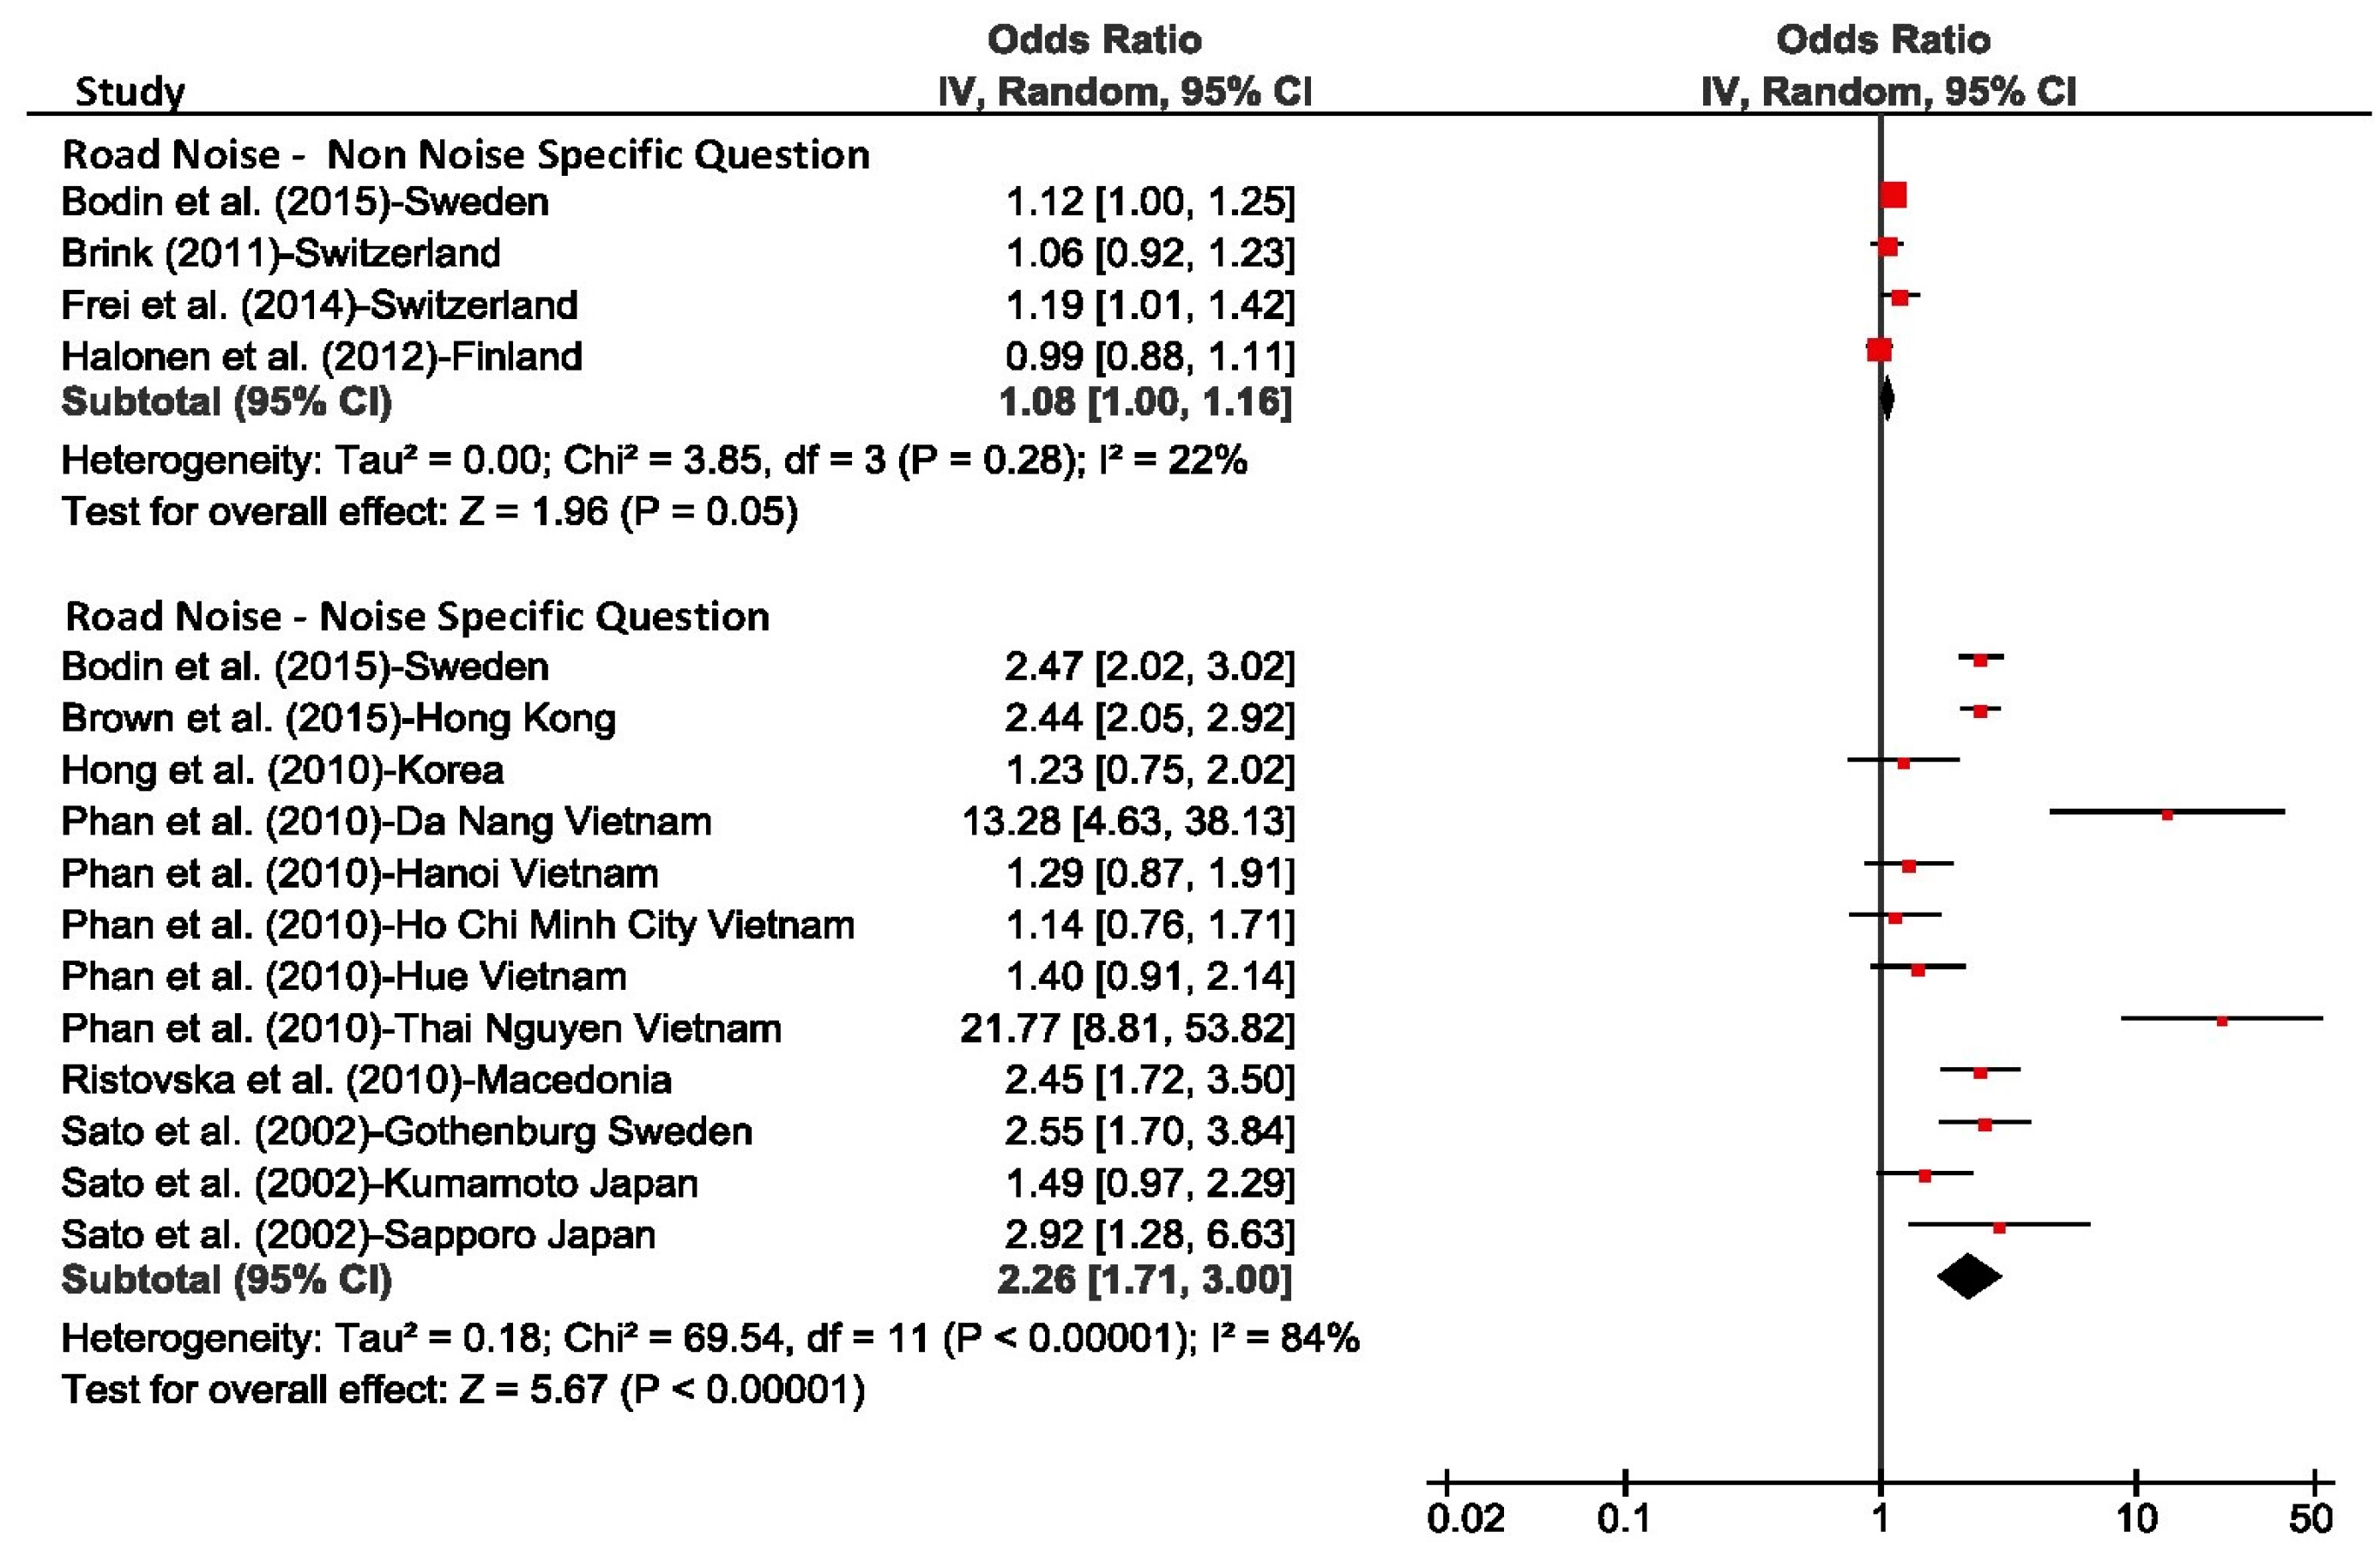
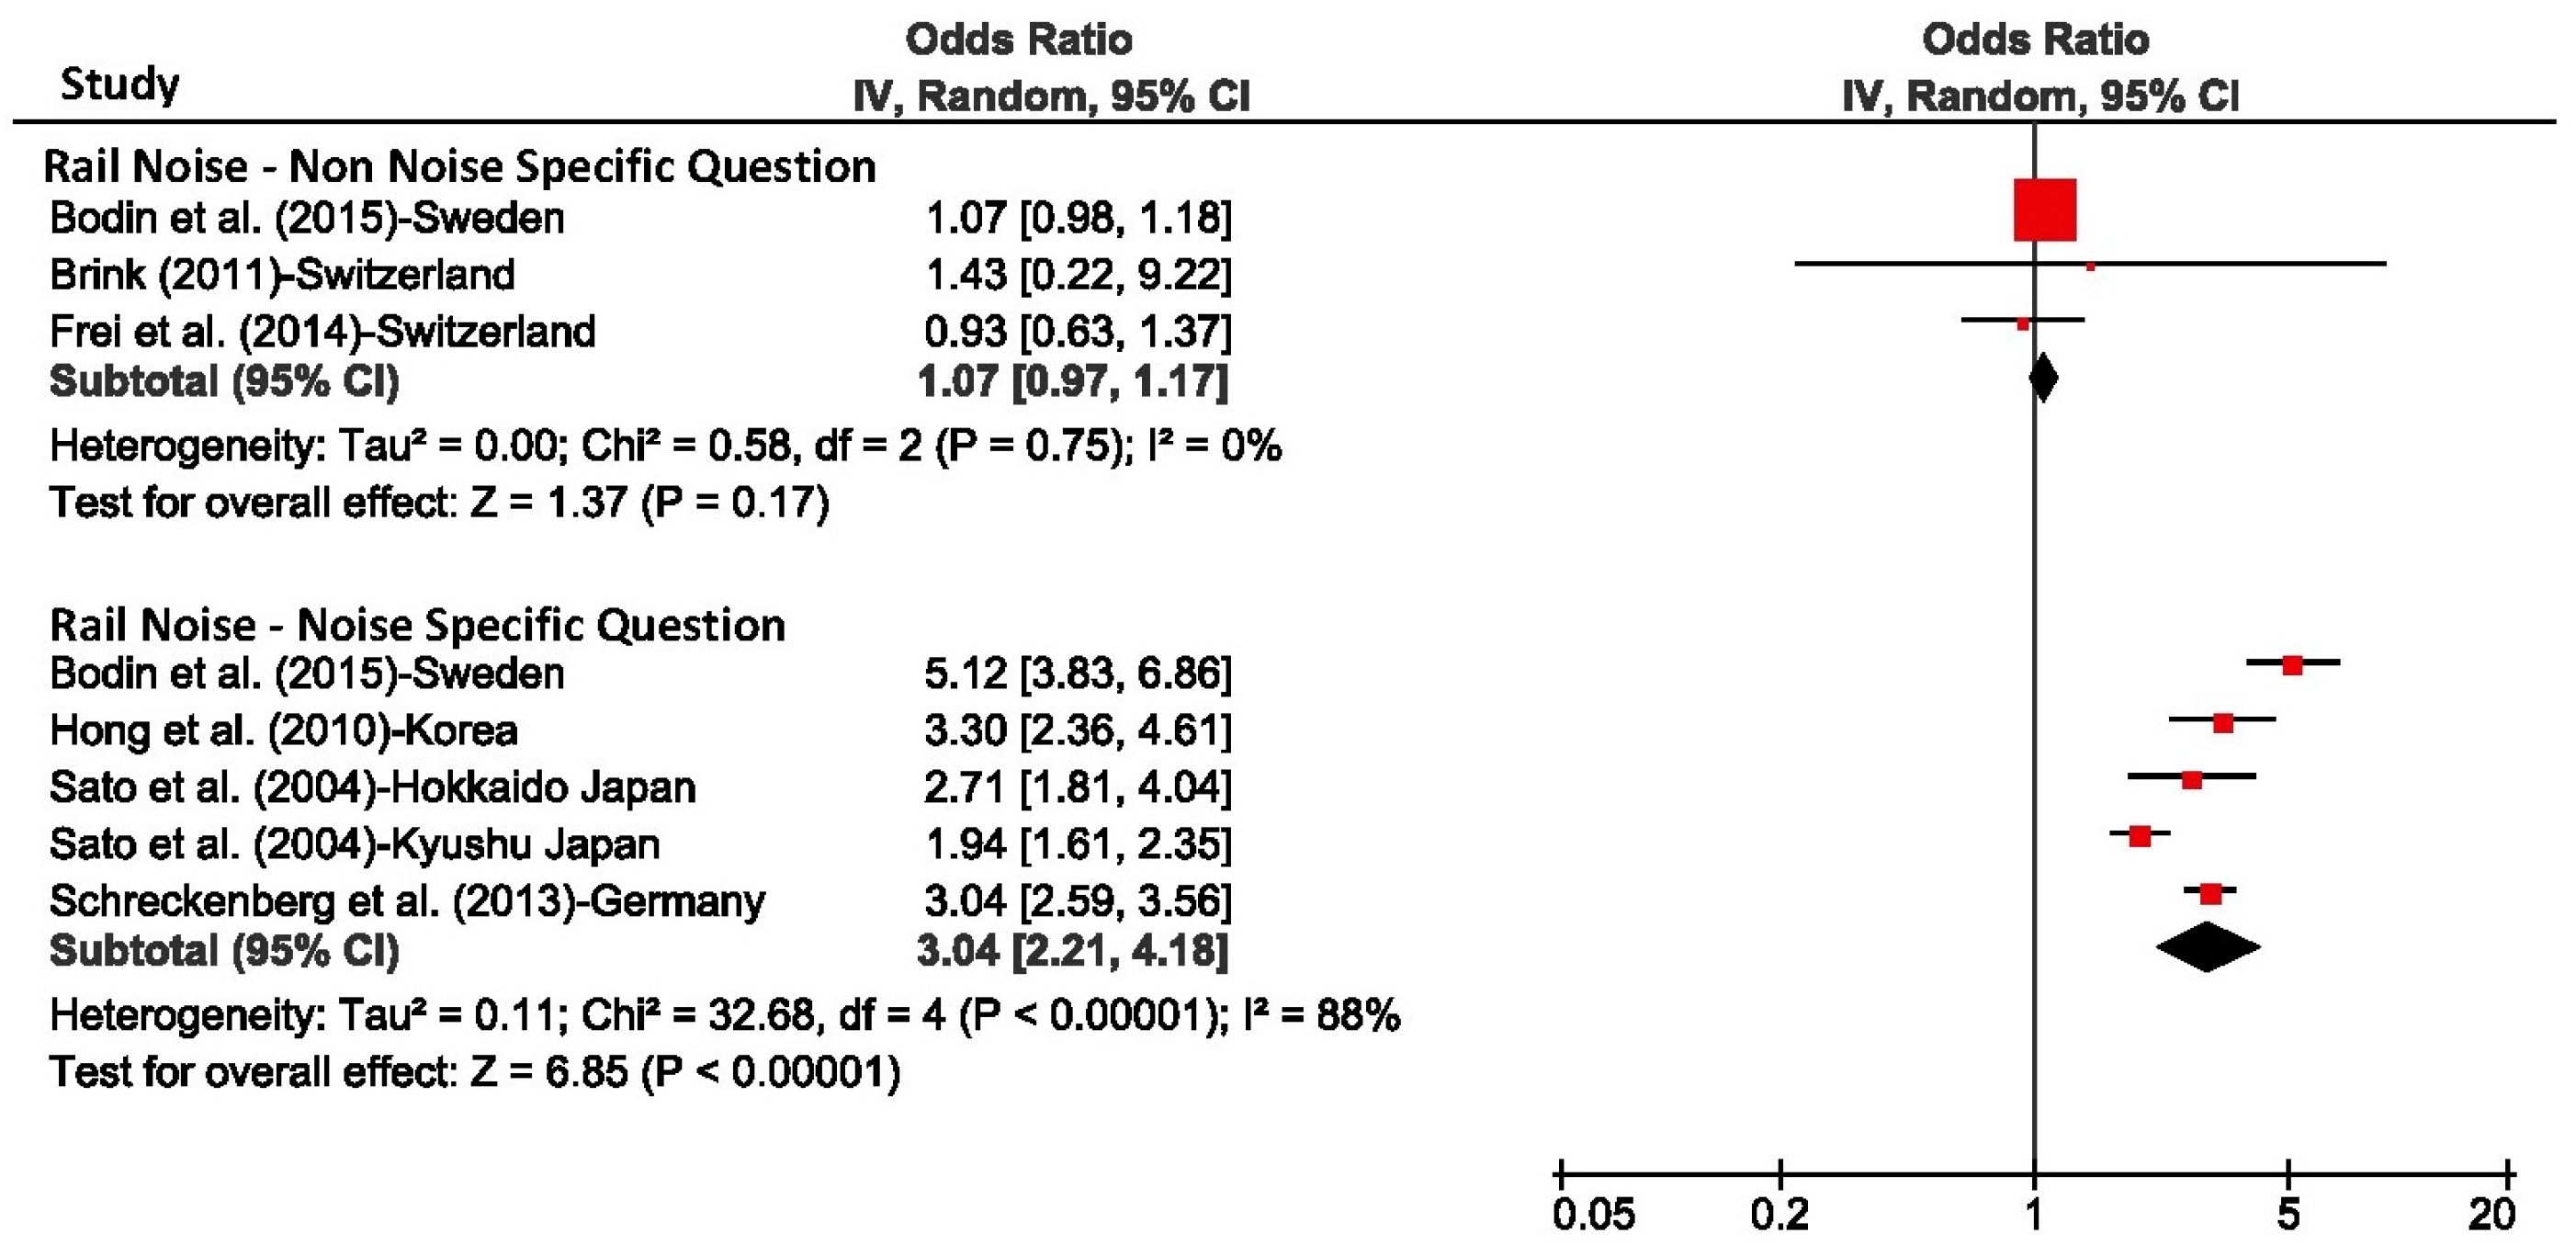
4.1. Statistical Analysis
4.2. Additional Studies
4.3. Conclusions
5. Wind Turbine Noise and Self-Reported and Actigraphy Measured Sleep Outcomes
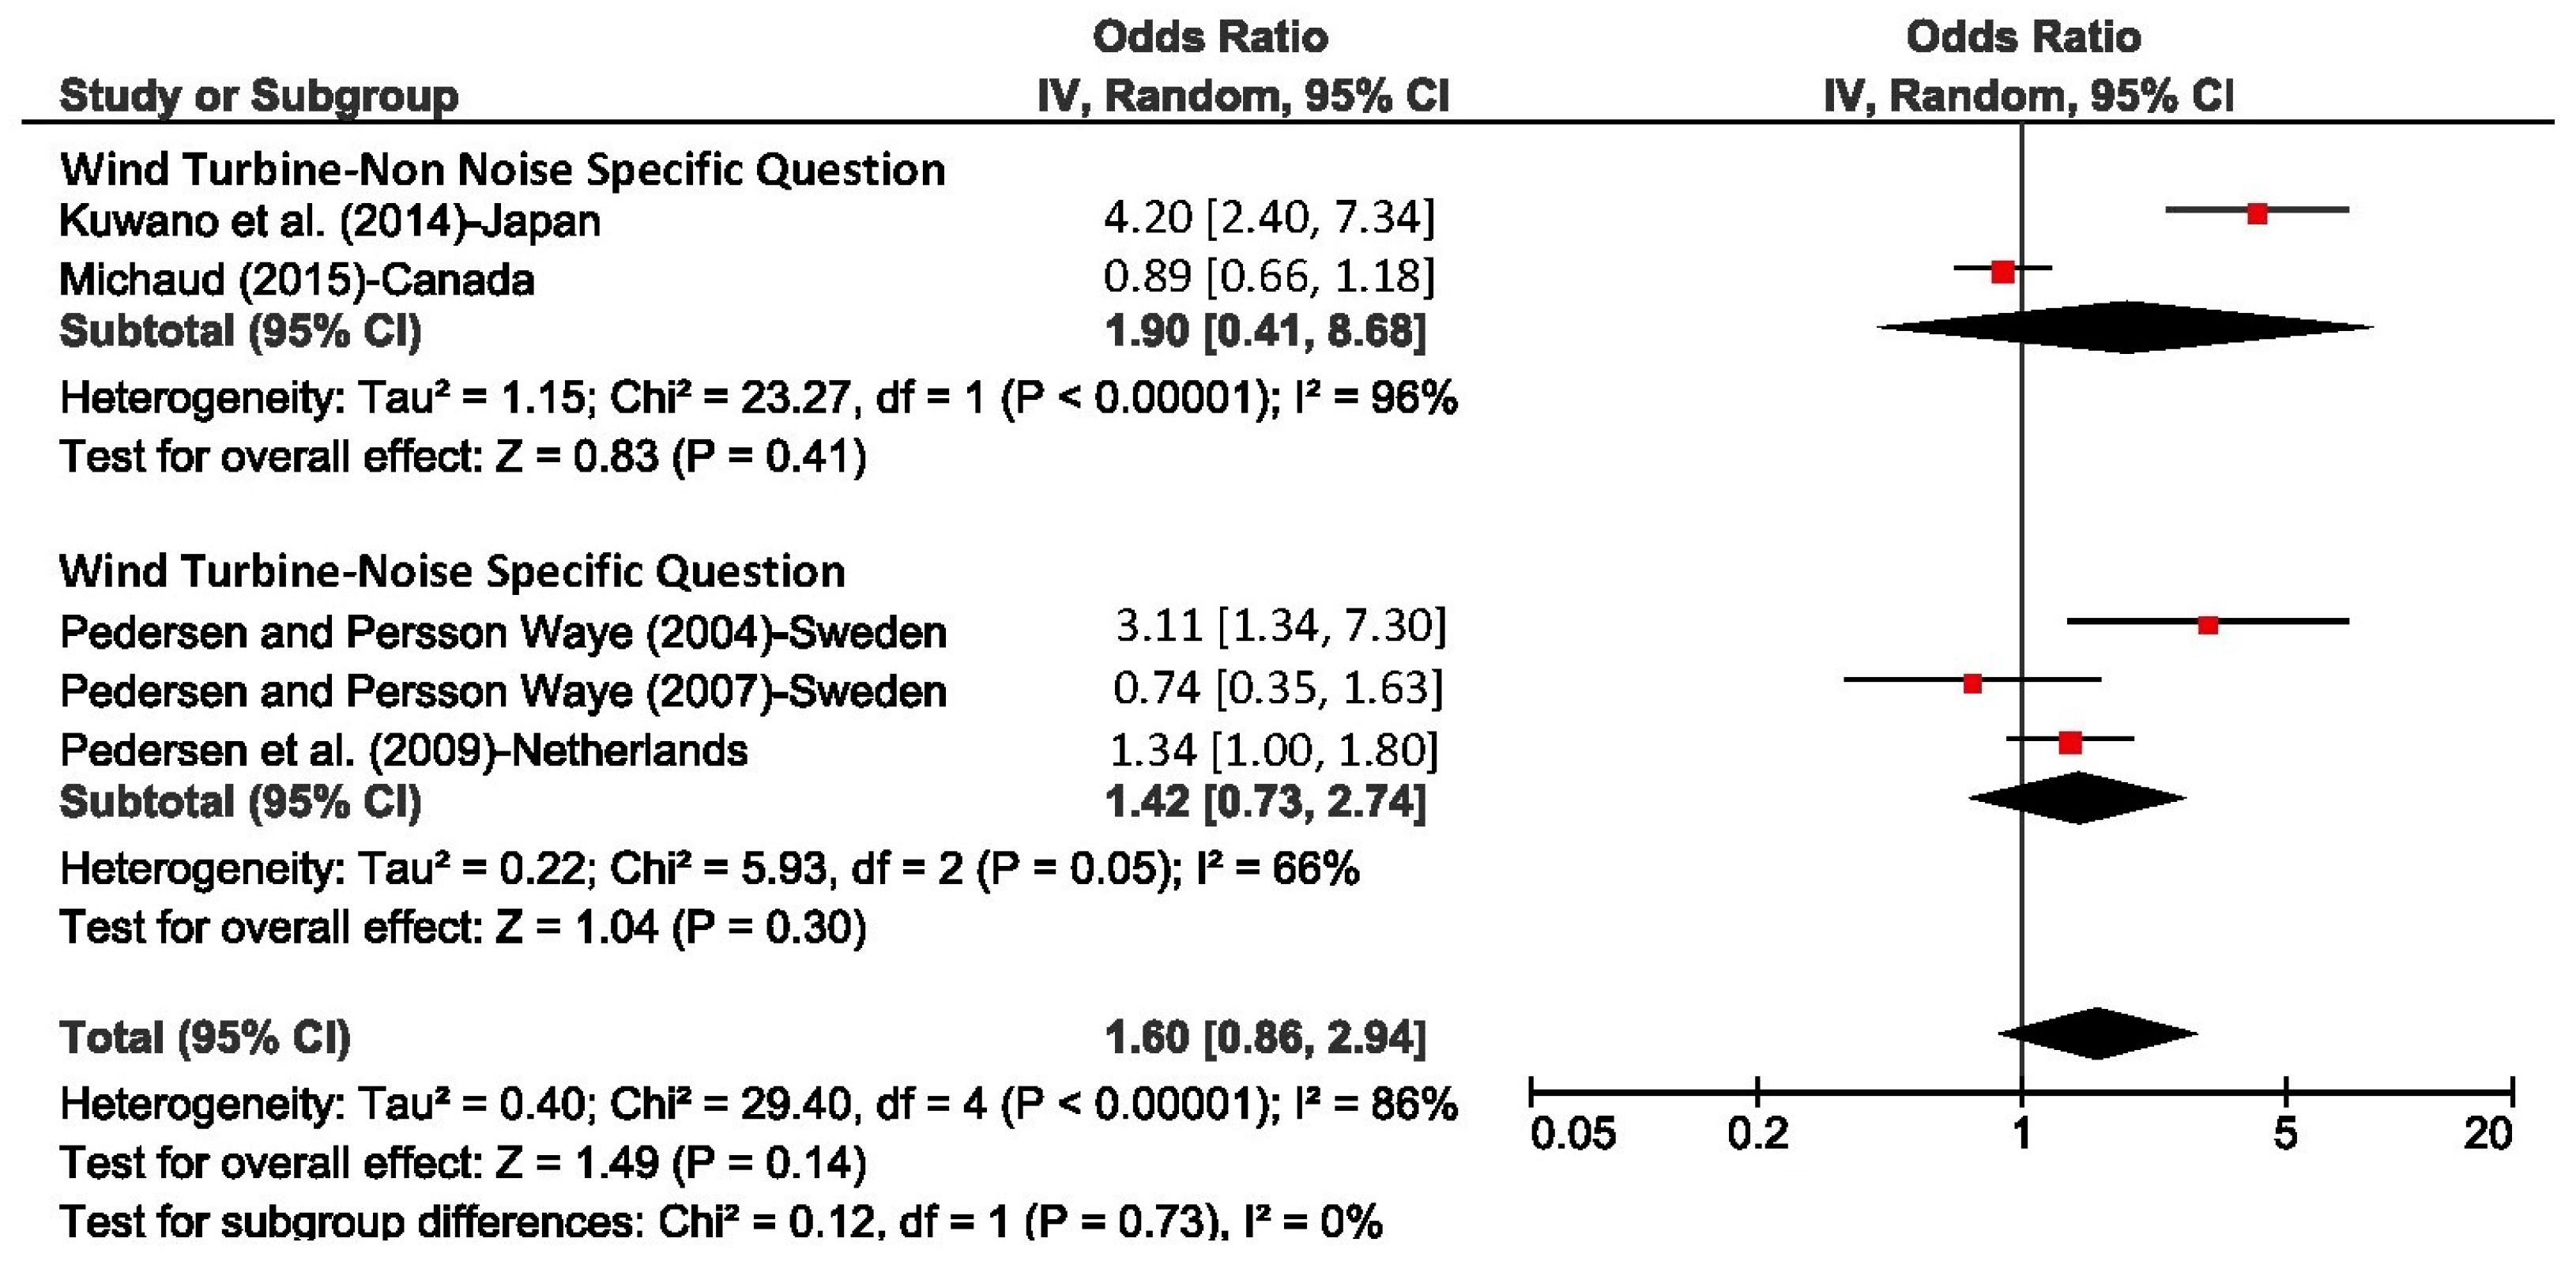
5.1. Literature Review
5.2. Conclusions
6. Hospital Noise
6.1. Literature Review
6.2. Conclusions
7. Additional Sleep Outcome Measures
7.1. Cardiac and Blood Pressure Outcome Measures during Sleep in Adults
7.2. Motility Measured Sleep Outcomes in Adults
7.3. Sleep Disturbance in Children
8. Summary of Available Evidence
9. Conclusions
Supplementary Materials
Acknowledgments
Author Contributions
Conflicts of Interest
References
- Watson, N.F.; Badr, M.S.; Belenky, G.; Bliwise, D.L.; Buxton, O.M.; Buysse, D.; Dinges, D.F.; Gangwisch, J.; Grandner, M.A.; Kushida, C.; et al. Joint consensus statement of the American Academy of Sleep Medicine and Sleep Research Society on the recommended amount of sleep for a healthy adult: Methodology and discussion. Sleep 2015, 38, 1161–1183. [Google Scholar] [PubMed]
- Banks, S.; Dinges, D.F. Behavioral and physiological consequences of sleep restriction. J. Clin. Sleep Med. 2007, 3, 519–528. [Google Scholar] [PubMed]
- Basner, M.; Babisch, W.; Davis, A.; Brink, M.; Clark, C.; Janssen, S.; Stansfeld, S. Auditory and non-auditory effects of noise on health. Lancet 2014, 383, 1325–1332. [Google Scholar] [CrossRef]
- Muzet, A. Environmental noise, sleep and health. Sleep Med. Rev. 2007, 11, 135–142. [Google Scholar] [CrossRef] [PubMed]
- Dettoni, J.L.; Consolim-Colombo, F.M.; Drager, L.F.; Rubira, M.C.; Souza, S.B.; Irigoyen, M.C.; Mostarda, C.; Borile, S.; Krieger, E.M.; Moreno, H., Jr.; et al. Cardiovascular effects of partial sleep deprivation in healthy volunteers. J. Appl. Physiol. 2012, 113, 232–236. [Google Scholar] [CrossRef] [PubMed]
- Buxton, O.M.; Cain, S.W.; O’Connor, S.P.; Porter, J.H.; Duffy, J.F.; Wang, W.; Czeisler, C.A.; Shea, S.A. Adverse metabolic consequences in humans of prolonged sleep restriction combined with circadian disruption. Sci. Transl. Med. 2012, 4, 129ra143. [Google Scholar] [CrossRef] [PubMed]
- Buxton, O.M.; Pavlova, M.; Reid, E.W.; Wang, W.; Simonson, D.C.; Adler, G.K. Sleep restriction for 1 week reduces insulin sensitivity in healthy men. Diabetes 2010, 59, 2126–2133. [Google Scholar] [CrossRef] [PubMed]
- Taheri, S.; Lin, L.; Austin, D.; Young, T.; Mignot, E. Short sleep duration is associated with reduced leptin, elevated ghrelin, and increased body mass index. PLoS Med. 2004, 1, e62. [Google Scholar] [CrossRef] [PubMed]
- Prather, A.A.; Hall, M.; Fury, J.M.; Ross, D.C.; Muldoon, M.F.; Cohen, S.; Marsland, A.L. Sleep and antibody response to hepatitis B vaccination. Sleep 2012, 35, 1063–1069. [Google Scholar] [CrossRef] [PubMed]
- Diekelmann, S.; Born, J. The memory function of sleep. Nat. Rev. Neurosci. 2010, 11, 114–126. [Google Scholar] [CrossRef] [PubMed]
- Xie, L.; Kang, H.; Xu, Q.; Chen, M.J.; Liao, Y.; Thiyagarajan, M.; O’Donnell, J.; Christensen, D.J.; Nicholson, C.; Iliff, J.J.; et al. Sleep drives metabolite clearance from the adult brain. Science 2013, 342, 373–377. [Google Scholar] [CrossRef] [PubMed]
- Lim, A.S.; Kowgier, M.; Yu, L.; Buchman, A.S.; Bennett, D.A. Sleep fragmentation and the risk of incident alzheimer’s disease and cognitive decline in older persons. Sleep 2013, 36, 1027–1032. [Google Scholar] [CrossRef] [PubMed]
- Somers, V.K.; White, D.P.; Amin, R.; Abraham, W.T.; Costa, F.; Culebras, A.; Daniels, S.; Floras, J.S.; Hunt, C.E.; Olson, L.J.; et al. Sleep apnea and cardiovascular disease: An American Heart Association/American College of Cardiology Foundation Scientific Statement from the American Heart Association Council for High Blood Pressure Research Professional Education Committee, Council on Clinical Cardiology, Stroke Council, and Council on Cardiovascular Nursing. J. Am. Coll. Cardiol. 2008, 52, 686–717. [Google Scholar] [PubMed]
- Fritschi, L.; Brown, A.L.; Kim, R.; Schwela, D.H.; Kephalopoulos, S. Burden of Disease from Environmental Noise; 978 92 890 0229 5; World Health Organization (WHO): Bonn, Germany, 2011. [Google Scholar]
- Basner, M.; Brink, M.; Elmenhorst, E.M. Critical appraisal of methods for the assessment of noise effects on sleep. Noise Health 2012, 14, 321–329. [Google Scholar] [CrossRef] [PubMed]
- Rechtschaffen, A.; Kales, A.; Berger, R.J.; Dement, W.C.; Jacobsen, A.; Johnson, L.C.; Jouvet, M.; Monroe, L.J.; Oswald, I.; Roffwarg, H.P.; et al. A Manual of Standardized Terminology, Techniques and Scoring System for Sleep Stages of Human Subjects; Public Health Service, U.S. Government, Printing Office: Washington, DC, USA, 1968. [Google Scholar]
- Iber, C.; Ancoli-Israel, S.; Chesson, A.; Quan, S.F. The AASM Manual for the Scoring of Sleep and Associated Events: Rules, Terminology and Technical Specifications; American Academy of Sleep Medicine: Westchester, IL, USA, 2007. [Google Scholar]
- Wesensten, N.J.; Balkin, T.J.; Belenky, G. Does sleep fragmentation impact recuperation? A review and reanalysis. J. Sleep Res. 1999, 8, 237–245. [Google Scholar] [CrossRef] [PubMed]
- Danker-Hopfe, H.; Anderer, P.; Zeitlhofer, J.; Boeck, M.; Dorn, H.; Gruber, G.; Heller, E.; Loretz, E.; Moser, D.; Parapatics, S.; et al. Interrater reliability for sleep scoring according to the Rechtschaffen & Kales and the new AASM standard. J. Sleep Res. 2009, 18, 74–84. [Google Scholar] [PubMed]
- Basner, M.; Griefahn, B.; Müller, U.; Plath, G.; Samel, A. An ECG-based algorithm for the automatic identification of autonomic activations associated with cortical arousal. Sleep 2007, 30, 1349–1361. [Google Scholar] [CrossRef] [PubMed]
- Ancoli-Israel, S.; Cole, R.; Alessi, C.; Chambers, M.; Moorcroft, W.; Pollak, C.P. The role of actigraphy in the study of sleep and circadian rhythms. Sleep 2003, 26, 342–392. [Google Scholar] [CrossRef] [PubMed]
- Miedema, H.M.; Vos, H. Associations between self-reported sleep disturbance and environmental noise based on reanalyses of pooled data from 24 studies. Behav. Sleep Med. 2007, 5, 1–20. [Google Scholar] [CrossRef] [PubMed]
- Dang-Vu, T.T.; McKinney, S.M.; Buxton, O.M.; Solet, J.M.; Ellenbogen, J.M. Spontaneous brain rhythms predict sleep stability in the face of noise. Curr. Biol. 2010, 20, R626–R627. [Google Scholar] [CrossRef] [PubMed]
- Smith, M.G.; Croy, I.; Ogren, M.; Persson Waye, K. On the influence of freight trains on humans: A laboratory investigation of the impact of nocturnal low frequency vibration and noise on sleep and heart rate. PLoS ONE 2013, 8, e5582. [Google Scholar] [CrossRef] [PubMed]
- Basner, M.; Müller, U.; Griefahn, B. Practical guidance for risk assessment of traffic noise effects on sleep. Appl. Acoust. 2010, 71, 518–522. [Google Scholar] [CrossRef]
- Fidell, S.; Tabachnick, B.; Mestre, V.; Fidell, L. Aircraft noise-induced awakenings are more reasonably predicted from relative than from absolute sound exposure levels. J. Acoust. Soc. Am. 2013, 134, 3645–3653. [Google Scholar] [CrossRef] [PubMed]
- Bonnet, M.H. Performance and sleepiness as a function of frequency and placement of sleep disruption. Psychophysiology 1986, 23, 263–271. [Google Scholar] [CrossRef] [PubMed]
- Basner, M.; Müller, U.; Elmenhorst, E.-M. Single and combined effects of air, road, and rail traffic noise on sleep and recuperation. Sleep 2011, 34, 11–23. [Google Scholar] [CrossRef] [PubMed]
- Brink, M.; Basner, M.; Schierz, C.; Spreng, M.; Scheuch, K.; Bauer, G.; Stahel, W. Determining physiological reaction probabilities to noise events during sleep. Somnologie 2009, 13, 236–243. [Google Scholar] [CrossRef]
- Bonnet, M.; Arand, D.L. EEG arousal norms by age. J. Clin. Sleep Med. 2007, 3, 271–274. [Google Scholar] [PubMed]
- Cassel, W.; Ploch, T.; Griefahn, B.; Speicher, T.; Loh, A.; Penzel, T.; Koehler, U.; Canisius, S. Disturbed sleep in obstructive sleep apnea expressed in a single index of sleep disturbance (SDI). Somnol. Schlafforschung Schlafmed. 2008, 12, 158–164. [Google Scholar] [CrossRef]
- Basner, M. Nocturnal aircraft noise increases objectively assessed daytime sleepiness. Somnologie 2008, 12, 110–117. [Google Scholar] [CrossRef]
- Elmenhorst, E.M.; Elmenhorst, D.; Wenzel, J.; Quehl, J.; Mueller, U.; Maass, H.; Vejvoda, M.; Basner, M. Effects of nocturnal aircraft noise on cognitive performance in the following morning: Dose-response relationships in laboratory and field. Int. Arch. Occup. Environ. Health 2010, 83, 743–751. [Google Scholar] [CrossRef] [PubMed]
- Jarup, L.; Babisch, W.; Houthuijs, D.; Pershagen, G.; Katsouyanni, K.; Cadum, E.; Dudley, M.L.; Savigny, P.; Seiffert, I.; Swart, W.; et al. Hypertension and exposure to noise near airports: The HYENA study. Environ. Health Perspect. 2008, 116, 329–333. [Google Scholar] [CrossRef] [PubMed]
- Basner, M.; Isermann, U.; Samel, A. Aircraft noise effects on sleep: Application of the results of a large polysomnographic field study. J. Acoust. Soc. Am. 2006, 119, 2772–2784. [Google Scholar] [CrossRef] [PubMed]
- Night Noise Guidelines for Europe; World Health Organisation (WHO): Copenhagen, Denmark, 2009; Available online: http://www.euro.who.int/Document/E92845.pdf (accessed on 7 March 2018).
- Pearsons, K.; Barber, D.; Tabachnick, B.G.; Fidell, S. Predicting noise-induced sleep disturbance. J. Acoust. Soc. Am. 1995, 97, 331–338. [Google Scholar] [CrossRef]
- Munzel, T.; Gori, T.; Babisch, W.; Basner, M. Cardiovascular effects of environmental noise exposure. Eur. Heart J. 2014, 35, 829–836. [Google Scholar] [CrossRef] [PubMed]
- Vienneau, D.; Schindler, C.; Perez, L.; Probst-Hensch, N.; Röösli, M. The relationship between transportation noise exposure and ischemic heart disease: A meta-analysis. Environ. Res. 2015, 138, 372–380. [Google Scholar] [CrossRef] [PubMed]
- Shea, B.J.; Grimshaw, J.M.; Wells, G.A.; Boers, M.; Andersson, N.; Hamel, C.; Porter, A.C.; Tugwell, P.; Moher, D.; Bouter, L.M. Development of AMSTAR: A measurement tool to assess the methodological quality of systematic reviews. BMC Med. Res. Methodol. 2007, 7, 10. [Google Scholar] [CrossRef] [PubMed] [Green Version]
- Colby, D.; Dobie, R.; Leventhall, G.; Lipscomb, D.M.; McCunney, R.J.; Seilo, M.T.; Sondergaard, B. Wind Turbine Sound and Health Effects: An Expert Panel Review; American Wind Energy Association and Canadian Wind Energy Association: Washington, DC, USA; Ottawa, ON, Canada, 2009; Available online: http://canwea.ca/pdf/talkwind/Wind_Turbine_Sound_and_Health_Effects.pdf (accessed on 7 March 2018).
- Drahota, A.; Ward, D.; Mackenzie, H.; Stores, R.; Higgins, B.; Gal, D.; Dean, T.P. Sensory Environment on Health-Related Outcomes of Hospital Patients; The Cochrane Library: Hoboken, NJ, USA, 2012. [Google Scholar]
- Ellenbogen, J.; Grace, S.; Heiger-Bernays, W.; Manwell, J.; Mills, D.; Sullivan, K.; Weisskopf, M. Wind Turbine Health Impact Study: Report of Independent Expert Panel. Masschusetts Department of Environmental Protection, Massachusetts Department of Public Health, 2012. Available online: http://www.mass.gov/eea/docs/dep/energy/wind/turbine-impact-study.pdf (accessed on 7 March 2018).
- Knopper, L.D.; Ollson, C.A. Health effects and wind turbines: A review of the literature. Environ. Health 2011, 10, 78. [Google Scholar] [CrossRef] [PubMed]
- Konkani, A.; Oakley, B. Noise in hospital intensive care units—A critical review of a critical topic. J. Crit. Care 2012, 27. [Google Scholar] [CrossRef] [PubMed]
- Kurpas, D.; Mroczek, B.; Karakiewicz, B.; Kassolik, K.; Andrzejewski, W. Health impact of wind farms. Ann. Agric. Environ. Med. 2013, 20, 595–605. [Google Scholar] [PubMed]
- Maschke, C.; Harder, J.; Cornélissen, G.; Hecht, K.; Otsuka, K.; Halberg, F. Chronoecoepidemiology of “strain”: Infradian chronomics of urinary cortisol and catecholamines during nightly exposure to noise. Biomed. Pharmacother. 2003, 57, 126–135. [Google Scholar] [CrossRef]
- Pedersen, E. Health aspects associated with wind turbine noise—Results from three field studies. Noise Control Eng. J. 2011, 59, 47–53. [Google Scholar] [CrossRef]
- Redeker, N.S. Sleep in acute care settings: An integrative review. J. Nurs. Scholarsh. 2000, 32, 31–38. [Google Scholar] [CrossRef] [PubMed]
- Banerjee, D. Research on road traffic noise and human health in India: Review of literature from 1991 to current. Noise Health 2012, 14, 113–118. [Google Scholar] [PubMed]
- Ristovska, G.; Lekaviciute, J. Environmental noise and sleep disturbance: Research in Central, Eastern and South-Eastern Europe and Newly Independent States. Noise Health 2013, 15, 6–11. [Google Scholar] [CrossRef] [PubMed]
- Laszlo, H.; McRobie, E.; Stansfeld, S.; Hansell, A. Annoyance and other reaction measures to changes in noise exposure—A review. Sci. Total Environ. 2012, 435, 551–562. [Google Scholar] [CrossRef] [PubMed]
- Laszlo, H.; Janssen, S.; Babisch, W.; Hansell, A. Noise sensitivity and sleep disturbance. In Proceedings of the 41st International Congress and Exposition on Noise Control Engineering, InterNoise, New York, NY, USA, 19–22 August 2012; pp. 9521–9529. [Google Scholar]
- Perron, S.; Tétreault, L.F.; King, N.; Plante, C.; Smargiassi, A. Review of the effect of aircraft noise on sleep disturbance in adults. Noise Health 2012, 14, 58–67. [Google Scholar] [CrossRef] [PubMed]
- Omlin, S.; Bauer, G.F.; Brink, M. Effects of noise from non-traffic-related ambient sources on sleep: Review of the literature of 1990–2010. Noise Health 2011, 13, 299–309. [Google Scholar] [CrossRef] [PubMed]
- Merlin, T.; Newton, S.; Ellery, B.; Milverton, J.; Farah, C. Systematic Review of the Human Health Effects of Wind Farms; National Health and Medical Research Council: Canberra, Australia, 2013. Available online: https://www.nhmrc.gov.au/_files_nhmrc/publications/attachments/eh54_systematic_review_of_the_human_health_effects_of_wind_farms_december_2013.pdf (accessed on 7 March 2018).
- Basner, M.; Buess, H.; Elmenhorst, D.; Gerlich, A.; Luks, N.; Maaß, H.; Mawet, L.; Müller, E.W.; Müller, U.; Plath, G.; et al. Effects of Nocturnal Aircraft Noise (Volume 1): Executive Summary; FB2004-07/E; Deutsches Zentrum für Luft- und Raumfahrt (DLR): Cologne, Germany, 2004; ISSN 1434-8454. [Google Scholar]
- Hume, K.; Whitehead, C. Sleep disturbance due to introduced aircraft noise. In Proceedings of the 8th International Congress on Noise as a Public Health Problem, Schiedam, The Netherlands, 29 June–3 July 2003; pp. 199–200. [Google Scholar]
- Jean-Louis, G.; Kripke, D.F.; Mason, W.J.; Elliott, J.A.; Youngstedt, S.D. Sleep estimation from wrist movement quantified by different actigraphic modalities. J. Neurosci. Methods 2001, 105, 185–191. [Google Scholar] [CrossRef]
- Elmenhorst, E.M.; Pennig, S.; Rolny, V.; Quehl, J.; Mueller, U.; Maass, H.; Basner, M. Examining nocturnal railway noise and aircraft noise in the field: Sleep, psychomotor performance, and annoyance. Sci. Total Environ. 2012, 424, 48–56. [Google Scholar] [CrossRef] [PubMed]
- Aasvang, G.M.; Overland, B.; Ursin, R.; Moum, T. A field study of effects of road traffic and railway noise on polysomnographic sleep parameters. J. Acoust. Soc. Am. 2011, 129, 3716–3726. [Google Scholar] [CrossRef] [PubMed]
- Flindell, I.H.; Bullmore, A.J.; Robertson, K.A.; Wright, N.A.; Turner, C.; Birch, C.L.; Jiggins, M.; Berry, B.F.; Davison, M.; Dix, N. Aircraft Noise and Sleep, 1999 UK Trial Methodology Study; ISVR Consultancy Services; Institute of Sound and Vibration Research, University of Southampton: Southampton, UK, 2000. [Google Scholar]
- Agnew, H.W., Jr.; Webb, W.B.; Williams, R.L. The first night effect: An EEG study of sleep. Psychophysiology 1966, 2, 263–266. [Google Scholar] [CrossRef] [PubMed]
- Passchier-Vermeer, W.; Vos, H.; Steenbekkers, J.H.M.; Van der Ploeg, F.D.; Groothuis-Oudshoorn, K. Sleep Disturbance and Aircraft Noise Exposure-Exposure Effect Relationships; TNO: The Hague, The Netherlands, 2002. [Google Scholar]
- Basner, M.; Griefahn, B.; Penzel, T. Inter-rater agreement in sleep stage classification between centers with different backgrounds. Somnol. Schlafforschung Schlafmed. 2008, 12, 75–84. [Google Scholar] [CrossRef]
- Bodin, T.; Björk, J.; Ardö, J.; Albin, M. Annoyance, sleep and concentration problems due to combined traffic noise and the benefit of quiet side. Int. J. Environ. Res. Public Health 2015, 12, 1612–1628. [Google Scholar] [CrossRef] [PubMed]
- Halonen, J.I.; Vahtera, J.; Stansfeld, S.; Yli-Tuomi, T.; Salo, P.; Pentti, J.; Kivimaki, M.; Lanki, T. Associations between Nighttime Traffic Noise and Sleep: The Finnish Public Sector Study. Environ. Health Perspect. 2012, 120, 1391–1396. [Google Scholar] [CrossRef] [PubMed]
- Roth, T. Insomnia: Definition, prevalence, etiology, and consequences. J. Clin. Sleep Med. 2007, 3, S7–S10. [Google Scholar] [PubMed]
- Nguyen, L.T.; Nguyen, T.L.; Yano, T.; Morinaga, M.; Yamada, I.; Sato, T.; Nishimura, T. Social surveys around Noi Bai Airport before and after the opening of a new terminal building. In Proceedings of the 44th International Congress and Exposition on Noise Control Engineering, InterNoise, San Franciso, CA, USA, 9–12 August 2015. [Google Scholar]
- Yano, T.; Nguyen, T.L.; Nguyen, T.L.; Takada, M.; Yamada, I.; Morinaga, M.; Sato, T.; Nishimura, T. Community response to a step change in aircraft noise exposure: The first socio-acoustic survey around Noi Bai Airport in Hanoi. In Proceedings of the International Congress on Sound and Vibration (22ICSV), Florence, Italy, 12–16 July 2015. [Google Scholar]
- Nguyen, T.L.; Yano, T.; Nguyen, H.Q.; Khanh Tuyen Thi, N.; Hiroaki, F.; Keiji, K.; Tsuyoshi, N.; Tetsumi, S. Aircraft and road traffic noise annoyance in Da Nang City, Vietnam. In Proceedings of the 41th International Congress and Exposition on Noise Control Engineering, InterNoise, New York, NY, USA, 19–22 August 2012; pp. 2305–2314. [Google Scholar]
- Nguyen, T.L.; Yano, T.; Nguyen, H.Q.; Hoang, T.L.; Nishimura, T.; Morihara, T.; Hashimoto, Y.; Sato, T. Community response to aircraft and combined noises in Hanoi. In Proceedings of the 39th International Congress and Exposition on Noise Control Engineering, InterNoise, Lisbon, Portugal, 13–16 June 2010; pp. 2740–2749. [Google Scholar]
- Nguyen, T.L.; Yano, T.; Nguyen, H.Q.; Nishimura, T.; Fukushima, H.; Sato, T.; Morihara, T.; Hashimoto, Y. Community response to aircraft noise in Ho Chi Minh City and Hanoi. Appl. Acoust. 2011, 72, 814–822. [Google Scholar] [CrossRef]
- Nguyen, T.L.; Yano, T.; Nishimura, T.; Sato, T. Social survey on community response to aircraft noise in Ho Chi Minh city. In Proceedings of the 38th International Congress and Exposition on Noise Control Engineering, InterNoise, Ottawa, ON, Canada, 23–26 August 2009; pp. 1146–1154. [Google Scholar]
- Schreckenberg, D.; Heudorf, U.; Eikmann, T.; Meis, M. Aircraft noise and health of residents living in the vicinity of Frankfurt airport. In Proceedings of the Euronoise, Edinburgh, UK, 26–28 October 2009. [Google Scholar]
- Brink, M.; Wirth, K.; Rometsch, R.; Schierz, C. Lärmstudie 2000 Zusammenfassung. ETH Zürich, Zentrum für Organisations- und Arbeitswissenschaften; Switzerland, E.Z., Ed.; Institute for Organizational and Occupational Sciences (ZOA): Zurich, Switzerland, 2005. [Google Scholar]
- Brink, M. Parameters of well-being and subjective health and their relationship with residential traffic noise exposure—A representative evaluation in Switzerland. Environ. Int. 2011, 37, 723–733. [Google Scholar] [CrossRef] [PubMed]
- Sato, T.; Yano, T.; Björkman, M.; Rylander, R. Comparison of community response to road traffic noise in Japan and Sweden—Part I: Outline of surveys and dose–response relationships. J. Sound Vib. 2002, 250, 161–167. [Google Scholar] [CrossRef]
- Phan, H.Y.T.; Yano, T.; Phan, H.A.T.; Nishimura, T.; Sato, T.; Hashimoto, Y. Community responses to road traffic noise in Hanoi and Ho Chi Minh City. Appl. Acoust. 2010, 71, 107–114. [Google Scholar] [CrossRef]
- Shimoyama, K.; Nguyen, T.L.; Yano, T.; Morihara, T. Social surveys on community response to road traffic in five cities in Vietnam. In Proceedings of the 43th International Congress and Exposition on Noise Control Engineering, InterNoise, Melbourne, Australia, 16–19 November 2014; pp. 815–822. [Google Scholar]
- Brown, A.L.; Lam, K.C.; van Kamp, I. Quantification of the exposure and effects of road traffic noise in a dense Asian city: A comparison with western cities. Environ. Health 2015, 14, 22. [Google Scholar] [CrossRef] [PubMed]
- Hong, J.; Kim, J.; Lim, C.; Kim, K.; Lee, S. The effects of long-term exposure to railway and road traffic noise on subjective sleep disturbance. J. Acoust. Soc. Am. 2010, 128, 2829–2835. [Google Scholar] [CrossRef] [PubMed]
- Ristovska, G.; Gjorgjev, D.; Stikova, E.; Petrova, V.; Cakar, M.D. Noise induced sleep disturbance in adult population: Cross sectional study in Skopje urban centre. Maced. J. Med. Sci. 2009, 2, 255–260. [Google Scholar] [CrossRef]
- Frei, P.; Mohler, E.; Röösli, M. Effect of nocturnal road traffic noise exposure and annoyance on objective and subjective sleep quality. Int. J. Hyg. Environ. Health 2014, 217, 188–195. [Google Scholar] [CrossRef] [PubMed]
- Sato, T.; Yano, T.; Morihara, T.; Masden, K. Relationships between rating scales, question stem wording, and community responses to railway noise. J. Sound Vib. 2004, 277, 609–616. [Google Scholar] [CrossRef]
- Schreckenberg, D. Exposure-response relationship for railway noise annoyance in the Middle Rhine Valley. In Proceedings of the 42th Interational Congress and Exposition on Noise Control Engineering, InterNoise, Innsbruck, Austria, 15–18 September 2013; pp. 4997–5006. [Google Scholar]
- Janssen, S.A.; Vos, H. A Comparison of Recent Surveys to Aircraft Noise Exposure-Response Relationships; TNO Report; TNO-034-DTM-2009–01799; TNO: The Hague, The Netherlands, 2009. [Google Scholar]
- Öhrström, E.; Gidlöf-Gunnarsson, A.; Ögren, M.; Jerson, T. Comparative field studies on the effects of railway and road traffic noise. In Proceedings of the 39th International Congress and Exposition on Noise Control Engineering, InterNoise, Lisbon, Portugal, 15–16 June 2010; pp. 526–534. [Google Scholar]
- Bodin, T.; Björk, J.; Öhrström, E.; Ardö, J.; Albin, M. Survey context and question wording affects self reported annoyance due to road traffic noise: A comparison between two cross-sectional studies. Environ. Health 2012, 11, 1–9. [Google Scholar] [CrossRef] [PubMed]
- Barker, S.; Tarnopolsky, A. Assessing bias in surveys of symptoms attributed to noise. J. Sound Vib. 1978, 59, 349–354. [Google Scholar] [CrossRef]
- Janssen, S.; Vos, H. Dose-Response Relationship between DNL and Aircraft Noise Annoyance: Contribution of TNO; TNO: The Hague, The Netherlands, 2011. [Google Scholar]
- Pedersen, E.; Persson Waye, K. Perception and annoyance due to wind turbine noise—A dose-response relationship. J. Acoust. Soc. Am. 2004, 116, 3460–3470. [Google Scholar] [CrossRef] [PubMed]
- Pedersen, E.; Persson Waye, K. Wind turbine noise, annoyance and self-reported health and well-being in different living environments. Occup. Environ. Med. 2007, 64, 480–486. [Google Scholar] [CrossRef] [PubMed]
- Bakker, R.H.; Pedersen, E.; van den Berg, G.P.; Stewart, R.E.; Lok, W.; Bouma, J. Impact of wind turbine sound on annoyance, self-reported sleep disturbance and psychological distress. Sci. Total Environ. 2012, 425, 42–51. [Google Scholar] [CrossRef] [PubMed]
- Pawlaczyk-Luszczynska, M.; Dudarewicz, A.; Zaborowski, K.; Zamojska-Daniszewska, M.; Waszkowska, M. Evaluation of annoyance from the wind turbine noise: A pilot study. Int. J. Occup. Med. Environ. Health 2014, 27, 364–388. [Google Scholar] [CrossRef] [PubMed]
- Kuwano, S.; Yano, T.; Kageyama, T.; Sueoka, S.; Tachibana, H. Social survey on wind turbine noise in Japan. Noise Control Eng. J. 2014, 62, 503–520. [Google Scholar] [CrossRef]
- Michaud, D.S. Self-reported and objectively measured outcomes assessed in the Health Canada Wind Turbine Noise and Health Sttudy: Results support an increase in community annoyance. In Proceedings of the 44nd International Congress and Exposition on Noise Control Engineering, InterNoise, San Francisco, CA, USA, 9–12 August 2015. [Google Scholar]
- Onakpoya, I.J.; O’Sullivan, J.; Thompson, M.J.; Heneghan, C.J. The effect of wind turbine noise on sleep and quality of life: A systematic review and meta-analysis of observational studies. Environ. Int. 2015, 82, 1–9. [Google Scholar] [CrossRef] [PubMed]
- Schmidt, J.H.; Klokker, M. Health effects related to wind turbine noise exposure: A systematic review. PLoS ONE 2014, 9, e114183. [Google Scholar] [CrossRef] [PubMed]
- Lane, J. Assocation between Industrial Wind Trubine Noise and Sleep Quality in a Comparison Sample of Rural Ontarians. University of Waterloo, 2013. Available online: https://uwspace.uwaterloo.ca/bitstream/handle/10012/7533/Lane_James.pdf?sequence=1 (accessed on 7 March 2018).
- Pedersen, E.; van den Berg, F.; Bakker, R.; Bouma, J. Response to noise from modern wind farms in The Netherlands. J. Acoust. Soc. Am. 2009, 126, 634–643. [Google Scholar] [CrossRef] [PubMed]
- Aaron, J.N.; Carlisle, C.C.; Carskadon, M.A.; Meyer, T.J.; Hill, N.S.; Millman, R.P. Environmental noise as a cause of sleep disruption in an intermediate respiratory care unit. Sleep 1996, 19, 707–710. [Google Scholar] [CrossRef] [PubMed]
- Elliott, R.; McKinley, S.; Cistulli, P.; Fien, M. Characterisation of sleep in intensive care using 24-hour polysomnography: An observational study. Crit. Care 2013, 17, R46. [Google Scholar] [CrossRef] [PubMed]
- Freedman, N.S.; Gazendam, J.; Levan, L.; Pack, A.I.; Schwab, R.J. Abnormal sleep/wake cycles and the effect of environmental noise on sleep disruption in the intensive cave unit. Am. J. Respir. Crit. Care Med. 2001, 163, 451–457. [Google Scholar] [CrossRef] [PubMed]
- Gabor, J.Y.; Cooper, A.B.; Crombach, S.A.; Lee, B.; Kadikar, N.; Bettger, H.E.; Hanly, P.J. Contribution of the intensive care unit environment to sleep disruption in mechanically ventilated patients and healthy subjects. Am. J. Respir. Crit. Care Med. 2003, 167, 708–715. [Google Scholar] [CrossRef] [PubMed]
- Adachi, M.; Staisiunas, P.G.; Knutson, K.L.; Beveridge, C.; Meltzer, D.O.; Arora, V.M. Perceived control and sleep in hospitalized older adults: A sound hypothesis? J. Hosp. Med. 2013, 8, 184–190. [Google Scholar] [CrossRef] [PubMed]
- Missildine, K.; Bergstrom, N.; Meininger, J.; Richards, K.; Foreman, M.D. Sleep in Hospitalized Elders: A Pilot Study. Geriatr. Nurs. 2010, 31, 263–271. [Google Scholar] [CrossRef] [PubMed]
- Yoder, J.C.; Staisiunas, P.G.; Meltzer, D.O.; Knutson, K.L.; Arora, V.M. Noise and sleep among adult medical inpatients: Far from a quiet night. Arch. Intern. Med. 2012, 172, 68–70. [Google Scholar] [CrossRef] [PubMed]
- Corser, N.C. Sleep of 1- and 2-year-old children in intensive care. Issues Compr. Pediatr. Nurs. 1996, 19, 17–31. [Google Scholar] [CrossRef] [PubMed]
- Cureton-Lane, R.A.; Fontaine, D.K. Sleep in the pediatric ICU: An empirical investigation. Am. J. Crit. Care 1997, 6, 56–63. [Google Scholar] [PubMed]
- Echols, J.L. Development of an Observational Tool to Identify a Patient’s Sleep Behavior; Catholic University of America: Washington, DC, USA, 1968. [Google Scholar]
- Kuhn, P.; Zores, C.; Langlet, C.; Escande, B.; Astruc, D.; Dufour, A. Moderate acoustic changes can disrupt the sleep of very preterm infants in their incubators. Acta Paediatr. 2013, 102, 949–954. [Google Scholar] [CrossRef] [PubMed]
- Kuhn, P.; Zores, C.; Pebayle, T.; Hoeft, A.; Langlet, C.; Escande, B.; Astruc, D.; Dufour, A. Infants born very preterm react to variations of the acoustic environment in their incubator from a minimum signal-to-noise ratio threshold of 5 to 10 dBA. Pediatr. Res. 2012, 71, 386–392. [Google Scholar] [CrossRef] [PubMed]
- Dennis, C.M.; Lee, R.; Woodard, E.K.; Szalaj, J.J.; Walker, C.A. Benefits of quiet time for neuro-intensive care patients. J. Neurosci. Nurs. 2010, 42, 217–224. [Google Scholar] [CrossRef] [PubMed]
- Gardner, G.; Collins, C.; Osborne, S.; Henderson, A.; Eastwood, M. Creating a therapeutic environment: A non-randomised controlled trial of a quiet time intervention for patients in acute care. Int. J. Nurs. Stud. 2009, 46, 778–786. [Google Scholar] [CrossRef] [PubMed] [Green Version]
- Walder, B.; Francioli, D.; Meyer, J.J.; Lancon, M.; Romand, J.A. Effects of guidelines implementation in a surgical intensive care unit to control nighttime light and noise levels. Crit. Care Med. 2000, 28, 2242–2247. [Google Scholar] [CrossRef] [PubMed]
- Thomas, K.P.; Salas, R.E.; Gamaldo, C.; Chik, Y.; Huffman, L.; Rasquinha, R.; Hoesch, R.E. Sleep rounds: A multidisciplinary approach to optimize sleep quality and satisfaction in hospitalized patients. J. Hosp. Med. 2012, 7, 508–512. [Google Scholar] [CrossRef] [PubMed]
- Duran, R.; Ciftdemir, N.A.; Ozbek, U.V.; Berberoglu, U.; Durankus, F.; Sut, N.; Acunas, B. The effects of noise reduction by earmuffs on the physiologic and behavioral responses in very low birth weight preterm infants. Int. J. Pediatr. Otorhinolaryngol. 2012, 76, 1490–1493. [Google Scholar] [CrossRef] [PubMed]
- Al-Samsam, R.H.; Cullen, P. Sleep and adverse environmental factors in sedated mechanically ventilated pediatric intensive care patients. Pediatr. Crit. Care Med. 2005, 6, 562–567. [Google Scholar] [CrossRef] [PubMed]
- Park, M.J.; Yoo, J.H.; Cho, B.W.; Kim, K.T.; Jeong, W.C.; Ha, M. Noise in hospital rooms and sleep disturbance in hospitalized medical patients. Environ. Health Toxicol. 2014, 29, e2014006. [Google Scholar] [CrossRef] [PubMed]
- Hsu, S.M.; Ko, W.J.; Liao, W.C.; Huang, S.J.; Chen, R.J.; Li, C.Y.; Hwang, S.L. Associations of exposure to noise with physiological and psychological outcomes among post-cardiac surgery patients in ICUs. Clinics 2010, 65, 985–989. [Google Scholar] [PubMed]
- Buysse, D.J.; Reynolds, C.F.; Monk, T.H.; Berman, S.R.; Kupfer, D.J. The Pittsburgh Sleep Quality Index: A new instrument for psychiatric practice and research. Psychiatry Res. 1989, 28, 193–213. [Google Scholar] [CrossRef]
- Haralabidis, A.S.; Dimakopoulou, K.; Vigna-Taglianti, F.; Giampaolo, M.; Borgini, A.; Dudley, M.L.; Pershagen, G.; Bluhm, G.; Houthuijs, D.; Babisch, W.; et al. Acute effects of night-time noise exposure on blood pressure in populations living near airports. Eur. Heart J. 2008, 29, 658–664. [Google Scholar] [CrossRef] [PubMed]
- Graham, J.M.A.; Janssen, S.A.; Vos, H.; Miedema, H.M.E. Habitual traffic noise at home reduces cardiac parasympathetic tone during sleep. Int. J. Psychophysiol. 2009, 72, 179–186. [Google Scholar] [CrossRef] [PubMed]
- Hong, J.; Lim, C.; Kim, J.; Lee, S. Assessment of sleep disturbance on night-time railway noise from the field survey. In Proceedings of the 35th International Congress and Exposition on Noise Control Engineering, InterNoise, Honolulu, HI, USA, 3–6 December 2006; pp. 4648–4656. [Google Scholar]
- Lercher, P.; Brink, M.; Rudisser, J.; Van Renterghem, T.; Botteldooren, D.; Baulac, M.; Defrance, J. The effects of railway noise on sleep medication intake: Results from the ALPNAP-study. Noise Health 2010, 12, 110–119. [Google Scholar] [CrossRef] [PubMed]
- Brink, M.; Müller, C.H.; Schierz, C. Contact-free measurement of heart rate, respiration rate, and body movements during sleep. Behav. Res. Methods 2006, 38, 511–521. [Google Scholar] [CrossRef] [PubMed]
- Öhrström, E.; Hadzibajramovic, E.; Holmes, M.; Svensson, H. Effects of road traffic noise on sleep: Studies on children and adults. J. Environ. Psychol. 2006, 26, 116–126. [Google Scholar] [CrossRef]
- Pirrera, S.; De Valck, E.; Cluydts, R. Field study on the impact of nocturnal road traffic noise on sleep: The importance of in- and outdoor noise assessment, the bedroom location and nighttime noise disturbances. Sci. Total Environ. 2014, 500–501, 84–90. [Google Scholar] [CrossRef] [PubMed]
- Griefahn, B.; Schuemer-Kohrs, A.; Schuemer, R.; Mohler, U.; Mehnert, P. Physiological, subjective, and behavioural responses to noise from rail and road traffic. Noise Health 2000, 3, 59–71. [Google Scholar] [PubMed]
- Passchier-Vermeer, W.; Vos, H.; Janssen, S.A.; Miedema, H.M. Sleep and Traffic Noise, Summary Report; TNO: Delft, The Netherlands, 2007. [Google Scholar]
- Eberhardt, J. The disturbance by road traffic noise of the sleep of prepubertal children as studied in the home. In Proceedings of the Noise as a Public Health Problem, Turin, Italy, 21–25 June 1983; pp. 65–74. [Google Scholar]
- Lercher, P.; Eisenmann, A.; Dekonick, L.; Botteldooren, D. The relation between disturbed sleep in children and traffic noise exposure in alpine valleys. In Proceedings of the 42nd International Congress and Exposition on Noise Control Engineering, InterNoise, Innsbruck, Austria, 15–18 September 2013. [Google Scholar]
- Ising, H.; Ising, M. Chronic Cortisol Increases in the First Half of the Night Caused by Road Traffic Noise. Noise Health 2002, 4, 13–21. [Google Scholar] [PubMed]
- Tiesler, C.M.T.; Birk, M.; Thiering, E.; Kohlboeck, G.; Koletzko, S.; Bauer, C.-P.; Berdel, D.; von Berg, A.; Babisch, W.; Heinrich, J.; et al. Exposure to road traffic noise and children’s behavioural problems and sleep disturbance: Results from the GINIplus and LISAplus studies. Environ. Res. 2013, 123, 1–8. [Google Scholar] [CrossRef] [PubMed]
- Stansfeld, S.; Hygge, S.; Clark, C.; Alfred, T. Night time aircraft noise exposure and children’s cognitive performance. Noise Health 2010, 12, 255–262. [Google Scholar] [CrossRef] [PubMed]


| Odds Ratio per 10 dBA (LAS,max) | Road (STRAIN and DEUFRAKO) | Aircraft (STRAIN) | Rail (DEUFRAKO) | Combined Estimate (Based on Road, Rail, and Aircraft) |
|---|---|---|---|---|
| Unadjusted | 1.36 (1.19–1.55) | 1.35 (1.22–1.50) | 1.35 (1.21–1.52) | 1.35 (1.25–1.45) |
| Adjusted for Age and Gender | 1.36 (1.19–1.55) | 1.35 (1.21–1.50) | 1.34 (1.19–1.50) | 1.28 (1.21–1.36) |
| Adjusted for Age, Gender, Day of the Week, and Time From Sleep Onset | 1.32 (1.15–1.50) | 1.32 (1.19–1.47) | 1.34 (1.19–1.51) | 1.29 (1.21–1.36) |
| Study | N | Country | Sleep Disturbance Questions | Noise Metric (Range for Obtained Data) |
|---|---|---|---|---|
| Falling Asleep (Total N = 6368) | ||||
| + Nguyen et al. (2015) [69] | 1095 | Hanoi, Vietnam | In daily life, when an airplane passes by, at what degree are you disturbed in the following cases: When it makes it difficult for you to fall asleep? Not at all, Slightly, Moderately, Very, Extremely | Lnight, 22:00–6:00, measured (1 week) (37.5–57.5) |
| + Yano et al. (2015) [70] | 780 | Hanoi, Vietnam | Lnight, 22:00–6:00, measured (1 week) (37.5–57.5) | |
| + Nguyen et al. (2012) [71] | 512 | Da Nang City, Vietnam | Lnight, 22:00–6:00, measured (1 week) (37.5–52.5) | |
| + Nguyen et al. (2010) [72] Nguyen et al. (2011) [73] | 805 | Hanoi, Vietnam | Lnight, 22:00–6:00, measured (1 week) (37.5–52.5) | |
| + Nguyen et al. (2009) [74] | 868 | Ho Chi Minh City, Vietnam | Lnight, 22:00–6:00, measured (1 week) (42.5–62.5) | |
| + Schreckenberg et al. (2009) [75] | 2308 | Germany | How much has aircraft noise in the last 12 months disturbed falling asleep? Not at all, Slightly, Moderately, Very, Extremely. | Lnight, 22:00–6:00 (37.5–57.5) |
| Awakenings (Total N = 4054) | ||||
| + Nguyen et al. (2015) [69] | 1093 | Hanoi, Vietnam | In daily life, when an airplane passes by, to what degree are you disturbed in the following cases: When you are awakened in your sleep? Not at all, Slightly, Moderately, Very, Extremely. | Lnight, 22:00–6:00, measured (1 week) (37.5–57.5) |
| + Yano et al. (2015) [70] | 776 | Hanoi, Vietnam | Lnight, 22:00–6:00, measured (1 week) (37.5–57.5) | |
| + Nguyen et al. (2012) [71] | 511 | Da Nang City, Vietnam | Lnight, 22:00–6:00, measured (1 week) (37.5–52.5) | |
| + Nguyen et al. (2010) [72] Nguyen et al. (2011) [73] | 804 | Hanoi, Vietnam | Lnight, 22:00–6:00, measured (1 week) (37.5–52.5) | |
| + Nguyen et al. (2009) [74] | 870 | Ho Chi Minh City, Vietnam | Lnight, 22:00–6:00, measured (1 week) (42.5–62.5) | |
| Sleep Disturbance (Total N = 2309) | ||||
| + Schreckenberg et al. (2009) [75] | 2309 | Germany | How much has aircraft noise in the last 12 months disturbed sleeping during the night? Not at all, Slightly, Moderately, Very, Extremely. | Lnight, 22:00–6:00 (37.5–57.5) |
| Falling Asleep-Noise source not specified in sleep questions (Total N = 2978) | ||||
| + Brink et al. (2005) [76] 2001 Study | 1528 | Switzerland | How often do you have the following symptoms: Problems falling asleep? Never, Rarely, Sometimes, Often, Very Often, Always | Lnight, 22:00–6:00 (27.5–62.5) |
| + Brink et al. (2005) [76] 2003 Study | 1450 | Lnight, 22:00–6:00 (27.5–62.5) | ||
| Awakenings-Noise source not specified in sleep questions (Total N = 2978) | ||||
| + Brink et al. (2005) [76] 2001 Study | 1528 | Switzerland | How often do you have the following symptoms: Problems with sleeping through? Never, Rarely, Sometimes, Often, Very Often, Always | Lnight, 22:00–6:00 (27.5–62.5) |
| + Brink et al. (2005) [76] 2003 Study | 1450 | Lnight, 22:00–6:00 (27.5–62.5) | ||
| Sleep Disturbance-Noise source not specified in sleep questions (Total N = 195) | ||||
| * Brink (2011) [77] | 195 | Switzerland | During the last 4 weeks, have you suffered from any of the following disorders or health problems? Difficulty in sleeping or insomnia? Not at all, Somewhat, Very Much. | Lnight, 22:00–6:00 (32.5–52.5) |
| Lnight, 22:00–6:00 (32.5–52.5) | ||||
| Study | N | Country | Sleep Disturbance Questions | Noise Metric (Range for Obtained Data) |
|---|---|---|---|---|
| Falling Asleep (Total N = 10,212) | ||||
| + Bodin et al. (2015) [66] | 2444 | Sweden | Do you experience any of the following because of road traffic noise? Difficulties falling asleep. Never, Sometimes, Often. | LAeq, 24 h (37.5–62.5) |
| + Sato et al. (2002) [78] | 1302 | Gothenburg, Sweden | Does the road traffic noise cause the following conditions? Difficulty to fall asleep? No, Little Disturbed, Rather Disturbed, Very Disturbed. | Lnight, 22:00–7:00, measured (1 night) (42.5–72.5) |
| 814 | Kumamoto, Japan | Lnight, 22:00–7:00, measured (1 night) (47.5–77.5) | ||
| 779 | Sapporo, Japan | Lnight, 22:00–7:00, measured (1 night) (52.5–67.5) | ||
| + Phan et al. (2010) [79] Shimoyama et al. (2014) [80] | 1471 | Hanoi, Vietnam | How much are you disturbed in falling asleep by road traffic? Not at all, Slightly, Moderately, Very, Extremely. | Lnight, 22:00–6:00, measured (1 night) (62.5–77.5) |
| 1458 | Ho Chi Minh City, Vietnam | Lnight, 22:00–6:00, measured (1 night) (67.5–77.5) | ||
| 481 | Da Nang, Vietnam | Lnight, 22:00–6:00, measured (1 night) (57.5–67.5) | ||
| 682 | Hue, Vietnam | Lnight, 22:00–6:00, measured (1 night) (52.5–72.5) | ||
| 781 | Thai Nguyen, Vietnam | Lnight, 22:00–6:00, measured (1 night) (52.5–67.5) | ||
| Awakenings (Total N = 10177) | ||||
| + Bodin et al. (2015) [66] | 2438 | Sweden | Do you experience any of the following because of road traffic noise? You wake up? Never, Sometimes, Often. | LAeq, 24 h (37.5–62.5) |
| + Sato et al. (2002) [78] | 1291 | Gothenburg, Sweden | Does the road traffic noise cause the following conditions? Awakening? No, Little Disturbed, Rather Disturbed, Very Disturbed. | Lnight, 22:00–7:00, measured (1 night) (42.5–72.5) |
| 819 | Kumamoto, Japan | Lnight, 22:00–7:00, measured (1 night) (47.5–77.5) | ||
| 779 | Sapporo, Japan | Lnight, 22:00–7:00, measured (1 night) (52.5–67.5) | ||
| + Phan et al. (2010) [79] Shimoyama et al. (2014) [80] | 1454 | Hanoi, Vietnam | How much are you disturbed by awakening during nighttime by road traffic? Not at all, Slightly, Moderately, Very, Extremely. | Lnight, 22:00–6:00, measured (1 night) (62.5–77.5) |
| 1460 | Ho Chi Minh City, Vietnam | Lnight, 22:00–6:00, measured (1 night) (67.5–77.5) | ||
| 479 | Da Nang, Vietnam | Lnight, 22:00–6:00, measured (1 night) (57.5–67.5) | ||
| 680 | Hue, Vietnam | Lnight, 22:00–6:00, measured (1 night) (52.5–72.5) | ||
| 777 | Thai Nguyen, Vietnam | Lnight, 22:00–6:00, measured (1 night) (52.5–67.5) | ||
| Sleep Disturbance (Total N = 9901) | ||||
| + Brown et al. (2015) [81] | 8841 | Hong Kong | How much is your sleep disturbed by road traffic noise? 11 point scale used from 0 (not disturbed at all) to 10 (extremely disturbed) (8, 9, 10 HSD) | Lnight (42.5–67.5) |
| + Hong et al. (2010) [82] | 550 | Korea | How much have you been disturbed in your sleep by road traffic noise at night when you are sleeping in your house over the last 12 months? 11 point scale used from 0 (not disturbed at all) to 10 (extremely disturbed) (8, 9, 10 HSD) | Lnight, 22:00–7:00 (50.0–73.0) |
| + Ristovska et al. (2009) [83] | 510 | Macedonia | Do you think that your sleep was disturbed due to night-time noise or noise events during the night in the last twelve months and more? Not at all, Very little, Moderate, High, Very High. | Lnight, 23:00–7:00, measured (2 nights) (42.5–62.5) |
| Falling Asleep–Noise source not specified in sleep questions (N = 10,545) | ||||
| + Bodin et al. (2015) [66] | 2520 | Sweden | Do you have problems falling asleep? Rarely/never, A few times per month, A few times a week, Almost every day | LAeq, 24 h (37.5–62.5) |
| * Halonen et al. (2012) [67] | 6793 | Finland | How many times during the past 4 weeks have you had the following symptoms? Difficulty falling asleep? Never, 1 per month, 1 per week, 2–4 per week, 5–6 per week, Nearly every night. | Lnight, 22:00–7:00 (42.5–57.5) |
| * Frei et al. (2014) [84] | 1232 | Switzerland | How often does it happen, that you cannot fall asleep well? Never, Rarely, Sometimes, Often. | Lnight, 22:00–6:00 (27.5–62.5) |
| Awakenings–Noise source not specified in sleep questions (N = 10,603) | ||||
| + Bodin et al. (2015) [66] | 2519 | Sweden | Do you wake up at night? Rarely/never, A few times per month, A few times a week, Almost every day | LAeq, 24 h (37.5–62.5) |
| * Halonen et al. (2012) [67] | 6853 | Finland | How many times during the past 4 weeks have you had the following symptoms? Frequently waking up during the night. Never, 1 per month, 1 per week, 2–4 per week, 5–6 per week, nearly every night. | Lnight, 22:00–7:00 (42.5–57.5) |
| * Frei et al. (2014) [84] | 1231 | Switzerland | How often does it happen, that you wake up at night multiple times? Never, Rarely, Sometimes, Often. | Lnight, 22:00–6:00 (27.5–62.5) |
| Sleep Disturbance-Noise Source not specified in sleep questions (N = 9474) | ||||
| * Brink (2011) [77] | 8245 | Switzerland | During the last 4 weeks, have you suffered from any of the following disorders or health problems? Difficulty in sleeping, or insomnia? Not at all, Somewhat, Very Much | Lnight, 22:00–6:00 (32.5–77.5) |
| * Frei et al. (2014) [84] | 1229 | Switzerland | How often does it happen that your sleep is restless? Never, Rarely, Sometimes, Often | Lnight, 22:00–6:00 (27.5–62.5) |
| Study | N | Country | Sleep Disturbance Questions | Noise Metric (Range for Obtained Data) |
|---|---|---|---|---|
| Falling Asleep (Total N = 6520) | ||||
| + Bodin et al. (2015) [66] | 2342 | Sweden | Do you experience any of the following because of railway noise? Difficulties falling asleep? Never, Sometimes, Often | LAeq, 24h (37.5–62.5) |
| + Sato et al. (2004) [85] | 1418 | Hokkaido, Japan | How much are you disturbed in falling asleep by train passing? Not at all, Slightly, Moderately, Very, Extremely. | Lnight, 22:00–7:00, measured (27.5–62.5) |
| 1562 | Kyushu, Japan | Lnight, 22:00-7:00, measured (27.5-72.5) | ||
| + Schreckenberg (2013) [86] | 1198 | Germany | To what extent have the following outcomes of railway noise occurred in the past 12 months? Railway noise disturbs when falling asleep. Not at all, Slightly, Moderately, Very, Extremely. | Lnight, 22:00–6:00 (42.5-82.5) |
| Awakenings (Total N = 5311) | ||||
| + Bodin et al. (2015) [66] | 2344 | Sweden | Do you experience any of the following because of railway noise? You wake up? Never, Sometimes, Often | LAeq, 24h (37.5–62.5) |
| + Sato et al. (2004) [85] | 1418 | Hokkaido, Japan | How much are you disturbed by awakening during nighttime by train passing? Not at all, Slightly, Moderately, Very, Extremely. | Lnight, 22:00–7:00, measured (27.5–62.5) |
| 1549 | Kyushu, Japan | Lnight, 22:00–7:00, measured (27.5–72.5) | ||
| Sleep Disturbance (Total N = 1809) | ||||
| + Hong et al. (2010) [82] | 610 | Korea | How much have you been disturbed in your sleep by railway noise at night when you are sleeping in your house over the last 12 months? 11 point scale used from 0 (not disturbed at all) to 10 (extremely disturbed) (HSD 8, 9, 10) | Lnight, 22:00–7:00 (47.1–70) |
| + Schreckenberg (2013) [86] | 1199 | Germany | To what extent have the following outcomes of railway noise occurred in the past 12 months? Railway disturbs when sleeping during the night. Not at all, Slightly, Moderately, Very, Extremely. | Lnight, 22:00–6:00 (42.5–82.5) |
| Falling Asleep- Noise source not specified in sleep questions (Total N = 3808) | ||||
| + Bodin et al. (2015) [66] | 2576 | Sweden | Do you have problems falling asleep? Rarely/never, A few times per month, A few times a week, Almost every day | LAeq, 24 h (37.5–62.5) |
| * Frei et al. (2014) [84] | 1232 | Switzerland | How often does it happen, that you cannot fall asleep well? Never, Rarely, Sometimes, Often. | Lnight, 22:00–6:00 (27.5–57.5) |
| Awakening-Noise source not specified in sleep questions (Total N = 3806) | ||||
| + Bodin et al. (2015) [66] | 2575 | Sweden | Do you wake up at night? Rarely/never, A few times per month, A few times a week, Almost every day | LAeq, 24 h (37.5–62.5) |
| * Frei et al. (2014) [84] | 1231 | Switzerland | How often does it happen, that you wake up at night multiple times? Never, Rarely, Sometimes, Often. | Lnight, 22:00–6:00 (27.5–57.5) |
| Sleep Disturbance-Noise source not specified in sleep questions (N = 5914) | ||||
| * Brink (2011) [77] | 4685 | Switzerland | During the last 4 weeks, have you suffered from any of the following disorders or health problems? Difficulty in sleeping, or insomnia? Not at all, Somewhat, Very Much | Lnight, 22:00–6:00 (32.5–77.5) |
| * Frei et al. (2014) [84] | 1229 | Switzerland | How often does it happen that your sleep is restless? Never, Rarely, Sometimes, Often | Lnight, 22:00–6:00 (27.5–57.5) |
| Number of Studies | Odds Ratio per 10 dBA | 95% Confidence Interval | |
|---|---|---|---|
| Aircraft Noise | |||
| Falling Asleep | 6 | 2.00 | 1.68–2.41 |
| Awakenings | 5 | 1.72 | 1.31–2.27 |
| Sleep Disturbance | 1 | 2.05 | 1.64–2.56 |
| Combined Estimate | 6 | 1.94 | 1.61–2.33 |
| Road Noise | |||
| Falling Asleep | 8 | 2.63 | 1.86–3.73 |
| Awakening | 8 | 1.75 | 1.24–2.47 |
| Sleep Disturbance | 3 | 2.21 | 1.52–3.20 |
| Combined Estimate | 12 | 2.13 | 1.82–2.48 |
| Rail Noise | |||
| Falling Asleep | 4 | 2.57 | 1.87–3.53 |
| Awakening | 3 | 2.54 | 1.49–4.33 |
| Sleep Disturbance | 2 | 4.10 | 0.69–24.41 |
| Combined Estimate | 5 | 3.06 | 2.38–3.93 |
| Number of Studies | Odds Ratio per 10 dBA | 95% Confidence Interval | |
|---|---|---|---|
| Aircraft Noise | |||
| Falling Asleep | 2 | 1.10 | 0.73–1.57 |
| Awakenings | 2 | 0.89 | 0.66–1.22 |
| Sleep Disturbance | 1 | 4.70 | 0.41–53.62 |
| Combined Estimate | 3 | 1.17 | 0.54–2.53 |
| Road Noise | |||
| Falling Asleep | 3 | 1.03 | 0.77–1.38 |
| Awakenings | 3 | 1.01 | 0.81–1.25 |
| Sleep Disturbance | 2 | 1.43 | 0.36–5.59 |
| Combined Estimate | 4 | 1.09 | 0.94–1.27 |
| Rail Noise | |||
| Falling Asleep | 2 | 2.02 | 1.44–2.83 |
| Awakenings | 2 | 1.12 | 0.90–1.39 |
| Sleep Disturbance | 2 | 1.23 | 0.85–1.80 |
| Combined Estimate | 3 | 1.27 | 0.89–1.81 |
| Reference | Country | N | N (>40 dBA) | Noise Exposure | Confounding Variables Adjusted for in the Statistical Analysis | Odds Ratio per 10 dBA (95% CI) | Odds Ratio Relative to Reference (95% CI) |
|---|---|---|---|---|---|---|---|
| Pedersen and Persson Waye (2004) [92] | Sweden | 351 | 25 | Predicted A-weighted SPL | Age, gender | 3.11 (1.34–7.30) | Reference: <35 dBA >35 dBA: 4.72 (0.27–82.97) |
| Pedersen and Persson Waye, (2007) [93] | Sweden | 754 | 20 | Predicted A-weighted SPL | Age, gender | 0.74 (0.35–1.63) | NA |
| Pedersen et al. (2009) [101] Bakker et al. (2012) [94] | Netherlands | 725 | 159 | Predicted A-weighted SPL | Age, gender, economic benefits | 1.34 (1.00–1.80) | Reference <30 dBA >45 dBA: 2.98 (1.35–6.60) |
| Kuwano et al. (2014) [96] | Japan | 747 (332 Controls) | 260 | Lnight (22:00-6:00) | Age, gender | 4.20 (2.40–7.34) | Reference: <35 dBA 41–45 dBA: 5.55 (1.12–27.47) >46 dBA: 4.79 (0.64–35.70) |
| Michaud (2015) [97] | Canada | 1238 | 234 | Predicted A-weighted SPL | None | 0.89 (0.66–1.18) | NA |
| Pawlaczyk-Luszcynsa et al. (2014) [95] | Poland | 156 | 90 | Lden | None | NA | Reference: 35–40 dBA 40–45 dBA: 2.74 (1.08–6.97) |
| Reference | N | Age | Hospital Unit | Noise Measurement | Subjective Measure | Objective Measure | Outcome |
|---|---|---|---|---|---|---|---|
| Aaron et al. 1996 [102] | 6 | 66.8 ± 2.8 years | Intensive and Intermediate Respiratory Care Unit | SPL every minute | NA | Polysomnography | Correlation (r = 0.57, p = 0.0001) between number of arousals (between 22:00–6:00) and SPL peaks ≥ 80 dB |
| Adachi et al. 2013 [106] | 118 | 65.0 ± 11.6 years | General Medicine | Hourly Lmin, Leq, Lmax | Karolinska Sleep Log | Actigraphy | Multivariate linear and logistic regressions: No significant association between Lmin tertiles and sleep duration, Karolinska Sleep Quality, or noise complaints |
| Elliott et al. 2013 [103] | 53 | 60.1 ± 20.0 years | Intensive Care Unit | LAeq and LCpeak levels logged every second | Richards Campbell Sleep Questionnaire | Polysomnography | Weak correlation between arousal indices and number of sound peaks > 80 dB (day r = 0.13, night r = 0.19) |
| Gabor et al. 2003 [105] | 13 Patients: 7 Control: 6 | Patients: 56. 7± 19.2 years Controls: 23–65 years | Intensive Care Unit | SPL | NA | Polysomnography | 17.5 ± 11.2% (Patients) and 68.4 ± 11.1% (Control Subjects) of arousals were associated with a sound event greater than 10 dB over background |
| Freedman et al. 2001 [104] | 22 | 61 ± 16 years | Intensive Care Unit | SPL every minute | NA | Polysomnography | 11.5 ± 11.8% of arousals and 26.2 ± 24.8% of awakenings was due to environmental noise |
| Hsu et al. 2010 [121] | 40 | 54. 5± 14.5 years | Cardiac Surgical Unit | SPL every second | Questions on insomnia | Heart rate and blood pressure every 5 min | Correlation between insomnia and noise level, Leq (r = 0.09), Lmax (r = 0.24), Lmin (r = −0.03). |
| Missildine et al. 2010 [107] | 48 | 79 years | Medical Unit | SPL levels (23:00–7:00) | Richards Campbell Sleep Questionnaire | Actigraphy | For those subjects with less than 300 minof sleep, 59% were exposed to nighttime noise levels ≥ 40 dBA. In a multiple regression for sleep efficiency, the coefficient for median noise level was not significant (β = −0.671, p = 0.836). |
| Park et al. 2014 [120] | 103 | 60 ± 14.8 years | Internal Medicine | Leq | Pittsburgh Sleep Quality Index | NA | Sleep disturbance scores increased with mean daytime and nighttime levels (β = 0.2; 95% CI = 0.09–0.53 for daytime; β = 0.12; 95% CI = 0.07–0.36 for nighttime). Controlled for age, gender, severity of disease, medication, and room type. |
| Yoder et al. 2012 [108] | 106 | 66.0 ± 12 years | General Medicine | Lmin, Leq, Lmax | Pittsburgh Sleep Quality Index | Actigraphy | Patients exposed to the loudest tertile of average nighttime noise levels slept significantly less (−76 min, 95% CI −134 to −18 min, p = 0.01) than patients exposed to the lowest tertile of noise. |
| Study | N | Age | Hospital Unit | Measure of Noise | Subjective Measure | Objective Measure | Outcome |
|---|---|---|---|---|---|---|---|
| Corser 1996 [109] | 12 | 23.3 ± 6.1 months | Pediatric Intensive Care Unit | SPL every 5 min | Patient Sleep Behavior Observation Tool used to identify sleep state every 5 min 19:00–7:00 | NA | Correlation between observed sleep state and noise (r = −0.2043, p < 0.05). |
| Cureton-Lane and Fontaine 1997 [110] | 9 | 4.7 ± 3.5 years | Pediatric Intensive Care Unit | SPL every 5 min | Patient Sleep Behavior Observation Tool used to identify sleep stage every 5 min from 20:00–6:00 | NA | Noise was a significant predictor of sleep state in probit analysis (p < 0.001). Light levels and contact with staff were also significant predictors. |
| Kuhn et al. 2013 [112] Kuhn et al. 2012 [113] | 26 | 28 weeks (median) | Neonatal Intensive Care Unit | Classified sound peaks: those exceeding the previous level by more than 5 dBA | Prechtl’s observational rating system for defining arousal states. | Heart Rate, Respiratory Rate and SaO2 | Average percent awakened due to classified sound peaks was 33.8% (95% CI: 24–37%). For control periods without sound peaks average percent awakened was 11.7% (95% CI: 6.2–17.1%). For sound peaks 10–15 dBA above background a significant decrease in respiration rate (−10 ± 12.5 breath/min, p = 0.002) during quiet sleep was found. |
| Study | N | Age | Hospital Unit | Invention | Measure of Noise | Subjective Measure | Objective Measure | Outcome |
|---|---|---|---|---|---|---|---|---|
| Dennis et al. 2010 [114] | 50 Day: 35 Night: 15 | Day: 55.5 ± 14.4 years Night: 52.9 ± 16.3 years | Neuro-Intensive Care Unit | Implemented 2 h quiet period during the day and night | SPL collected 6 times a day over a period of 5 s before, after and during the quiet time hours | Sleep Observation Tool: seven observations made per subject | NA | Odds Ratio (97.5% CI) observed asleep: Day: 4.04 (2.24–7.30) Night: 0.96 (0.41–2.24) |
| Duran et al. 2012 [118] | 20 | 30.0 ± 2.2 weeks | Neonatal Intensive Care Unit | Infants wore earmuffs that decreased noise levels by 7–12 dBA for 2 days | Measurements made every 2 h during an 8 h period | Anderson Behavioral State Scoring System. Measurements made every 2 h during an 8 h period | Blood pressure, heart rate, respiration rate, body temperature, and oxygen saturation. Measurements made every 2 h during an 8 h period | For the two conditions (with and without earmuffs): No difference was observed in physiological measures. 87.5% of infants with earmuffs observed asleep, 29.4% of infants without earmuffs observed asleep |
| Gardner et al. 2009 [115] | 293 Experimental: 137 Control Group: 156 | Experimental Group: 56.4 ± 19.1 years Control Group: 50.5 ± 19.4 years | Orthopedic Unit | Implemented quiet hours | Daily SPL | Observed Sleep State | NA | Correlation between mean SPL levels and patients found to be awake: Experimental: (r = 0.704, p < 0.01) Control group: r = 0.243, p < 0.05) |
| Thomas et al. 2012 [117] | 95 Phase 1: 32 Phase 2: 33 Phase 3: 30 | Phase 1: 49 ± 1 years Phase 2: 43 ± 3 years Phase 3: 46 ± 3 years | Neurological Unit | Study had 3 phases with measured noise levels Phase 2: Sleep promoting rules | SPL between 20:00–8:00 | Questions on sleep quality, sleep quantity | NA | Intervention did not result in a reduction in noise level. The median noise levels were: Phase 1: 38.6 dB, Phase 2: 40.6 dB, Phase 3: 43.5 dB |
| Walder et al. 2000 [116] | 17 Before Guidelines: 9 After Guidelines: 8 | Before Guidelines: 62.5 ±16.5 years After Guidelines: 57.8 ±15.9 years | Surgical Intensive Care Unit | Implemented behavioral rules | SPL, every 1 s between 23:00–5:00. | Nurses estimated the patient’s sleep duration and the number of awakenings. | NA | Sleep duration was shorter, and the number of awakenings higher when the behavioral rules were implemented. |
| Reference | N | Noise Source | Noise Metric | Outcome |
|---|---|---|---|---|
| Hong et al. (2006) [125] | 12 | Rail | LAmax indoor | Exposure-response between probability of motility and indoor LAmax. A higher probability of motility than in previous aircraft noise studies was found. |
| Frei et al. (2014) [84] | 119 | Road | Lnight, 22:00–6:00, outdoor, most exposed facade | Decrease in sleep efficiency (percent) with outdoor Lnight. Coefficients for random subject intercept linear regression: 30–40 dB: 0.20 (95% CI −1.21, 1.60), 40–55 dB: −0.85 (95% CI −2.42, 0.71), >55 dB: −4.06 (−6.78, −1.35) |
| Griefahn et al. (2000) [130] | 377 | Road and Rail | Indoor and outdoor whole night and individual event noise levels | No significant effect of noise on sleep parameters found. |
| Lercher et al. (2010) [126] | 8 | Rail | LAmax indoor | Coefficient for LAmax, in a linear regression for the probability of motility reaction was significant. (0.04, 95% CI 0.01–0.07, p < 0.01) |
| Ohrstrӧm et al. (2006) [128] | 79 | Road | LAeq,24hr outdoor, most exposed facade | No significant effect of noise on sleep parameters was found. |
| Passchier-Vermeer et al. (2002) [64] | 418 | Aircraft | LAmax indoor | Exposure-response relationship between motility and indoor LAmax. |
| Passchier-Vermeer et al. (2007) [131] | 262 | Road and Rail | LAmax indoor | Significant noise metric coefficient when comparing probability of motility reaction to an estimated indoor LAmax level. Motility reaction was greater when there was higher levels of background noise. |
| Pirrera et al. (2014) [129] | 45 | Road | LAeq indoor | No significant difference in indoor average noise levels was found despite differences in outdoor noise level. No significant difference in time in bed, total sleep time, sleep latency, wake after sleep onset, or sleep efficiency was found. |
| Reference | Age | N | Confounding Variables Adjusted for in the Statistical Analysis | Noise Source | Noise Metric | Outcome |
|---|---|---|---|---|---|---|
| Ising and Ising (2002) [134] | 7–13 years | 56 | Age, gender, social status | Road | LCmax Indoors | Significant correlation between LCmax and awakenings during sleep and problems to fall asleep |
| Lercher et al. (2013) [133] | 8–11 years | 1251 | Gender, health status, and mother’s education | Road and Rail | Lden Outdoor most exposed facade | Lden was a significant predictor of self-reported sleep, but not when adjusted for sound perception score |
| Ohrstrӧm et al. (2006) [128] | Mean 10.9 years (range 9–12.9) | 160 (survey) 79 (actigraphy) | None | Road | LAeq,24h Outdoor most exposed facade | Decrease in self-reported mean sleep quality (0–10) < 55 dB: 8.6, 55–59 dB: 8.2, 60–64 dB: 8.2, >64 dB: 8.1. No association between actigraphy measured sleep parameters and noise level |
| Tiesler et al. (2013) [135] | 10.1 ± 2.2 years | 287 | Gender, age, parental education level, mother’s age at birth, television/computer usage, single parent status, sleeping alone, and orientation of the window | Road | Lnight Outdoors, least exposed facade | Reporting any sleep problems: OR: 1.79 (95% CI 1.10–2.92) Reporting problems falling asleep: OR 1.96 (95% CI 1.16–3.32) |
| Sleep Outcomes | Noise Source | Number of Participants (Studies) | Quality of Evidence | Noise Metric | Odds Ratio per 10 dBA Increase (95% CI) |
|---|---|---|---|---|---|
| Cortical Awakenings in Adults | Road | 94 (2) | ⊕⊕⊕Ο Moderate There was evidence of dose-response | Indoor LAS,max | 1.36 (1.19–1.55) |
| Rail | 33 (1) | ⊕⊕⊕Ο Moderate There was evidence of dose-response | Indoor LAS,max | 1.35 (1.21–1.52) | |
| Aircraft | 61 (1) | ⊕⊕⊕Ο Moderate There was evidence of dose-response | Indoor LAS,max | 1.35 (1.22–1.50) | |
| Self-Reported Sleep Disturbance in Adults (Noise Source Specified) | Road | 20,120 (12) | ⊕⊕⊕Ο Moderate There was evidence of dose-response | Outdoor Lnight | 2.13 (1.82–2.48) |
| Rail | 7133 (5) | ⊕⊕⊕Ο Moderate There was evidence of dose-response | Outdoor Lnight | 3.06 (2.38–3.93) | |
| Aircraft | 6371 (6) | ⊕⊕⊕Ο Moderate There was evidence of dose-response | Outdoor Lnight | 1.94 (1.61–2.33) | |
| Self-Reported Sleep Disturbance in Adults (Noise Source Not Specified) | Road | 18,850 (4) | ⊕ΟΟΟ Very Low Confounding factors not accounted for in analysis, Imprecision low number of studies | Outdoor Lnight | 1.09 (0.94–1.27) |
| Rail | 8493 (3) | ⊕ΟΟΟ Very Low Confounding factors not accounted for in analysis, Imprecision low number of studies | Outdoor Lnight | 1.27 (0.89–1.81) | |
| Aircraft | 3173 (3) | ⊕ΟΟΟ Very Low Confounding factors not accounted for in analysis, Imprecision low number of studies | Outdoor Lnight | 1.17 (0.54–2.53) | |
| Motility Measures of Sleep in Adults | Road, Rail, Aircraft | 1320 (8) | ⊕⊕ΟΟ Low Single event analysis indicates dose-response | LAmax and LAeq | Not estimated |
| Self-Report and Motility Measured Sleep Disturbance in Children | Road, Rail, Aircraft | 1754 (4) | ⊕ΟΟΟ Very Low Inconsistency in results, small number of studies | Varied across studies | Not estimated |
| Self-Reported Sleep Disturbance in Adults | Wind Turbine Noise | 3971 (6) | ⊕ΟΟΟ Very Low Inconsistency in results and imprecision due to small sample sizes at highest noise levels | Outdoor A-weighted SPL | 1.60 (0.86–2.94) |
| All Sleep Outcome Measures | Hospital Noise | 964 Adults/67 Children (13 Adults/4 Children) | ⊕ΟΟΟ Very Low Inconsistency in results and imprecision due to small sample sizes | Varied across studies | Not estimated |
© 2018 by the authors. Licensee MDPI, Basel, Switzerland. This article is an open access article distributed under the terms and conditions of the Creative Commons Attribution (CC BY) license (http://creativecommons.org/licenses/by/4.0/).
Share and Cite
Basner, M.; McGuire, S. WHO Environmental Noise Guidelines for the European Region: A Systematic Review on Environmental Noise and Effects on Sleep. Int. J. Environ. Res. Public Health 2018, 15, 519. https://0-doi-org.brum.beds.ac.uk/10.3390/ijerph15030519
Basner M, McGuire S. WHO Environmental Noise Guidelines for the European Region: A Systematic Review on Environmental Noise and Effects on Sleep. International Journal of Environmental Research and Public Health. 2018; 15(3):519. https://0-doi-org.brum.beds.ac.uk/10.3390/ijerph15030519
Chicago/Turabian StyleBasner, Mathias, and Sarah McGuire. 2018. "WHO Environmental Noise Guidelines for the European Region: A Systematic Review on Environmental Noise and Effects on Sleep" International Journal of Environmental Research and Public Health 15, no. 3: 519. https://0-doi-org.brum.beds.ac.uk/10.3390/ijerph15030519