The Relationship between Alcohol Drinking Patterns and Sleep Duration among Black and White Men and Women in the United States

 ,
,
Abstract
:1. Introduction
2. Materials and Methods
2.1. The National Health Interview Survey
2.2. Study Participants
2.3. Measures
2.3.1. Alcohol Drinking Patterns
2.3.2. Sleep Duration and Quality
2.3.3. Race/Ethnicity
2.3.4. Covariates
2.4. Statistical Analysis
3. Results
3.1. Study Population Characteristics
3.2. Black-White Differences in Sleep Behaviors Across Categories of Alcohol Consumption
3.2.1. Black-White Differences Prior to Adjustment
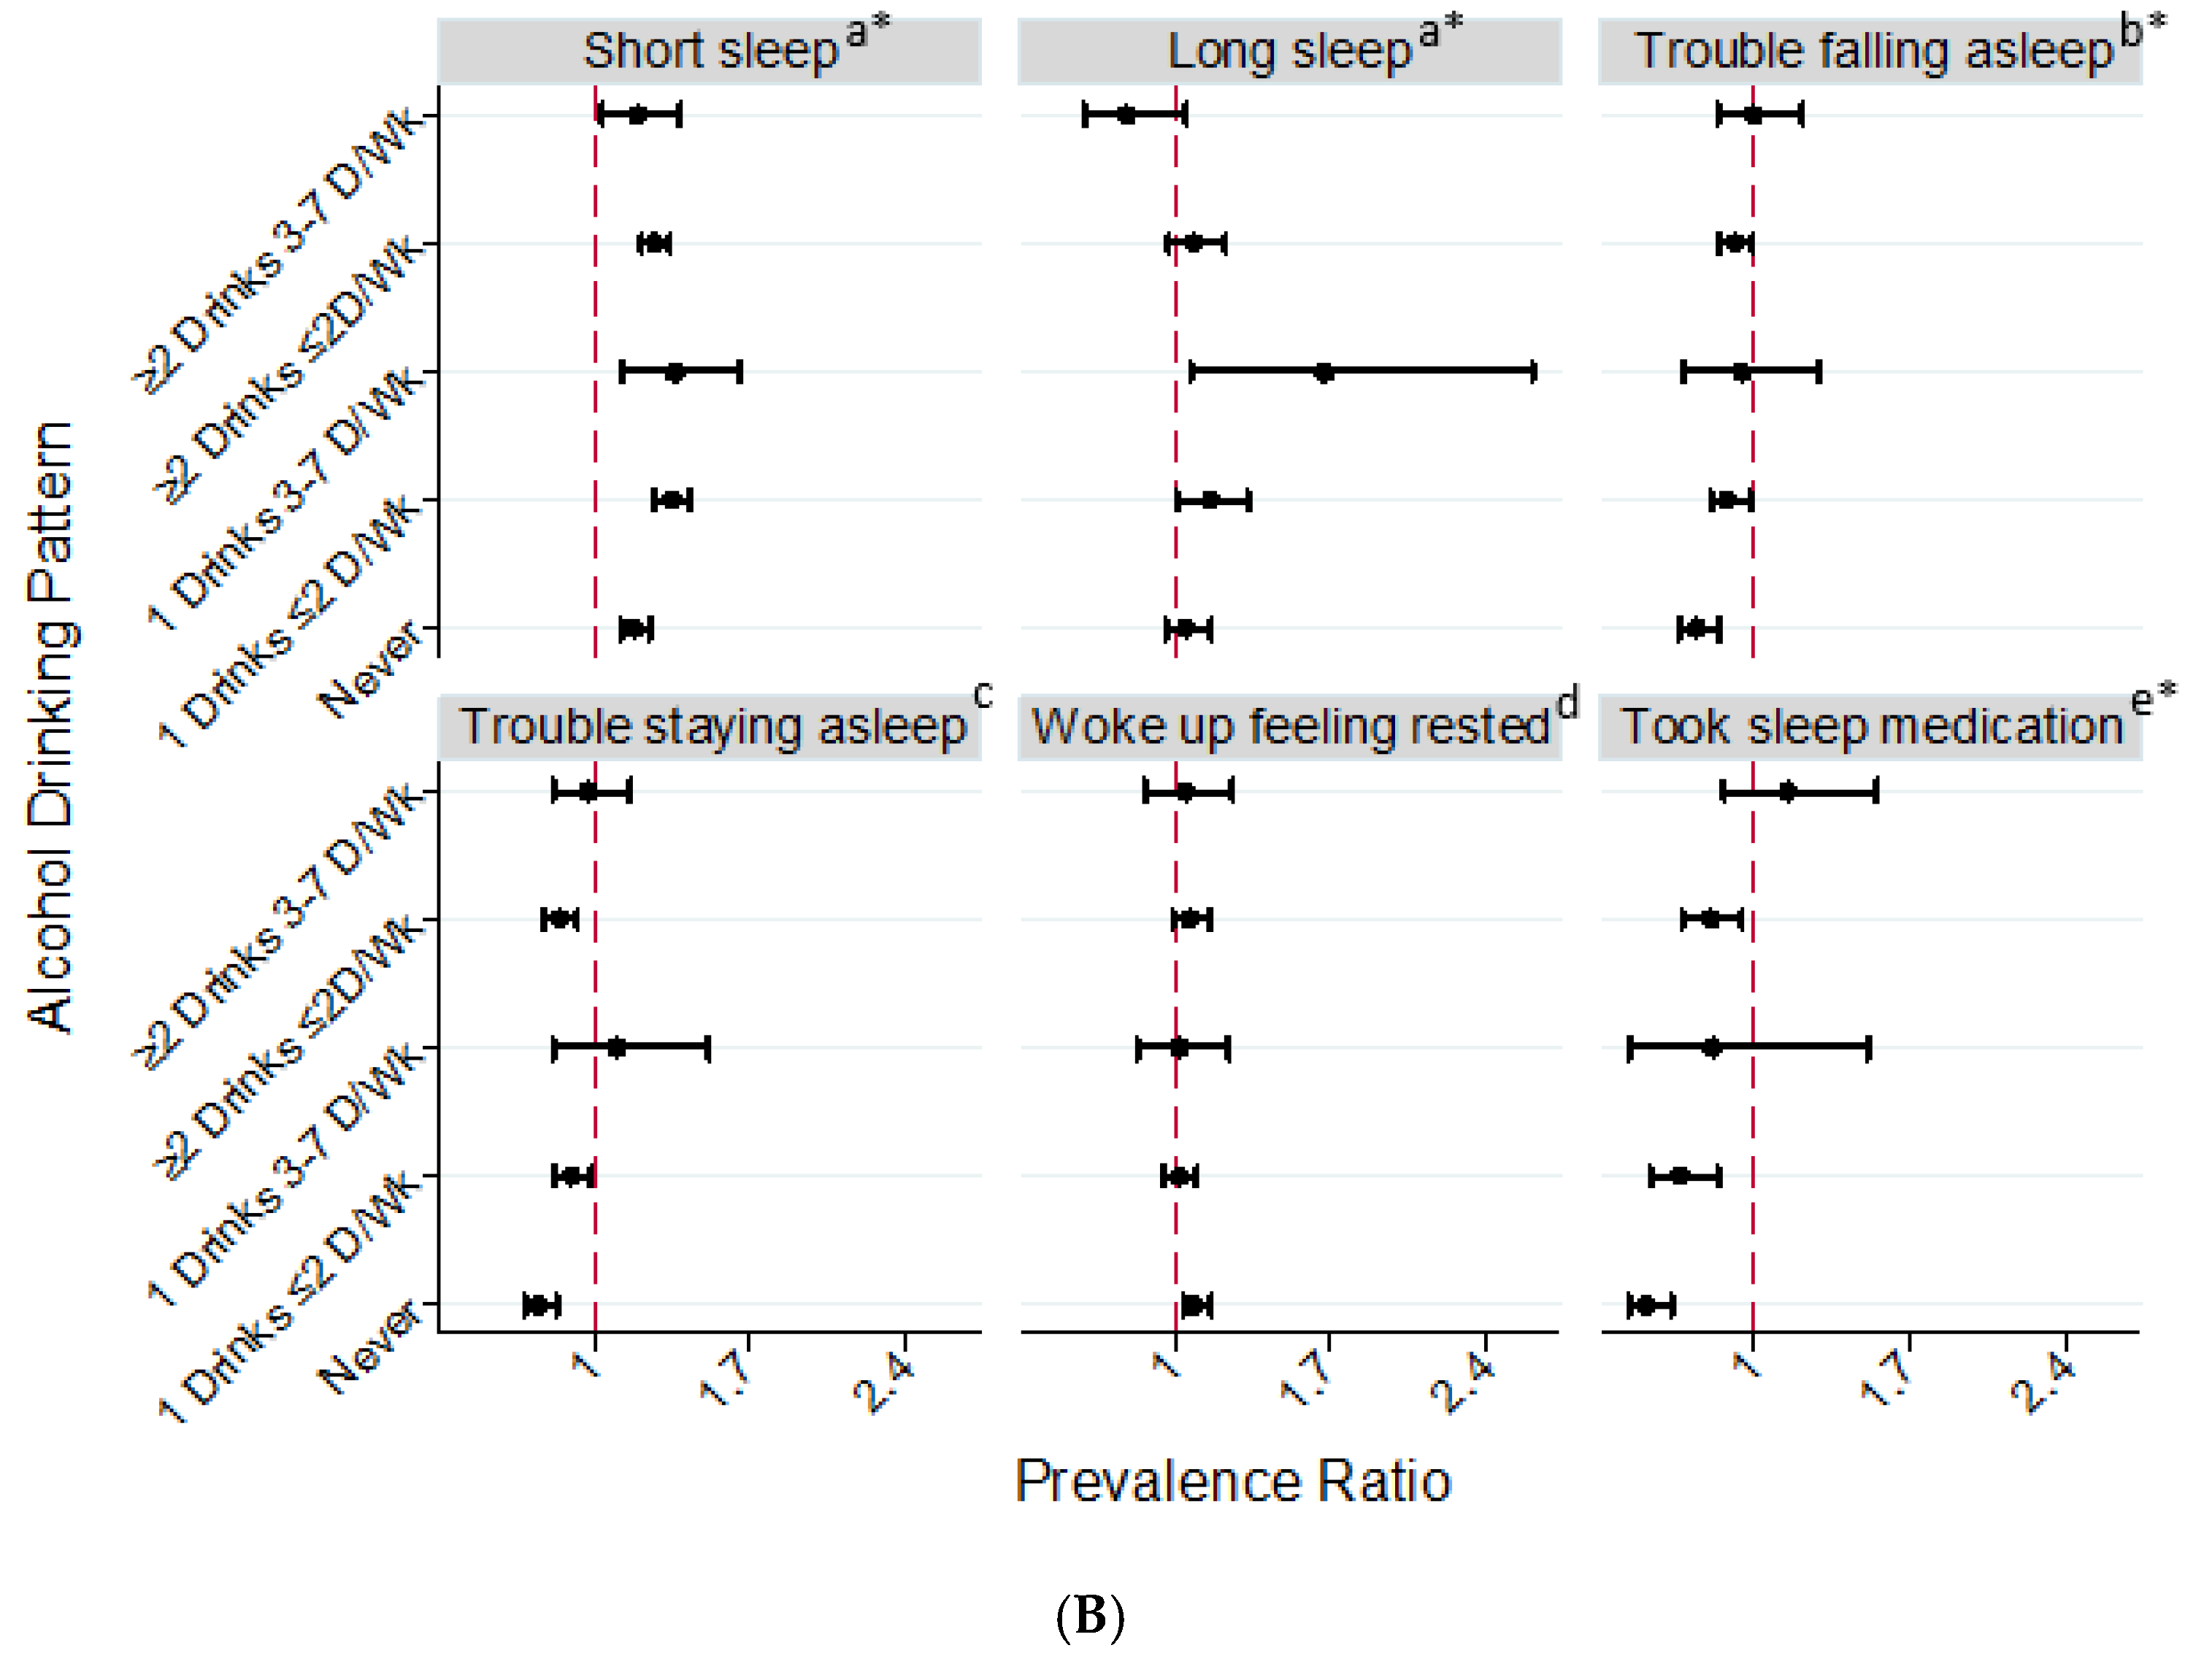
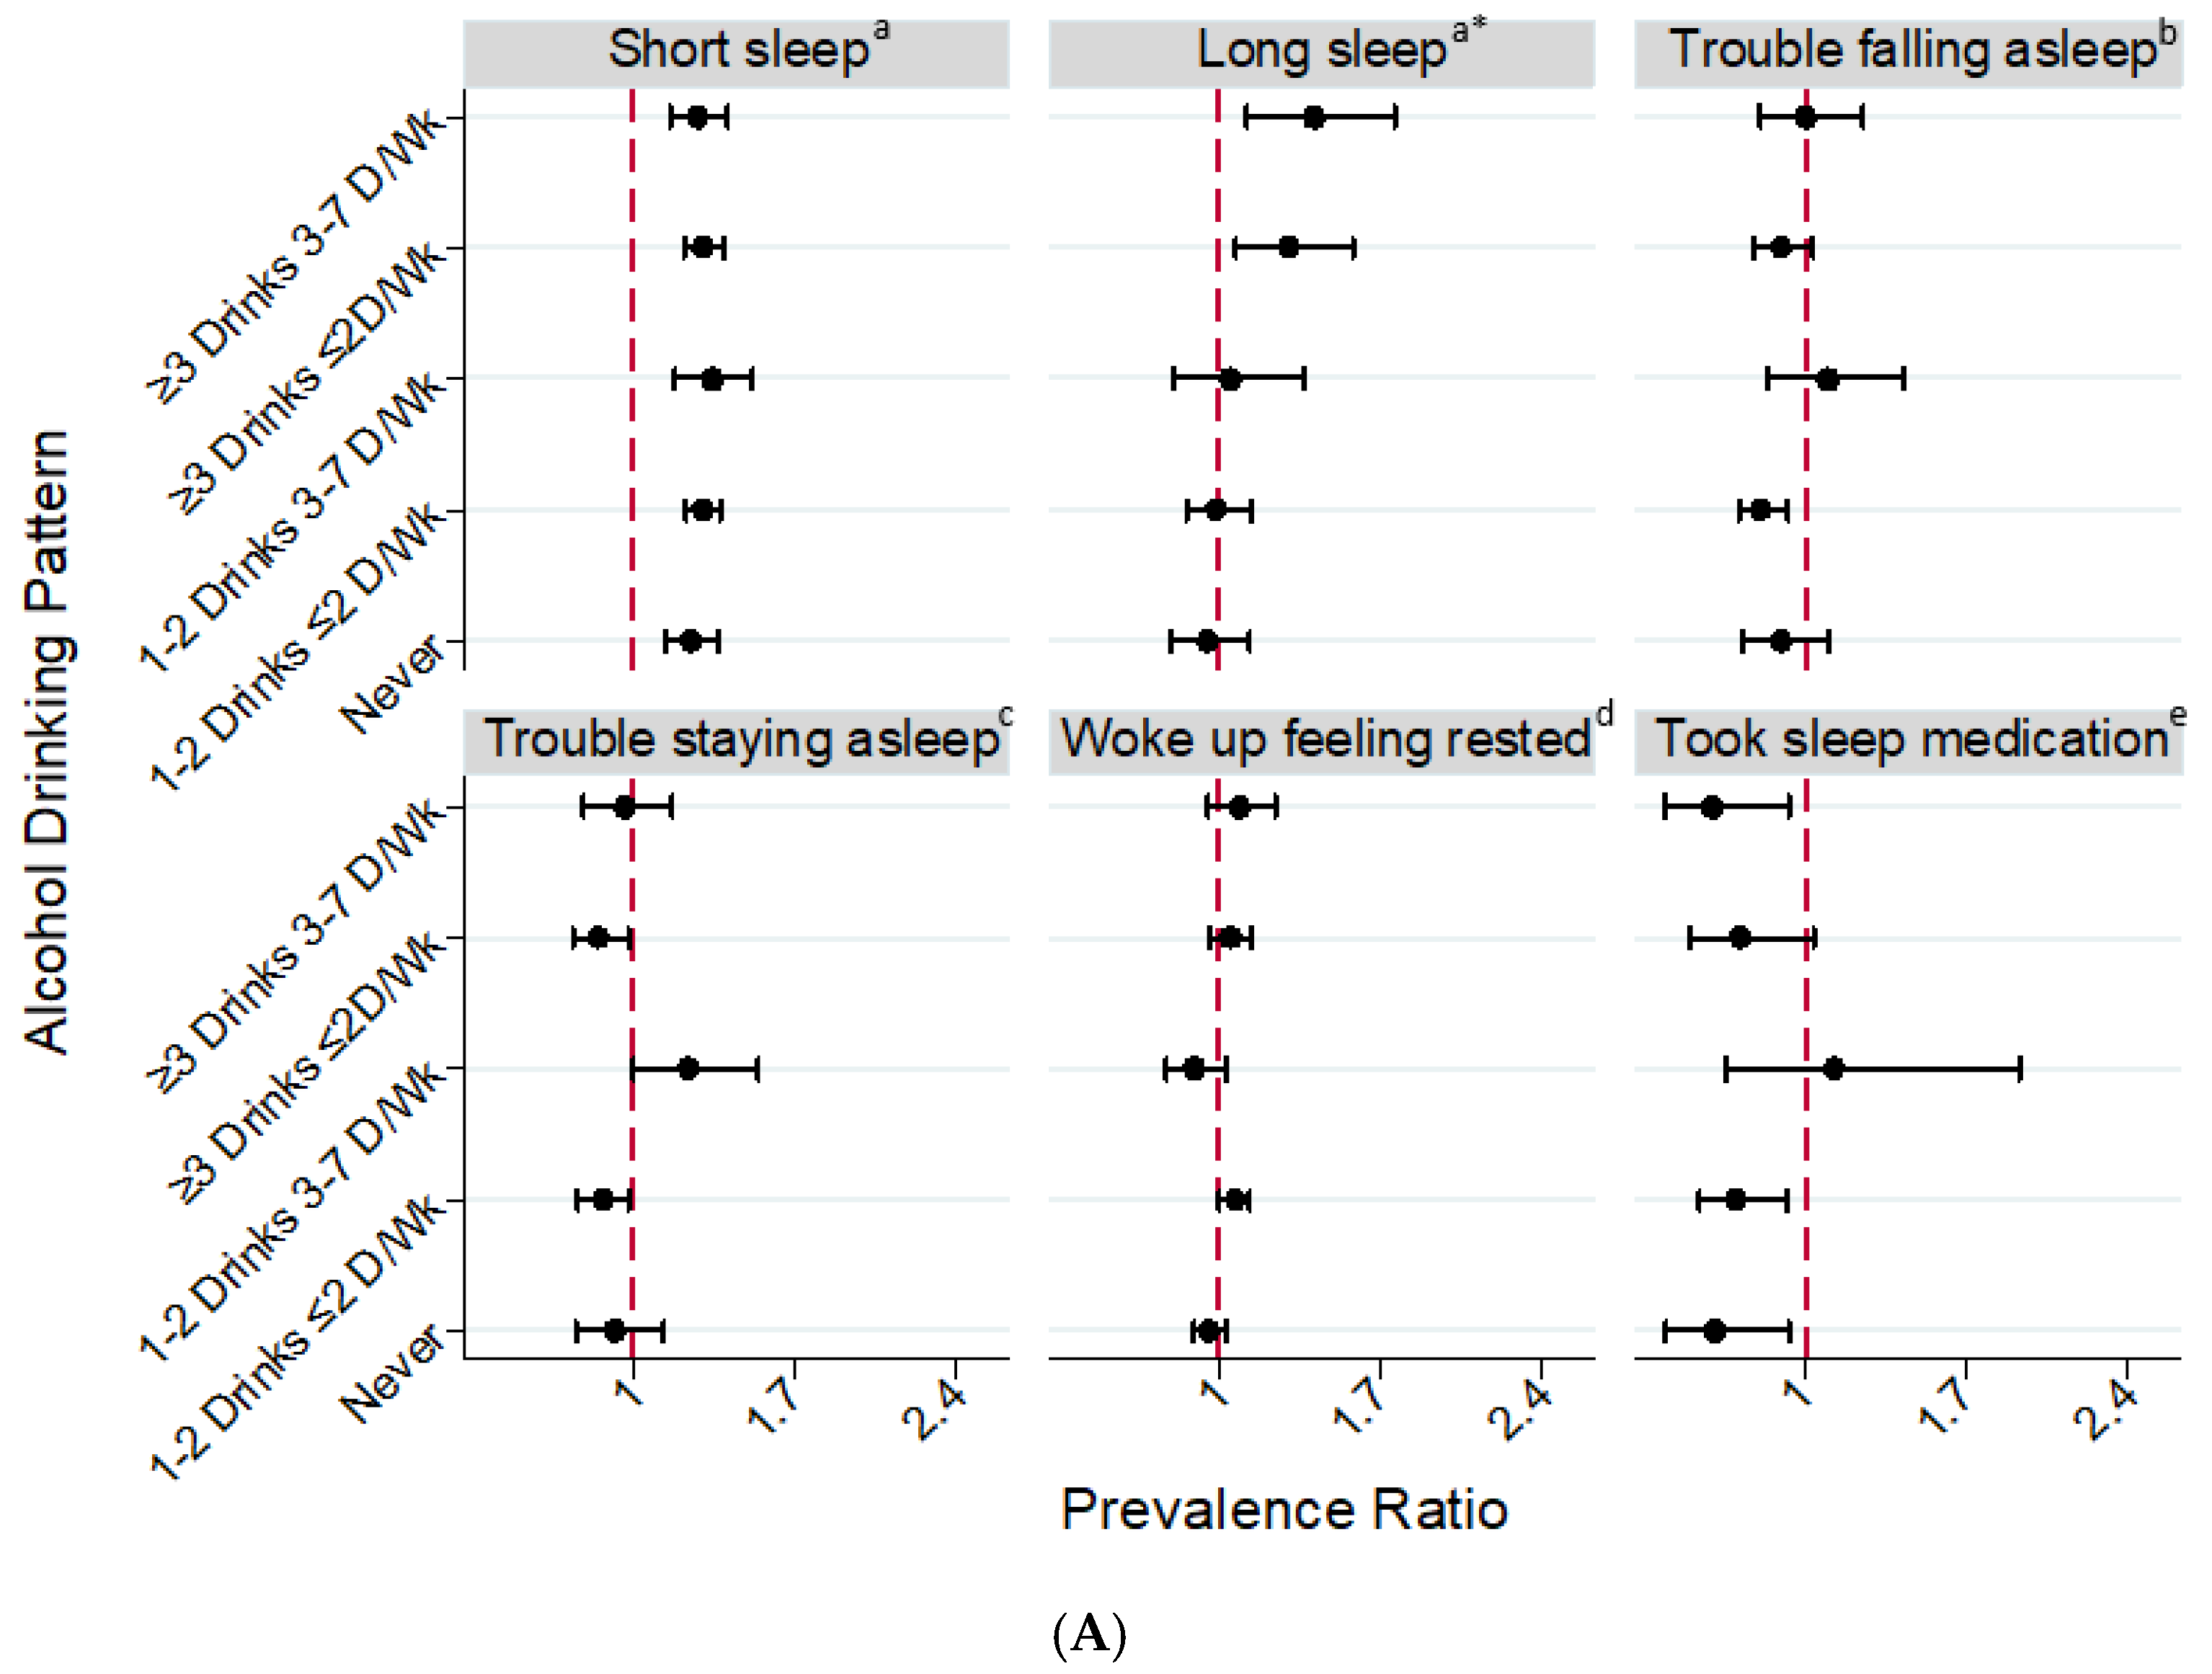
3.2.2. Black-White Differences in Short Sleep Duration by Sex
3.2.3. Black-White Differences in Long Sleep Duration by Sex
3.2.4. Black-White Differences in Sleep Quality by Sex
4. Discussion
5. Conclusions
Supplementary Materials
Acknowledgments
Author Contributions
Conflicts of Interest
References
- Ahrnsbrak, R.; Bose, J.; Hedden, S.L.; Lipari, R.N.; Park-Lee, E. Key Substance Use and Mental Health Indicators in the United States: Results for the 2016 National Survey on Drug Use and Health; Center for Behavioral Health Statistics and Quality, Substance Abuse and Mental Health Services Administration: Rockville, MD, USA, 2017.
- Danaei, G.; Ding, E.L.; Mozaffarian, D.; Taylor, B.; Rehm, J.; Murray, C.J.; Ezzati, M. The preventable causes of death in the united states: Comparative risk assessment of dietary, lifestyle, and metabolic risk factors. PLoS Med. 2009, 6, e1000058. [Google Scholar] [CrossRef] [PubMed]
- Koppes, L.L.; Dekker, J.M.; Hendriks, H.F.; Bouter, L.M.; Heine, R.J. Meta-analysis of the relationship between alcohol consumption and coronary heart disease and mortality in type 2 diabetic patients. Diabetologia 2006, 49, 648–652. [Google Scholar] [CrossRef] [PubMed] [Green Version]
- Thun, M.J.; Peto, R.; Lopez, A.D.; Monaco, J.H.; Henley, S.J.; Heath, C.W., Jr.; Doll, R. Alcohol consumption and mortality among middle-aged and elderly U.S. Adults. N. Engl. J. Med. 1997, 337, 1705–1714. [Google Scholar] [CrossRef] [PubMed]
- Zhao, J.; Stockwell, T.; Roemer, A.; Naimi, T.; Chikritzhs, T. Alcohol consumption and mortality from coronary heart disease: An updated meta-analysis of cohort studies. J. Stud. Alcohol Drugs 2017, 78, 375–386. [Google Scholar] [CrossRef] [PubMed]
- Rehm, J.; Gmel, G.E., Sr.; Gmel, G.; Hasan, O.S.M.; Imtiaz, S.; Popova, S.; Probst, C.; Roerecke, M.; Room, R.; Samokhvalov, A.V.; et al. The relationship between different dimensions of alcohol use and the burden of disease-an update. Addiction 2017, 112, 968–1001. [Google Scholar] [CrossRef] [PubMed]
- Jackson, C.L.; Redline, S.; Emmons, K.M. Sleep as a potential fundamental contributor to disparities in cardiovascular health. Annu. Rev. Public Health 2015, 36, 417–440. [Google Scholar] [CrossRef] [PubMed]
- Hirshkowitz, M.; Whiton, K.; Albert, S.M.; Alessi, C.; Bruni, O.; DonCarlos, L.; Hazen, N.; Herman, J.; Adams Hillard, P.J.; Katz, E.S.; et al. National sleep foundation’s updated sleep duration recommendations: Final report. Sleep Health 2015, 1, 233–243. [Google Scholar] [CrossRef] [PubMed]
- Alcohol Facts and Statistics. Available online: https://pubs.niaaa.nih.gov/publications/AlcoholFacts&Stats/AlcoholFacts&Stats.htm (accessed on 15 March 2018).
- Chakravorty, S.; Jackson, N.; Chaudhary, N.; Kozak, P.J.; Perlis, M.L.; Shue, H.R.; Grandner, M.A. Daytime sleepiness: Associations with alcohol use and sleep duration in americans. Sleep Disord. 2014, 2014, 959152. [Google Scholar] [CrossRef] [PubMed]
- Chaput, J.P.; McNeil, J.; Despres, J.P.; Bouchard, C.; Tremblay, A. Short sleep duration is associated with greater alcohol consumption in adults. Appetite 2012, 59, 650–655. [Google Scholar] [CrossRef] [PubMed]
- Foster, J.H.; Peters, T.J.; Kind, P. Quality of life, sleep, mood and alcohol consumption: A complex interaction. Addict. Biol. 2002, 7, 55–65. [Google Scholar] [CrossRef] [PubMed]
- Grandner, M.A.; Jackson, N.J.; Izci-Balserak, B.; Gallagher, R.A.; Murray-Bachmann, R.; Williams, N.J.; Patel, N.P.; Jean-Louis, G. Social and behavioral determinants of perceived insufficient sleep. Front. Neurol. 2015, 6, 112. [Google Scholar] [CrossRef] [PubMed]
- Irwin, M.; Gillin, J.C.; Dang, J.; Weissman, J.; Phillips, E.; Ehlers, C.L. Sleep deprivation as a probe of homeostatic sleep regulation in primary alcoholics. Biol. Psychiatry 2002, 51, 632–641. [Google Scholar] [CrossRef]
- Park, S.Y.; Oh, M.K.; Lee, B.S.; Kim, H.G.; Lee, W.J.; Lee, J.H.; Lim, J.T.; Kim, J.Y. The effects of alcohol on quality of sleep. Korean J. Fam. Med. 2015, 36, 294–299. [Google Scholar] [CrossRef] [PubMed]
- Roehrs, T.; Papineau, K.; Rosenthal, L.; Roth, T. Ethanol as a hypnotic in insomniacs: Self administration and effects on sleep and mood. Neuropsychopharmacology 1999, 20, 279–286. [Google Scholar] [CrossRef]
- Roehrs, T.; Roth, T. Sleep, sleepiness, and alcohol use. Alcohol Res. Health J. Natl. Inst. Alcohol Abuse Alcohol. 2001, 25, 101–109. [Google Scholar]
- Rupp, T.L.; Acebo, C.; Van Reen, E.; Carskadon, M.A. Effects of a moderate evening alcohol dose. I: Sleepiness. Alcohol. Clin. Exp. Res. 2007, 31, 1358–1364. [Google Scholar] [CrossRef] [PubMed]
- Stein, M.D.; Friedmann, P.D. Disturbed sleep and its relationship to alcohol use. Subst. Abuse 2005, 26, 1–13. [Google Scholar] [CrossRef]
- Johnson, E.O.; Roehrs, T.; Roth, T.; Breslau, N. Epidemiology of alcohol and medication as aids to sleep in early adulthood. Sleep 1998, 21, 178–186. [Google Scholar] [CrossRef] [PubMed]
- Taylor, D.J.; Bramoweth, A.D. Patterns and consequences of inadequate sleep in college students: Substance use and motor vehicle accidents. J. Adolesc. Health 2010, 46, 610–612. [Google Scholar] [CrossRef] [PubMed]
- Hartwell, E.E.; Bujarski, S.; Glasner-Edwards, S.; Ray, L.A. The association of alcohol severity and sleep quality in problem drinkers. Alcohol Alcohol. 2015, 50, 536–541. [Google Scholar] [CrossRef] [PubMed]
- Irwin, M.; Miller, C.; Gillin, J.C.; Demodena, A.; Ehlers, C.L. Polysomnographic and spectral sleep eeg in primary alcoholics: An interaction between alcohol dependence and african-american ethnicity. Alcohol. Clin. Exp. Res. 2000, 24, 1376–1384. [Google Scholar] [CrossRef] [PubMed]
- Bierut, L.J.; Goate, A.M.; Breslau, N.; Johnson, E.O.; Bertelsen, S.; Fox, L.; Agrawal, A.; Bucholz, K.K.; Grucza, R.; Hesselbrock, V.; et al. Adh1b is associated with alcohol dependence and alcohol consumption in populations of european and african ancestry. Mol. Psychiatry 2012, 17, 445–450. [Google Scholar] [CrossRef] [PubMed]
- Crabb, D.W.; Matsumoto, M.; Chang, D.; You, M. Overview of the role of alcohol dehydrogenase and aldehyde dehydrogenase and their variants in the genesis of alcohol-related pathology. Proc. Nutr. Soc. 2004, 63, 49–63. [Google Scholar] [CrossRef] [PubMed]
- McCarthy, D.M.; Pedersen, S.L.; Lobos, E.A.; Todd, R.D.; Wall, T.L. Adh1b*3 and response to alcohol in african-americans. Alcohol. Clin. Exp. Res. 2010, 34, 1274–1281. [Google Scholar] [CrossRef] [PubMed]
- Zapolski, T.C.; Pedersen, S.L.; McCarthy, D.M.; Smith, G.T. Less drinking, yet more problems: Understanding african american drinking and related problems. Psychol. Bull. 2014, 140, 188–223. [Google Scholar] [CrossRef] [PubMed]
- Witbrodt, J.; Mulia, N.; Zemore, S.E.; Kerr, W.C. Racial/ethnic disparities in alcohol-related problems: Differences by gender and level of heavy drinking. Alcohol. Clin. Exp. Res. 2014, 38, 1662–1670. [Google Scholar] [CrossRef] [PubMed]
- Jackson, J.S.; Knight, K.M.; Rafferty, J.A. Race and unhealthy behaviors: Chronic stress, the hpa axis, and physical and mental health disparities over the life course. Am. J. Public Health 2010, 100, 933–939. [Google Scholar] [CrossRef] [PubMed]
- National Center for Health Statistics. Survey Description, National Health Interview Survey. 2015. Available online: ftp://ftp.cdc.gov/pub/Health_Statistics/NCHS/Dataset_Documentation/NHIS/2015/srvydesc.pdf (accessed on 15 March 2018).
- Jackson, C.L.; Hu, F.B.; Redline, S.; Williams, D.R.; Mattei, J.; Kawachi, I. Racial/ethnic disparities in short sleep duration by occupation: The contribution of immigrant status. Soc. Sci. Med. (1982) 2014, 118, 71–79. [Google Scholar] [CrossRef] [PubMed]
- Remmers, J.E.; deGroot, W.J.; Sauerland, E.K.; Anch, A.M. Pathogenesis of upper airway occlusion during sleep. J. Appl. Physiol. 1978, 44, 931–938. [Google Scholar] [CrossRef] [PubMed]
- 2015–2020 Dietary Guidelines for Americans. Available online: http://health.gov/dietaryguidelines/2015/guidelines/ (accessed on 15 March 2018).
- Jackson, C.L.; Hu, F.B.; Kawachi, I.; Williams, D.R.; Mukamal, K.J.; Rimm, E.B. Black-white differences in the relationship between alcohol drinking patterns and mortality among us men and women. Am. J. Public Health 2015, 105 (Suppl. 3), S534–S543. [Google Scholar] [CrossRef]
- Grandner, M.A.; Williams, N.J.; Knutson, K.L.; Roberts, D.; Jean-Louis, G. Sleep disparity, race/ethnicity, and socioeconomic position. Sleep Med. 2016, 18, 7–18. [Google Scholar] [CrossRef] [PubMed]
- Williams, D.R.; Mohammed, S.A.; Leavell, J.; Collins, C. Race, socioeconomic status, and health: Complexities, ongoing challenges, and research opportunities. Ann. N. Y. Acad. Sci. 2010, 1186, 69–101. [Google Scholar] [CrossRef] [PubMed]
- US Preventive Services Task Force. Screening for obesity in adults: Recommendations and rationale. Am. Fam. Phys. 2004, 69, 1973–1976. [Google Scholar]
- Blewett, L.A.; Rivera-Drew, J.A.; Griffin, R.; King, M.L.; Williams, K.C. Ipums Health Surveys: National Health Interview Survey. Version 6.2. Available online: http://www.nhis.ipums.org (accessed on 15 March 2018).
- Rao, J.N.; Scott, A.J. A simple method for the analysis of clustered binary data. Biometrics 1992, 48, 577–585. [Google Scholar] [CrossRef] [PubMed]
- Thakkar, M.M.; Sharma, R.; Sahota, P. Alcohol disrupts sleep homeostasis. Alcohol 2015, 49, 299–310. [Google Scholar] [CrossRef] [PubMed]
- Jackson, C.L. Determinants of racial/ethnic disparities in disordered sleep and obesity. Sleep Health 2017, 3, 401–415. [Google Scholar] [CrossRef] [PubMed]
- Slopen, N.; Lewis, T.T.; Williams, D.R. Discrimination and sleep: A systematic review. Sleep Med. 2016, 18, 88–95. [Google Scholar] [CrossRef] [PubMed]
- Hasin, D.S.; Stinson, F.S.; Ogburn, E.; Grant, B.F. Prevalence, correlates, disability, and comorbidity of dsm-iv alcohol abuse and dependence in the united states: Results from the national epidemiologic survey on alcohol and related conditions. Arch. Gen. Psychiatry 2007, 64, 830–842. [Google Scholar] [CrossRef] [PubMed]
- Peterson, L.M.; Miller, K.G.; Wong, P.M.; Anderson, B.P.; Kamarck, T.W.; Matthews, K.A.; Kirschbaum, C.; Manuck, S.B. Sleep duration partially accounts for race differences in diurnal cortisol dynamics. Health Psychol. 2017, 36, 502–511. [Google Scholar] [CrossRef] [PubMed]
- McEwen, B.S.; Stellar, E. Stress and the individual. Mechanisms leading to disease. Arch. Intern. Med. 1993, 153, 2093–2101. [Google Scholar] [CrossRef] [PubMed]
- Ransome, Y.; Slopen, N.; Karlsson, O.; Williams, D.R. The association between alcohol abuse and neuroendocrine system dysregulation: Race differences in a national sample. Brain Behav. Immun. 2017, 66, 313–321. [Google Scholar] [CrossRef] [PubMed]
- Balbo, M.; Leproult, R.; Van Cauter, E. Impact of sleep and its disturbances on hypothalamo-pituitary-adrenal axis activity. Int. J. Endocrinol. 2010, 2010, 759234. [Google Scholar] [CrossRef] [PubMed]
- Pedersen, S.L.; McCarthy, D.M. Differences in acute response to alcohol between african americans and european americans. Alcohol. Clin. Exp. Res. 2013, 37, 1056–1063. [Google Scholar] [CrossRef] [PubMed]
- Midanik, L. The validity of self-reported alcohol consumption and alcohol problems: A literature review. Br. J. Addict. 1982, 77, 357–382. [Google Scholar] [CrossRef] [PubMed]
- Williams, G.D.; Aitken, S.S.; Malin, H. Reliability of self-reported alcohol consumption in a general population survey. J. Stud. Alcohol. 1985, 46, 223–227. [Google Scholar] [CrossRef] [PubMed]
- Embree, B.G.; Whitehead, P.C. Validity and reliability of self-reported drinking behavior: Dealing with the problem of response bias. J. Stud. Alcohol. 1993, 54, 334–344. [Google Scholar] [CrossRef] [PubMed]
- Midanik, L.T. Validity of self-reported alcohol use: A literature review and assessment. Br. J. Addict. 1988, 83, 1019–1030. [Google Scholar] [CrossRef] [PubMed]
- Grandner, M.A.; Patel, N.P.; Gehrman, P.R.; Xie, D.; Sha, D.; Weaver, T.; Gooneratne, N. Who gets the best sleep? Ethnic and socioeconomic factors related to sleep complaints. Sleep Med. 2010, 11, 470–478. [Google Scholar] [PubMed]
- Lauderdale, D.S.; Knutson, K.L.; Yan, L.L.; Rathouz, P.J.; Hulley, S.B.; Sidney, S.; Liu, K. Objectively measured sleep characteristics among early-middle-aged adults: The cardia study. Am. J. Epidemiol. 2006, 164, 5–16. [Google Scholar] [CrossRef] [PubMed]


| Sociodemographic, Health Behavior, and Clinical Characteristics | Never Drinkers | Moderate Infrequent | Moderate Frequent | Heavy Infrequent | Heavy Frequent | |||||||||||||||
|---|---|---|---|---|---|---|---|---|---|---|---|---|---|---|---|---|---|---|---|---|
| 1–2 Drinks ≤ 2 Days/Week | 1–2 Drinks 3–7 Days/Week | ≥3 Drinks ≤ 2 Days/Week | ≥3 Drinks 3–7 Days/Week | |||||||||||||||||
| White | % | Black | % | White | % | Black | % | White | % | Black | % | White | % | Black | % | White | % | Black | % | |
| Sample size a | 9236 | 13.7 | 3184 | 26.7 | 27,485 | 38.8 | 5022 | 38.5 | 10,382 | 13.9 | 996 | 6.9 | 16,666 | 23.7 | 2553 | 19.9 | 7561 | 9.9 | 1109 | 8.0 |
| Age, years, mean ± SE | 45.2 | 0.31 | 38.3 | 0.44 | 48.8 | 0.16 | 42.4 | 0.32 | 54.0 | 0.23 | 46.2 | 0.61 | 37.4 | 0.18 | 38.0 | 0.36 | 44.5 | 0.28 | 43.2 | 0.53 |
| Educational attainment | ||||||||||||||||||||
| <High school | 1192 | 13.1 | 576 | 19.3 | 1582 | 5.7 | 603 | 13.4 | 417 | 3.4 | 125 | 13.4 | 1108 | 9.0 | 350 | 18.0 | 573 | 8.7 | 213 | 20.3 |
| High school graduate | 3112 | 35.4 | 1307 | 41.5 | 6940 | 25.8 | 1718 | 34.9 | 1978 | 18.9 | 354 | 34.0 | 5362 | 34.8 | 974 | 37.5 | 2323 | 30.8 | 455 | 41.5 |
| Some college | 2557 | 26.6 | 841 | 24.7 | 8242 | 29.2 | 1678 | 32.4 | 2675 | 25.6 | 322 | 32.1 | 5957 | 32.9 | 861 | 32.3 | 2567 | 31.1 | 299 | 27.2 |
| ≥College | 2306 | 24.9 | 435 | 14.5 | 10,669 | 39.2 | 1,001 | 19.4 | 5289 | 52.1 | 189 | 20.5 | 4213 | 23.3 | 362 | 12.2 | 2090 | 29.4 | 136 | 11.1 |
| Marital status | ||||||||||||||||||||
| Married | 4705 | 59.2 | 980 | 45.0 | 16,182 | 69.6 | 1758 | 48.5 | 6447 | 72.0 | 318 | 43.0 | 6405 | 56.3 | 651 | 41.1 | 2828 | 52.8 | 279 | 38.9 |
| Divorced/separated/widowed | 1613 | 12.3 | 711 | 20.2 | 5688 | 14.7 | 1424 | 24.6 | 2218 | 13.9 | 350 | 30.4 | 3229 | 20.1 | 654 | 28.0 | 2131 | 24.7 | 363 | 30.3 |
| Never married | 2890 | 28.5 | 1487 | 34.8 | 5569 | 15.7 | 1825 | 26.9 | 1696 | 14.2 | 324 | 26.5 | 7007 | 23.6 | 1242 | 30.9 | 2594 | 22.5 | 463 | 30.8 |
| Unemployed or not in workforce | 4016 | 41.8 | 1548 | 51.2 | 8137 | 30.9 | 1837 | 42.2 | 3593 | 29.2 | 369 | 38.9 | 3391 | 33.0 | 833 | 43.6 | 2178 | 36.0 | 491 | 53.2 |
| Annual Household income (<$35,000 per year) | 3411 | 34.3 | 1616 | 50.1 | 6147 | 19.6 | 2142 | 39.2 | 1873 | 14.9 | 448 | 41.3 | 5385 | 28.1 | 1257 | 47.2 | 2631 | 28.6 | 638 | 52.9 |
| Living in poverty | 1096 | 9.9 | 637 | 18.6 | 1550 | 4.4 | 783 | 13.5 | 354 | 2.8 | 174 | 16.7 | 1804 | 7.2 | 494 | 19.3 | 790 | 8.1 | 267 | 23.9 |
| Smoking status | ||||||||||||||||||||
| Never | 7047 | 75.2 | 2505 | 77.5 | 14,731 | 52.8 | 2827 | 52.8 | 4600 | 46.8 | 364 | 35.8 | 7139 | 35.8 | 1182 | 38.0 | 2302 | 28.2 | 343 | 28.9 |
| Former | 1267 | 14.6 | 275 | 10.5 | 8110 | 31.4 | 914 | 24.1 | 4172 | 37.3 | 221 | 26.1 | 3710 | 32.7 | 383 | 23.2 | 2111 | 33.3 | 185 | 22.0 |
| Current | 917 | 10.2 | 400 | 12.0 | 4625 | 15.8 | 1275 | 23.0 | 1603 | 15.8 | 410 | 38.1 | 5811 | 31.5 | 987 | 38.8 | 3144 | 38.5 | 580 | 49.0 |
| Leisure-time physical activity b | ||||||||||||||||||||
| Never/unable | 4078 | 45.2 | 1552 | 51.8 | 7111 | 26.4 | 1614 | 35.3 | 2131 | 19.5 | 361 | 36.9 | 3673 | 27.3 | 786 | 37.5 | 2019 | 29.0 | 488 | 44.3 |
| Low | 2350 | 25.9 | 773 | 23.9 | 10,109 | 37.3 | 1757 | 34.6 | 3711 | 37.0 | 279 | 29.2 | 6269 | 36.4 | 887 | 33.3 | 2512 | 33.5 | 287 | 25.9 |
| High | 2769 | 28.9 | 842 | 24.3 | 10,159 | 36.4 | 1635 | 30.2 | 4505 | 43.4 | 353 | 33.9 | 6672 | 36.3 | 871 | 29.2 | 3000 | 37.6 | 328 | 29.8 |
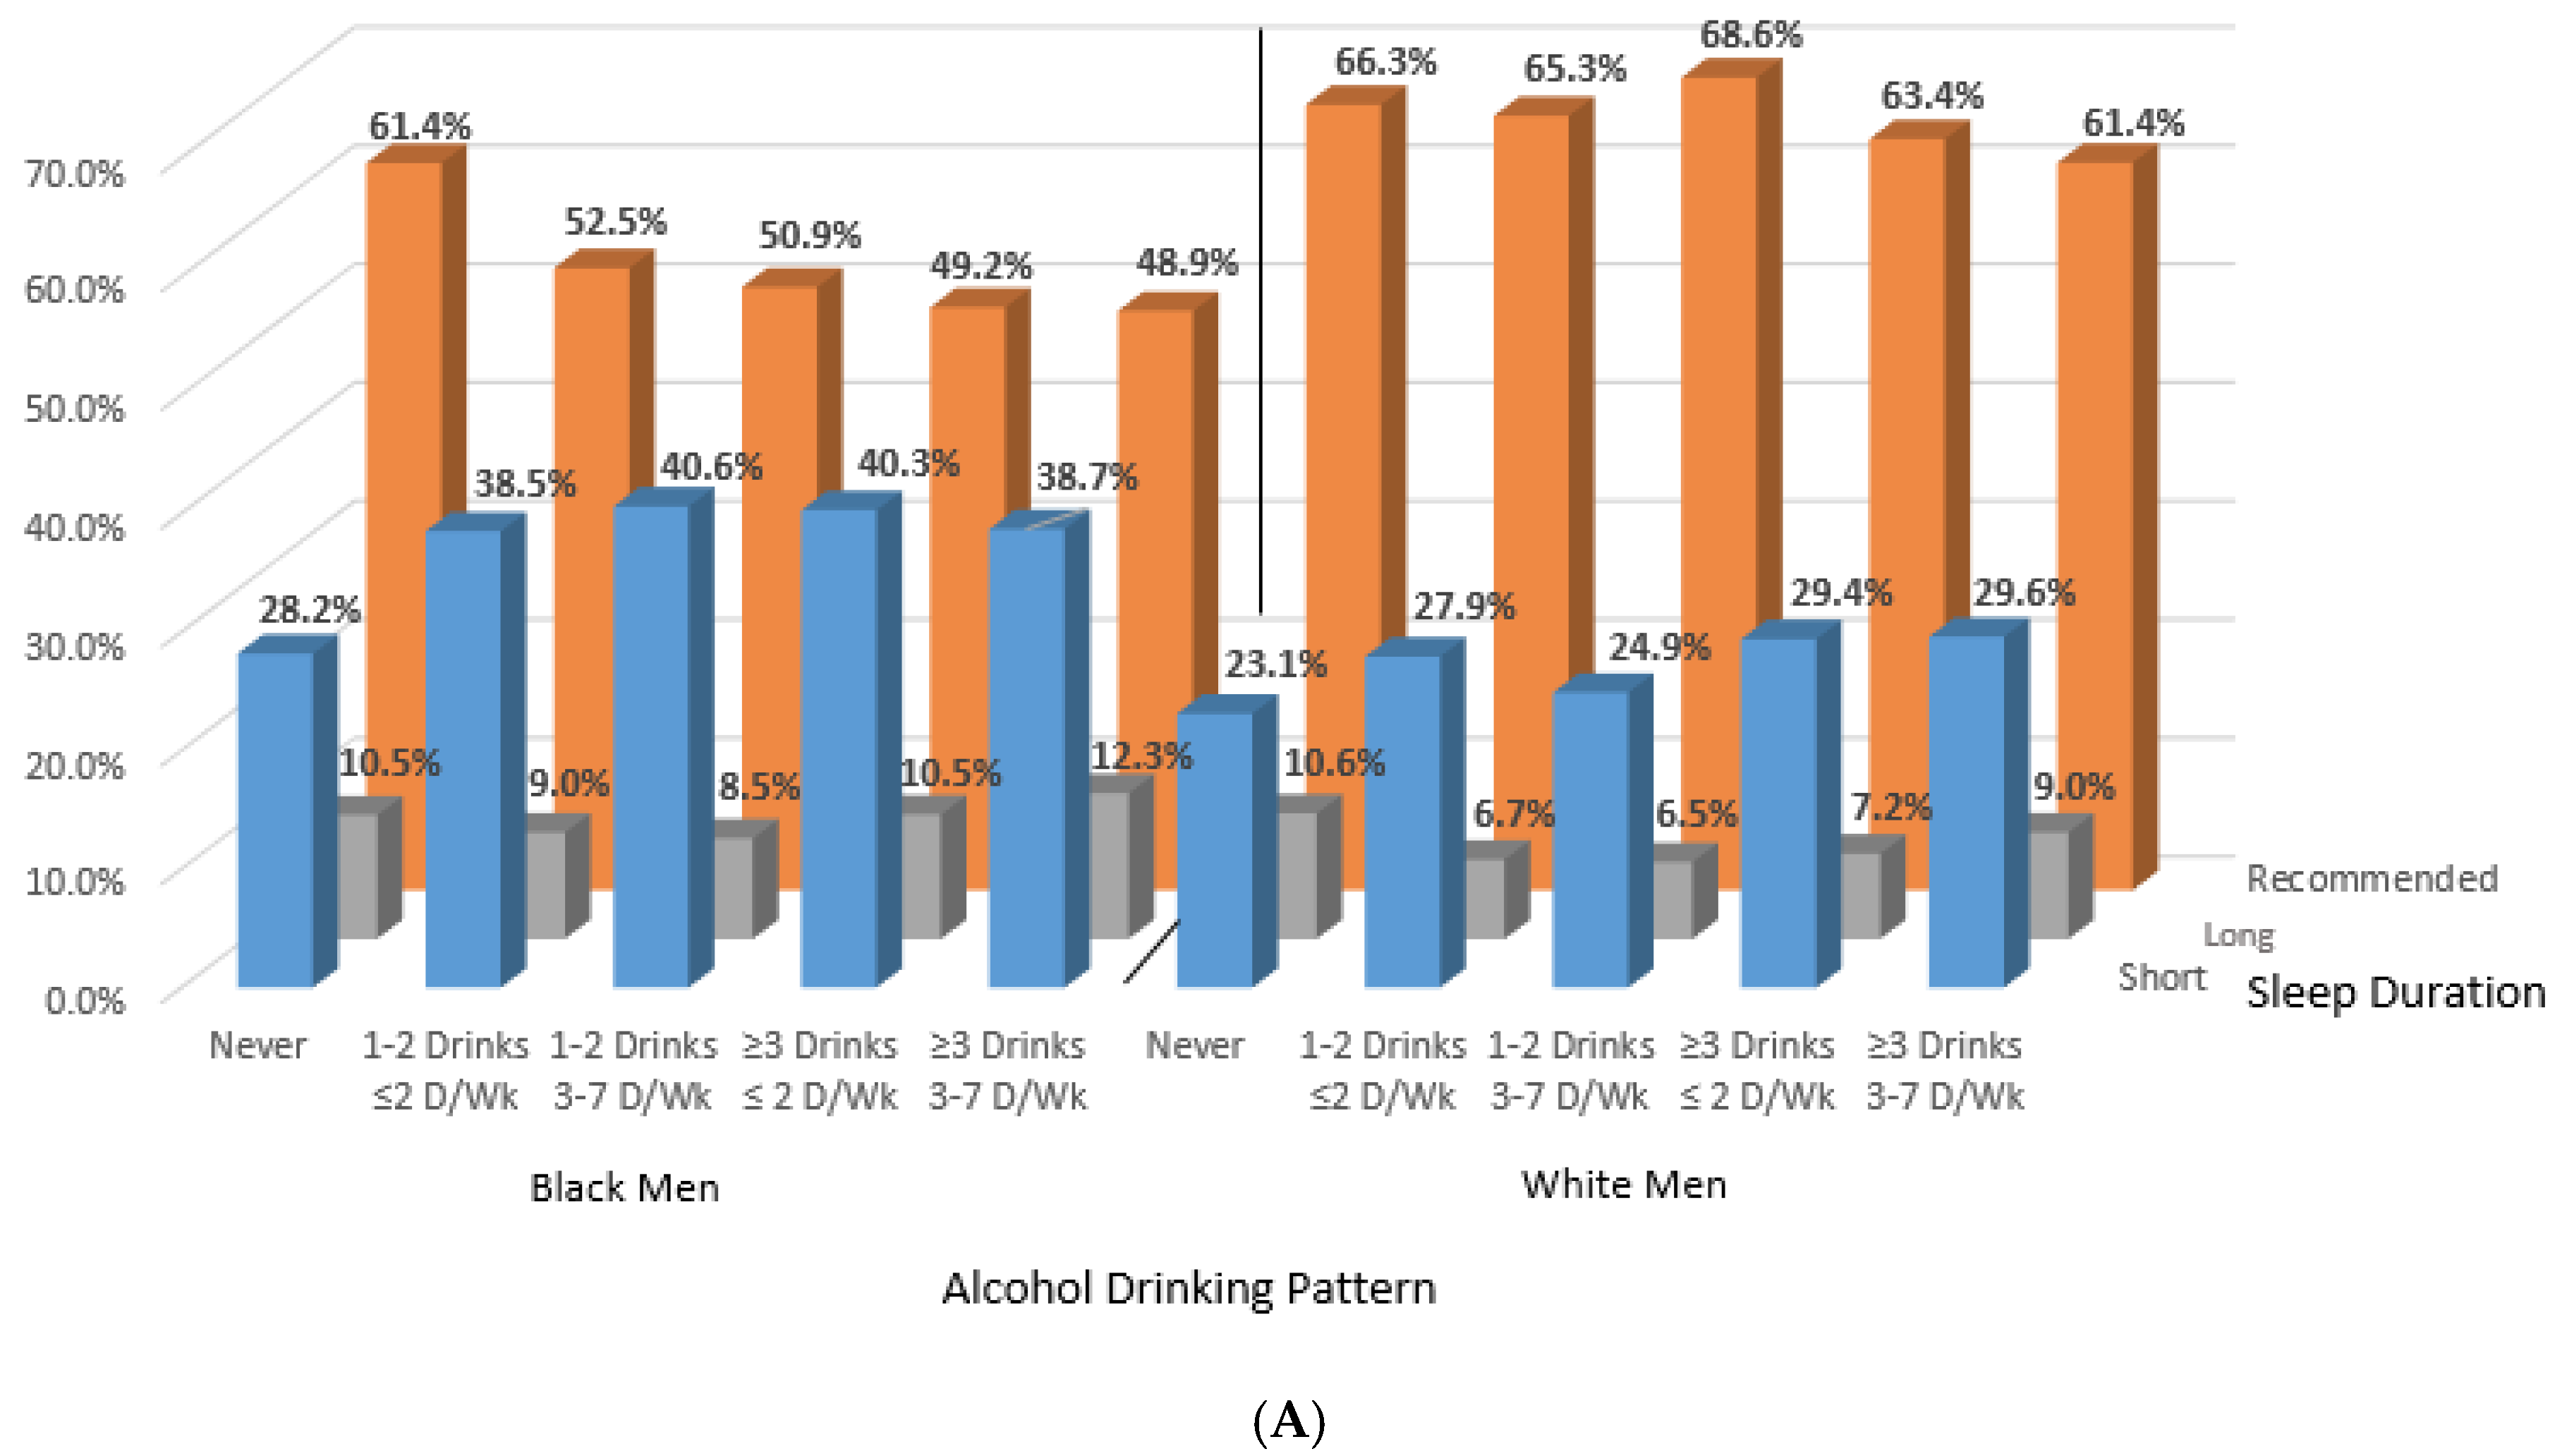
| Sleep duration | ||||||||||||||||||||
| <7 h | 2143 | 23.1 | 912 | 28.2 | 7879 | 27.9 | 1993 | 38.5 | 2506 | 24.9 | 401 | 40.6 | 5403 | 29.4 | 1061 | 40.3 | 2391 | 29.6 | 450 | 38.7 |
| 7–<9 h | 6090 | 66.3 | 1953 | 61.4 | 17,795 | 65.3 | 2633 | 52.5 | 7092 | 68.6 | 507 | 50.9 | 10,300 | 63.4 | 1266 | 49.2 | 4586 | 61.4 | 532 | 48.9 |
| ≥9 h | 1003 | 10.6 | 319 | 10.5 | 1811 | 6.7 | 396 | 9.0 | 784 | 6.5 | 88 | 8.5 | 963 | 7.2 | 226 | 10.5 | 584 | 9.0 | 127 | 12.3 |
| BMI, kg/m2, mean ± SE | 27.5 | 0.07 | 27.9 | 0.11 | 28.0 | 0.04 | 28.3 | 0.09 | 26.9 | 0.05 | 27.6 | 0.18 | 28.2 | 0.06 | 28.4 | 0.14 | 27.3 | 0.07 | 27.1 | 0.20 |
| Sad (past 30 days) (≥mostly) | 215 | 2.3 | 85 | 2.2 | 466 | 1.6 | 171 | 2.9 | 133 | 1.1 | 39 | 3.8 | 352 | 2.1 | 80 | 2.9 | 248 | 3.0 | 70 | 5.8 |
| Felt depressed (often/a lot) | 71 | 13.7 | 15 | 12.9 | 215 | 10.5 | 54 | 15.0 | 64 | 10.4 | 13 | 15.8 | 186 | 15.1 | 22 | 9.5 | 77 | 9.7 | 10 | 14.7 |
| Health outcomes | ||||||||||||||||||||
| Hypertension | 2861 | 33.0 | 1043 | 40.2 | 8807 | 34.1 | 1878 | 44.6 | 3665 | 33.2 | 412 | 43.4 | 3597 | 35.1 | 824 | 45.7 | 2475 | 39.6 | 451 | 45.6 |
| Heart Disease | 1311 | 14.6 | 249 | 9.5 | 3697 | 14.5 | 440 | 11.3 | 1597 | 13.4 | 93 | 10.5 | 1082 | 12.5 | 179 | 10.0 | 751 | 12.8 | 88 | 9.1 |
| Cancer (yes) | 963 | 10.3 | 133 | 4.9 | 2876 | 11.4 | 241 | 7.1 | 1488 | 12.6 | 59 | 8.5 | 646 | 9.1 | 64 | 5.1 | 603 | 12.3 | 40 | 5.0 |
| Type 2 diabetes | 1017 | 12.1 | 412 | 16.1 | 2439 | 9.8 | 633 | 16.4 | 582 | 5.1 | 93 | 10.6 | 662 | 8.6 | 211 | 13.4 | 320 | 5.7 | 87 | 10.0 |
| Health status | ||||||||||||||||||||
| Excellent/very good | 5606 | 60.1 | 1731 | 49.2 | 18,180 | 65.7 | 2710 | 49.5 | 7452 | 74.0 | 524 | 50.9 | 11,608 | 62.1 | 1435 | 47.6 | 4767 | 59.9 | 498 | 41.7 |
| Good | 2319 | 25.7 | 861 | 28.8 | 6697 | 24.8 | 1468 | 32.0 | 2218 | 20.4 | 303 | 31.4 | 3870 | 27.8 | 765 | 35.0 | 2001 | 28.9 | 370 | 34.7 |
| Fair/poor | 1304 | 14.2 | 591 | 22.0 | 2600 | 9.5 | 844 | 18.5 | 709 | 5.6 | 169 | 17.7 | 1185 | 10.2 | 353 | 17.5 | 792 | 11.2 | 241 | 23.5 |
| Region of residence | ||||||||||||||||||||
| Northeast | 1034 | 12.4 | 366 | 12.6 | 5104 | 20.3 | 600 | 13.2 | 2224 | 21.6 | 78 | 8.6 | 2773 | 20.1 | 278 | 12.9 | 1306 | 17.8 | 89 | 7.7 |
| Midwest | 2311 | 25.4 | 535 | 17.0 | 7737 | 28.3 | 971 | 19.2 | 2398 | 23.4 | 174 | 17.4 | 5857 | 34.7 | 510 | 19.0 | 2022 | 26.8 | 172 | 17.7 |
| South | 3837 | 43.3 | 2015 | 63.0 | 8574 | 32.1 | 2852 | 56.8 | 2956 | 30.2 | 583 | 59.8 | 4952 | 29.6 | 1532 | 59.4 | 2483 | 35.0 | 742 | 65.5 |
| West | 2054 | 19.0 | 268 | 7.4 | 6070 | 19.3 | 599 | 10.9 | 2804 | 24.9 | 161 | 14.2 | 3084 | 15.6 | 233 | 8.7 | 1750 | 20.4 | 106 | 9.1 |
| Sociodemographic, Health Behavior, and Clinical Characteristics | Never Drinkers | Moderate Infrequent | Moderate Frequent | Heavy Infrequent | Heavy Frequent | |||||||||||||||
|---|---|---|---|---|---|---|---|---|---|---|---|---|---|---|---|---|---|---|---|---|
| 1 Drink ≤ 2 Days/Week | 1 Drink 3–7 Days/Week | ≥2 Drinks ≤ 2 Days/Week | ≥2 Drinks 3–7 Days/Week | |||||||||||||||||
| White | % | Black | % | White | % | Black | % | White | % | Black | % | White | % | Black | % | White | % | Black | % | |
| Sample size a | 19,458 | 23.1 | 8671 | 42.6 | 24,656 | 29.4 | 4648 | 23.2 | 4904 | 5.6 | 303 | 1.4 | 28,058 | 34.7 | 6013 | 29.2 | 6256 | 7.2 | 789 | 3.4 |
| Age, years, mean ± SE | 52.5 | 0.26 | 44.4 | 0.31 | 50.8 | 0.15 | 43.7 | 0.31 | 56.5 | 0.32 | 50.3 | 1.21 | 39.8 | 0.14 | 38.5 | 0.26 | 48.4 | 0.29 | 42.7 | 0.58 |
| Educational attainment | ||||||||||||||||||||
| <High school | 3102 | 13.4 | 1747 | 18.7 | 1056 | 4.1 | 383 | 8.5 | 100 | 1.6 | 35 | 11.3 | 1365 | 5.4 | 713 | 14.7 | 218 | 3.5 | 157 | 23.2 |
| High school graduate | 7231 | 37.1 | 3195 | 37.9 | 6121 | 25.6 | 1218 | 26.9 | 933 | 16.4 | 71 | 22.4 | 7083 | 30.2 | 1802 | 29.8 | 1254 | 21.5 | 233 | 31.4 |
| Some college | 5537 | 30.7 | 2545 | 29.7 | 8074 | 32.1 | 1782 | 37.0 | 1402 | 28.6 | 94 | 31.8 | 10,480 | 35.3 | 2379 | 36.7 | 2006 | 31.5 | 260 | 29.1 |
| ≥College | 3499 | 18.8 | 1122 | 13.7 | 9359 | 38.2 | 1248 | 27.6 | 2464 | 53.4 | 102 | 34.6 | 9078 | 29.1 | 1098 | 18.8 | 2766 | 43.4 | 136 | 16.3 |
| Marital status | ||||||||||||||||||||
| Married | 8437 | 55.8 | 1680 | 29.1 | 12,984 | 64.1 | 1084 | 33.7 | 2721 | 69.2 | 77 | 36.8 | 12,245 | 53.9 | 953 | 25.1 | 2818 | 57.4 | 117 | 26.0 |
| Divorced/separated/widowed | 7873 | 24.3 | 3391 | 35.0 | 8243 | 24.2 | 1638 | 36.9 | 1675 | 21.3 | 122 | 36.1 | 7508 | 28.4 | 1804 | 39.6 | 1973 | 25.2 | 282 | 41.6 |
| Never married | 3090 | 19.9 | 3553 | 35.9 | 3362 | 11.6 | 1904 | 29.5 | 500 | 9.5 | 103 | 27.1 | 8247 | 17.7 | 3236 | 35.3 | 1452 | 17.4 | 387 | 32.4 |
| Unemployed or not in workforce | 12,369 | 54.6 | 4711 | 54.0 | 10,371 | 41.0 | 1644 | 41.3 | 2297 | 38.6 | 120 | 40.9 | 7582 | 37.8 | 2046 | 44.4 | 2224 | 39.9 | 317 | 49.3 |
| Annual Household income (<$35,000 per year) | 9250 | 40.8 | 5613 | 61.5 | 6919 | 24.3 | 2229 | 44.6 | 969 | 15.5 | 139 | 41.3 | 9216 | 28.8 | 3502 | 54.2 | 1653 | 21.9 | 500 | 57.9 |
| Living in poverty | 2565 | 12.4 | 2706 | 29.9 | 1609 | 5.4 | 970 | 19.0 | 146 | 2.6 | 57 | 16.3 | 3434 | 7.9 | 1733 | 22.9 | 465 | 5.3 | 243 | 26.0 |
| Smoking status | ||||||||||||||||||||
| Never | 15,407 | 79.6 | 7250 | 84.3 | 15,503 | 63.8 | 3208 | 65.9 | 2,546 | 54.4 | 138 | 47.5 | 13,665 | 45.7 | 3409 | 49.5 | 2376 | 37.1 | 278 | 33.2 |
| Former | 2126 | 9.6 | 599 | 6.9 | 5887 | 23.4 | 662 | 18.2 | 1854 | 35.2 | 61 | 21.4 | 6308 | 29.5 | 777 | 21.6 | 2065 | 36.3 | 119 | 22.3 |
| Current | 1906 | 10.8 | 815 | 8.7 | 3255 | 12.8 | 776 | 15.9 | 497 | 10.4 | 104 | 31.1 | 8068 | 24.8 | 1823 | 28.9 | 1811 | 26.6 | 392 | 44.4 |
| Leisure-time physical activity b | ||||||||||||||||||||
| Never/unable | 9965 | 48.2 | 5051 | 58.1 | 6530 | 26.4 | 1746 | 39.2 | 962 | 16.9 | 102 | 33.8 | 6217 | 25.9 | 2208 | 39.6 | 1277 | 20.8 | 358 | 45.8 |
| Low | 4464 | 24.9 | 1919 | 22.7 | 8850 | 37.1 | 1560 | 34.3 | 1666 | 36.1 | 99 | 31.9 | 11,007 | 38.2 | 2069 | 34.4 | 2150 | 34.9 | 192 | 24.4 |
| High | 4972 | 26.9 | 1680 | 19.2 | 9228 | 36.5 | 1334 | 26.5 | 2261 | 47.0 | 100 | 34.3 | 10,764 | 36.0 | 1727 | 26.0 | 2816 | 44.3 | 237 | 29.8 |
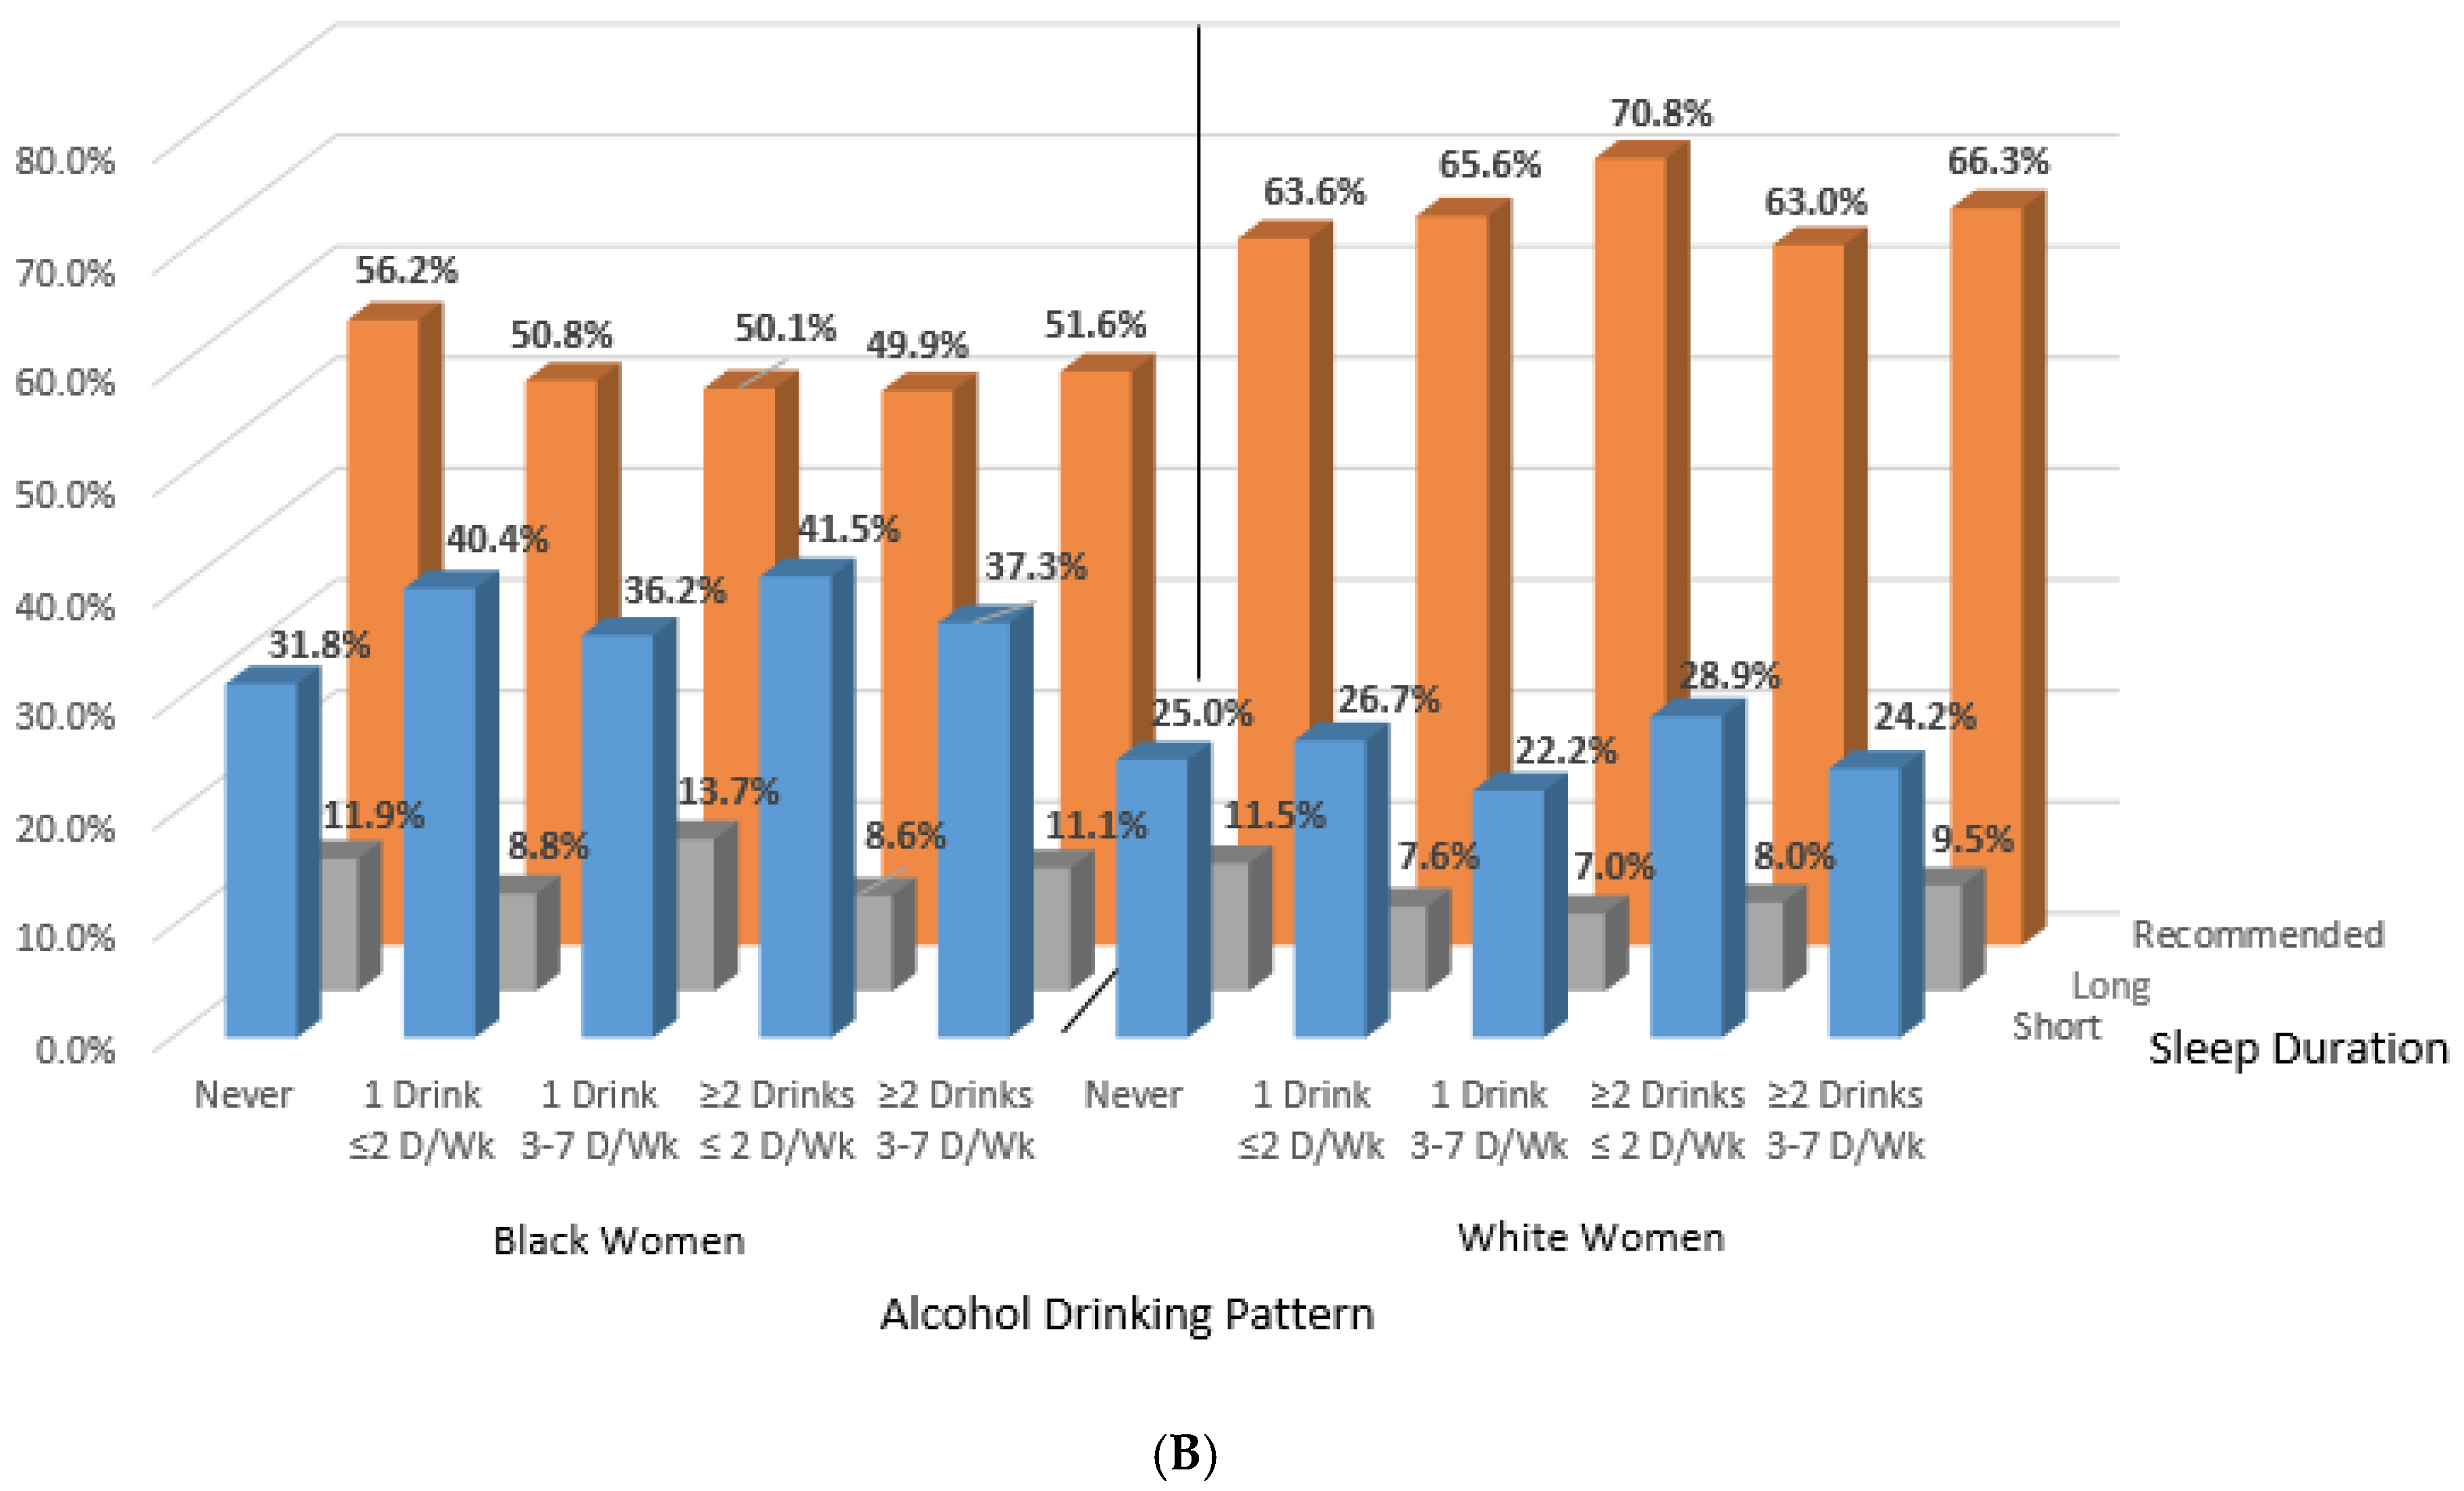
| Sleep duration | ||||||||||||||||||||
| <7 h | 5035 | 25.0 | 2666 | 31.8 | 6730 | 26.7 | 1883 | 40.4 | 1087 | 22.2 | 126 | 36.2 | 8306 | 28.9 | 2504 | 41.5 | 1585 | 24.2 | 311 | 37.3 |
| 7–<9 h | 12,007 | 63.6 | 4960 | 56.2 | 16,015 | 65.6 | 2408 | 50.8 | 3438 | 70.8 | 141 | 50.1 | 17,725 | 63.0 | 3011 | 49.9 | 4103 | 66.3 | 390 | 51.6 |
| ≥9 h | 2416 | 11.5 | 1045 | 11.9 | 1911 | 7.6 | 357 | 8.8 | 379 | 7.0 | 36 | 13.7 | 2027 | 8.1 | 498 | 8.6 | 568 | 9.5 | 88 | 11.1 |
| BMI, kg/m2, mean ± SE | 27.1 | 0.06 | 29.3 | 0.08 | 26.9 | 0.05 | 29.62 | 0.12 | 24.4 | 0.08 | 27.33 | 0.36 | 26.75 | 0.05 | 29.63 | 0.13 | 25.11 | 0.07 | 28.17 | 0.26 |
| Sad (past 30 days) (≥mostly) | 696 | 3.6 | 354 | 3.9 | 638 | 2.4 | 195 | 3.3 | 67 | 1.2 | 19 | 4.6 | 820 | 2.6 | 356 | 5.2 | 177 | 2.5 | 83 | 9.4 |
| Felt depressed (often/ a lot) | 237 | 17.2 | 99 | 18.0 | 327 | 13.1 | 60 | 14.4 | 36 | 8.0 | 1 | 0.1 | 473 | 16.2 | 124 | 24.3 | 103 | 13.6 | 19 | 25.6 |
| Health outcomes | ||||||||||||||||||||
| Hypertension (yes) | 7987 | 34.0 | 3879 | 47.9 | 7664 | 30.4 | 1848 | 47.9 | 1544 | 25.3 | 129 | 47.2 | 5363 | 29.6 | 2023 | 49.6 | 1682 | 28.7 | 320 | 55.4 |
| Heart Disease (yes) | 3097 | 12.4 | 882 | 10.8 | 2929 | 11.2 | 413 | 10.2 | 605 | 10.1 | 34 | 12.6 | 1978 | 9.4 | 394 | 9.3 | 521 | 9.4 | 74 | 11.3 |
| Cancer (yes) | 2671 | 10.7 | 441 | 5.2 | 3263 | 13.0 | 221 | 5.7 | 830 | 14.3 | 19 | 9.2 | 2123 | 11.4 | 214 | 6.2 | 754 | 13.8 | 39 | 5.8 |
| Type 2 diabetes | 2519 | 11.4 | 1311 | 17.6 | 1736 | 7.1 | 477 | 13.8 | 141 | 2.3 | 22 | 6.6 | 962 | 5.3 | 419 | 12.9 | 179 | 3.2 | 34 | 6.1 |
| Health status | ||||||||||||||||||||
| Excellent/very good | 10,138 | 55.5 | 3882 | 42.6 | 16,334 | 66.7 | 2451 | 48.1 | 3769 | 78.5 | 166 | 56.8 | 19,729 | 67.3 | 3211 | 46.5 | 4592 | 72.5 | 377 | 42.1 |
| Good | 5595 | 26.8 | 2744 | 32.7 | 6093 | 24.8 | 1456 | 34.2 | 862 | 16.9 | 98 | 31.0 | 6342 | 24.5 | 1839 | 33.4 | 1255 | 20.8 | 258 | 36.7 |
| Fair/poor | 3713 | 17.7 | 2042 | 24.7 | 2219 | 8.5 | 738 | 17.8 | 272 | 4.7 | 39 | 12.1 | 1979 | 8.2 | 962 | 20.1 | 406 | 6.7 | 154 | 21.1 |
| Region of residence | ||||||||||||||||||||
| Northeast | 2274 | 12.4 | 975 | 11.6 | 4830 | 20.7 | 608 | 14.7 | 1131 | 22.6 | 41 | 13.2 | 5206 | 21.3 | 882 | 16.7 | 1250 | 20.2 | 110 | 15.7 |
| Midwest | 4936 | 25.2 | 1480 | 16.3 | 7068 | 28.8 | 858 | 19.5 | 1039 | 21.2 | 48 | 17.0 | 9030 | 31.6 | 1254 | 22.5 | 1319 | 21.9 | 132 | 16.3 |
| South | 8820 | 46.8 | 5649 | 66.2 | 7225 | 30.6 | 2711 | 56.5 | 1412 | 30.1 | 166 | 55.3 | 8500 | 30.4 | 3338 | 52.4 | 1947 | 31.9 | 470 | 57.5 |
| West | 3428 | 15.6 | 567 | 5.9 | 5533 | 19.9 | 471 | 9.3 | 1322 | 26.1 | 48 | 14.4 | 5322 | 16.7 | 539 | 8.4 | 1740 | 26.0 | 77 | 10.5 |
© 2018 by the authors. Licensee MDPI, Basel, Switzerland. This article is an open access article distributed under the terms and conditions of the Creative Commons Attribution (CC BY) license (http://creativecommons.org/licenses/by/4.0/).
Share and Cite
Jackson, C.L.; Gaston, S.A.; Liu, R.; Mukamal, K.; Rimm, E.B. The Relationship between Alcohol Drinking Patterns and Sleep Duration among Black and White Men and Women in the United States. Int. J. Environ. Res. Public Health 2018, 15, 557. https://0-doi-org.brum.beds.ac.uk/10.3390/ijerph15030557
Jackson CL, Gaston SA, Liu R, Mukamal K, Rimm EB. The Relationship between Alcohol Drinking Patterns and Sleep Duration among Black and White Men and Women in the United States. International Journal of Environmental Research and Public Health. 2018; 15(3):557. https://0-doi-org.brum.beds.ac.uk/10.3390/ijerph15030557
Chicago/Turabian StyleJackson, Chandra L., Symielle A. Gaston, Rui Liu, Kenneth Mukamal, and Eric B. Rimm. 2018. "The Relationship between Alcohol Drinking Patterns and Sleep Duration among Black and White Men and Women in the United States" International Journal of Environmental Research and Public Health 15, no. 3: 557. https://0-doi-org.brum.beds.ac.uk/10.3390/ijerph15030557