Use of a Survey to Assess the Environmental Exposure and Family Perception to Lead in Children (<6 Years) in Four Valley Cities, Northwestern China

 ,
, 
Abstract
:1. Introduction
1.1. Lead Pollution
1.2. Overview of Children’s Environmental Lead Exposure
1.3. Toxicity of Lead
2. Materials and Methods
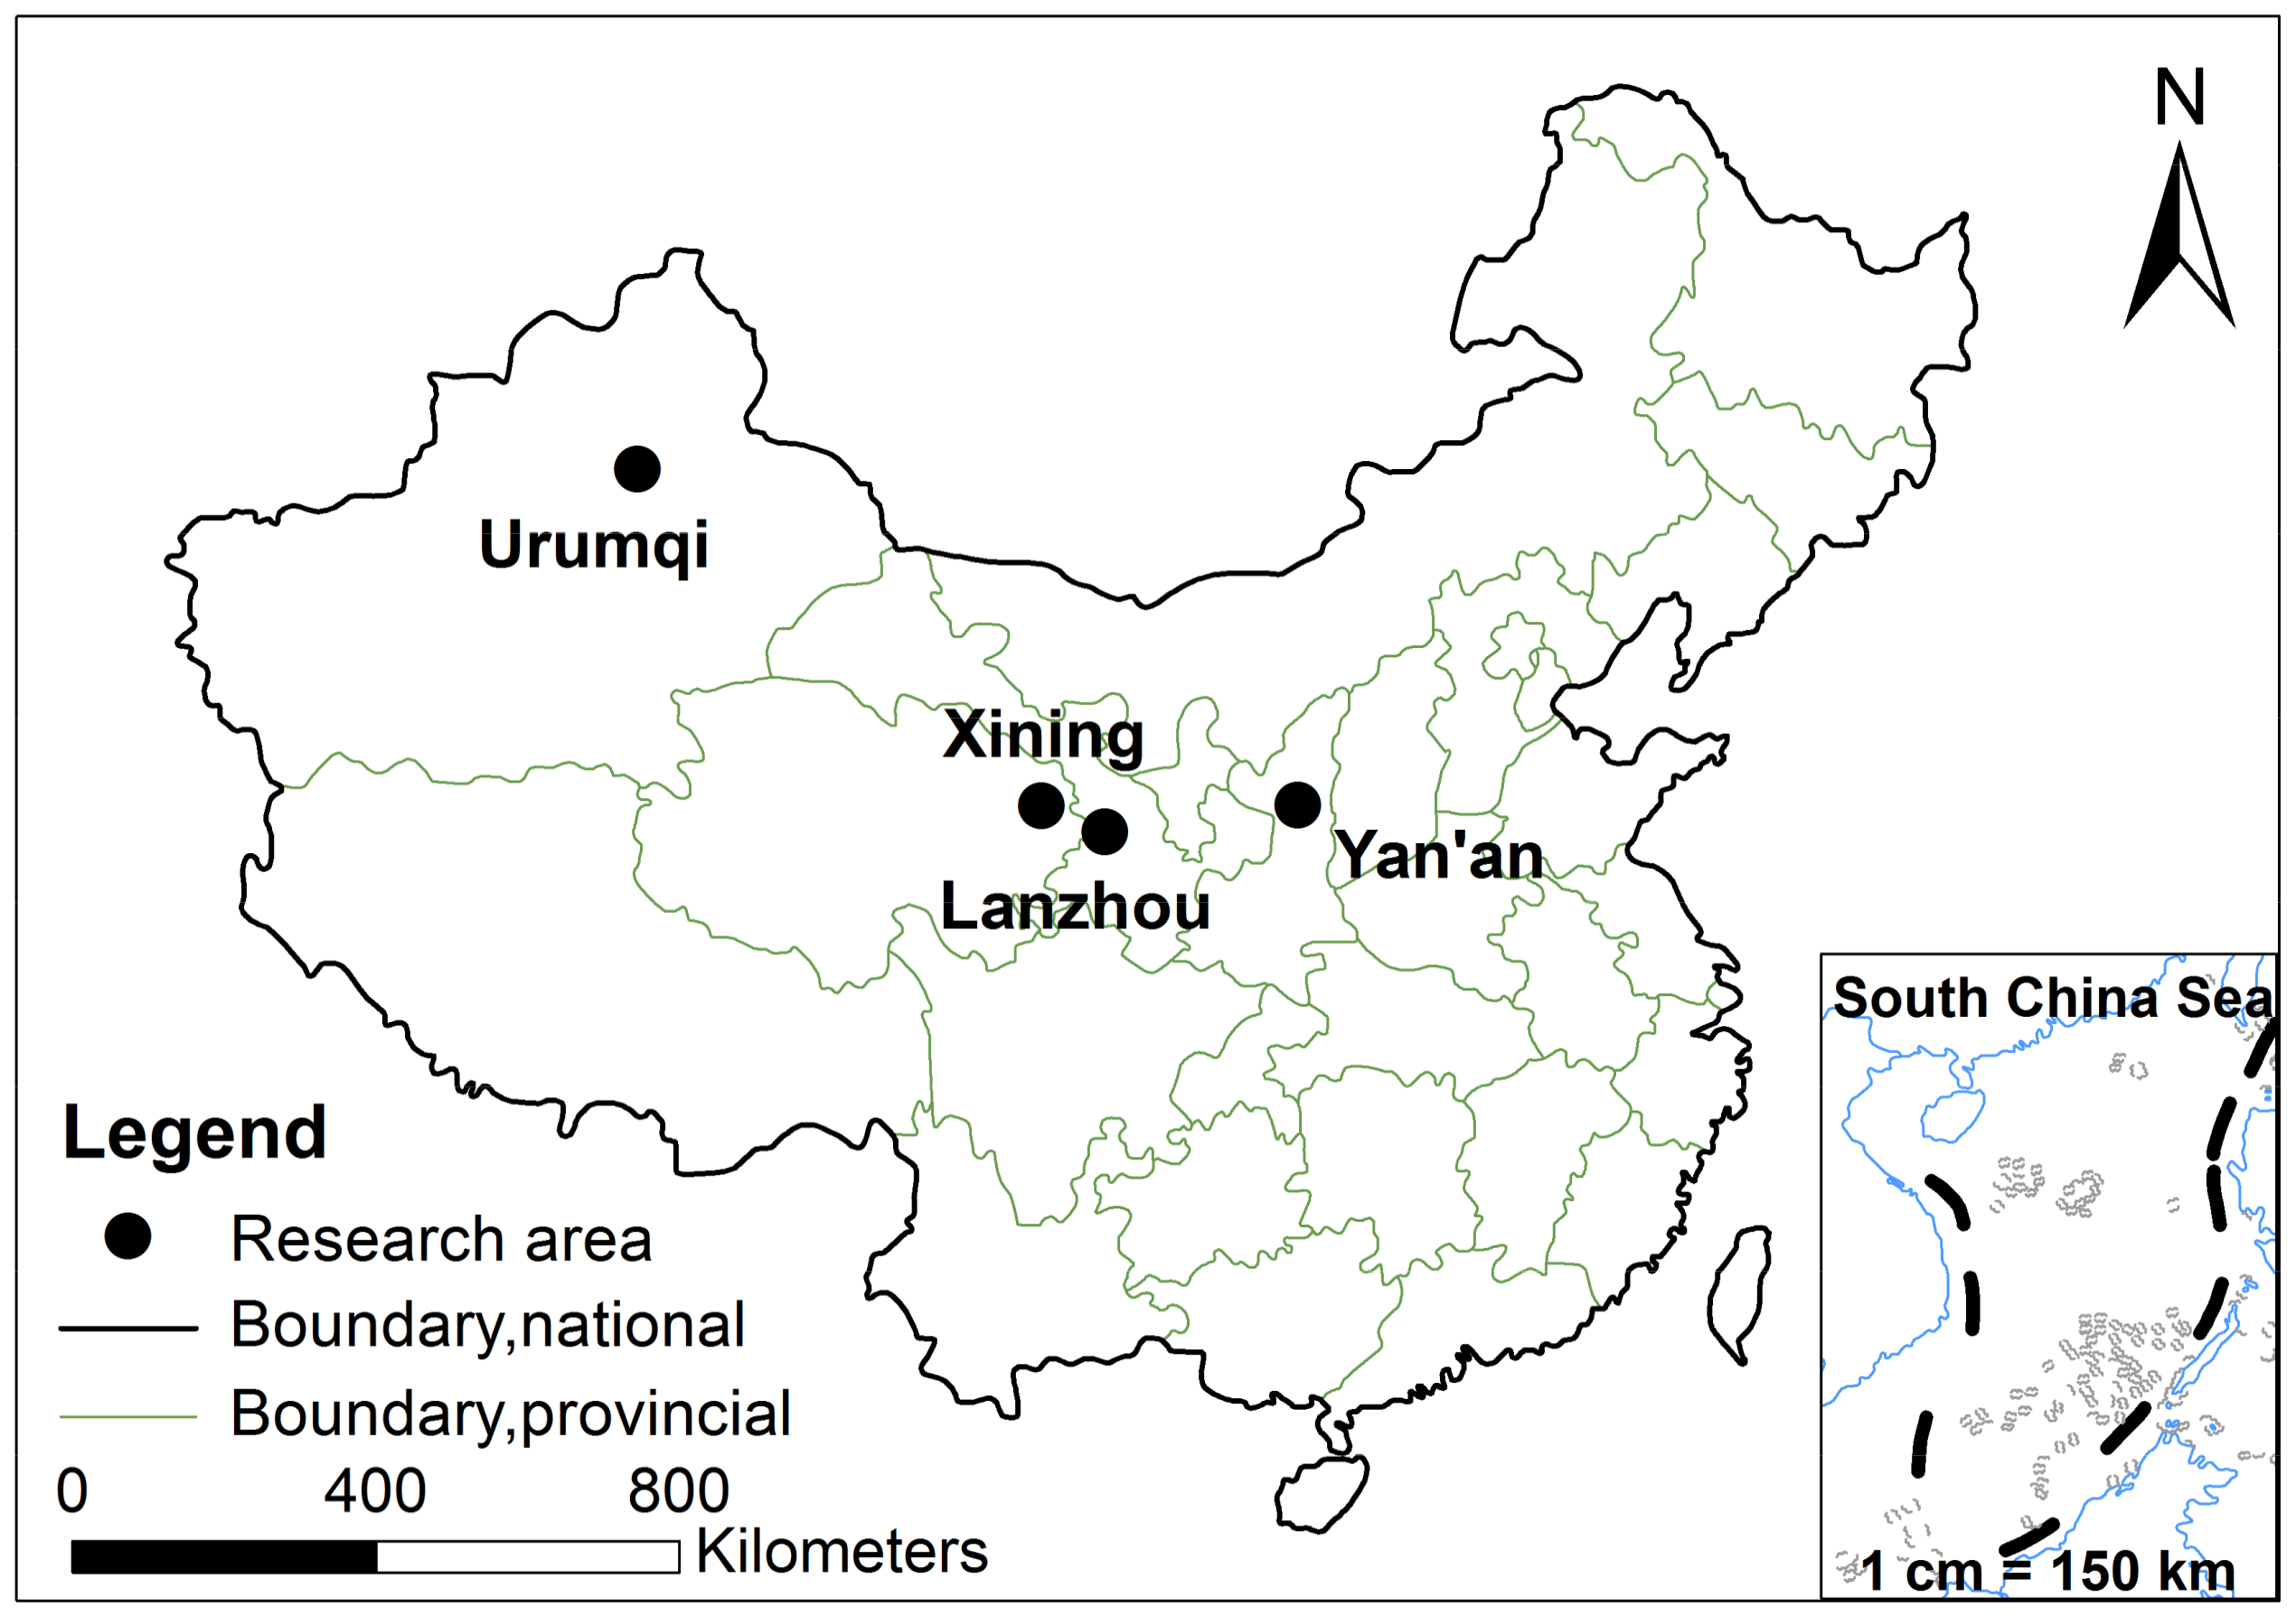
2.1. The Study Area Profiles
2.2. Investigation Method
2.3. Classification of Children’s Symptoms and Behaviors
3. Results and Discussion
3.1. Children and CBL
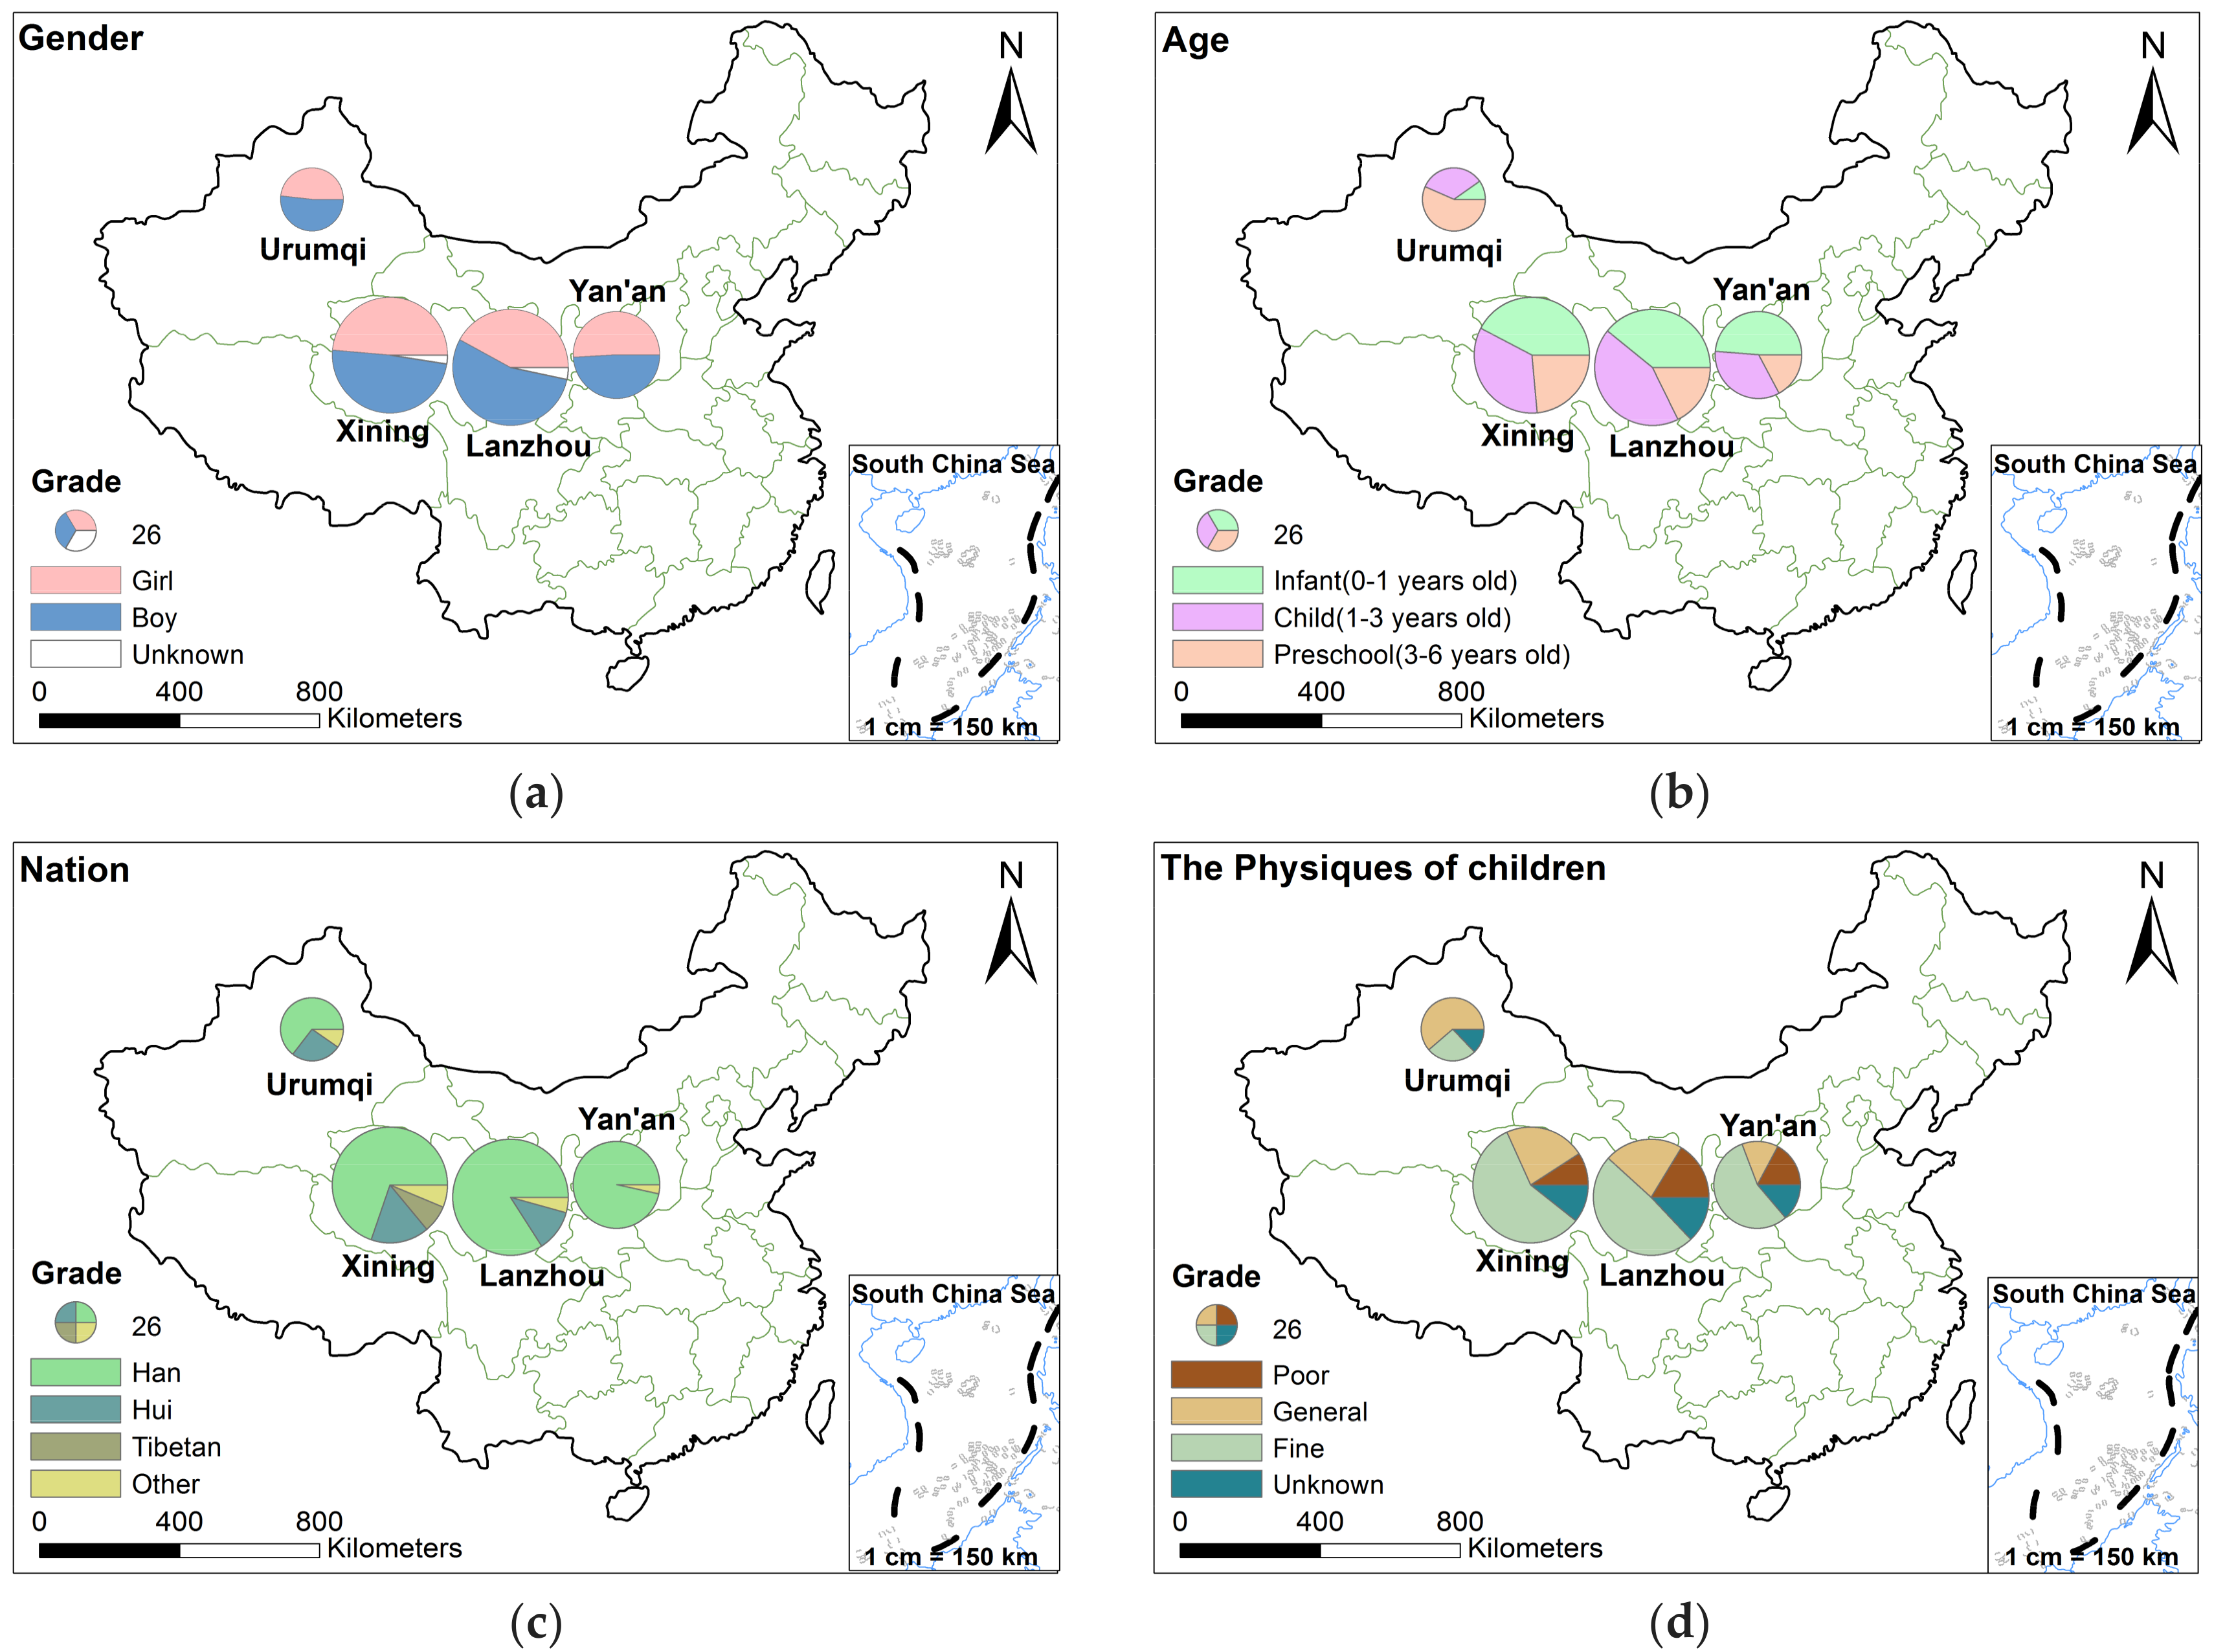
3.1.1. Basic Characteristics of the 596 Children
3.1.2. The Effect of Children’s Behavior on CBL
3.2. Parents and CBL
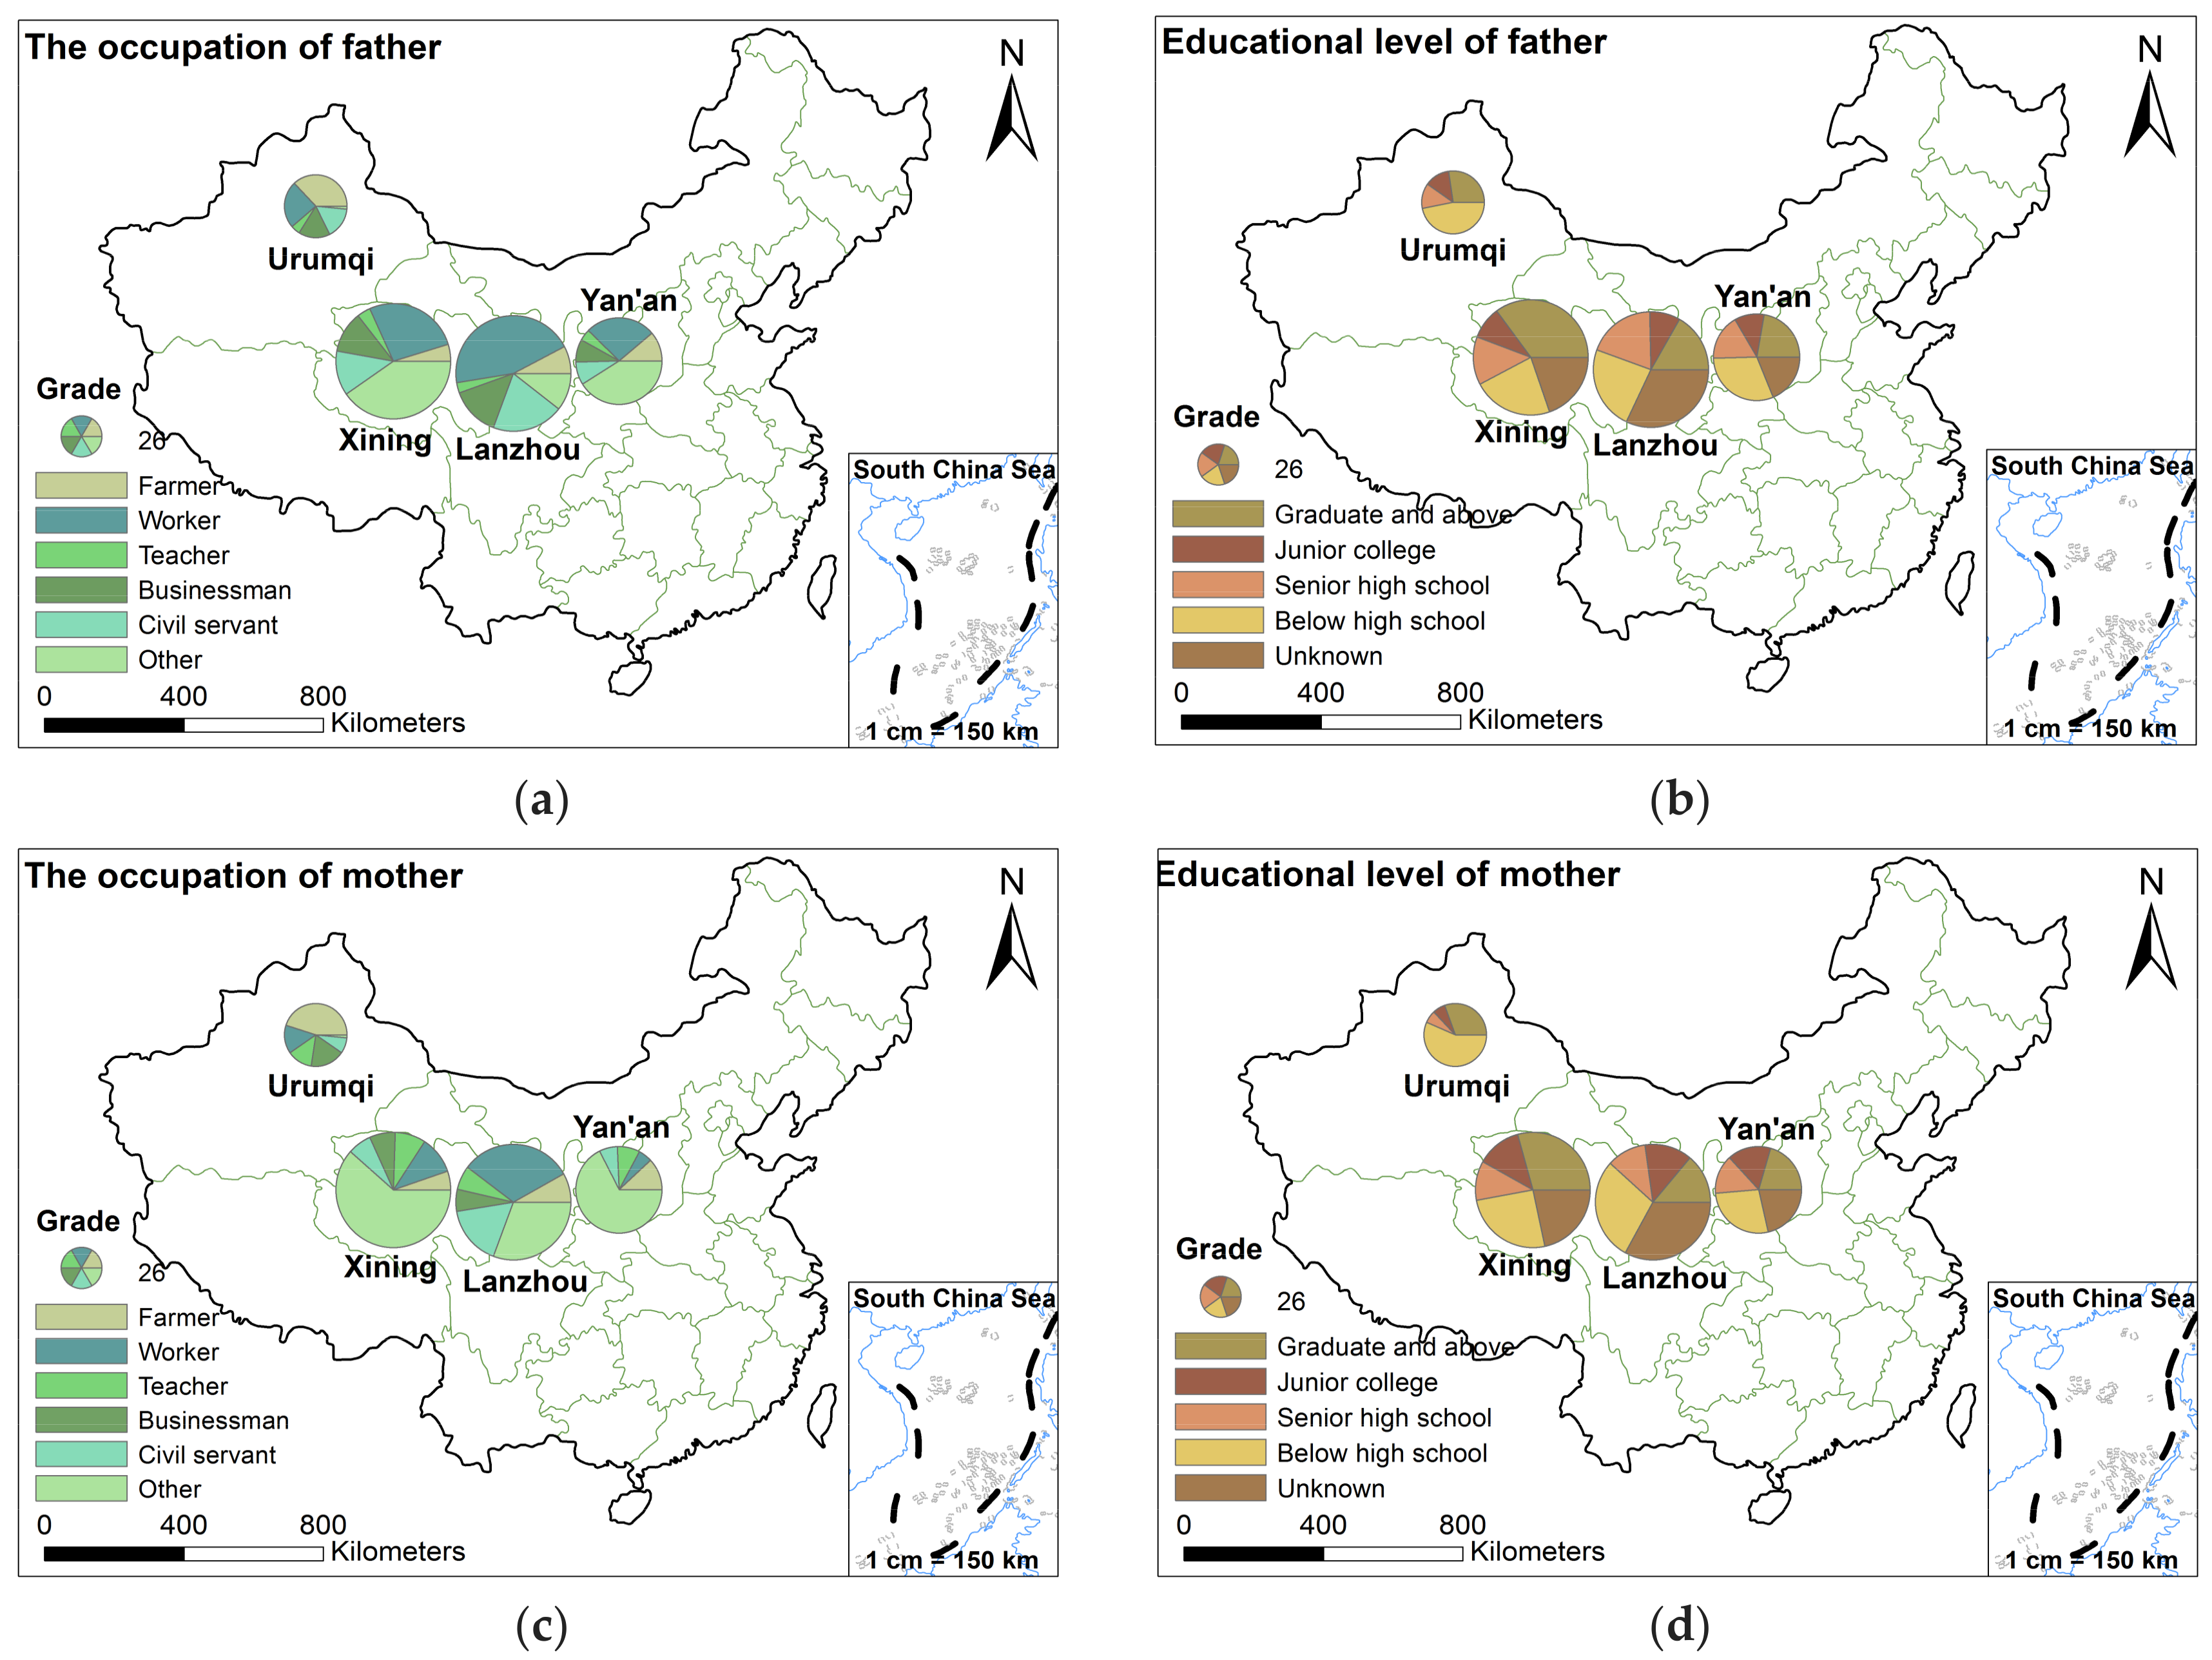
3.2.1. Basic Characteristic of Children’s Parents
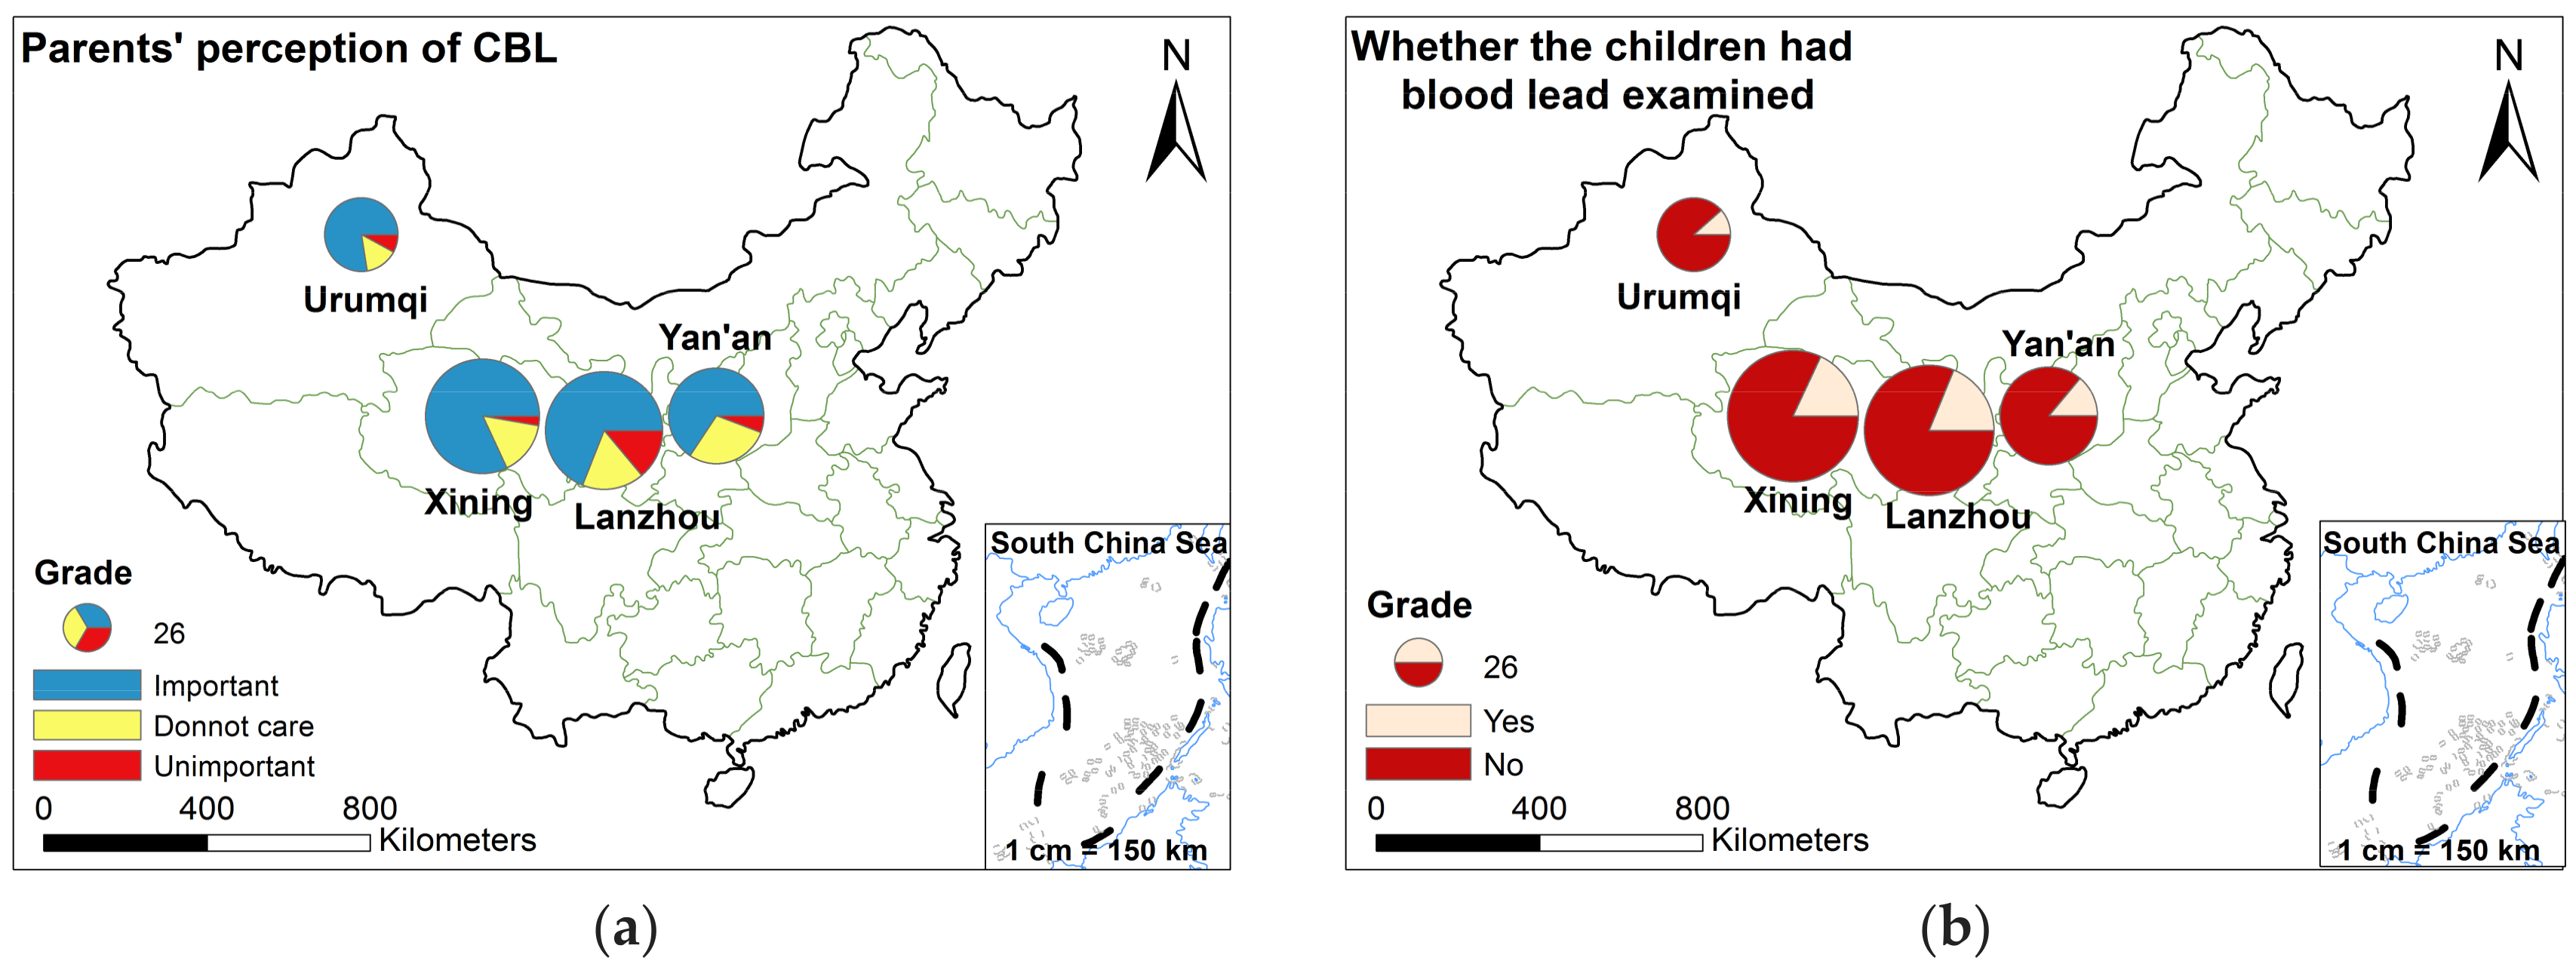
3.2.2. Parents’ Perception of CBL
3.2.3. The Effect of Mother’s Behaviors during Pregnancy on CBL
3.3. Environment and CBL
3.3.1. The Effect of General Residence Conditions on CBL
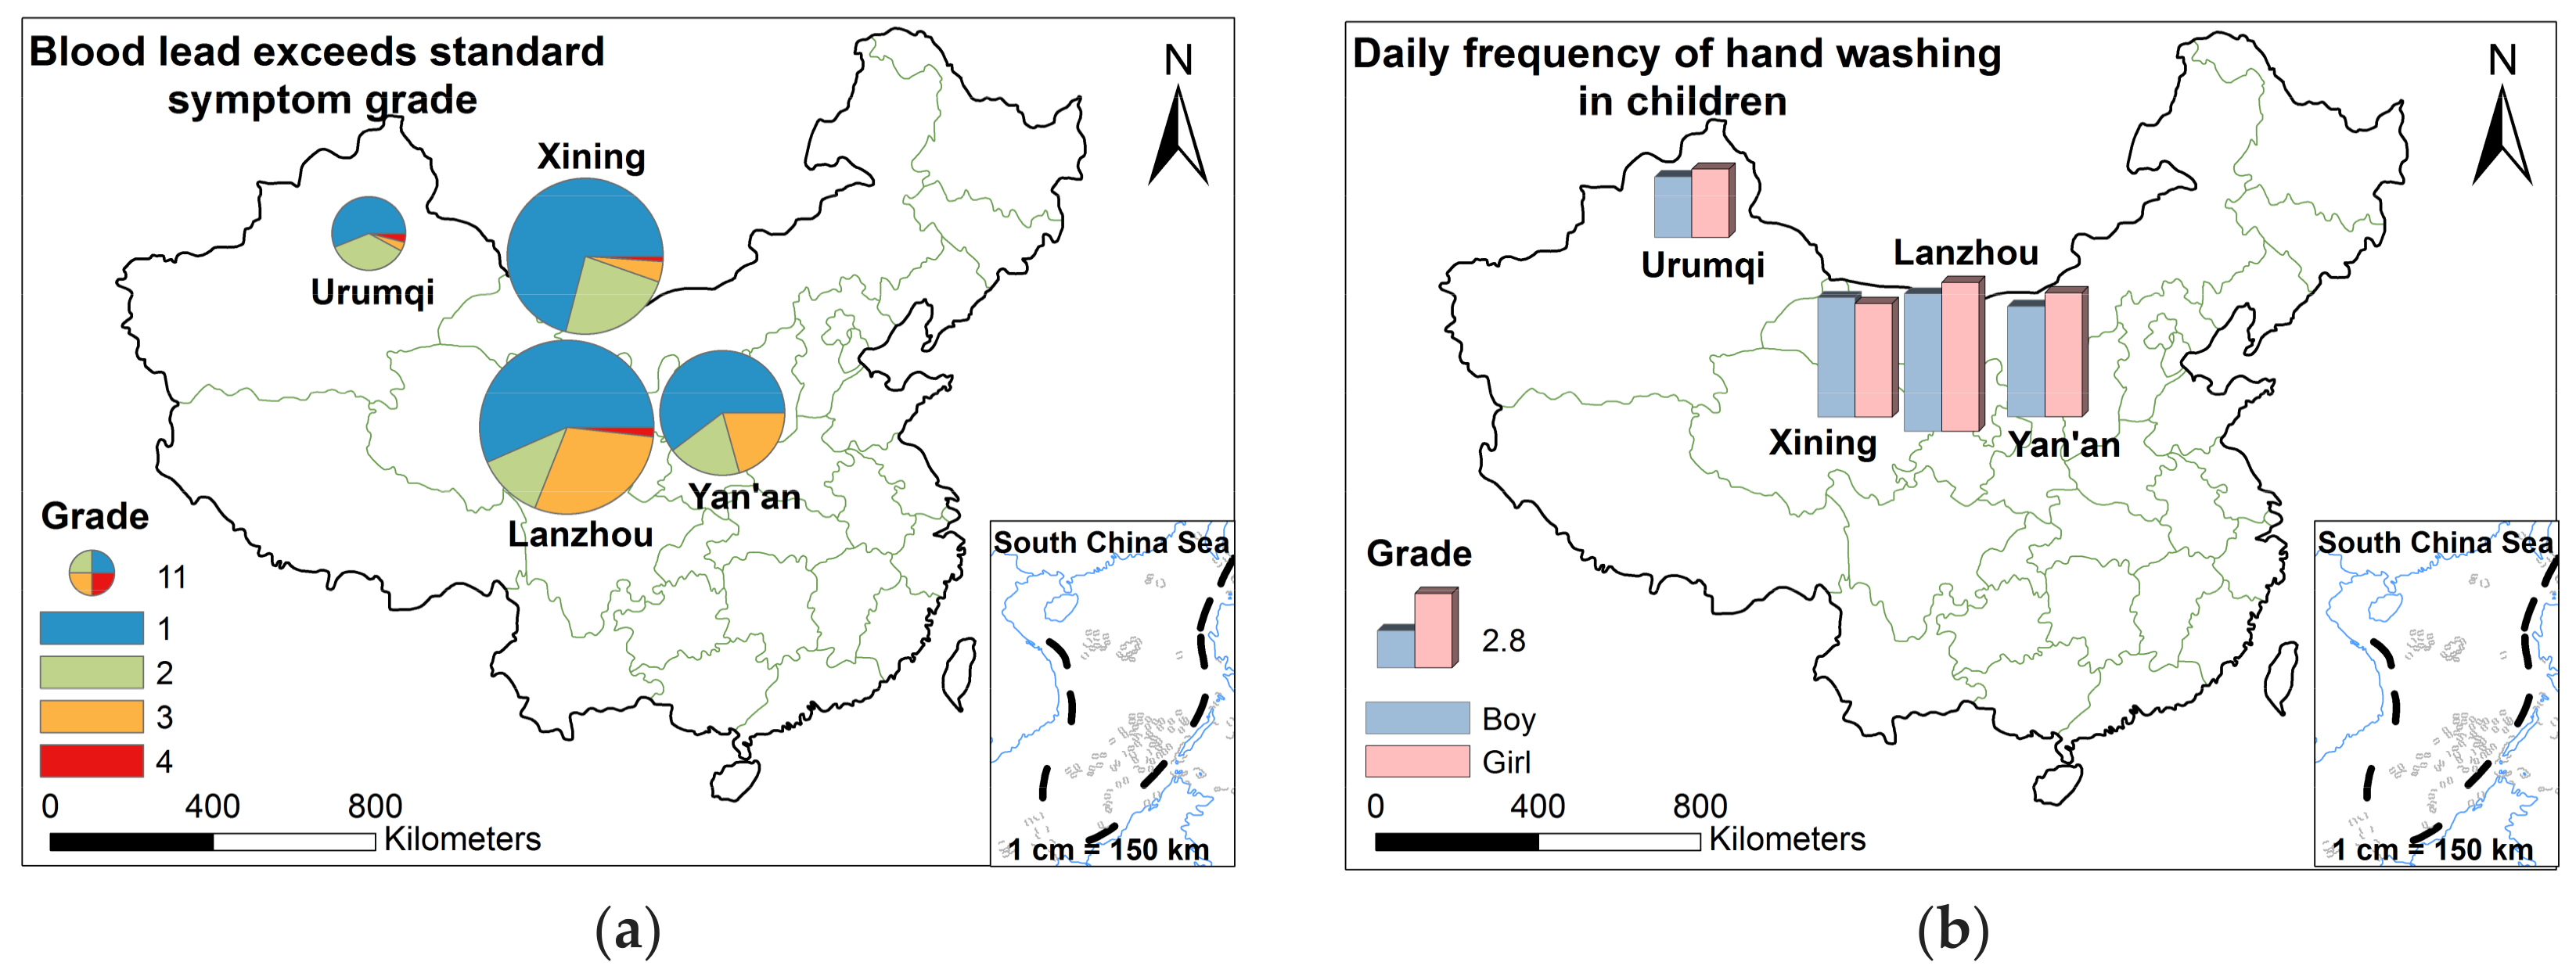
3.3.2. The Blood Lead Level of Children in Different Areas
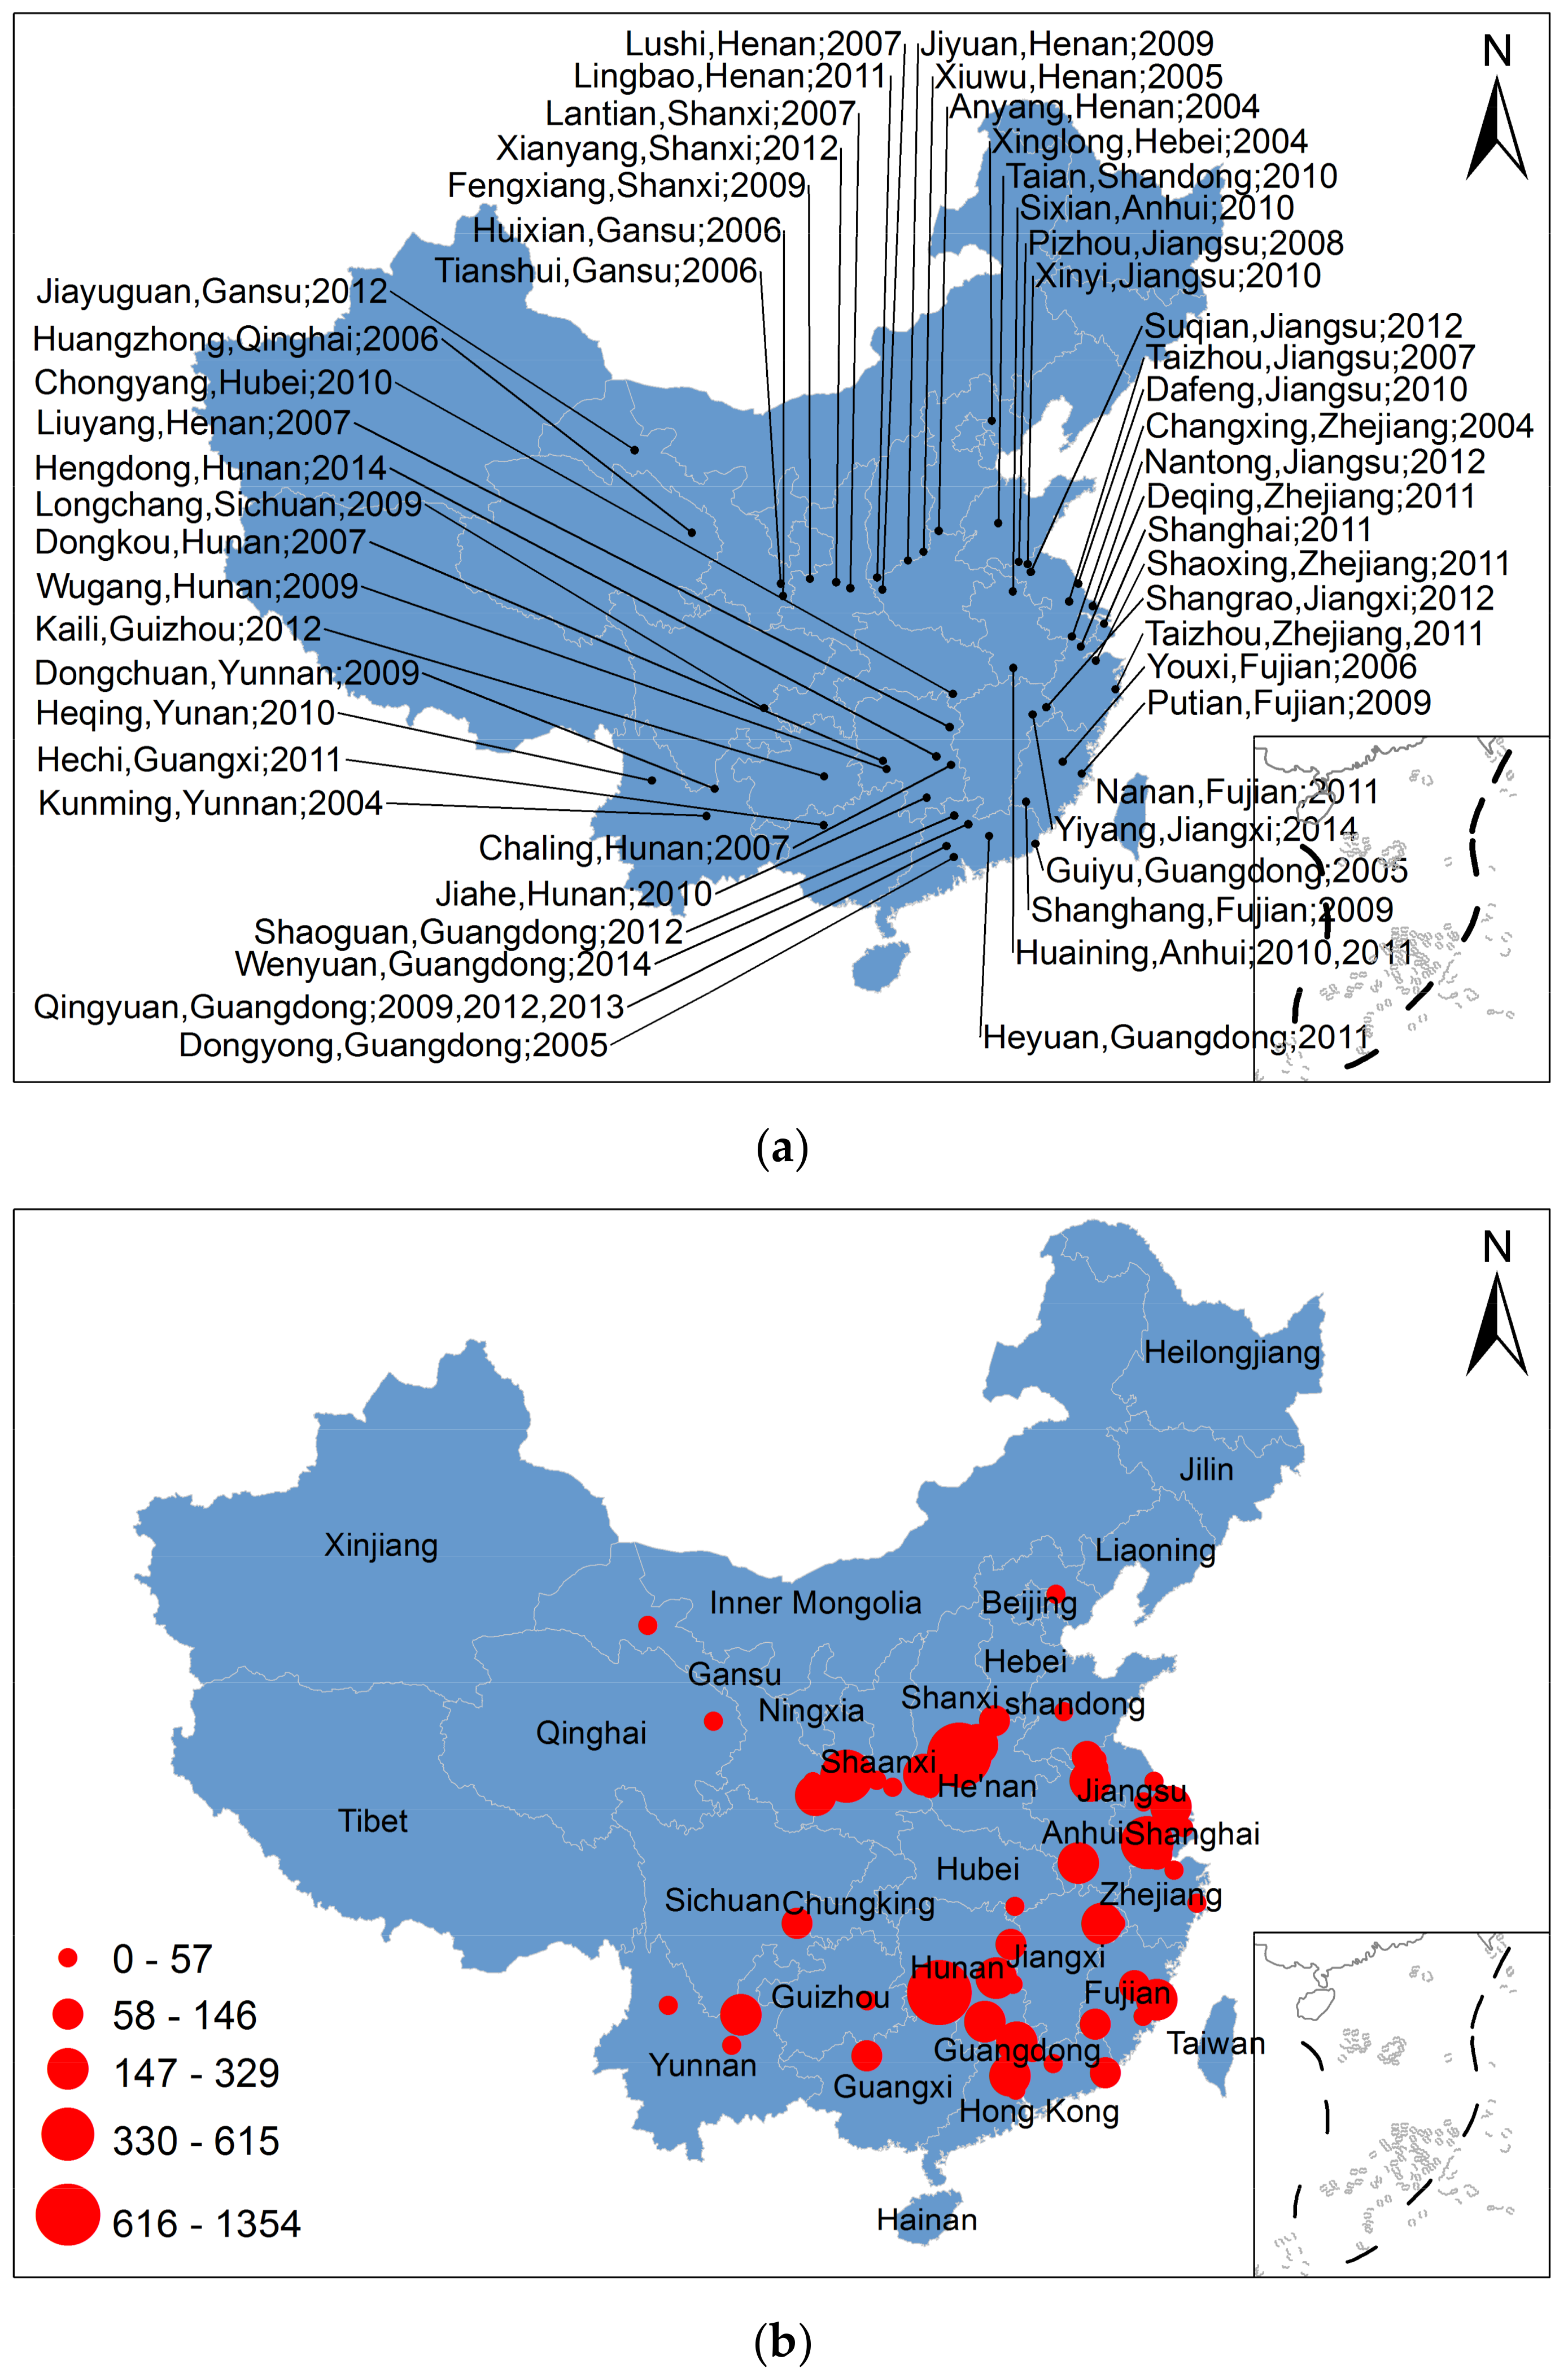
3.4. Prevention of Lead Poisoning in Children: China Is in Action
4. Conclusions
Limitations
Acknowledgments
Author Contributions
Conflicts of Interest
Appendix A
A.1. Family Environment
A.2. Parents’ Situation
A.3. Mother’s Situation during Pregnancy
A.4. The Situation of Children
A.5. Children’s Eating Habits
A.6. Children’s Daily Activity
A.7. Would You Like to Cooperate with Us to Collect Blood Lead Data for Your Children?
References
- Warren, C. Brush with Death: A Social History of Lead Poisoning; Johns Hopkins University Press: Baltimore, MD, USA, 2002. [Google Scholar]
- Cox, P.J. The Kirk-Othmer Encyclopedia of Chemical Technology: Volume 11, 4th ed.; Kroschwitz, J.I., Howe-Grant, M., Eds.; Flavor Characterization to Fuel Cells; Wiley: New York, NY, USA, 1994; Volume 11, ISBN 0-471-52680-0. [Google Scholar]
- Shea, E.E. Lead Regulation Handbook; Government Institutes: Washington, DC, USA, 1996.
- Daniell, W.E.; Van Tung, L.; Wallace, R.M.; Havens, D.J.; Karr, C.J.; Bich Diep, N.; Croteau, G.A.; Beaudet, N.J.; Duy Bao, N. Childhood lead exposure from battery recycling in vietnam. BioMed Res. Int. 2015, 2015, 193715. [Google Scholar] [CrossRef] [PubMed]
- Troesken, W. Lead water pipes and infant mortality at the turn of the twentieth century. J. Hum. Resour. 2008, 43, 553–575. [Google Scholar]
- Jacobs, D.E. Lead-Based Paint as a Major Source of Childhood Lead Poisoning: A Review of the Evidence; ASTM International: West Conshohocken, PA, USA, 1995. [Google Scholar]
- Schoenung, J.M. Lead Compounds; Springer: Boston, MA, USA, 2008; pp. 151–167. [Google Scholar]
- Bellinger, D.C. Very low lead exposures and children’s neurodevelopment. Curr. Opin. Pediatr. 2008, 20, 172–177. [Google Scholar] [CrossRef] [PubMed]
- Gulson, B.; Korsch, M.; Bradshaw, A. Impact of dust from ore processing facilities on rain water collection tanks in a tropical environment—The obvious source “ain’t necessarily so”. Int. J. Environ. Res. Public Health 2016, 13, 243. [Google Scholar] [CrossRef] [PubMed]
- Laidlaw, M.A.S.; Rowe, D.B.; Ball, A.S.; Mielke, H.W. A temporal association between accumulated petrol (gasoline) lead emissions and motor neuron disease in Australia. Int. J. Environ. Res. Public Health 2015, 12, 16124–16135. [Google Scholar] [CrossRef] [PubMed]
- Wan, D.; Zhan, C.; Yang, G.; Liu, X.; Yang, J. Preliminary assessment of health risks of potentially toxic elements in settled dust over Beijing urban area. Int. J. Environ. Res. Public Health 2016, 13, 491. [Google Scholar] [CrossRef] [PubMed]
- Yao, P.H.; Shyu, G.S.; Chang, Y.F.; Chou, Y.C.; Shen, C.C.; Chou, C.S.; Chang, T.K. Lead isotope characterization of petroleum fuels in Taipei, Taiwan. Int. J. Environ. Res. Public Health 2015, 12, 4602–4616. [Google Scholar] [CrossRef] [PubMed]
- Enkhbat, U.; Rule, A.M.; Resnick, C.; Ochir, C.; Olkhanud, P.; Williams, D.A.L. Exposure to PM2.5 and blood lead level in two populations in Ulaanbaatar, Mongolia. Int. J. Environ. Res. Public Health 2016, 13, 214. [Google Scholar] [CrossRef] [PubMed]
- Walraven, N.; Bakker, M.; van Os, B.; Klaver, G.; Middelburg, J.J.; Davies, G. Pollution and oral bioaccessibility of Pb in soils of villages and cities with a long habitation history. Int. J. Environ. Res. Public Health 2016, 13, 221. [Google Scholar] [CrossRef] [PubMed]
- Laidlaw, M.A.S.; Filippelli, G.M.; Sadler, R.C.; Gonzales, C.R.; Ball, A.S.; Mielke, H.W. Children’s blood lead seasonality in flint, Michigan (USA), and soil-sourced lead hazard risks. Int. J. Environ. Res. Public Health 2016, 13, 358. [Google Scholar] [CrossRef] [PubMed]
- Kirsten, S.; Pouyat, R.V.; Ian, Y. Legacies of lead in charm city’s soil: Lessons from the Baltimore ecosystem study. Int. J. Environ. Res. Public Health 2016, 13, 209. [Google Scholar]
- Ng, D.Q.; Lin, Y.P. Evaluation of lead release in a simulated lead-free premise plumbing system using a sequential sampling approach. Int. J. Environ. Res. Public Health 2016, 13, 266. [Google Scholar] [CrossRef] [PubMed]
- Wu, T.; Li, X.; Yang, T.; Sun, X.; Mielke, H.W.; Cai, Y.; Ai, Y.; Zhao, Y.; Liu, D.; Zhang, X. Multi-elements in source water (drinking and surface water) within five cities from the semi-arid and arid region, NW China: Occurrence, spatial distribution and risk assessment. Int. J. Environ. Res. Public Health 2017, 14, 1168. [Google Scholar] [CrossRef] [PubMed]
- Nadal, M.; Bocio, A.; Schuhmacher, M.; Domingo, J.L. Trends in the levels of metals in soils and vegetation samples collected near a hazardous waste incinerator. Arch. Environ. Contam. Toxicol. 2005, 49, 290. [Google Scholar] [CrossRef] [PubMed]
- Gloag, D. Sources of lead pollution. Br. Med. J. 1981, 282, 41. [Google Scholar] [CrossRef]
- Adriano, D.C. Biogeochemistry, Bioavailability and Risks of Metals; Springer: New York, NY, USA, 2001. [Google Scholar]
- Huo, X.; Peng, L.; Xu, X.; Zheng, L.; Qiu, B.; Qi, Z.; Zhang, B.; Han, D.; Piao, Z. Elevated blood lead levels of children in guiyu, an electronic waste recycling town in China. Environ. Health Perspect. 2007, 115, 1113. [Google Scholar] [CrossRef] [PubMed]
- Li, T.; Dai, Y.H.; Xie, X.H.; Tan, Z.W.; Zhang, S.M.; Zhu, Z.H. Surveillance of childhood blood lead levels in 11 cities of China. World J. Pediatr. 2014, 10, 29–37. [Google Scholar] [CrossRef] [PubMed]
- Cao, J.; Li, M.; Wang, Y.; Yu, G.; Yan, C. Environmental lead exposure among preschool children in Shanghai, China: Blood lead levels and risk factors. PLoS ONE 2014, 9, e113297. [Google Scholar] [CrossRef] [PubMed]
- Ji, A.; Wang, F.; Luo, W.; Yang, R.; Chen, J.; Cai, T. Lead poisoning in China: A nightmare from industrialisation. Lancet 2011, 377, 1474–1476. [Google Scholar] [CrossRef]
- Lv, Y.; Kong, T.; Rang, W. Analysis of the epidemic characteristics of excessive blood lead in China from 2004 to 2012. Chin. Prev. Med. 2013, 14, 868–870. [Google Scholar]
- Li, X.; Wang, X. Contamination assessment and distributions of heavy metals from Weinan typical industrial urban soil, P. R. China. J. Arid Land Resour. Environ. 2010, 24, 100–104. [Google Scholar]
- Díazsomoano, M.; Kylander, M.E.; Lópezantón, M.A.; Suárezruiz, I.; Martíneztarazona, M.R.; Ferrat, M.; Kober, B.; Weiss, D.J. Stable lead isotope compositions in selected coals from around the world and implications for present day aerosol source tracing. Environ. Sci. Technol. 2009, 43, 1078–1085. [Google Scholar] [CrossRef]
- Mielke, H.W. Research ethics in pediatric environmental health: Lessons from lead. Neurotoxicol. Teratol. 2002, 24, 467–469. [Google Scholar] [CrossRef]
- Schnur, J.; John, R.M. Childhood lead poisoning and the new centers for disease control and prevention guidelines for lead exposure. J. Am. Assoc. Nurse Pract. 2014, 26, 238–247. [Google Scholar] [CrossRef] [PubMed]
- Mielke, H.W.; Reagan, P.L. Soil is an important pathway of human lead exposure. Environ. Health Perspect. 1998, 106 (Suppl. 1). [Google Scholar] [CrossRef]
- He, K.; Wang, S.; Zhang, J. Blood lead levels of children and its trend in China. Sci. Total Environ. 2009, 407, 3986–3993. [Google Scholar] [CrossRef] [PubMed]
- Zhang, J.; He, K.; Wang, S.; Wu, Y. Analysis of blood lead levels and changing trend in children in China. J. Environ. Health 2009, 26, 393–398. [Google Scholar]
- Wang, B.; Zhang, J.; Liu, L.; Qin, J.; Zhang, Y.; Pan, L.; Fang, X.; Xue, S. The changes of children’s blood lead levels after the ban of leaded gasoline in China. J. Environ. Health 2013, 30, 377–384. [Google Scholar]
- Massadeh, A.; Al-Sharif, L.; Raed, D.H.; Hassan, M. Analysis of lead levels in local jordanian and imported sheep meat and organs using atomic absorption spectrometry. Environ. Monit. Assess. 2006, 115, 87–93. [Google Scholar] [CrossRef] [PubMed]
- Needleman, H. Lead poisoning. Annu. Rev. Med. 2004, 55, 209–222. [Google Scholar] [CrossRef] [PubMed]
- He, X. Basic study of child lead poisoning in China: Problems. Chin. J. Prev. Med. 1999, 33, 265. [Google Scholar]
- Hernberg, S. Lead poisoning in a historical perspective. Am. J. Ind. Med. 2000, 38, 244–254. [Google Scholar] [CrossRef]
- Godwin, H.A. The biological chemistry of lead. Curr. Opin. Chem. Biol. 2001, 5, 223–227. [Google Scholar] [CrossRef]
- Needleman, H.L.; Landrigan, P.J. What level of lead in blood is toxic for a child? Am. J. Public Health 2004, 94, 8. [Google Scholar] [CrossRef] [PubMed]
- Schnaas, L.; Rothenberg, S.J.; Perroni, E.; Martínez, S.; Hernández, C.; Hernández, R.M. Temporal pattern in the effect of postnatal blood lead level on intellectual development of young children. Neurotoxicol. Teratol. 2000, 22, 805–810. [Google Scholar] [CrossRef]
- Wasserman, G.A.; Liu, X.; Popovac, D.; Factorlitvak, P.; Kline, J.; Waternaux, C.; Loiacono, N.; Graziano, J.H. The Yugoslavia prospective lead study: Contributions of prenatal and postnatal lead exposure to early intelligence. Neurotoxicol. Teratol. 2000, 22, 811–818. [Google Scholar] [CrossRef]
- Canfield, R.L.; Henderson, C.R., Jr.; Cory-Slechta, D.A.; Cox, C.; Jusko, T.A.; Lanphear, B.P. Intellectual impairment in children with blood lead concentrations below 10 microg per deciliter. N. Engl. J. Med. 2003, 348, 1517–1526. [Google Scholar] [CrossRef] [PubMed]
- Qi, Q.; Yang, Y.; Yao, X.; Ding, L.; Wang, W.; Liu, Y.; Chen, Y.; Yang, Z.; Sun, Y.; Yuan, B. Blood lead level of children in the urban areas in China. Chin. J. Epidemiol. 2002, 23, 162–166. [Google Scholar]
- Yang, Y. Research on the valley-city of China. Areal Res. Develop. 1999, 18, 61–65. [Google Scholar]
- Yang, R.; Li, X.; Wang, J.; Wu, T.; Xu, Q.; Yang, T. Geochemical distribution and environment risk of heavy metals in urban soil of Xining city. Chin. J. Ecol. 2016, 35, 1531–1538. [Google Scholar]
- Yang, G.; Shao, C.; Ju, M. Heavy metal contamination assessment and partition for industrial and mining gathering areas. Int. J. Environ. Res. Public Health 2014, 11, 7286–7303. [Google Scholar]
- Gong, H.; Wu, Z.; Wu, B.; Luo, Z.; Jiang, H.; Chen, X. Analysis of coupling coordination between medical benefits and urbanization in China. Health Econ. Res. 2017, 11, 18–21. [Google Scholar]
- Roper, W.L.; Houk, V.N.; Falk, H.; Binder, S. Preventing Lead Poisoning in Young Children: A Statement by the Centers for Disease Control and Prevention; Department of Health and Human Services (US): Atlanta, GA, USA, 1991.
- Qu, M.; Xue, X.; Ma, Q.; Jin, C. Correlation analysis of lead poisoning and influencing factors in children of 0–6 years old, Xi’an. Chin. J. Birth Health Hered. 2008, 16, 118–119. [Google Scholar]
- Xu, Y.; Qiao, Y.; Cao, H.; Xue, A.; Ye, L.; Fan, Y.; Xu, W.; He, X. Epidemiological survey on lead content of blood for children aged 0–6 years in western Henan province and its affecting factors. Chin. J. Child Health Care 2004, 12, 133–134. [Google Scholar]
- Succop, P.; Bornschein, R. An empirical comparison of lead exposure pathway models. Environ. Health Perspect. 1998, 106 (Suppl. 6). [Google Scholar] [CrossRef]
- Wang, S.; Zhang, J. Blood lead levels of children in China. J. Environ. Health 2004, 21, 355–360. [Google Scholar] [CrossRef] [PubMed]
- Li, F.; Chai, J. Analysis of the results of blood lead detection in 9875 children, Hengshui. China Pract. Med. 2009, 4, 248–249. [Google Scholar]
- Zhang, S.; Zheng, W. Survey of blood lead level in 3~7-year-old children in Jining city and influential factors. China Trop. Med. 2007, 7, 280–281. [Google Scholar]
- Meng, C.; Zhang, H.; Sun, C. Study progress on influence factor of children’s blood lead and its evaluation in China. Chin. J. Ind. Med. 2014, 27, 251–255. [Google Scholar]
- Chen, Z.; Zhang, B.; Qin, L.; Xiong, C.; Du, Y. Study on the effect of daily behavioral habits on blood lead levels of children. Matern. Child Health Care China 2015, 30, 220–222. [Google Scholar]
- Li, H.; Hou, H.; Zhao, R.; Zhang, W.; Zhang, X.; Tang, X.; Liu, H. Investigation and analysis of blood lead level of preschool children in Wujiaqu city, Xinjiang. Int. J. Lab. Med. 2016, 37, 108–110. [Google Scholar]
- Fan, C.; Dai, Y.; Xie, X.; Zhang, S.; Tan, C. Study on the influencing factors of lead poisoning in 0~6 years old children in 15 cities, China. Chin. J. Child Health Care 2006, 14, 361–363. [Google Scholar]
- Wang, W.; Hao, P.; Sun, Q.; Yao, Y. Analysis of the related factors of blood lead in 0~3 year old children. Matern. Child Health Care China 2016, 31, 4782–4784. [Google Scholar]
- Feng, S.; Feng, J. Study on lead poisoning of children in China from the perspective of bibliometrics. J. Public Health Prev. Med. 2014, 25, 76–79. [Google Scholar]
- Ferguson, A.; Penney, R.; Solo-Gabriele, H. A review of the field on children’s exposure to environmental contaminants: A risk assessment approach. Int. J. Environ. Res. Public Health 2017, 14, 265. [Google Scholar] [CrossRef] [PubMed]
- Lu, Y.; Shi, X.; Liu, S.; Jiang, J.; Kuang, M.; Rang, W. Analysis of blood lead level and its epidemiological characteristics in children aged 0–6 years in China. Pract. Prevent. Med. 2015, 22, 149–154. [Google Scholar]
- Horton, L.M.; Mortensen, M.E.; Yulia, I.; Wald, M.M.; Paula, B. What do we know of childhood exposures to metals (arsenic, cadmium, lead, and mercury) in emerging market countries? Int. J. Pediatr. 2013, 2013, 872596. [Google Scholar] [CrossRef] [PubMed]
- Fernald, L.C.; Weber, A.; Galasso, E.; Ratsifandrihamanana, L. Socioeconomic gradients and child development in a very low income population: Evidence from madagascar. Dev. Sci. 2011, 14, 832–847. [Google Scholar] [CrossRef] [PubMed]
- Sly, P.D.; Flack, F. Susceptibility of children to environmental pollutants. Ann. N. Y. Acad. Sci. 2008, 1140, 163–183. [Google Scholar] [CrossRef] [PubMed]
- Li, Y.; Qin, J.; Wei, X.; Li, C.; Wang, J.; Jiang, M.; Liang, X.; Xia, T.; Zhang, Z. The risk factors of child lead poisoning in China: A meta-analysis. Int. J. Environ. Res. Public Health 2016, 13, 296. [Google Scholar] [CrossRef] [PubMed]
- Barzyk, T.M.; Vette, G.A.F.; Williams, R.W.; Croghan, C.W.; Stevens, C.D. Development of a distance-to-roadway proximity metric to compare near-road pollutant levels to a central site monitor. Atmos. Environ. 2009, 43, 787–797. [Google Scholar] [CrossRef]
- Karner, A.A.; Eisinger, D.S.; Niemeier, D.A. Near-roadway air quality: Synthesizing the findings from real-world data. Environ. Sci. Technol. 2010, 44, 5334–5344. [Google Scholar] [CrossRef] [PubMed]
- Gao, Z.; Cao, J.; Yan, J.; Wang, J.; Cai, S.; Yan, C. Blood lead levels and risk factors among preschool children in a lead polluted area in Taizhou, China. BioMed Res. Int. 2017, 2017, 1–8. [Google Scholar] [CrossRef] [PubMed]
- Chen, X.; Teng, H.; Wang, F.; He, J.; Zhou, S.; Jian, Y.; Xiao, X.; Liu, G. Blood lead level and related risk factors among children aged 0–6 years in beijing. Chin. J. Epidemiol. 2003, 24, 868–871. [Google Scholar]
- Piomelli, S. Childhood lead poisoning. Pediatr. Clin. 2002, 49, 1285–1304. [Google Scholar] [CrossRef]
- Li, M.M.; Cao, J.; Xu, J.; Cai, S.Z.; Shen, X.M.; Yan, C.H. The national trend of blood lead levels among chinese children aged 0–18 years old, 1990–2012. Environ. Int. 2014, 71, 109–117. [Google Scholar] [CrossRef] [PubMed]
- Lo, Y.C.; Dooyema, C.A.; Neri, A.; Durant, J.; Jefferies, T.; Medina-Marino, A.; De, R.L.; Thoroughman, D.; Davis, L.; Dankoli, R.S. Childhood lead poisoning associated with gold ore processing: A village-level investigation—Zamfara State, Nigeria, October–November 2010. Environ. Health Perspect. 2012, 120, 1450–1455. [Google Scholar] [CrossRef] [PubMed]


| General residence conditions |
| * Related question, please see the details in Questionnaire Sheet of Question 1 (Q1), Appendix A. |
| Parents situation |
| * Related question, please see the details in Questionnaire Sheet of Q2, Appendix A. |
| The situation of the mother during pregnancy |
| * Related question, please see the details in Questionnaire Sheet of Q3, Appendix A. |
| The basic situation of the child |
| * Related question, please see the details in Questionnaire Sheet of Q4, Q5 and Q6 Appendix A. |
| Whether the child has symptoms of blood lead level exceeding |
| * Related question, please see the details in Questionnaire Sheet of Q4, Appendix A. |
| Blood lead measurement |
| * Related question, please see the details in Questionnaire Sheet of Q2, Appendix A. |
| Level (i.e., Grade) | Children Blood Lead Level | Standards on Children Lead Poisoning (CDC) [49] | Behavior of Children in Questionnaire |
|---|---|---|---|
| Level 1 | <100 μg/L | Relative safety | Biting finger frequently; |
| Poor sleep | |||
| Level 2 | 100–199 μg/L | Mild lead poisoning | Picky eaters, anorexia, hyperactivity, inattention; |
| Capricious, impulsive, irritable, grumpy; | |||
| Dizziness, nausea, muscle weakness, fatigue | |||
| Level 3 | 200–449 μg/L | Moderate lead poisoning | Immunocompromised, often got cold or fever; |
| Stunting such as height, language, hearing and bullying their peers | |||
| Level 4 | 450–699 μg/L | Severe lead poisoning | Severe learning disabilities, and decreased reading ability |
| Gender | Proportion | Age | Proportion | Nation | Proportion | The Physiques of Children | Proportion |
|---|---|---|---|---|---|---|---|
| Boy | 51.4 | Infant (0–1 year old) | 39.1 | Han | 79.2 | Poor | 12.2 |
| Girl | 46.4 | Child (1–3 years old) | 37.2 | Hui | 12.4 | General | 24.7 |
| Unknown | 2.2 | Preschool (3–6 years old) | 23.7 | Zang | 3 | Fine | 50.9 |
| Other | 5.4 | Unknown | 12.2 |
| Blood Lead Exceeds Standard Symptom Levels | Age | Gender | The Physiques of Children | |||||
|---|---|---|---|---|---|---|---|---|
| Infant | Child | Preschool | Girl | Boy | Poor | General | Fine | |
| 1 | 94 (40.3) | 61 (27.5) | 30 (21.3) | 87 (31.3) | 97 (31.8) | 13 (17.8) | 39 (26.5) | 113 (37.3) |
| 2 | 5 (2.1) | 25 (11.3) | 27 (19.1) | 24 (8.6) | 31 (10.2) | 10 (13.7) | 15 (10.2) | 17 (5.6) |
| 3 | 10 (4.3) | 27 (12.1) | 14 (9.9) | 26 (9.4) | 24 (7.9) | 26 (35.6) | 7 (4.8) | 7 (2.3) |
| 4 | N.D. | N.D. | 4 (2.9) | 1 (0.4) | 3 (1.0) | 1 (1.4) | 2 (1.4) | 1 (0.3) |
| asymptomatic | 124 (53.3) | 109 (49.1) | 66 (46.8) | 140 (50.3) | 150 (49.1) | 23 (31.5) | 84 (57.1) | 165 (54.5) |
| Lanzhou | Urumqi | Xining | Yan’an | Sum | ||
|---|---|---|---|---|---|---|
| (n = 209) | (n = 62) | (n = 208) | (n = 117) | (n = 596) | ||
| Childrens‘behavior | Like crawling on the ground | 16 (7.7) | 9 (14.5) | 29 (13.9) | 17 (14.5) | 71 (11.9) |
| Like licking fingers | 53 (25.4) | 7 (11.3) | 40 (19.2) | 27 (23.1) | 127 (21.3) | |
| often eat high lead food | 35 (16.7) | 40 (64.5) | 44 (21.2) | 29 (24.8) | 148 (24.8) | |
| Often eat fruit and vegetables | 111 (53.1) | 31 (50.0) | 94 (45.2) | 52 (44.4) | 288 (48.3) | |
| Add nutritional supplements | 144 (68.9) | 28 (45.2) | 112 (53.8) | 52 (44.4) | 336 (56.4) | |
| Wash your hands regularly | 146 (69.9) | 41 (66.1) | 96 (46.2) | 81 (69.2) | 364 (61.1) | |
| Weekly outdoor activity time >4 h | 131 (62.7) | 39 (62.9) | 145 (69.7) | 95 (81.2) | 410 (68.8) | |
| Regular contact leaded items | 158 (75.6) | 56 (90.3) | 149 (71.6) | 87 (74.4) | 450 (75.5) | |
| 1 (185) | 2 (57) | 3 (51) | 4 (4) | ||
|---|---|---|---|---|---|
| Childrens‘ behavior | Like crawling on the ground | 29 (15.7) | 4 (7.0) | 10 (19.6) | N.D. |
| Like licking fingers | 68 (36.8) | 5 (8.8) | 10 (19.6) | 1 (25.0) | |
| Often eat high lead food | 31 (16.8) | 28 (49.1) | 18 (35.3) | 2 (50.0) | |
| Weekly outdoor activity time >4 h | 132 (71.4) | 46 (80.7) | 44 (86.3) | 2 (50.0) | |
| Regular contact leaded items | 154 (83.2) | 52 (91.2) | 41 (80.4) | 2 (50.0) | |
| The Basic Situation of the Father | The Basic Situation of the Mother | ||||||
|---|---|---|---|---|---|---|---|
| Occupation | Proportion | Educational Level | Proportion | Occupation | Proportion | Educational Level | Proportion |
| farmer | 10.4 | graduate and above | 25.4 | farmer | 11.7 | graduate and above | 22.3 |
| worker | 32.9 | junior college | 9.7 | worker | 17.3 | junior college | 12.9 |
| teacher | 3.7 | senior high school | 16.1 | teacher | 8.4 | senior high school | 11.3 |
| businessman | 12.2 | below high school | 27.0 | businessman | 6.5 | below high school | 30.2 |
| civil servant | 14.8 | unknown | 21.8 | civil servant | 10.4 | unknown | 23.3 |
| other | 26 | other | 45.7 | ||||
| Blood Lead Exceeds Standard Symptom Level (i.e., Grade) | Graduate and above | Junior College | Senior High School | Below High School |
|---|---|---|---|---|
| 1 | 56 (41.5) | 12 (8.9) | 26 (19.2) | 41 (30.4) |
| 2 | 20 (40.8) | 5 (10.2) | 8 (16.3) | 16 (32.7) |
| 3 | 6 (15.4) | 4 (10.2) | 12 (30.8) | 17 (43.6) |
| 4 | N.D. | N.D. | 1 (50.0) | 1 (50.0) |
| asymptomatic | 89 (36.3) | 39 (15.9) | 49 (20.0) | 68 (27.8) |
| Lanzhou (n = 158) | Urumqi (n = 62) | Xining (n = 150) | Yan’an (n = 105) | Sum (n = 475) | |
|---|---|---|---|---|---|
| Parents’perception of blood lead in children (n (%)) | |||||
| Important | 109 (69.0) | 48 (77.4) | 123 (82.0) | 69 (65.7) | 349 (73.5) |
| Unimportant | 22 (13.9) | 5 (8.1) | 4 (2.7) | 6 (5.7) | 37 (7.8) |
| Don’t care | 27 (17.1) | 9 (14.5) | 23 (15.3) | 30 (28.6) | 89 (18.7) |
| Lanzhou (n = 191) | Urumqi (n = 61) | Xining (n = 194) | Yan’an (n = 108) | Sum (n = 554) | |
| Whether the children had blood lead examined (n (%)) | |||||
| Yes | 36 (18.8) | 7 (11.5) | 35 (18.0) | 15 (13.9) | 93 (16.8) |
| No | 155 (81.2) | 54 (88.5) | 159 (82.0) | 93 (86.1) | 461 (83.2) |
| Educational Level of Parents | Important | Unimportant | Don’t Care |
|---|---|---|---|
| Graduate and above | 108 (80.0) | 9 (6.7) | 18 (13.3) |
| Junior college | 35 (71.4) | 2 (4.1) | 12 (24.5) |
| Senior high school | 53 (69.7) | 3 (3.9) | 20 (26.4) |
| Below high school | 85 (70.8) | 14 (11.7) | 21 (17.5) |
| Sum | 281 (73.9) | 28 (7.4) | 71 (18.7) |
| Lanzhou | Urumqi | Xining | Yan’an | Sum | ||
|---|---|---|---|---|---|---|
| (n = 209) | (n = 62) | (n = 208) | (n = 117) | (n = 596) | ||
| Mother’s behavior during pregnancy | Taking calcium supplements | 69 (33.0) | 35 (56.5) | 121 (58.2) | 80 (68.4) | 305 (51.2) |
| Taking Iron supplements | 131 (62.7) | 34 (54.8) | 84 (40.4) | 34 (40.4) | 283 (47.5) | |
| Eating preserved eggs | 18 (8.6) | 18 (29.0) | 11 (5.3) | 9 (7.7) | 56 (9.4) | |
| Walking on the road for more than 30 min each day | 128 (61.2) | 36 (58.1) | 116 (55.8) | 75 (64.1) | 355 (59.6) | |
| Using touchscreen electronic products | 158 (75.6) | 42 (67.7) | 153 (73.6) | 95 (81.2) | 448 (75.2) | |
| Reading newspaper | 41 (19.6) | 27 (43.5) | 49 (23.6) | 12 (10.3) | 129 (21.6) | |
| Blood Lead Exceeds Standard Symptom Level (i.e., Grade) | 1 (185) | 2 (57) | 3 (51) | 4 (4) | |
|---|---|---|---|---|---|
| Mother’s behavior during pregnancy | Taking calcium supplements | 97 (52.4) | 41 (71.9) | 25 (49.0) | 2 (50.0) |
| Taking Iron supplements | 97 (52.4) | 28 (49.1) | 25 (49.0) | 2 (50.0) | |
| Walking on the road for more than 30 min each day | 107 (57.8) | 29 (50.9) | 39 (76.5) | 3 (75.0) | |
| Using touch screen electronic products | 142 (76.8) | 45 (78.9) | 38 (74.5) | 1 (25.0) | |
| Reading newspaper | 51 (27.6) | 6 (10.5) | 7 (13.7) | N.D. | |
| Lanzhou | Urumqi | Xining | Yan’an | Sum | ||
|---|---|---|---|---|---|---|
| (n = 209) | (n = 62) | (n = 208) | (n = 117) | (n = 596) | ||
| General residence conditions | Bungalows or the first floor | 75 (35.9) | 16 (25.8) | 45 (21.6) | 43 (36.8) | 179 (30.0) |
| Located near factories, garages, construction sites | 127 (60.8) | 45 (72.6) | 122 (58.7) | 61 (52.1) | 355 (59.6) | |
| Distance from downtown or commercial street <500 m | 168 (80.4) | 11 (17.7) | 128 (61.5) | 76 (65.0) | 383 (64.3) | |
| Use paint, floors and painted furniture | 58 (27.8) | 39 (62.9) | 56 (26.9) | 39 (33.3) | 192 (32.2) |
| Blood Lead Exceeds Standard Symptom Level (i.e., Grade) | 1 (185) | 2 (57) | 3 (51) | 4 (4) | |
|---|---|---|---|---|---|
| General residence conditions | Bungalows or the first floor | 53 (28.5) | 17 (25.4) | 27 (52.9) | 2 (50.0) |
| There located factories, garages, construction sites | 114 (61.3) | 32 (47.8) | 37 (72.5) | 2 (50.0) | |
| Distance from downtown or commercial street <500 m | 117 (62.9) | 36 (53.7) | 38 (74.5) | 3 (75.0) | |
| Use paint, floor and paint furniture | 55 (29.6) | 14 (20.9) | 23 (45.1) | 2 (50.0) | |
| Lanzhou | Urumqi | Xining | Yan’an | Sum | |
|---|---|---|---|---|---|
| (n = 209) | (n = 62) | (n = 208) | (n = 117) | (n = 596) | |
| Daily frequency of hand washing in children (n) | |||||
| Boy | 5.114 | 2.25 | 4.461 | 4.123 | 4.41 |
| Girl | 5.545 | 2.533 | 4.238 | 4.627 | 4.55 |
| Blood lead exceeds CDC symptom levels (i.e., grade) (n (%)) | |||||
| 1 | 64 (30.6) | 14 (22.6) | 66 (31.7) | 38 (32.5) | 182 (30.5) |
| 2 | 14 (6.7) | 9 (14.5) | 22 (10.6) | 12 (10.3) | 57 (9.5) |
| 3 | 33 (15.8) | 1 (1.6) | 4 (1.9) | 13 (11.0) | 51 (8.6) |
| 4 | 2 (1.0) | 1 (1.6) | 1 (0.5) | N.D. | 4 (0.7) |
| Sum | 113 (54.1) | 25 (40.3) | 93 (44.7) | 63 (53.8) | 294 (49.3) |
| asymptomatic | 96 (45.9) | 37 (59.7) | 115 (55.3) | 54 (46.2) | 302 (50.7) |
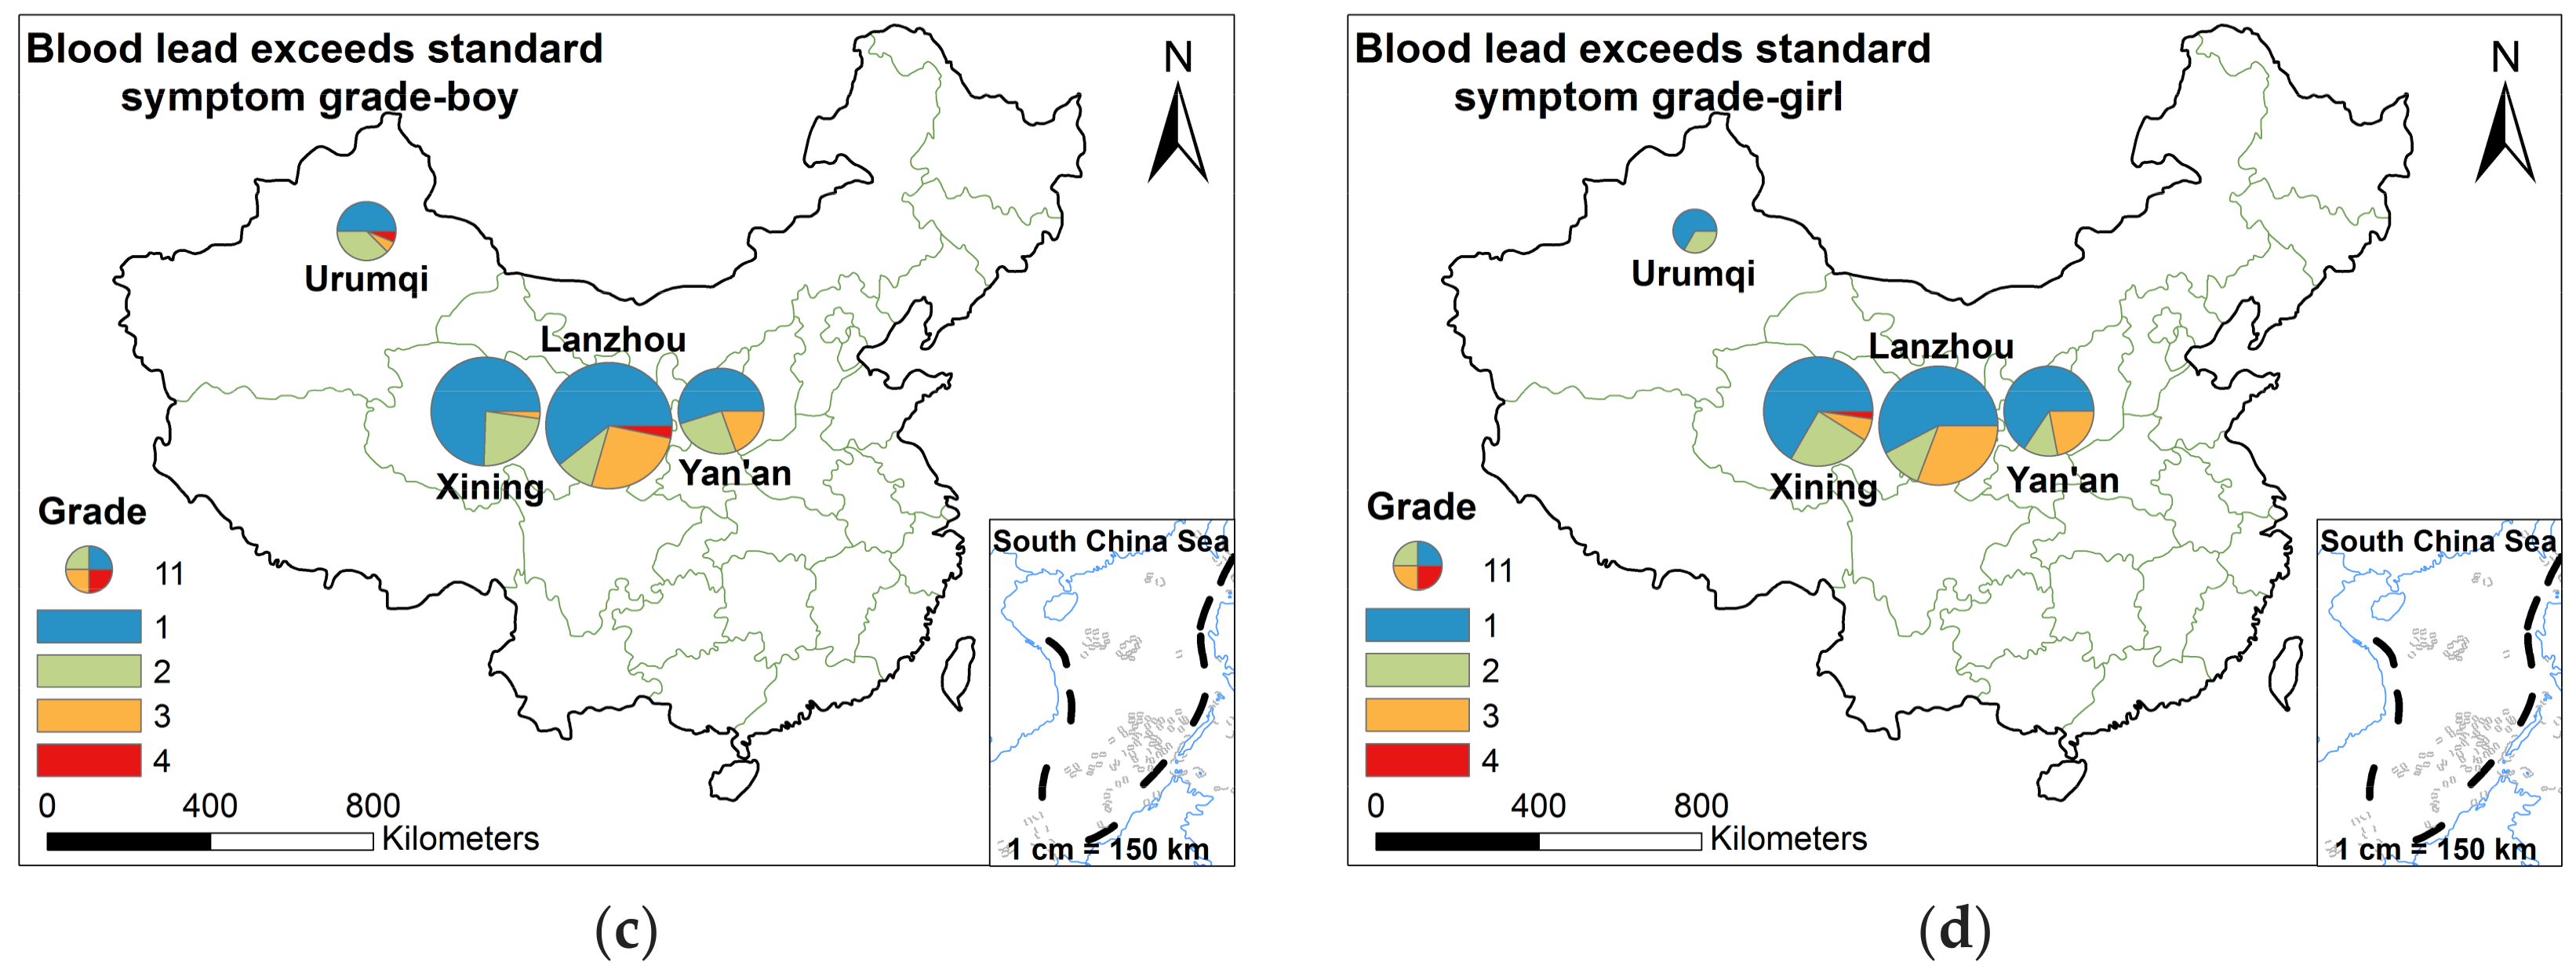
| Lanzhou | Urumqi | Xining | Yan’an | Sum | |
| (n = 88) | (n = 30) | (n = 101) | (n = 59) | (n = 278) | |
| Blood lead exceeds CDC symptom levels (i.e., grade)-girl (n (%)) | |||||
| 1 | 30 (34.1) | 6 (20.0) | 30 (29.7) | 21 (35.6) | 87 (31.3) |
| 2 | 6 (6.8) | 3 (10.0) | 11 (10.9) | 4 (6.8) | 24 (8.6) |
| 3 | 16 (18.2) | N.D. | 3 (3.0) | 7 (11.8) | 26 (9.3) |
| 4 | N.D. | N.D. | 1 (1.0) | N.D. | 1 (0.4) |
| Sum | 52 (59.1) | 9 (30.0) | 45 (44.6) | 32 (54.2) | 138 (49.6) |
| asymptomatic | 36 (40.9) | 21 (70.0) | 56 (55.4) | 21 (45.8) | 140 (50.4) |
| Lanzhou | Urumqi | Xining | Yan’an | Sum | |
| (n = 114) | (n = 32) | (n = 102) | (n = 57) | (n = 305) | |
| Blood lead exceeds standard symptom levels (i.e., grade)-boy (n (%)) | |||||
| 1 | 37 (32.5) | 8 (25.0) | 35 (34.3) | 17 (29.8) | 97 (31.7) |
| 2 | 6 (5.3) | 6 (18.8) | 11 (10.8) | 8 (14.1) | 31 (10.1) |
| 3 | 16 (14.0) | 1 (3.1) | 1 (1.0) | 6 (10.5) | 24 (7.8) |
| 4 | 2 (1.7) | 1 (3.1) | N.D. | N.D. | 3 (1.0) |
| Sum | 61 (53.5) | 16 (50.0) | 47 (46.1) | 31 (54.4) | 155 (50.6) |
| asymptomatic | 53 (46.5) | 16 (50.0) | 55 (53.9) | 26 (45.6) | 150 (49.4) |
© 2018 by the authors. Licensee MDPI, Basel, Switzerland. This article is an open access article distributed under the terms and conditions of the Creative Commons Attribution (CC BY) license (http://creativecommons.org/licenses/by/4.0/).
Share and Cite
Sun, X.; Li, X.; Liu, D.; Yang, T.; Zhao, Y.; Wu, T.; Cai, Y.; Ai, Y.; Zhang, X.; Wang, J.; et al. Use of a Survey to Assess the Environmental Exposure and Family Perception to Lead in Children (<6 Years) in Four Valley Cities, Northwestern China. Int. J. Environ. Res. Public Health 2018, 15, 740. https://0-doi-org.brum.beds.ac.uk/10.3390/ijerph15040740
Sun X, Li X, Liu D, Yang T, Zhao Y, Wu T, Cai Y, Ai Y, Zhang X, Wang J, et al. Use of a Survey to Assess the Environmental Exposure and Family Perception to Lead in Children (<6 Years) in Four Valley Cities, Northwestern China. International Journal of Environmental Research and Public Health. 2018; 15(4):740. https://0-doi-org.brum.beds.ac.uk/10.3390/ijerph15040740
Chicago/Turabian StyleSun, Xuemeng, Xiaoping Li, Dongying Liu, Tao Yang, Yanan Zhao, Ting Wu, Yue Cai, Yuwei Ai, Xu Zhang, Jiwen Wang, and et al. 2018. "Use of a Survey to Assess the Environmental Exposure and Family Perception to Lead in Children (<6 Years) in Four Valley Cities, Northwestern China" International Journal of Environmental Research and Public Health 15, no. 4: 740. https://0-doi-org.brum.beds.ac.uk/10.3390/ijerph15040740