Do Socio-Economic Characteristics Affect Travel Behavior? A Comparative Study of Low-Carbon and Non-Low-Carbon Shopping Travel in Shenyang City, China


Abstract
:1. Introduction
2. Materials and Methods
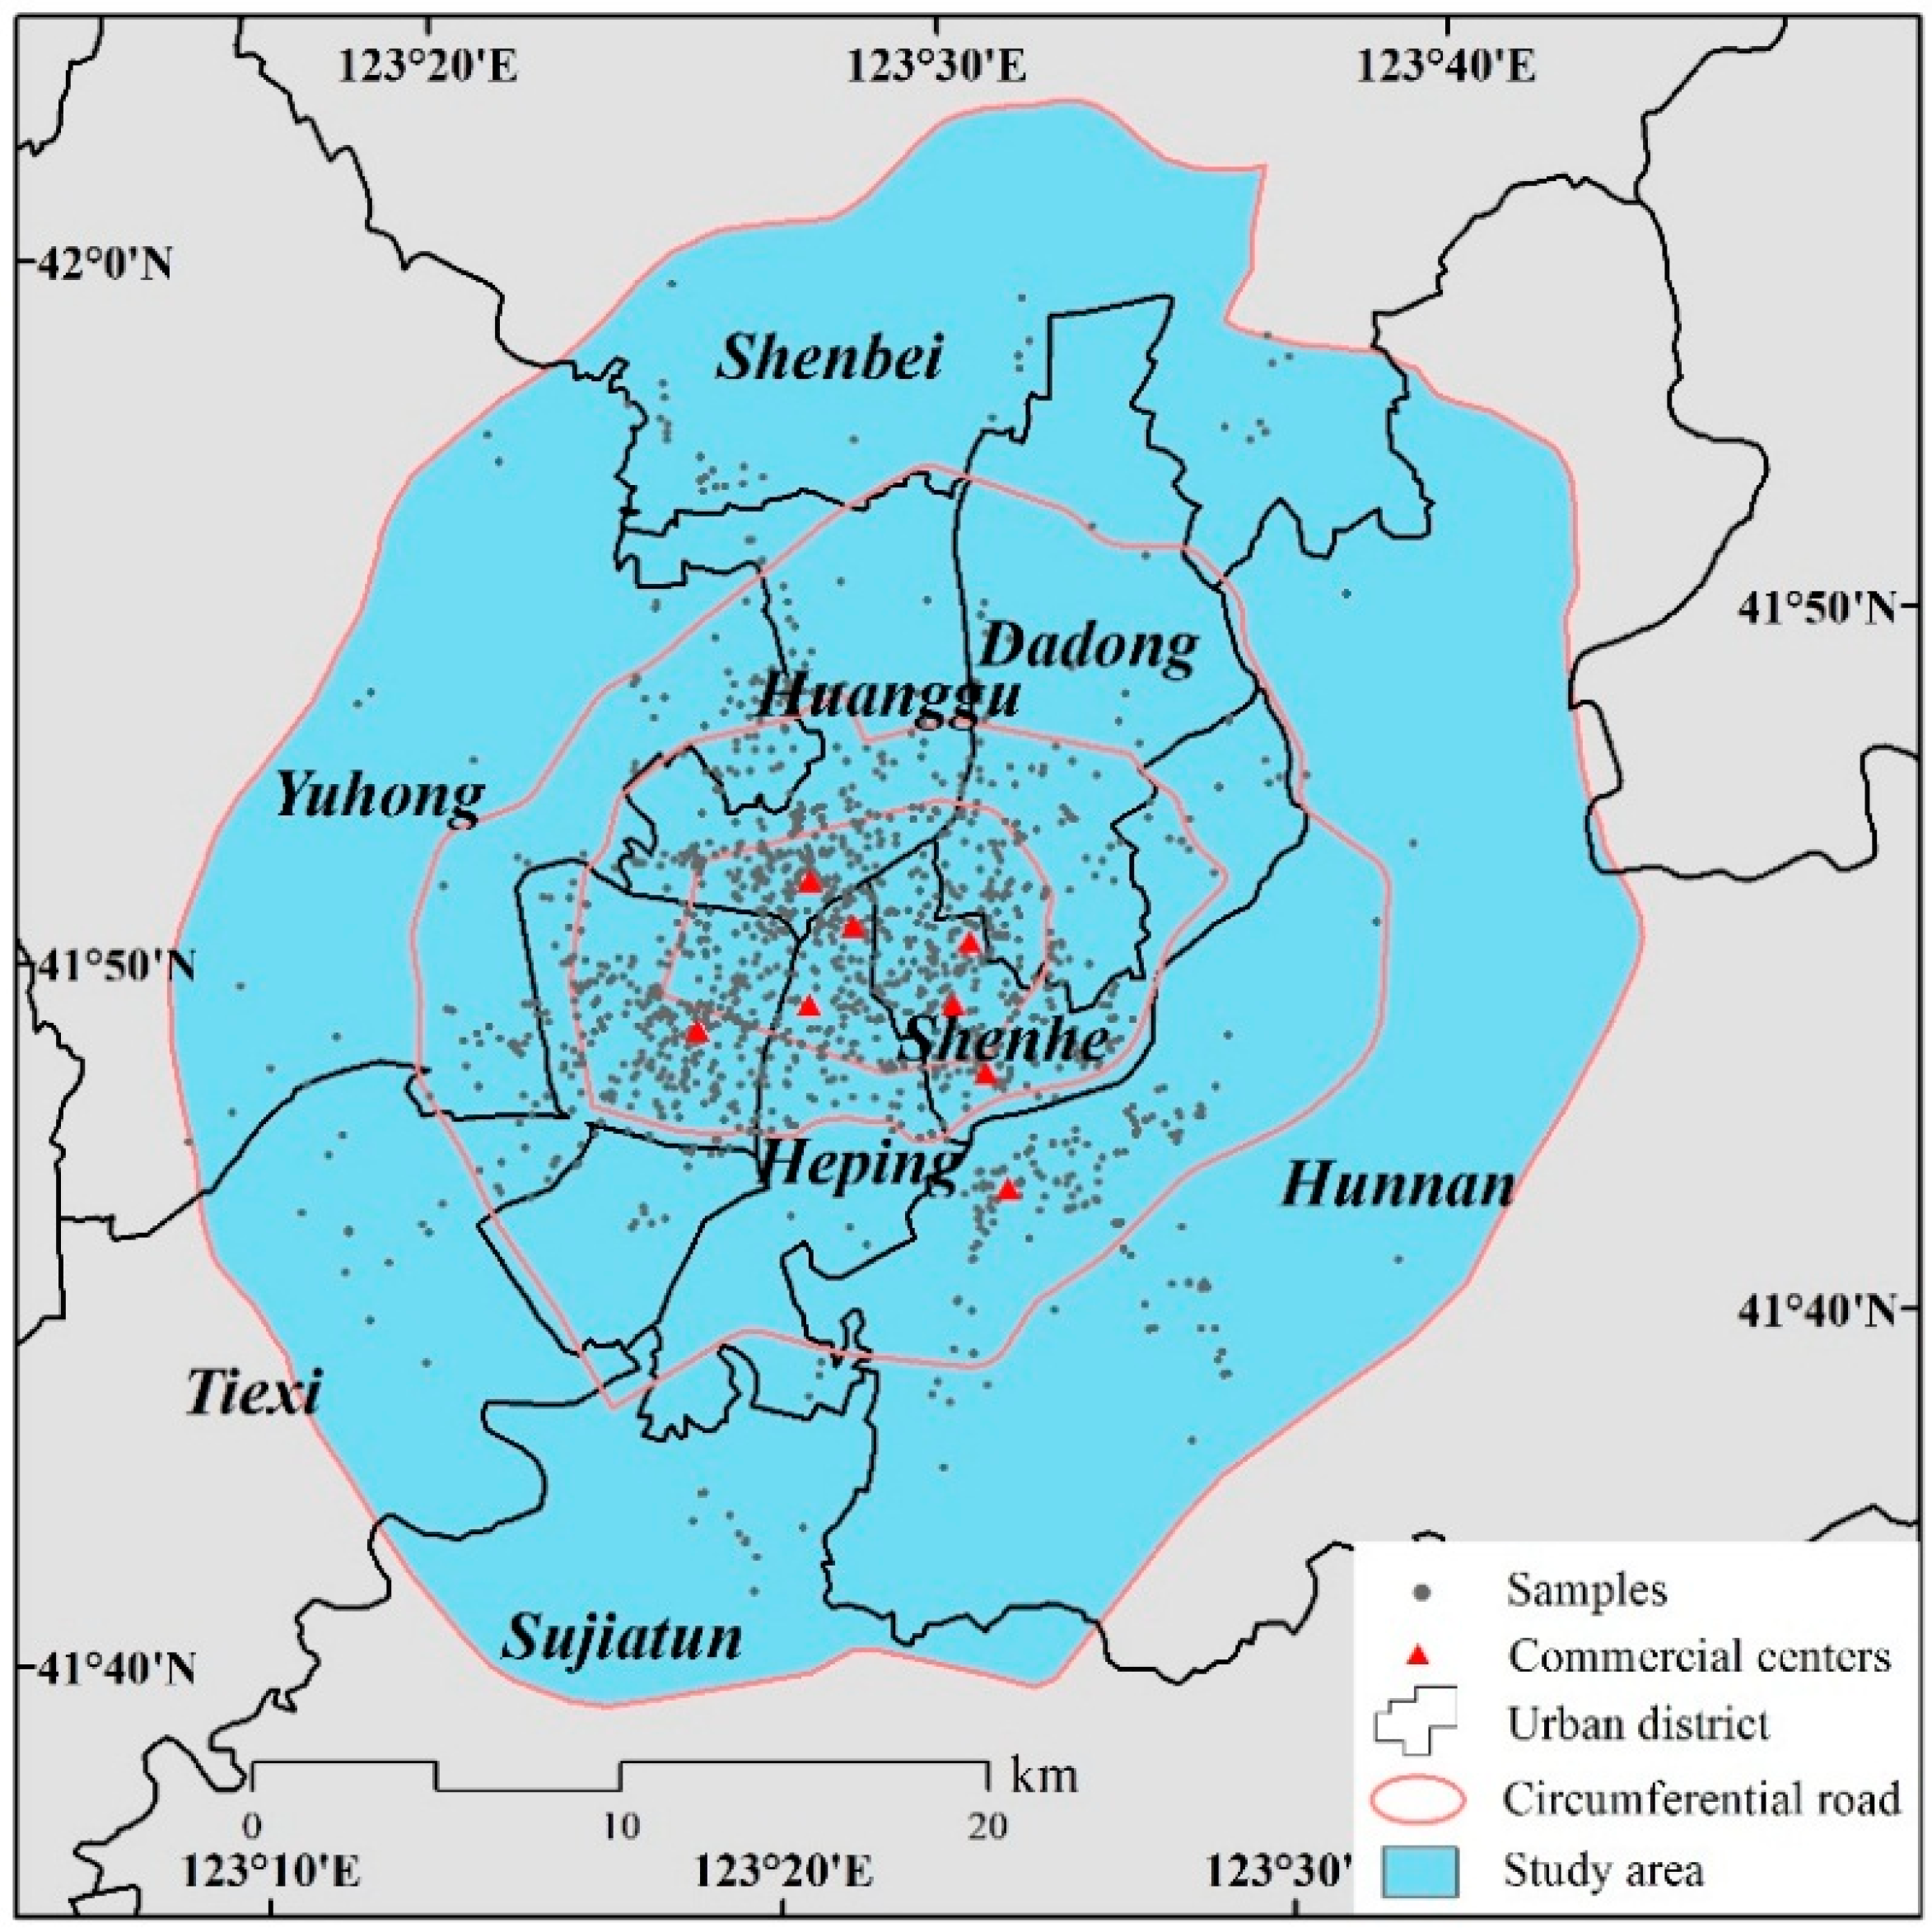
2.1. Study Area
2.2. Data Collection
2.3. Methodology
3. Results and Discussions
3.1. Respondent Socio-Economic Characteristics
3.2. Travel Behavior of Respondents during Shopping Trips
3.3. Impacts of Socio-Economic Factors on Transport Mode Choice
4. Conclusions
Author Contributions
Acknowledgments
Conflicts of Interest
References
- Banister, D. Cities, mobility and climate change. J. Transp. Geogr. 2011, 19, 1538–1546. [Google Scholar] [CrossRef]
- Liu, B.; Evans, M.; Yu, S.; Roshchanka, V.; Dukkipati, S.; Sreenivas, A. Effective energy data management for low-carbon growth planning: An analytical framework for assessment. Energy Policy 2017, 107, 32–42. [Google Scholar] [CrossRef]
- Jain, D.; Tiwari, G. How the present would have looked like? Impact of non-motorized transport and public transport infrastructure on travel behavior, energy consumption and CO2 emissions—Delhi, Pune and Patna. Sustain. Cities Soc. 2016, 22, 1–10. [Google Scholar] [CrossRef]
- Alkhathlan, K.; Javid, M. Carbon emissions and oil consumption in Saudi Arabia. Renew. Sustain. Energy Rev. 2015, 48, 105–111. [Google Scholar] [CrossRef]
- Birago, D.; Opoku Mensah, S.; Sharma, S. Level of service delivery of public transport and mode choice in Accra, Ghana. Transp. Res. Pt. F Traffic Psychol. Behav. 2017, 46, 284–300. [Google Scholar] [CrossRef]
- Tian, Y.; Zhu, Q.; Lai, K.-H.; Venus Lun, Y.H. Analysis of greenhouse gas emissions of freight transport sector in China. J. Transp. Geogr. 2014, 40, 43–52. [Google Scholar] [CrossRef]
- Yang, Y.; Wang, C.; Liu, W.; Zhou, P. Microsimulation of low carbon urban transport policies in Beijing. Energy Policy 2017, 107, 561–572. [Google Scholar] [CrossRef]
- Bose, R.K. Urban transport scenarios in South Asia: Energy and environmental impact of enhanced public transport systems. Transp. Res. Rec. 2007, 2011, 116–126. [Google Scholar] [CrossRef]
- Xu, B.; Lin, B. Factors affecting carbon dioxide (CO2) emissions in China’s transport sector: A dynamic nonparametric additive regression model. J. Clean. Prod. 2015, 101, 311–322. [Google Scholar] [CrossRef]
- Salonen, M.; Broberg, A.; Kyttä, M.; Toivonen, T. Do suburban residents prefer the fastest or low-carbon travel modes? Combining public participation GIS and multimodal travel time analysis for daily mobility research. Appl. Geogr. 2014, 53, 438–448. [Google Scholar] [CrossRef]
- Tight, M.; Timms, P.; Banister, D.; Bowmaker, J.; Copas, J.; Day, A.; Drinkwater, D.; Givoni, M.; Gühnemann, A.; Lawler, M. Visions for a walking and cycling focussed urban transport system. J. Transp. Geogr. 2011, 19, 1580–1589. [Google Scholar] [CrossRef] [Green Version]
- Gutiérrez, J.; García-Palomares, J.C. New spatial patterns of mobility within the metropolitan area of Madrid: Towards more complex and dispersed flow networks. J. Transp. Geogr. 2007, 15, 18–30. [Google Scholar] [CrossRef]
- Knowles, R.D. Transport shaping space: Differential collapse in time–space. J. Transp. Geogr. 2006, 14, 407–425. [Google Scholar] [CrossRef]
- Määttä-Juntunen, H.; Antikainen, H.; Kotavaara, O.; Rusanen, J. Using GIS tools to estimate CO2 emissions related to the accessibility of large retail stores in the Oulu region, Finland. J. Transp. Geogr. 2011, 19, 346–354. [Google Scholar] [CrossRef]
- Zhang, M. Exploring the relationship between urban form and nonwork travel through time use analysis. Lands. Urban Plan. 2005, 73, 244–261. [Google Scholar] [CrossRef]
- Takahashi, T. Location competition in an Alonso–Mills–Muth city. Reg. Sci. Urban Econ. 2014, 48, 82–93. [Google Scholar] [CrossRef]
- Marjanen, H. Longitudinal study on consumer spatial shopping behaviour with special reference to out-of-town shopping: Experiences from Turku, Finland. J. Retail. Consum. Serv. 1995, 2, 163–174. [Google Scholar] [CrossRef]
- Yeates, M.; Montgomery, D. The changing commercial structure of non-metropolitan urban centres and vacancy rates. Can. Geogr. Géogr. Can. 1999, 43, 382–399. [Google Scholar] [CrossRef]
- Cao, L.; Chai, Y. Daily shopping activity space of the elderly in Shanghai city. Hum. Geogr. 2006, 21, 50–54. [Google Scholar]
- Jing, L.I.; Kevin, L.O.; Zhang, P.; Guo, M. Relationship between built environment, socio-economic factors and carbon emissions from shopping trip in Shenyang city, China. Chin. Geogr. Sci. 2017, 27, 722–734. [Google Scholar]
- Meng, M.; Koh, P.; Wong, Y.; Zhong, Y. Influences of urban characteristics on cycling: Experiences of four cities. Sustain. Cities Soc. 2014, 13, 78–88. [Google Scholar] [CrossRef]
- Guan, C.; Cui, G. Progress in research on foreign commercial geography since the 1990′s. World Reg. Stud. 2003, 12, 44–53. [Google Scholar]
- Shi, Y.; Wu, J.; Wang, S. Spatio-temporal features and the dynamic mechanism of shopping center expansion in Shanghai. Appl. Geogr. 2015, 65, 93–108. [Google Scholar] [CrossRef]
- Sun, G.; Chen, Z. The retrospect and prospect on the commercial spatial researches in China and the corresponding compaer with western countries since the 1920′s. Hum. Geogr. 2008, 23, 78–83. [Google Scholar]
- Jiangping, Z.; Chun, Z.; Xiaojian, C.; Wei, H.; Peng, Y. Has the legacy of danwei persisted in transformations? The jobs-housing balance and commuting efficiency in Xi’an. J. Transp. Geogr. 2014, 40, 64–76. [Google Scholar] [CrossRef]
- Fan, Y.; Khattak, A.J. Does urban form matter in solo and joint activity engagement? Lands. Urban Plan. 2009, 92, 199–209. [Google Scholar] [CrossRef]
- Huo, H.; Wang, M.; Zhang, X.; He, K.; Gong, H.; Jiang, K.; Jin, Y.; Shi, Y.; Yu, X. Projection of energy use and greenhouse gas emissions by motor vehicles in China: Policy options and impacts. Energy Policy 2012, 43, 37–48. [Google Scholar] [CrossRef]
- Zheng, B.; Zhang, Q.; Borken-Kleefeld, J.; Hong, H.; Guan, D.; Klimont, Z.; Peters, G.P.; He, K. How will greenhouse gas emissions from motor vehicles be constrained in China around 2030? Appl. Energy 2015, 156, 230–240. [Google Scholar] [CrossRef] [Green Version]
- De Gennaro, M.; Paffumi, E.; Martini, G. Big data for supporting low-carbon road transport policies in Europe: Applications, challenges and opportunities. Big Data Res. 2016, 6, 11–25. [Google Scholar] [CrossRef]
- Hensher, D.A. Sustainable public transport systems: Moving towards a value for money and network-based approach and away from blind commitment. Transp. Policy 2007, 14, 98–102. [Google Scholar] [CrossRef]
- Kwan, S.C.; Tainio, M.; Woodcock, J.; Sutan, R.; Hashim, J.H. The carbon savings and health co-benefits from the introduction of mass rapid transit system in Greater Kuala Lumpur, Malaysia. J. Transp. Health 2017, 6, 187–200. [Google Scholar] [CrossRef]
- El-Fadel, M.; Bou-Zeid, E. Transportation GHG emissions in developing countries.: The case of Lebanon. Transp. Res. Part D Transp. Environ. 1999, 4, 251–264. [Google Scholar] [CrossRef]
- Kunhikrishnan, P.; Srinivasan, K.K. Investigating behavioral differences in the choice of distinct Intermediate Public Transport (IPT) modes for work trips in Chennai city. Transp. Policy 2018, 61, 111–122. [Google Scholar] [CrossRef]
- Chaturvedi, V.; Kim, S.H. Long term energy and emission implications of a global shift to electricity-based public rail transportation system. Energy Policy 2015, 81, 176–185. [Google Scholar] [CrossRef]
- Rabl, A.; Nazelle, A.D. Benefits of shift from car to active transport. Transp. Policy 2012, 19, 121–131. [Google Scholar] [CrossRef]
- Bergstad, C.J.; Gamble, A.; Hagman, O.; Polk, M.; Gärling, T.; Olsson, L.E. Affective–symbolic and instrumental–independence psychological motives mediating effects of socio-demographic variables on daily car use. J. Transp. Geogr. 2011, 19, 33–38. [Google Scholar] [CrossRef]
- Kotval-K, Z.; Vojnovic, I. The socio-economics of travel behavior and environmental burdens: A Detroit, Michigan regional context. Transp. Res. Part D Transp. Environ. 2015, 41, 477–491. [Google Scholar] [CrossRef]
- Timilsina, G.R.; Shrestha, A. Transport sector CO2 emissions growth in Asia: Underlying factors and policy options. Energy Policy 2009, 37, 4523–4539. [Google Scholar] [CrossRef]
- Zahabi, S.A.H.; Miranda-Moreno, L.; Patterson, Z.; Barla, P. Spatio-temporal analysis of car distance, greenhouse gases and the effect of built environment: A latent class regression analysis. Transp. Res. Part A Policy Pract. 2015, 77, 1–13. [Google Scholar] [CrossRef] [Green Version]
- Waygood, E.; Sun, Y.; Susilo, Y.O. Transportation carbon dioxide emissions by built environment and family lifecycle: Case study of the Osaka metropolitan area. Transp. Res. Part D Transp. Environ. 2014, 31, 176–188. [Google Scholar] [CrossRef]
- Manoj, M.; Verma, A. Effect of built environment measures on trip distance and mode choice decision of non-workers from a city of a developing country, India. Transp. Res. Part D Transp. Environ. 2016, 46, 351–364. [Google Scholar] [CrossRef]
- Etminani-Ghasrodashti, R.; Ardeshiri, M. The impacts of built environment on home-based work and non-work trips: An empirical study from Iran. Transp. Res. Part A Policy Pract. 2016, 85, 196–207. [Google Scholar] [CrossRef]
- Cao, X.; Fan, Y. Exploring the influences of density on travel behavior using propensity score matching. Environ. Plan. B Plan. Des. 2012, 39, 459–470. [Google Scholar] [CrossRef]
- Newman, P.; Kenworthy, J.R. Gasoline consumption and cities: A comparison of U.S. cities with a global survey. J. Am. Plan. Assoc. 1987, 55, 24–37. [Google Scholar] [CrossRef]
- Ewing, R.; Cervero, R. Travel and the built environment. J. Am. Plan. Assoc. 2010, 76, 265–294. [Google Scholar] [CrossRef]
- Bhat, C.R.; Astroza, S.; Sidharthan, R.; Alam, M.J.B.; Khushefati, W.H. A joint count-continuous model of travel behavior with selection based on a multinomial probit residential density choice model. Transp. Res. Part B Methodol. 2014, 68, 31–51. [Google Scholar] [CrossRef] [Green Version]
- Hankey, S.; Marshall, J.D. Impacts of urban form on future us passenger-vehicle greenhouse gas emissions. Energy Policy 2010, 38, 4880–4887. [Google Scholar] [CrossRef]
- Bagley, M.N.; Mokhtarian, P.L. The impact of residential neighborhood type on travel behavior: A structural equations modeling approach. Ann. Reg. Sci. 2002, 36, 279–297. [Google Scholar] [CrossRef] [Green Version]
- Etminani-Ghasrodashti, R.; Ardeshiri, M. Modeling travel behavior by the structural relationships between lifestyle, built environment and non-working trips. Transp. Res. Part A Policy Pract. 2015, 78, 506–518. [Google Scholar] [CrossRef]
- Aguiléra, A.; Voisin, M.; Voisin, M. Urban form, commuting patterns and CO2 emissions: What differences between the municipality’s residents and its jobs? Transp. Res. Part A 2014, 69, 243–251. [Google Scholar] [CrossRef]
- Aguiléra, A.; Wenglenski, S.; Proulhac, L. Employment suburbanisation, reverse commuting and travel behaviour by residents of the central city in the Paris metropolitan area. Transp. Res. Part A Policy Pract. 2009, 43, 685–691. [Google Scholar] [CrossRef] [Green Version]
- Cirilli, A.; Veneri, P. Spatial structure and carbon dioxide (CO2) emissions due to commuting: An analysis of Italian urban areas. Reg. Stud. 2014, 48, 1993–2005. [Google Scholar] [CrossRef]
- Scott, D.M.; Kanaroglou, P.S.; Anderson, W.P. Impacts of commuting efficiency on congestion and emissions: Case of the Hamilton CMA, canada. Transp. Res. Part D Transp. Environ. 1997, 2, 245–257. [Google Scholar] [CrossRef]
- Jiang, G.; Zhang, R.; Ma, W.; Zhou, D.; Wang, X.; He, X. Cultivated land productivity potential improvement in land consolidation schemes in Shenyang, China: Assessment and policy implications. Land Use Policy 2017, 68, 80–88. [Google Scholar] [CrossRef]
- Sun, L.; Dong, H.; Geng, Y.; Li, Z.; Liu, Z.; Fujita, T.; Ohnishi, S.; Fujii, M. Uncovering driving forces on urban metabolism—A case of shenyang. J. Clean. Prod. 2016, 114, 171–179. [Google Scholar] [CrossRef]
- Zhao, Z.-Q.; He, B.-J.; Li, L.-G.; Wang, H.-B.; Darko, A. Profile and concentric zonal analysis of relationships between land use/land cover and land surface temperature: Case study of Shenyang, China. Energ Build. 2017, 155, 282–295. [Google Scholar] [CrossRef]
- Li, J.; Lo, K.; Zhang, P.; Guo, M. Consumer travel behaviors and transport carbon emissions: A comparative study of commercial centers in Shenyang, China. Energies 2016, 9, 765. [Google Scholar] [CrossRef]
- Ng, C.P.; Law, T.H.; Wong, S.V.; Kulanthayan, S. Factors related to seatbelt-wearing among rear-seat passengers in Malaysia. Accid. Anal. Prev. 2013, 50, 351–360. [Google Scholar] [CrossRef] [PubMed] [Green Version]
- Nesheli, M.M.; Ceder, A.; Estines, S. Public transport user’s perception and decision assessment using tactic-based guidelines. Transp. Policy 2016, 49, 125–136. [Google Scholar] [CrossRef]
- Liu, B.S. Association of intersection approach speed with driver characteristics, vehicle type and traffic conditions comparing urban and suburban areas. Accid. Anal. Prev. 2007, 39, 216–223. [Google Scholar] [CrossRef] [PubMed]
- Szeto, W.Y.; Yang, L.; Wong, R.C.P.; Li, Y.C.; Wong, S.C. Spatio-temporal travel characteristics of the elderly in an ageing society. Travel Behav. Soc. 2017, 9, 10–20. [Google Scholar] [CrossRef]
- Omrani, H. Predicting travel mode of individuals by machine learning. Transp. Res. Procedia 2015, 10, 840–849. [Google Scholar] [CrossRef]
- Naznin, F.; Currie, G.; Logan, D. Exploring the impacts of factors contributing to tram-involved serious injury crashes on Melbourne tram routes. Accid. Anal. Prev. 2016, 94, 238–244. [Google Scholar] [CrossRef] [PubMed]
- Ramos, H.M.; Ollero, J.; Suárez-Llorens, A. A new explanatory index for evaluating the binary logistic regression based on the sensitivity of the estimated model. Stat. Probab. Lett. 2017, 120, 135–140. [Google Scholar] [CrossRef]
- Smallman-Raynor, M.R.; Rafferty, S.; Cliff, A.D. Variola minor in coalfield areas of England and Wales, 1921–1934: Geographical determinants of a national smallpox epidemic that spread out of effective control. Soc. Sci. Med. 2017, 180, 160–169. [Google Scholar] [CrossRef] [PubMed]
- Liu, Y.; Yue, W.; Fan, P.; Song, Y. Suburban residential development in the era of market-oriented land reform: The case of Hangzhou, China. Land Use Policy 2015, 42, 233–243. [Google Scholar] [CrossRef]
- Yu, B.; Yang, Z.; Cheng, C. Optimizing the distribution of shopping centers with parallel genetic algorithm. Eng. Appl. Artif. Intell. 2007, 20, 215–223. [Google Scholar] [CrossRef]
- Carling, K.; Håkansson, J.; Jia, T. Out-of-town shopping and its induced CO2-emissions. J. Retail. Consum. Serv. 2013, 20, 382–388. [Google Scholar] [CrossRef]
- Plaut, P.O. Non-motorized commuting in the US. Transp. Res. Part D Transp. Environ. 2005, 10, 347–356. [Google Scholar] [CrossRef]
- Choi, H.; Ahn, Y. A study on possibility of commuting trip using private motorized modes in cities around the world: Application of multilevel model. Transp. Res. Part D Transp. Environ. 2015, 41, 228–243. [Google Scholar] [CrossRef]
- Carse, A.; Goodman, A.; Mackett, R.L.; Panter, J.; Ogilvie, D. The factors influencing car use in a cycle-friendly city: The case of Cambridge. J. Transp. Geogr. 2013, 28, 67–74. [Google Scholar] [CrossRef] [PubMed]
- Hachem, C. Impact of neighborhood design on energy performance and GHG emissions. Appl. Energ 2016, 177, 422–434. [Google Scholar] [CrossRef]
- Andong, R.F.; Sajor, E. Urban sprawl, public transport, and increasing CO2 emissions: The case of Metro Manila, Philippines. Environ. Dev. Sustain. 2015, 19, 1–25. [Google Scholar] [CrossRef]
- Cao, X.J. Heterogeneous effects of neighborhood type on commute mode choice: An exploration of residential dissonance in the twin cities. J. Transp. Geogr. 2015, 48, 188–196. [Google Scholar] [CrossRef]
- Myers, A.M.; Trang, A.; Crizzle, A.M. Naturalistic study of winter driving practices by older men and women: Examination of weather, road conditions, trip purposes, and comfort. Can. J. Aging 2011, 30, 577–589. [Google Scholar] [CrossRef] [PubMed]
- Mu, R.; De Jong, M. Establishing the conditions for effective transit-oriented development in China: The case of Dalian. J. Transp. Geogr. 2012, 24, 234–249. [Google Scholar] [CrossRef]
- Li, J.; Zhang, P.; Lo, K.; Guo, M.; Wang, M. Reducing carbon emissions from shopping trips: Evidence from China. Energies 2015, 8, 10043–10057. [Google Scholar] [CrossRef]
- Hammadou, H.; Papaix, C. Policy packages for modal shift and CO2 reduction in Lille, France. Transp. Res. Part D 2015, 38, 105–116. [Google Scholar] [CrossRef]


| Car Ownership | Gender | Age Group | Education | Occupation | Monthly Income |
|---|---|---|---|---|---|
| Yes (36.2) No (63.8) | Male (37.4) Female (62.6) | ≤18(1.97) 19–25(28.13) 26–35(34.82) 36–50(18.49) ≥51(16.59) | Below High school (26.16) High school (14.75) Undergraduate (54.75) Above Master (4.33) | Public (15.34) Business (35.93) Self-employed (17.51) Unemployed and retirement (31.21) | <2000 CNY (15.00) 2000–3000 (28.30) 3000–5000 (30.80) >5000 (25.90) |
| Commercial Center | Low-Carbon Mode | Non-Low-Carbon Mode | ||||||||||
|---|---|---|---|---|---|---|---|---|---|---|---|---|
| Walking/Cycling | Electric Bike | Bus | Metro | Private Car | Taxi | |||||||
| Proportion (%) | Distance (km) | Proportion (%) | Distance (km) | Proportion (%) | Distance (km) | Proportion (%) | Distance (km) | Proportion (%) | Distance (km) | Proportion (%) | Distance (km) | |
| Wuai | 6.53 | 2.12 | 3.52 | 6.81 | 66.33 | 8.17 | 2.51 | 12.40 | 13.07 | 12.42 | 8.04 | 6.94 |
| Nanta | 17.35 | 2.35 | 1.53 | 5.43 | 62.76 | 8.29 | 1.02 | 8.25 | 12.76 | 11.24 | 4.59 | 6.78 |
| Hunnan | 11.76 | 2.65 | 0.49 | 6.30 | 30.88 | 9.43 | 29.41 | 13.98 | 20.10 | 8.27 | 7.35 | 6.79 |
| Middle Street | 15.38 | 2.08 | 0.45 | 5.60 | 45.25 | 8.54 | 19.91 | 11.20 | 15.38 | 8.52 | 3.62 | 6.64 |
| Taiyuan Street | 6.77 | 2.31 | 0.52 | 4.30 | 41.15 | 8.82 | 28.13 | 8.13 | 15.63 | 7.64 | 7.81 | 6.42 |
| Xita-Beishi | 38.68 | 1.35 | 2.83 | 3.83 | 32.08 | 7.11 | 0.94 | 4.50 | 22.64 | 5.86 | 2.83 | 4.70 |
| Beihang | 26.94 | 1.76 | 1.37 | 2.33 | 55.25 | 6.06 | 1.83 | 10.95 | 10.50 | 6.22 | 4.11 | 5.47 |
| Tiexi | 23.65 | 1.66 | 3.45 | 5.06 | 47.48 | 7.00 | 13.79 | 7.03 | 6.90 | 5.82 | 4.43 | 3.38 |
| Explanatory Factors | B | S.E. | Wals | Exp (B) | 95% C.I. for Exp (B) | |
|---|---|---|---|---|---|---|
| Lower | Upper | |||||
| Car ownership (ref: no) | 1.728 *** | 0.158 | 119.745 | 5.629 | 4.131 | 7.671 |
| Gender (ref: female) | 0.657 *** | 0.145 | 20.488 | 1.928 | 1.451 | 2.563 |
| Monthly income(ref: >5000 CNY) | ||||||
| Monthly income (<2000) | −0.866 ** | 0.303 | 8.154 | 0.421 | 0.232 | 0.762 |
| Monthly income (2000–3000) | −0.650 ** | 0.207 | 9.872 | 0.522 | 0.348 | 0.783 |
| Monthly income (3000–5000)Age (ref: ≥51) | −0.530 ** | 0.170 | 9.777 | 0.588 | 0.422 | 0.820 |
| Age (≤18) | −0.312 | 0.536 | 0.340 | 0.732 | 0.256 | 2.093 |
| Age (19–25) | 0.003 | 0.280 | 0.000 | 1.003 | 0.579 | 1.737 |
| Age (26–35) | 0.375 | 0.267 | 1.979 | 1.455 | 0.863 | 2.455 |
| Age (36–50)Occupation (ref: retirement and unemployed) | 0.342 | 0.280 | 1.492 | 1.407 | 0.813 | 2.435 |
| Occupation (public) | 0.204 | 0.245 | 0.693 | 1.226 | 0.759 | 1.981 |
| Occupation (business) | 0.092 | 0.210 | 0.192 | 1.096 | 0.726 | 1.655 |
| Occupation (self-employed)Education (ref: above master) | 0.106 | 0.230 | 0.214 | 1.112 | 0.709 | 1.745 |
| Education (below high school) | 0.142 | 0.426 | 0.111 | 1.153 | 0.500 | 2.655 |
| Education (high school) | 0.629 | 0.382 | 2.707 | 1.876 | 0.887 | 3.970 |
| Education (undergraduate) | 0.359 | 0.351 | 1.050 | 1.432 | 0.720 | 2.848 |
| Constant | −2.815 *** | 0.455 | 38.227 | 0.060 | ||
| Pseudo R-Square (Nagelkerke) | 0.256 | |||||
| −2 Log Likelihood | 1251.411 | |||||
| Chi-Square | 270.220 | |||||
© 2018 by the authors. Licensee MDPI, Basel, Switzerland. This article is an open access article distributed under the terms and conditions of the Creative Commons Attribution (CC BY) license (http://creativecommons.org/licenses/by/4.0/).
Share and Cite
Li, J.; Lo, K.; Guo, M. Do Socio-Economic Characteristics Affect Travel Behavior? A Comparative Study of Low-Carbon and Non-Low-Carbon Shopping Travel in Shenyang City, China. Int. J. Environ. Res. Public Health 2018, 15, 1346. https://0-doi-org.brum.beds.ac.uk/10.3390/ijerph15071346
Li J, Lo K, Guo M. Do Socio-Economic Characteristics Affect Travel Behavior? A Comparative Study of Low-Carbon and Non-Low-Carbon Shopping Travel in Shenyang City, China. International Journal of Environmental Research and Public Health. 2018; 15(7):1346. https://0-doi-org.brum.beds.ac.uk/10.3390/ijerph15071346
Chicago/Turabian StyleLi, Jing, Kevin Lo, and Meng Guo. 2018. "Do Socio-Economic Characteristics Affect Travel Behavior? A Comparative Study of Low-Carbon and Non-Low-Carbon Shopping Travel in Shenyang City, China" International Journal of Environmental Research and Public Health 15, no. 7: 1346. https://0-doi-org.brum.beds.ac.uk/10.3390/ijerph15071346