Continuous Flow-Constructed Wetlands for the Treatment of Swine Waste Water

1
USDA-ARS, U.S. Salinity Laboratory, 450 W. Big Springs Rd, Riverside, CA 92507, USA
2
Department of Animal and Veterinary Sciences, California State Polytechnic University, Pomona, CA 91768, USA
*
Author to whom correspondence should be addressed.
Int. J. Environ. Res. Public Health 2018, 15(7), 1369; https://0-doi-org.brum.beds.ac.uk/10.3390/ijerph15071369
Submission received: 29 May 2018
/
Revised: 22 June 2018
/
Accepted: 27 June 2018
/
Published: 29 June 2018
(This article belongs to the Special Issue Microbiological Evaluation of Wastewater Treatment)
Abstract
:The microbiological quality of treated waste water is always a concern when waste water is disposed to the environment. However, when treated appropriately, such water can serve many purposes to the general population. Therefore, the treatment and removal of contaminants from swine waste water by continuous flow-constructed wetlands involves complex biological, physical, and chemical processes that may produce better quality water with reduced levels of contaminants. Swine waste contains E. coli populations and other bacterial contaminants originating from swine houses through constructed wetlands, but little is known about E. coli population in swine waste water. To assess the impacts of seasonal variations and the effect of the wetland layout/operations on water quality, E. coli isolates were compared for genetic diversity using repetitive extragenic palindromic polymerase chain reaction (REP-PCR). None of the isolates was confirmed as Shiga toxin producing E. coli O157:H7 (STEC); however, other pathotypes, such as enterotoxigenic E. coli (ETEC) were identified. Using a 90% similarity index from REP-PCR, 69 genotypes out of 421 E. coli isolates were found. Our data showed that the E. coli population was significantly (p = 0.036) higher in November than in March and August in most of the wetland cells. Furthermore, there was a significant (p = 0.001) reduction in E. coli populations from wetland influent to the final effluent. Therefore, the use of continuous flow-constructed wetlands may be a good treatment approach for reducing contaminants from different waste water sources.
1. Introduction
Continuous flow-constructed wetland is a natural process for the treatment of waste water [1,2,3]. It is an alternative to conventional technologies for wastewater treatment [2]. In places with concentrated animal feeding operations (CAFOs), such as North Carolina [4], current management practices for swine waste involve long-term storage in ponds where it is left to evaporate, percolate into groundwater, or sprayed onto crops and/or disposal lands. Swine waste is high in dissolved and particulate organic matter, ammonia and organically bound phosphorus and nitrogen as well as biological oxygen demand, and other contaminants. Swine waste may also contain E. coli, protozoan parasites such as Cyrptosporidium and Giardia, as well as viruses. E. coli can be transported through storm water after a heavy rainfall washing infected manure into the farming community’s wells and subsequently contaminating ground water and soil. Water contamination by E. coli is becoming common in rural areas of the United States, with up to 40% of tested wells found to be contaminated [4].
In 1999, hurricane Floyd caused serious flooding of swine waste in North Carolina, polluting surface water, and resulting in the contamination of the environment with fecal bacteria [4]. After the 2006 storm, new technologies such as constructed wetlands for treating waste from swine operations in the state came into effect [4]. The extent of water treatment in constructed wetlands depends upon the wetland design, microbial community, and types of plants involved, and a combination of these processes may help in the removal of nitrogen (N), phosphorus (P), solids, and chemical oxygen demand (COD) from treated swine wastewater, therefore, preventing the overloading of nutrients on agricultural land to which the effluent is applied [5]. The results from a subsequent study [6] showed that the bacterial colony forming units (CFU) and the average concentrations of total nitrogen, NH4+, total phosphorous (TP) and PO3− from the influent to the effluent decreased. The NH4+ and the PO43− concentrations showed the most dramatic changes, with decreases of 39.97% and 16.92%, respectively. This followed a similar trend in a dairy wetland in southern California, USA [2]. The study in California provided good evidence of the effectiveness of wetland technology in water reclamation. In another study, Ibekwe et al. [3] showed that surface flow-constructed wetlands could serve as a model for waste management from concentrated animal feeding operations (CAFOs) and other confined-animal facilities, resulting in the general improvement of ground and surface water quality. The present study looks at E. coli serotype identification, population structure, and genetic diversity of E. coli in a surface flow-constructed wetland systems in association with continuous flow ponds. The addition of two continuous flow ponds is new and this has been suggested as a potential treatment option prior to land application. The main contaminants from swine waste may include nutrients, salts, microbes, and pharmaceutically active compounds and their removal involves complex physical, chemical, and biological processes. E. coli are widely used as indicators of fecal contamination of waterways in most urban and rural areas. E. coli have diverse genotypes and phenotypes, and some characteristics are shared among strains exposed to similar environments due to selection pressure [7]. Our main objectives were to describe the abundance and reduction of E. coli in different configurations of constructed wetlands and correlating these data to the quality of the final effluent. The overall goal of this wetland is to have the final effluent water that is suitable for on-site reuse and reduces the number of contaminants entering the environment.
2. Materials and Methods
2.1. Experimental Site and Sampling
The experimental site was a continuous flow-constructed wetland located at a swine research facility at North Carolina Agricultural and Technical State University farm in Greensboro, NC, USA (Figure S1). The wetland has six cells 40 m long by 11 m wide and was constructed in 1995 [5,8]. Each cell consisted of 11 m by 10 m marsh at both influent and effluent and 11 m by 20 m pond section separating the marshes and planted with Typha latifolia L. (broadleaf cattail) and Scirpus americanus (bulrush) in March 1996 [5]. The marsh and pond sections of wetlands have previously been described [6]. The number of pigs from January 2007 to January 2012 ranged between 65 and 115. Waste flow from the swine house was flushed with recycled water into a two-stage anaerobic lagoon, and the flow from the lagoon was pumped into a storage tank as described before [6]. The wastewater from the storage tank was discharged by gravity into the wetland cells, and the final effluent from the wetland was discharged into a holding pond for recycling into the swine house or application on land. To detect the spatial and temporal variation of E. coli populations in wetland effluent, water samples were collected from different points in April, August, and November 2010. All samples were maintained on ice until arrival in the laboratory and then stored at 4 °C for further analysis. Samples were analyzed for ammonia (NH+4–N), nitrate (NO3–N), total-P (TP) and available-P (PO43−) using a flow injection analysis instrument (Lachat-QuikChem 8000, Loveland, CO, USA). The carbon (C) and nitrogen (N) concentrations were measured using a Perkin–Elmer 2400, CHNS/O series II Analyzer (Shelton, CT, USA).
2.2. Enumeration E. coli from MPN Method
All samples were analyzed using Colilert vessel (Westbrook, ME, USA) according to the manufacturers’ protocol, and E. coli population was expressed in Most Probable Number (MPN/100 mL). For isolation of E. coli, 100 μL liquid sample was removed from positive wells, then spread plated onto Chromagar ECC agar (CHROMagar Microbiology, Paris, France), and incubated at 37 °C for 24 h. All colonies were preserved at −80 °C for further characterization. Manure samples (10 g) were diluted with 90 mL of phosphate buffered saline (PBS) water (0.0425 g/L KH2PO4 and 0.4055 g/L MgCl2) and shaken for 15 min and individual colonies were processed as above according to method 9223 [9].
2.3. Isolation of Potential Pathogenic E. coli from Wetland
Harlequin cefixime-tellurite sorbitol MacConkey (CT-SMAC) agar with BCIG (5-bromo-4-chloro-3-indoxyl-β-d-glucuronide) (LAB M: IDG–Lancashire, UK) was used for the isolation of E. coli O157. All plates were incubated for 16 h at 37 °C. Translucent colonies (10) per sample were tested by multiplex PCR to determine the presence of hylA, stx1, stx2, and eae genes [10]. Red/pink colonies with a purple center or green colonies) were enumerated as other E. coli or non O157 or presumptive pathogenic E. coli. All isolates were tested for heat labile toxin (LT), heat stable toxins a and b (STa and STb), Shiga toxins 1 and 2 (stx1 and stx2), cytotoxin necrotizing factors 1 and 2 (cnf1 and cnf2), intimin (eae), including O and H serotypes [11] Table 1).
2.4. Typing of E. coli Using REP-PCR
Genomic DNA fingerprinting of E. coli isolates was performed using a procedure described by [12,13,14]. Repetitive Extragenic Palindromic-PCR (REP-PCR) was used to assess the genetic diversity of E. coli isolates. Rep-PCR fingerprints were obtained by using primer REP 1R (5′-IIIICGICGICATCIGGC-3′) and REP 2I (5′-ICGICTTATCIGGCCTAC-3′) [15,16]. All images were visualized using quality one gel imaging system (Bio-Rad Lab., Hercules, CA, USA). All comparisons were done with the BioNumerics software, version 7.5 (Applied Maths, Austin, TX, USA). Fingerprints were clustered using the Jaccard coefficient evaluated by the unweighted-pair group method (UPGMA).
2.5. Analysis of E. coli Genotyping
E. coli isolates were analyzed temporally and spatially as previously described [13] using REP-PCR DNA fingerprinting. Briefly, the total number of unique E. coli genotypes was calculated, the distribution of the genotypes, and occurring frequencies in the wetland samples were determined using a Pearson similarity coefficient and UPGMA (unweighted pair-group method using arithmetic averages). Genotype accumulation curves, the unique genotypes, and their abundances (i.e., how many isolates share the same genotypes) were calculated and analyzed.
2.6. Statistical Analysis
Data analyses were done in duplicate using analysis of variance (ANOVA) with log10-transformed density of E. coli bacteria using SAS version 9.1 [17] to determine statistically significant differences, and Tukey’s studentized test range (HSD) was used for mean separation. Shannon diversity index (H′) was used to calculate genetic diversity as previously described [18]:
where S is the number of unique genotypes and pi is the number of isolates sharing the same genotype, i, over the total number of isolates.
3. Results
3.1. Removal E. coli Isolates and Nutrients from Wetland Samples
To assess the spatial and temporal variations of E. coli population and genotypes isolates were obtained from manure effluent (S1) through wetland effluent (S8) during March, August, and November from continuous flow section of a marsh-pond-marsh constructed wetland (Figure S1). E. coli population was significantly (p = 0.036) higher in November than in March and August (Figure 1) in the pit finishing barn effluent (S1), lagoon 1 (S2, S3), and storage pond (S4). However, no differences were found in other cells. Spatially, and during November, there was a significant decline in E. coli populations from the manure effluent (S1) to the final effluent (S8). To determine spatial variation, 421 E. coli isolates obtained from waste water after processing in Colilert vessels (see Materials and Methods) were further processed for genotypic analysis using REP-PCR.
Total N, ammonium (NH4+), and total suspended solids (TS) significantly decreased (p < 0.05) in wetlands from the lagoon to the final effluent (Figure 2). About 70% of N and NH4+ were removed from the influent to the effluent. The removal rate was similar to that previously reported [5,19]. Removal efficiency of total and organic phosphorus and total suspended solids were significantly higher (p < 0.01) between lagoon and the final effluent.
3.2. Characterization of Potentially Pathogenic E. coli
A total of 421 E. coli isolates were used for all analysis. None of these strains was classified as Shiga toxin producing E. coli O157 (STEC). The rest were classified as enterotoxigenic E. coli (ETEC) due to the presence of heat labile or heat stable toxin-encoding genes. A total of eleven isolates (15%) carried stx2 gene, none carried stx1 and 20% of the isolates carried eae genes (The eae+ stx-isolates should be classified as enteropathogenic E. coli, EPEC). However, none of the isolates with eae genes carried stx2 genes. Therefore, none of these isolates were classified as STEC O157 or any other O groups based on the typing protocol. On the other hand, 72% of the isolates carried either of the heat stable toxins a and b (sta/stb) genes reflecting that these are ETEC strains. The high concentrations of ETEC suggest high prevalence of E. coli in swine manure, which may cause diarrhea. Therefore, treating swine waste water before release to the environment, is critical.
3.3. Diversity of E. coli Isolates in the Continuous Flow-Constructed Wetland with REP-PCR
Using a Pearson similarity coefficient and UPGMA strains with fingerprint patterns with similarity above 90% were considered clonal populations and were analyzed by REP-PCR DNA fingerprinting (Figure 3 with the dotted line representing the 90% cutoff point for unique genotypes).
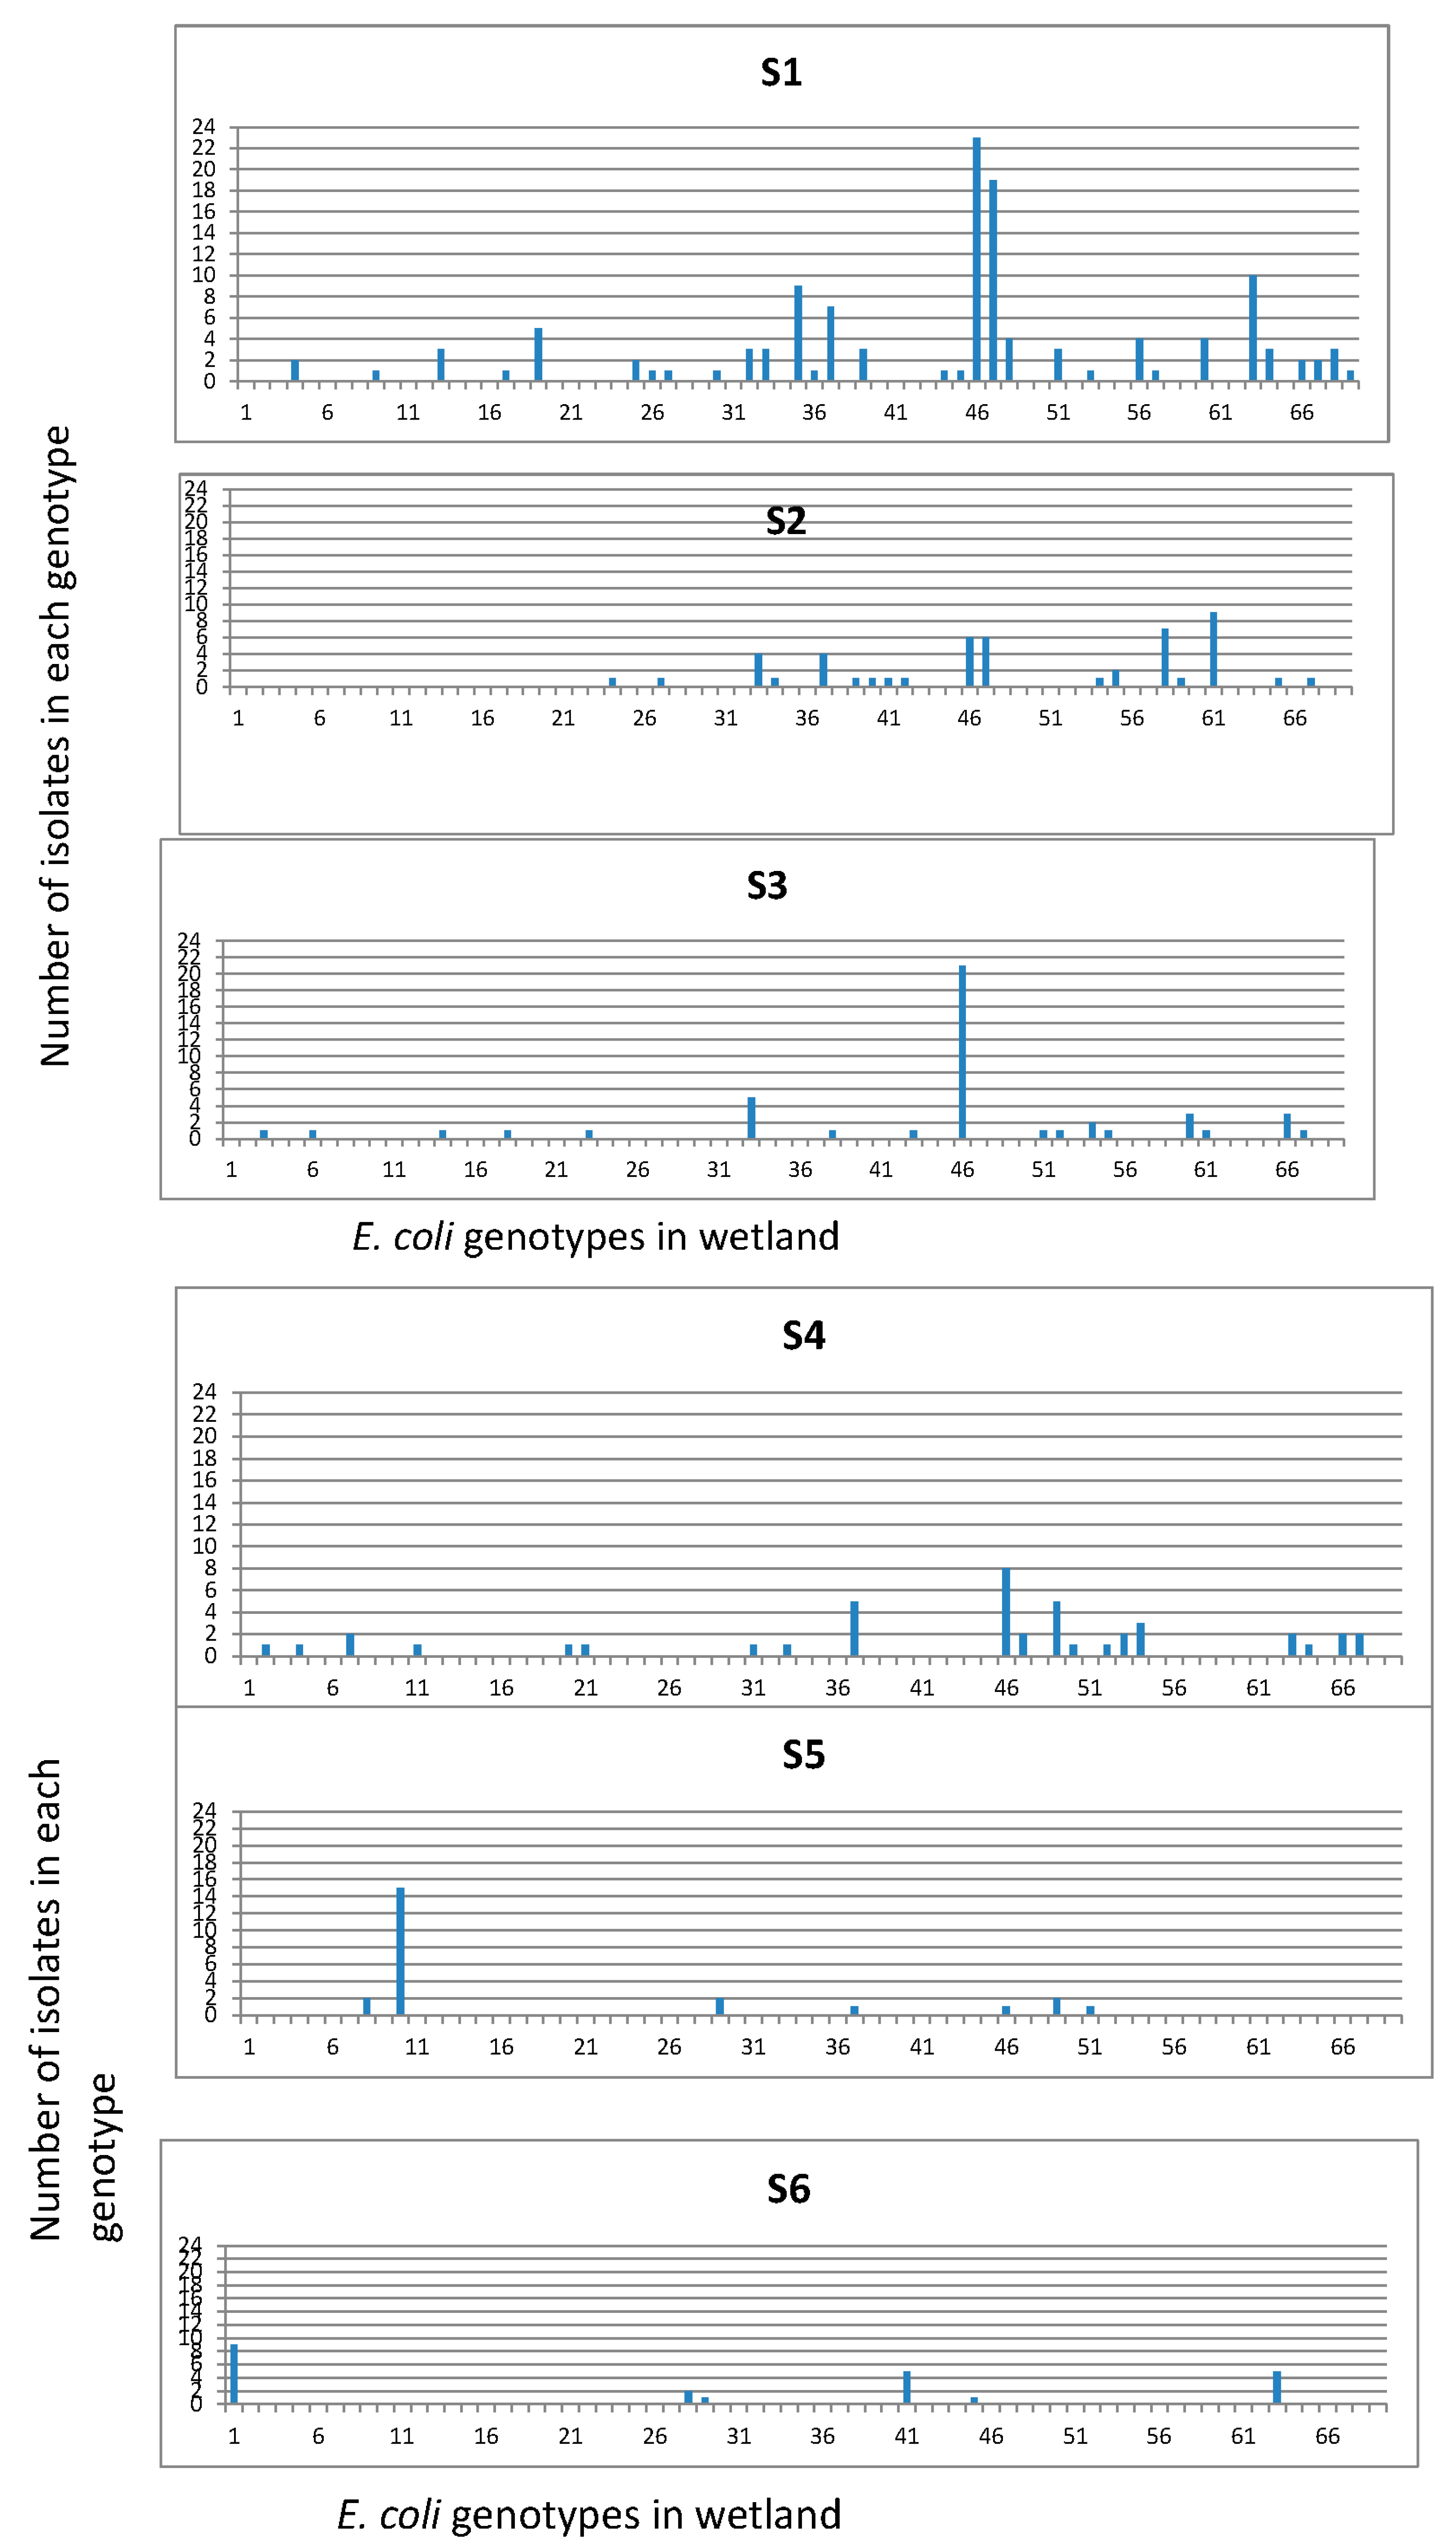
Isolates were grouped into 69 REP-PCR unique genotypes (Figure 4) with a Shannon diversity index (H′) of 3.231 (Table 2). The population comprised only three genotypes clustering more than 20 isolates, while 66 genotypes clustered between 2 and 19 isolates. The three dominant genotypes were consistently found at each sampling site and in every sampling month. The distribution of genotypes among the sampling sites and their detection frequencies, i.e., number of isolates per genotype at different sites were determined (Figure 5). The frequencies of obtaining a unique E. coli genotype, as indicated by ratios of genotypes vs. isolates (Table 3), were 0.23 for isolates from manure (S1), 0.31 for isolates from primary lagoon (S2), 0.30 for secondary lagoon isolates (S3), 0.42 for storage tank isolates (S4), 0.29 for continuous wetland influent isolates (S5), 0.20 for continuous wetland effluent isolates (S6), 0.27 for storage pond isolates (S7), and 0.15 for the final effluent isolates (S8).
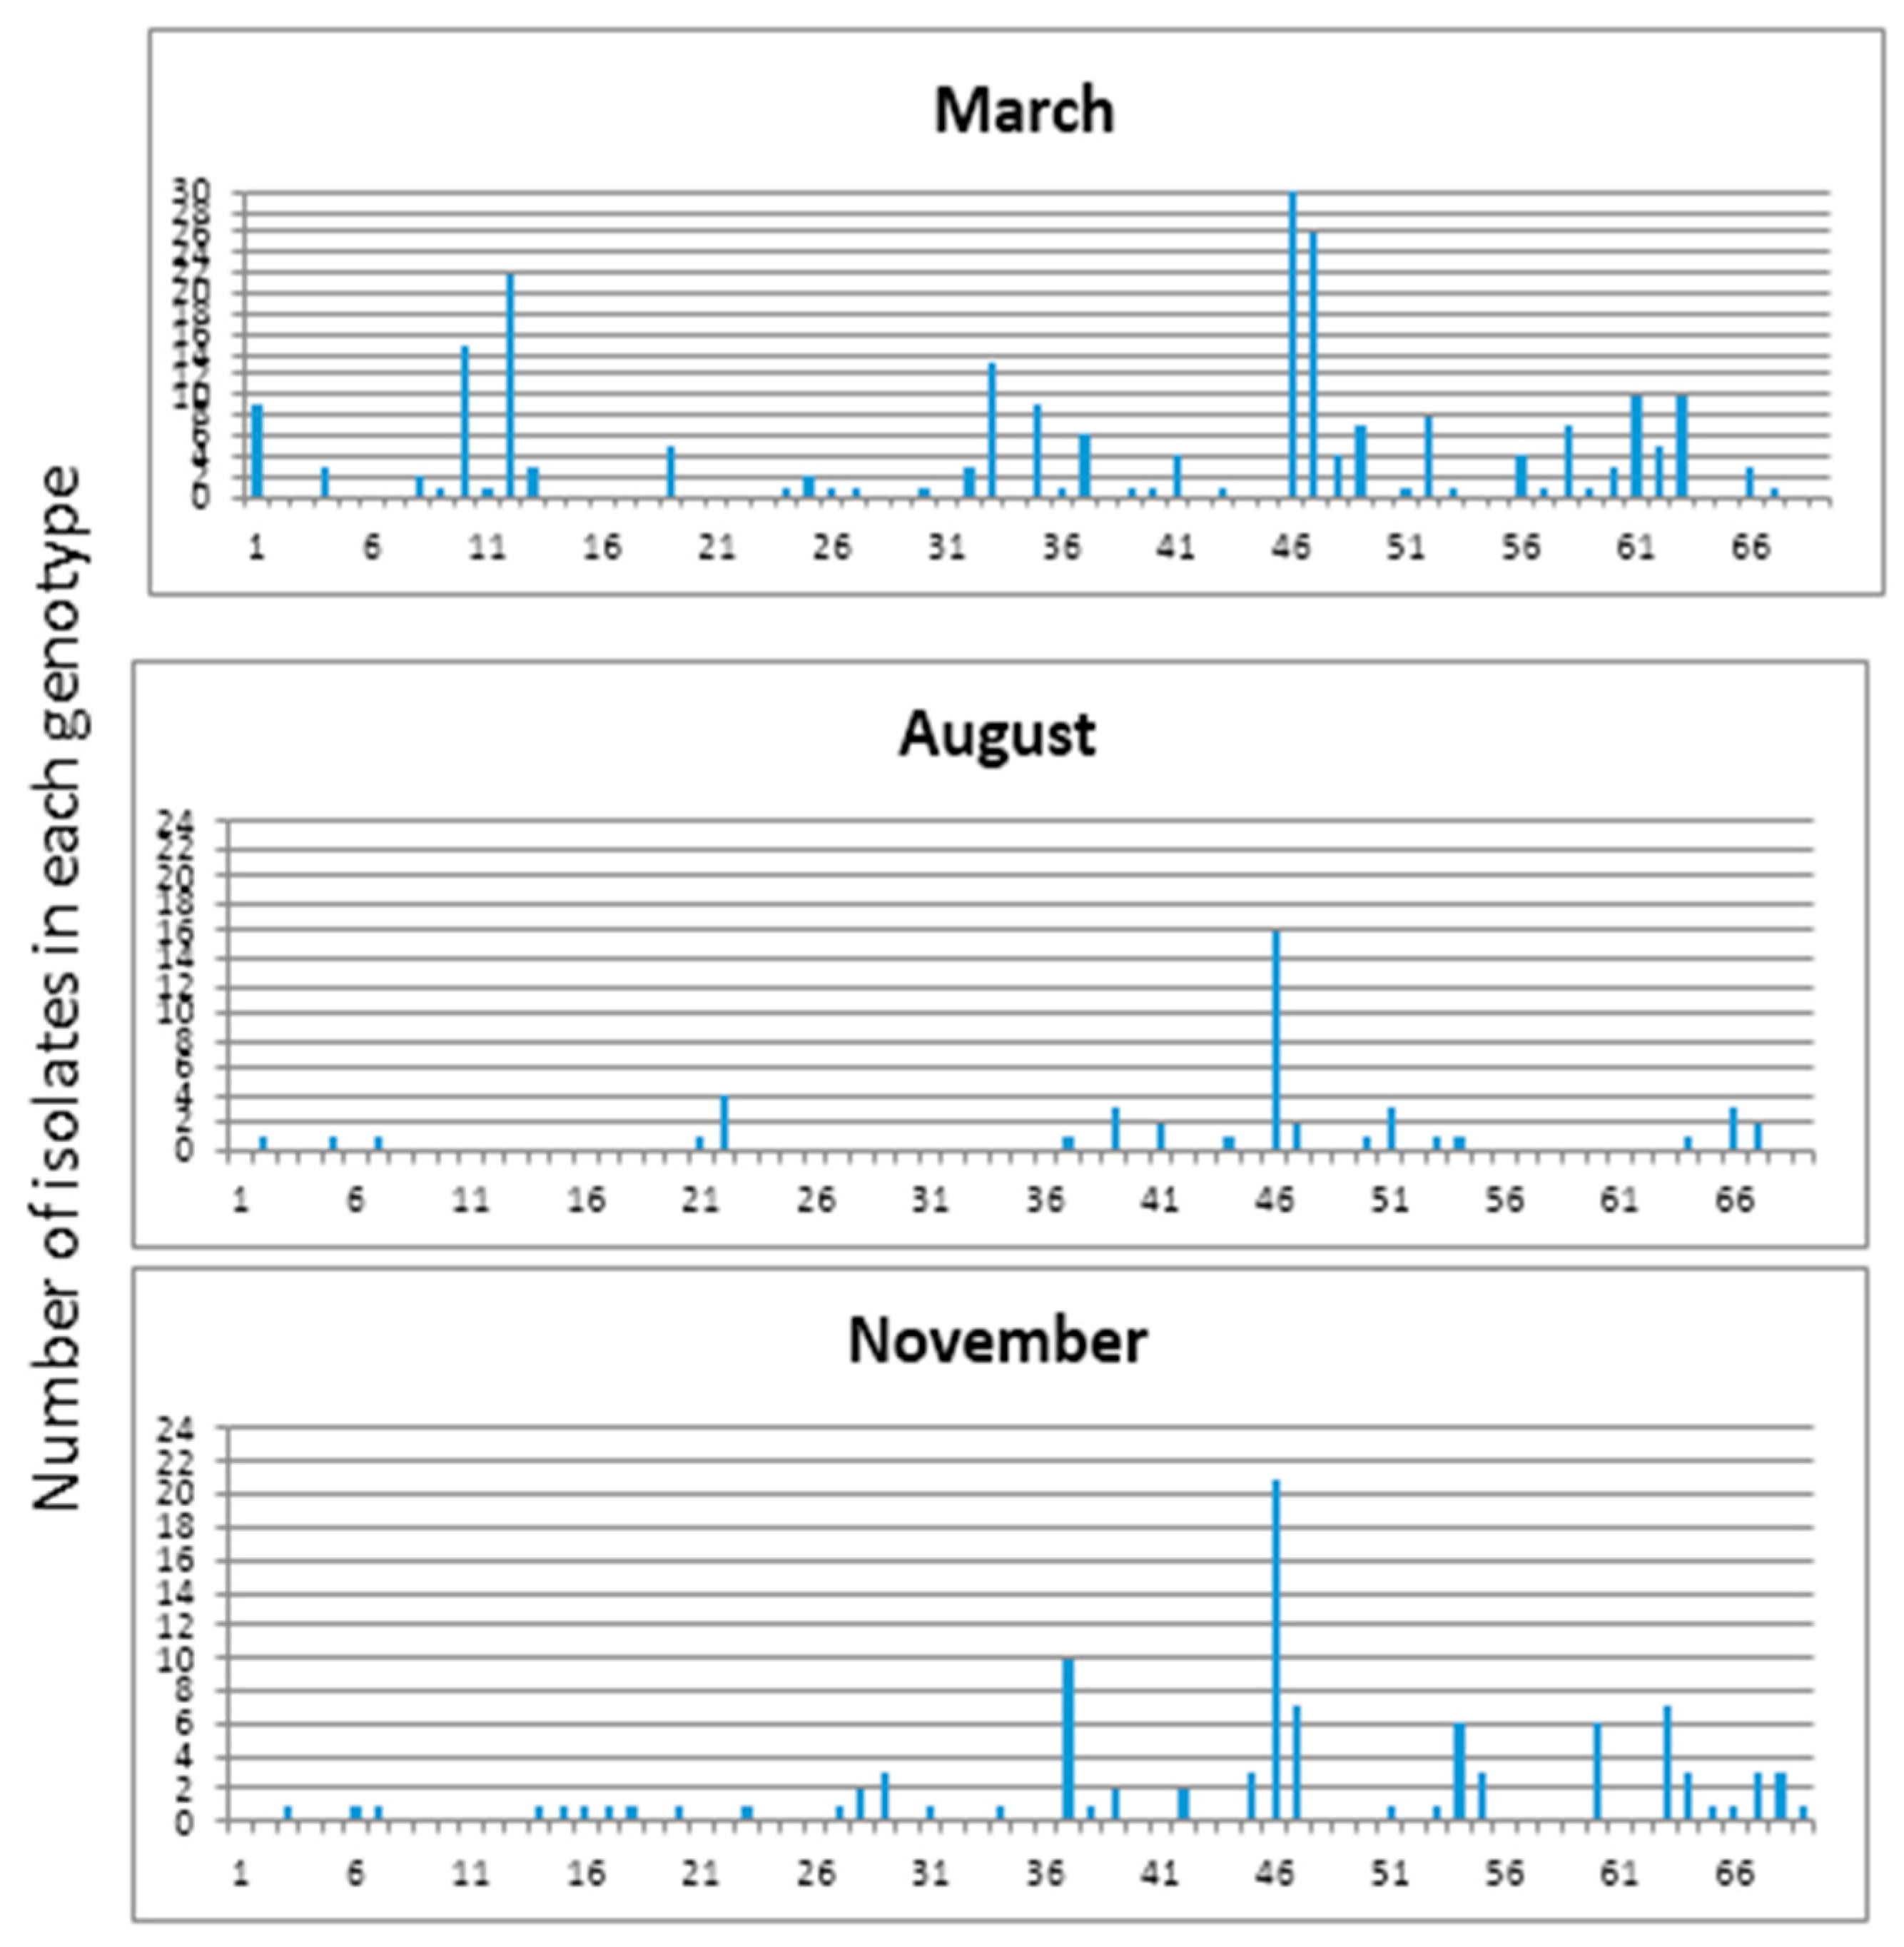
E. coli isolates collected during March, August, and November from manure and wetland effluent showed temporal variation based on REP-PCR (Figure 6 Unique E. coli genotype frequencies obtained in the study were 0.16, 0.28 and 0.30 for isolates collected in March, August, and November, respectively. In March 247 isolates with 40 unique genotypes were obtained with genetic diversity (H′) of 3.173. Whereas in November only 113 isolates with 34 unique genotypes, and H′ of 3.019 were detected. However, in August only 61 isolates with 18 unique genotypes and a Shannon diversity index (H′) of 2.335 could be detected. (Table 3). It should be noted that each genotype in March contained higher numbers of isolates than what were observed in August and November indicating fewer clonal populations in March.
4. Discussion
The analysis of virulence factors did not show the presence of the typical ETEC virulent genes; elt, estB, and faeG. However, many E. coli strains isolated carried heat-stable enterotoxin a and b (STa and STb) genes which are very common in ETEC (Table 1). Based on the analysis and confirmation tests, none of our isolates was classified as E. coli O157. Other studies have shown high prevalence of STa and STb genes from E. coli samples isolated from swine [20] and greater reduction of potentially pathogenic E. coli from waste water treatment [21]. Removal efficiencies of microbes from constructed wetlands have been shown to be based on the type of wetland plants employed [2,3].
Microorganisms in densities above certain levels in water can cause adverse effects, including death in humans and wildlife as a result of exposure. Adverse health effects in humans can be grouped into gastrointestinal, respiratory, eye, ear, nose, skin rashes, etc. E. coli counts were significantly (p = 0.01%) different among the three month flows. Others have reported the typical enteric bacteria removal between 1 and 3 log10 from constructed wetlands [22,23,24,25]. Data from this study agree with the above studies from the wetland described [5,6,19,22]. Other studies using the same wetland associated the decreased bacterial counts with spatial nutrient content differences in the wetland where the concentrations of TN, NH+4, TP and PO3−4 decreased from influent to effluent of the wetland [19,22]. We previously showed a 98% decrease in E. coli with subsurface constructed wetland, and this reduction was significantly correlated with TN, NH+4, TP and PO3−4 decreased from influent to effluent in the wetland [2]. Although the number of swine was relatively low in this wetland, it provided us with the opportunity to study E. coli population dynamics from wetland cell to wetland cell and to document which section of the wetlands are more efficient in waste removal. The overall results could be partly explained that N and P are essential nutrients for bacterial growth and the decrease in these nutrients probably had a role in E. coli population decrease. Another reason may be due to die-off following removal from swine gut and exposure to environment, together with predation by filter feeders, and entrapment within plant/soil matrix of CW. The reduction in E. coli population also is in agreement with microbial community study from the same wetland [8] that showed that community structures from wetland samples associated with the swine house (S1) and lagoons (S2, S3) were significantly different (p = 0.0001) from storage tanks (S4), wetland cells effluent (S5), storage pond (S7), and the final effluent (S8). The most significant reduction started occurring in mid mash wetland cells (S5) where there were likely interactions of microbial activities with wetland plants. In this study, the concentration of E. coli in the final effluent (S8) was significantly lower especially during. Therefore, the trend seems to follow a similar pattern in bacterial removal whether at the single isolate level or at the microbial community level.
In this study, we found that E. coli populations between the wetland influent and effluent were significantly reduced. The reduction in bacterial counts by constructed wetland means much lower bacteria loadings to the environment [26] and may result in significant reduction of bacterial counts [27]. Constructed wetlands are used to reduce bacterial concentrations from possible transfer from storage ponds through irrigation water to agricultural fields or to drinking water sources. The great threat of bacterial contamination to drinking water may be the high concentrations of such bacteria in the source water that may result in the transfer of genetic elements from nonpathogenic to pathogenic strains. Pathogens with increased resistance to different antimicrobials may easily be transported from animal manure to rivers during through surface runoff or even to groundwater through leaching [28]. In developing countries the water from such river may be a source for domestic water supply. It has also been reported that changes in E. coli composition in surface water could be a consequence of seasonal changes with summer populations derived from numerous sources than winter populations [14,29]. E. coli population can also undergo changes during the lifetime of the animals due to changes in diet which may also vary with seasons. In this study, higher diversity was observed in summer and autumn months (August and November) than during the winter month (March), as these changes could be related to changes in diet during this period.
In this study, March samples showed higher numbers of isolates in each genotype than in August and November (Figure 5). This may be due to higher numbers of clonal populations during the winter months. Changes in E. coli diversity associated with seasons had been well documented in water communities [13,30,31], but little has been done in constructed wetlands. In this study, many environmental E. coli isolates were systematically obtained from the wetlands to study the spatial and temporal variations and overall genotypic diversities of E. coli from different sections of the wetlands. Temporally, the genotypic compositions of E. coli for the three sampling times based on REP-PCR were very different from our previous study based on BOX-AIR PCR [22]. Individual water samples obtained from each sampling time contained several dominant genotypes with high abundances and many less dominant genotypes with lower abundances.
Interestingly, higher numbers of isolates were observed in each genotype from mid marsh to the final effluent. This suggests fewer dominant population of E. coli from the mid marsh to the final effluent. The same dominant E. coli genotypes were also observed at different locations in rivers affected by agricultural [14] and urban [32] (McLellan 2004) land uses. The main reason for some of the dominant genotype may be the presence of a dominant point fecal source from the constructed wetland originating from the swine fecal materials.
5. Conclusions
In summary, the significant reduction of E. coli between influent and effluent water in this study may be due to the reduction of different nutrients in different sections of the wetland or die off in the environment. The reduction of E. coli is a significant example of the potential reduction of pathogens that may enter surface water via animal waste. The removal of the main pollutants from the swine waste would have a beneficial impact on the surface and groundwater in many rural areas of North Carolina with swine production, and in turn, would benefit the quality of water leading into rivers. The findings from this study and similar studies will aid with protecting our surface and ground waters and may reduce the outbreak of severe infections, because most of these diseases are caused by typical water related pathogens. Therefore, the use of continuous flow-constructed wetland for water quality improvements must be encouraged at all levels. This is critical especially in developing countries where resources are limited, and pollution from fecal material is high.
Supplementary Materials
The following are available online at https://0-www-mdpi-com.brum.beds.ac.uk/1660-4601/15/7/1369/s1.
Author Contributions
Conceptualization, A.M.I. and S.E.M.; Methodology, A.M.I.; Software, A.M.I.; Validation, A.M.I. and S.E.M.; Formal Analysis, A.M.I.; Investigation, A.M.I.; Resources, A.M.I. and S.E.M.; Data Curation, A.M.I. and S.E.M.; Writing-Original Draft Preparation, A.M.I.; Writing-Review and Editing, A.M.I. and S.E.M.; Project Administration, A.M.I.; Funding Acquisition, A.M.I.
Funding
This research was funded by USDA-ARS (NP 212: 801-2036-505-00138).
Acknowledgments
This research was supported by the 212 Manure and Byproduct Utilization Project of the USDA-ARS. Mention of trademark or proprietary products in this manuscript does not constitute a guarantee or warranty of the product by the USDA and does not imply its approval to the exclusion of other products that may also be suitable. We thank G.B. Reddy for providing experimental site and initial conceptualization of the study.
Conflicts of Interest
The authors declare no conflict of interest.
References
- Kadlec, R.H.; Knight, R.L. Treatment Wetlands; Lewis Publishers: New York, NY, USA, 1996. [Google Scholar]
- Ibekwe, A.M.; Grieve, C.M.; Lyon, S.R. Characterization of microbial communities and composition in constructed dairy wetland wastewater effluent. Appl. Environ. Microbiol. 2003, 69, 5060–5069. [Google Scholar] [CrossRef] [PubMed]
- Ibekwe, A.M.; Lyon, S.R.; Leddy, M.; Jacobson-Meyer, M. Impact of plant density and microbial composition on water quality from a free water surface constructed wetlands. J. Appl. Microbiol. 2007, 102, 921–936. [Google Scholar] [CrossRef] [PubMed]
- Casteel, M.J.; Sobsey, M.D.; Mueller, J.P. Fecal contamination of agricultural soils before and after hurricane-associated flooding in North Carolina. J. Environ. Sci. Health Part A Toxic/Hazard. Subst. Environ. Eng. 2006, 41, 173–184. [Google Scholar] [CrossRef] [PubMed]
- Reddy, G.B.; Hunt, R.G.; Phillips, R.; Stone, K.; Grubbs, A. Treatment of swine wastewater in marsh-pond-marsh constructed wetlands. Water Sci. Technol. 2001, 44, 545–550. [Google Scholar] [CrossRef] [PubMed]
- Dong, X.; Reddy, G.B. Soil bacterial communities in constructed wetlands treated with swine wastewater using PCR-DGGE technique. Bioresour. Technol. 2010, 101, 11541–11549. [Google Scholar] [CrossRef] [PubMed]
- Ishii, S.; Sadowsky, M.J. Escherichia coli in the environment: Implication for water quality and human health. Microbes Environ. 2008, 23, 101–108. [Google Scholar] [CrossRef] [PubMed]
- Ibekwe, A.M.; Ma, J.; Murinda, S.; Reddy, G.B. Microbial diversity in continuous flow constructed wetland for the treatment of swine waste. Hydrol. Curr. Res. 2017, 8, 277. [Google Scholar] [CrossRef]
- Eaton, A.D.; Clesceri, L.S.; Greenberg, A.E.; Franson, M.A.H. Standard Method for Examination of Water and Wastewater; American Public Health Association: Washington, DC, USA, 1998. [Google Scholar]
- Paton, J.C.; Paton, A.W. Pathogenesis and diagnosis of Shiga toxin-producing Escherichia coli infections. Clin. Microbiol. Rev. 1998, 11, 450–479. [Google Scholar] [PubMed]
- DebRoy, C.; Maddox, C.W. Identification of virulence attributes of gastrointestinal Escherichia coli isolates of veterinary significance. Anim. Health Res. Rev 2001, 1, 129–140. [Google Scholar] [CrossRef]
- Dombek, P.E.; Johnson, L.K.; Zimmerley, S.T.; Sadowsky, M.J. Use of repetitive DNA sequences and the PCR to differentiate Escherichia coli isolates from human and animal sources. Appl. Environ. Microbiol. 2000, 66, 2572–2577. [Google Scholar] [CrossRef] [PubMed]
- Goto, K.; Yan, T. Genotypic diversity of Escherichia coli in the water and soil of tropical watersheds in Hawaii. Appl. Environ. Microbiol. 2011, 77, 3988–3997. [Google Scholar] [CrossRef] [PubMed]
- Lyautey, E.; Lu, Z.; Lapen, D.R.; Wilkes, G.; Scott, A.; Berkers, T.; Edge, T.A.; Topp, E. Distribution and diversity of Escherichia coli populations in the South Nation river drainage basin, eastern Ontario, Canada. Appl. Environ. Microbiol. 2010, 76, 1486–1496. [Google Scholar] [CrossRef] [PubMed]
- Rademaker, J.L.W.; de Bruijn, F.J. Characterization and classification of microbes by rep-PCR genomic fingerprinting and computer-assisted pattern analysis. In DNA Markers: Protocols, Applications, and Overviews; Caetano-Anollés, G., Gresshoff, P.M., Eds.; Wiley and Sons: New York, NY, USA, 1997; pp. 151–171. [Google Scholar]
- Stern, M.J.; Ames, G.F.L.; Smith, N.H.; Robinson, E.C.; Higgins, C.F. Repetitive extragenic palindromic sequences: A major component of the bacterial genome. Cell 1984, 37, 1015–1026. [Google Scholar] [CrossRef]
- SAS Institute Inc. SAS/STAT User’s Guide, Release 9.1; SAS Institute Inc.: Cary, NC, USA, 2009. [Google Scholar]
- Chandran, A.; Mazumder, A. Pathogenic potential, genetic diversity, and population structure of Escherichia coli strains isolated from a forest-dominated watershed (Comox Lake) in British Columbia, Canada. Appl. Environ. Microbiol. 2015, 81, 1788–1798. [Google Scholar] [CrossRef] [PubMed]
- Poach, M.E.; Hunt, P.G.; Reddy, G.B.; Stone, K.C.; Johnson, M.H.; Grubbs, A. Swine wastewater treatment by marsh-pond-marsh constructed wetlands under varying nitrogen loads. Ecol. Eng. 2004, 23, 165–175. [Google Scholar] [CrossRef]
- Chapman, T.A.; Wu, X.Y.; Barchia, I.; Bettelheim, K.A.; Driesen, S.; Trott, D.; Wilson, M.; Chin, J.J. Comparison of virulence gene profiles of Escherichia coli strains isolated from healthy and diarrheic swine. Appl. Environ. Microbiol. 2006, 72, 4782–4795. [Google Scholar] [CrossRef] [PubMed] [Green Version]
- Frigon, D.; Biswal, B.K.; Masson, A.; Gehr, R. Biological and physicochemical wastewater treatment processes reduce the prevalence of virulent Escherichia coli. Appl. Environ. Microbiol. 2013, 79, 835–844. [Google Scholar] [CrossRef] [PubMed]
- Ibekwe, A.M.; Murinda, S.E.; DebRoy, C.; Reddy, G.B. Potential pathogens, antimicrobial patterns and genotypic diversity of Escherichia coli isolates in constructed wetlands treating swine wastewater. FEMS Microbiol. Ecol. 2016, 92. [Google Scholar] [CrossRef]
- Graves, A.K.; Weaver, R.W. Characterization of enterococci populations collected from a subsurface flow constructed wetland. J. Appl. Microbiol. 2010, 108, 1226–1234. [Google Scholar] [CrossRef] [PubMed] [Green Version]
- Steer, D.; Fraser, L.; Boddy, J.; Seibert, B. Efficiency of small constructed wetlands for subsurface treatment of single-family domestic effluent. Ecol. Eng. 2002, 18, 429–440. [Google Scholar] [CrossRef] [Green Version]
- Vymazal, J.; Kropfelova, L. Wastewater Treatment in Constructed Wetlands with Horizontal Sub-Surface Flow; Springer: Dordrecht, The Netherlands, 2008. [Google Scholar]
- Sidrach-Cardona, R.; Bécares, E. Fecal indicator bacteria resistance to antibiotics in experimental constructed wetlands. Ecol. Eng. 2013, 50, 107–111. [Google Scholar] [CrossRef]
- Call, D.R.; Borucki, M.K.; Loge, F.J. Detection of bacterial pathogens in environmental samples using DNA microarrays. J. Microbiol. Methods 2003, 53, 235–243. [Google Scholar] [CrossRef]
- Aarestrup, F.M.; Kruse, H.; Tast, E.; Hammerum, A.M.; Jensen, L.B. Associations between the use of antimicrobial agents for growth promotion and the occurrence of resistance among Enterococcus faecium from broilers and pigs in Denmark, Finland, and Norway. Microb. Drug Resist. 2000, 6, 63–70. [Google Scholar] [CrossRef] [PubMed]
- Whitman, R.L.; Przybyla-Kelly, K.; Shively, A.D.; Nevers, M.B.; Byappanahalli, M.N. Sunlight, season, snowmelt, storm, and source affect E. coli populations in an artificially ponded stream. Sci. Total Environ. 2008, 390, 448–455. [Google Scholar] [CrossRef] [PubMed]
- Duriez, P.; Topp, E. Temporal dynamics and impact of manure storage on antibiotic resistance patterns and population structure of Escherichia coli isolates from a commercial farm. Appl. Environ. Microbiol. 2007, 73, 5486–5493. [Google Scholar] [CrossRef] [PubMed]
- Russell, J.B.; Diez-Gonzalez, F.; Jarvis, G.N. Effects of diet shifts on Escherichia coli in cattle. J. Dairy Sci. 2000, 83, 863–873. [Google Scholar] [CrossRef]
- McLellan, S.L. Genetic diversity of Escherichia coli isolated from urban rivers and beach water. Appl. Environ. Microbiol. 2004, 70, 4658–4665. [Google Scholar] [CrossRef] [PubMed]
Figure 1.
E. coli population in March, August, and November in wetlands. Symbols on the X-axis are effluent from swine house (S1), two-stage anaerobic lagoon system consisting of a primary lagoon 1 (S2) with overflow into a secondary lagoon 2 (S3) that flows to the storage tank (S4), continuous wetland cell influent (S5), continuous wetland cell effluent (S6), storage pond (S7), final effluent samples (S8) where it was recycled for flushing of the swine production facility and for land application). All samples were collected in duplicate.

Figure 2.
Nutrient removal in wetland samples collected in duplicate.
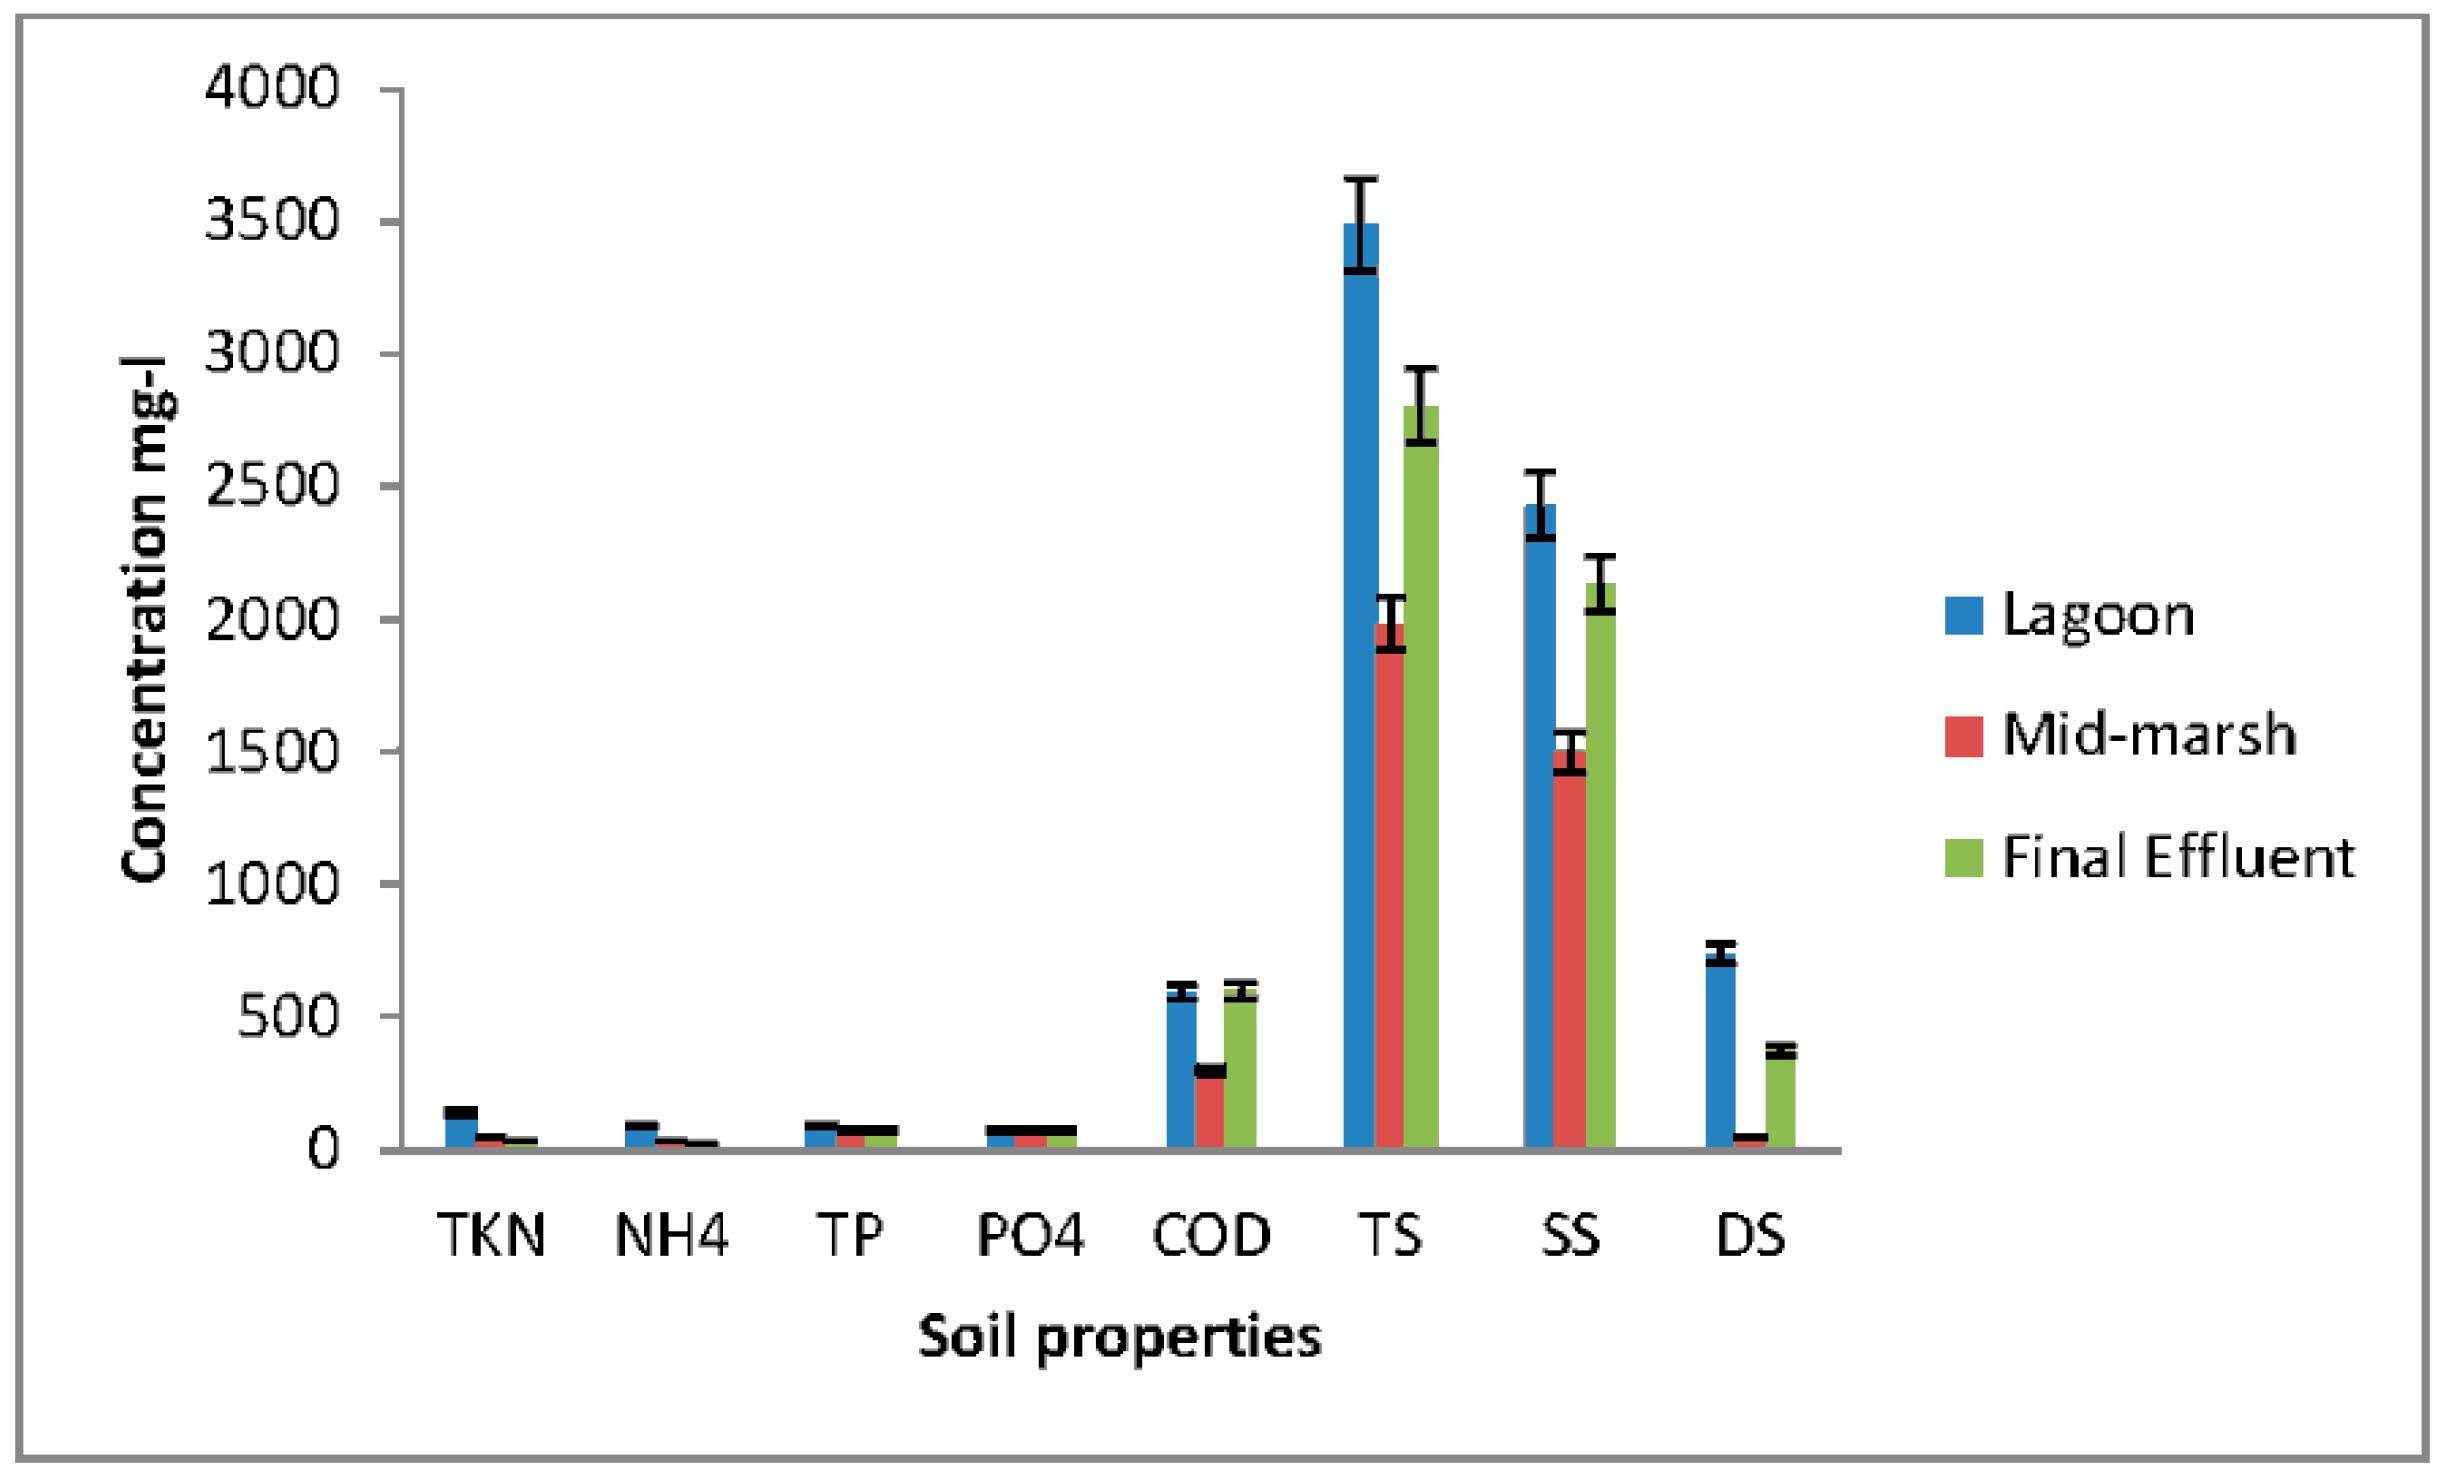
Figure 3.
Dendrogram showing the genetic relatedness of E. coli from wetland based on their rep-PCR DNA fingerprints as an example. The red vertical line indicates the cutoff value for identifying unique genotypes.
Figure 3.
Dendrogram showing the genetic relatedness of E. coli from wetland based on their rep-PCR DNA fingerprints as an example. The red vertical line indicates the cutoff value for identifying unique genotypes.
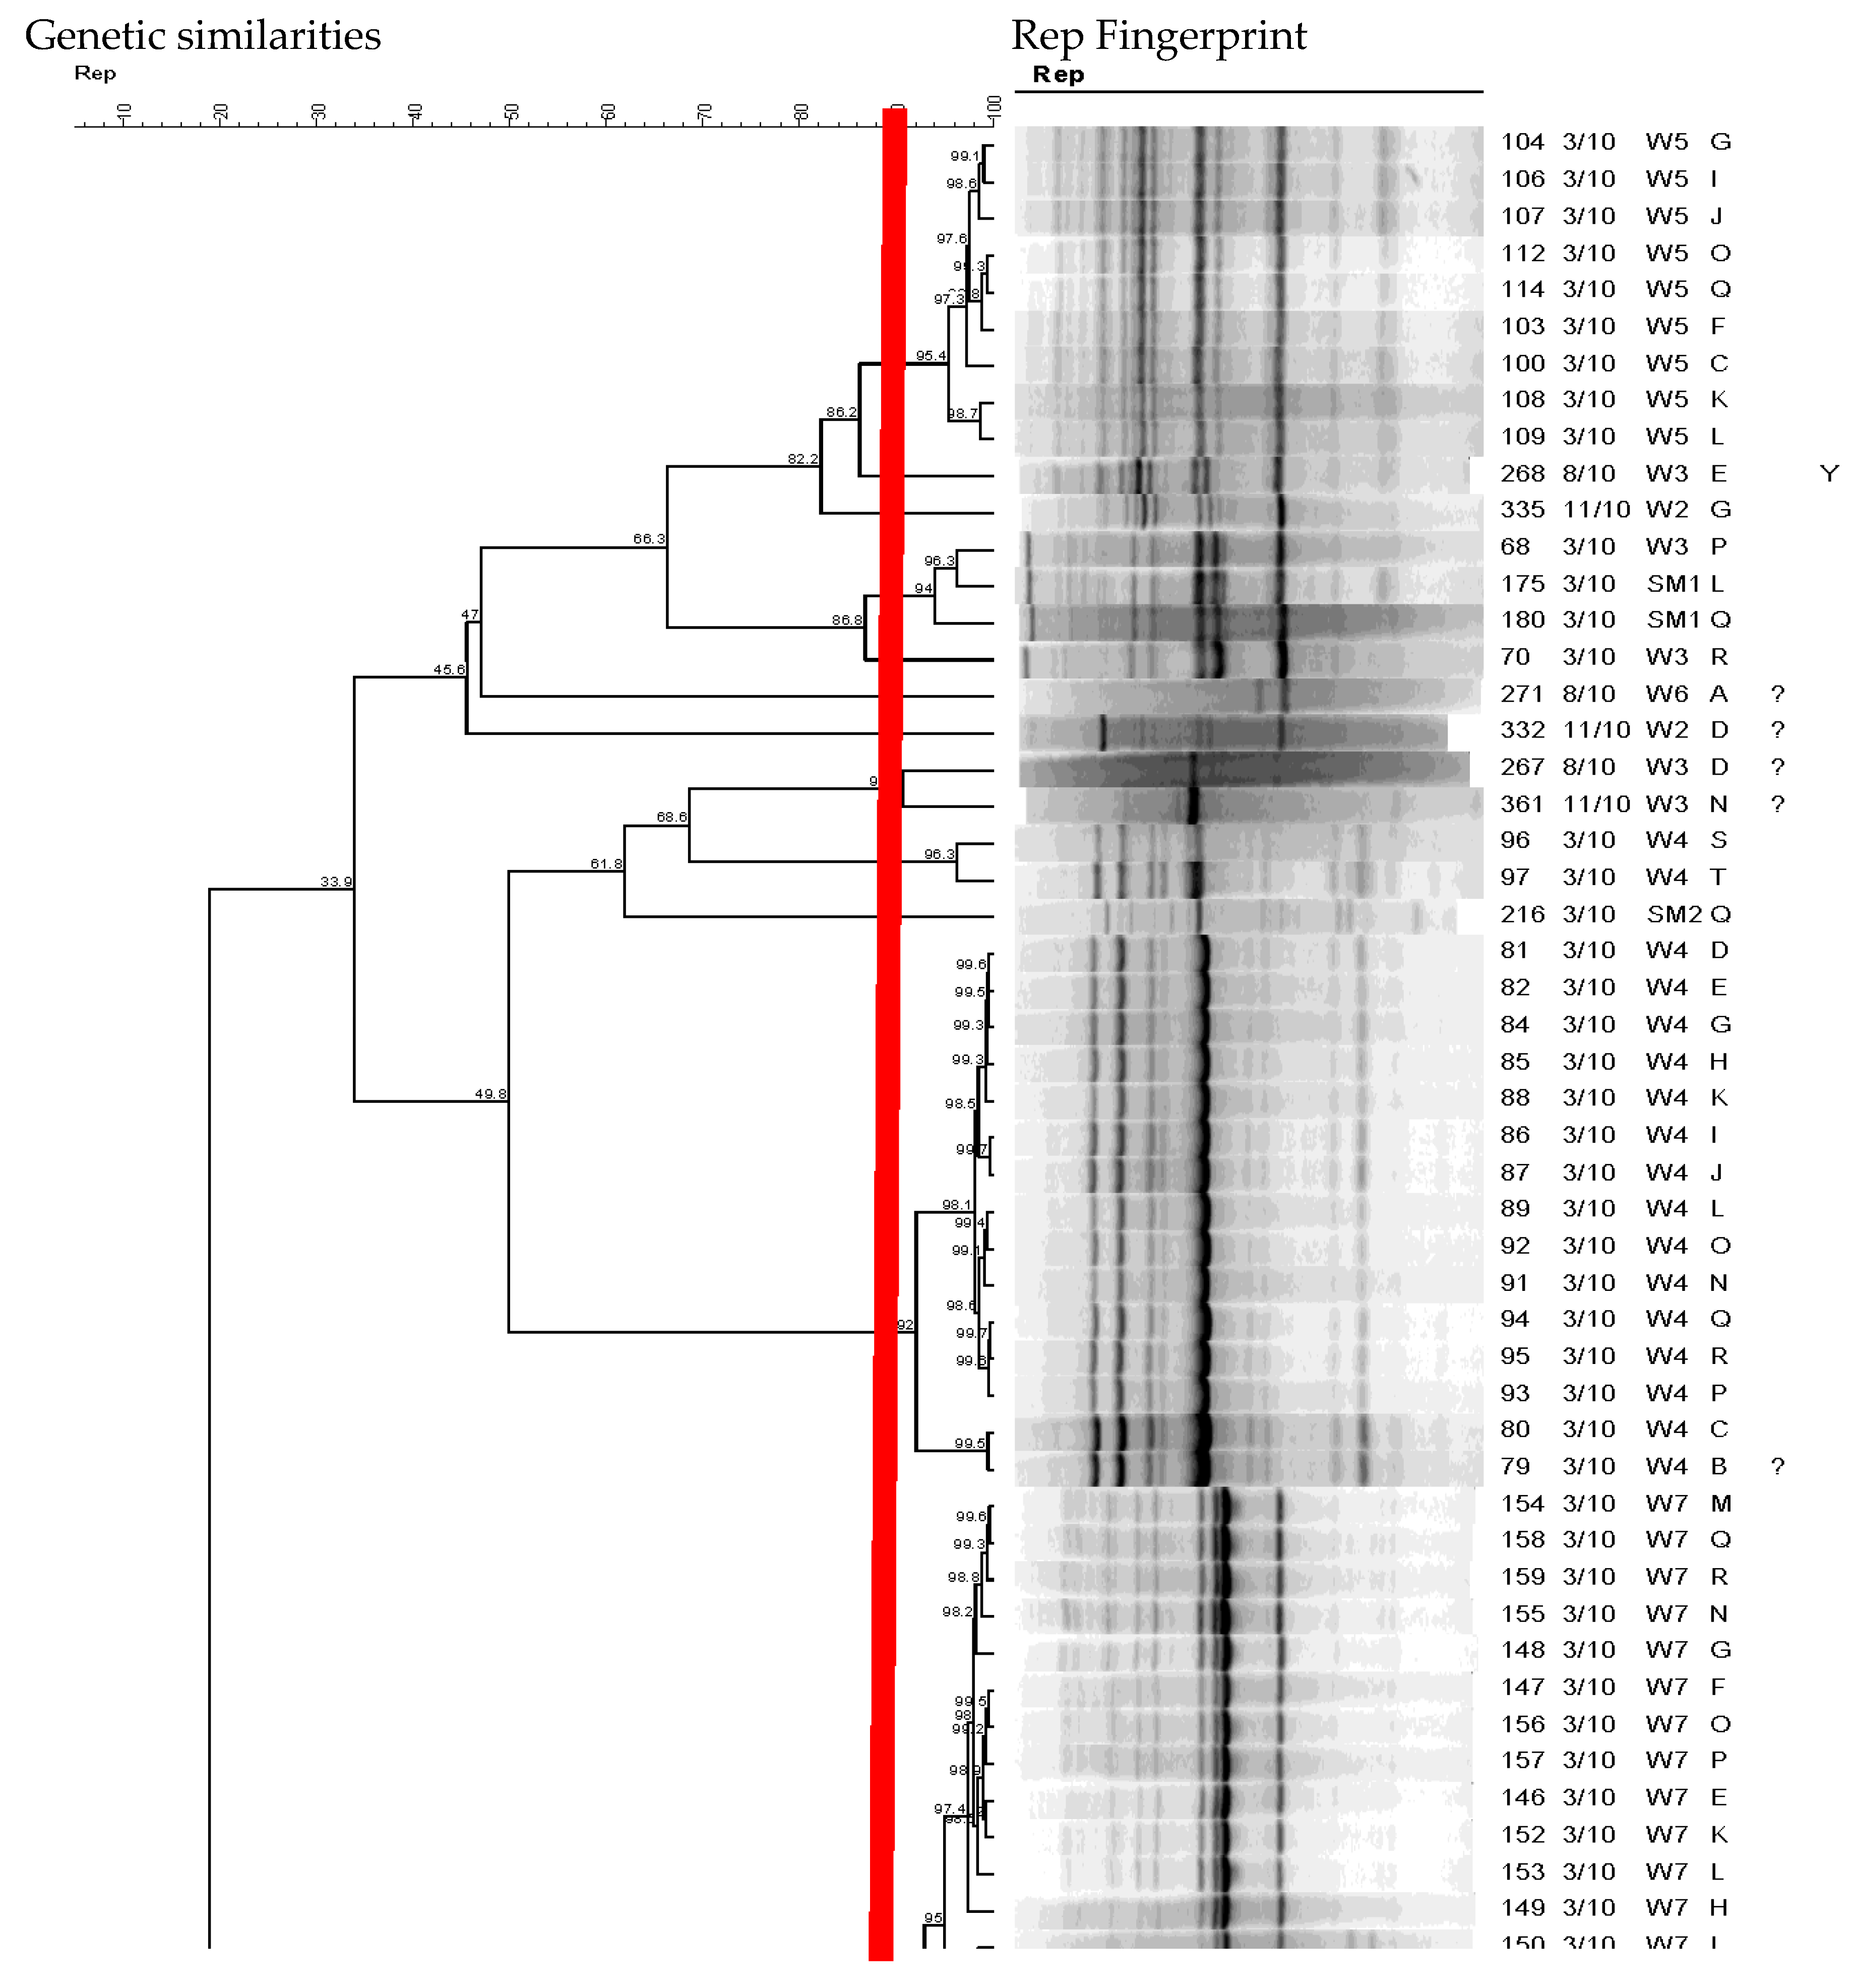
Figure 4.
E. coli isolates (421) from swine wetland were analyzed by REP-PCR DNA fingerprint and then grouped into 69 unique genotypes based on cluster analysis. The distribution of genotypes among the sampling sites and their detection frequencies, i.e., number of isolates per genotype at different sites.
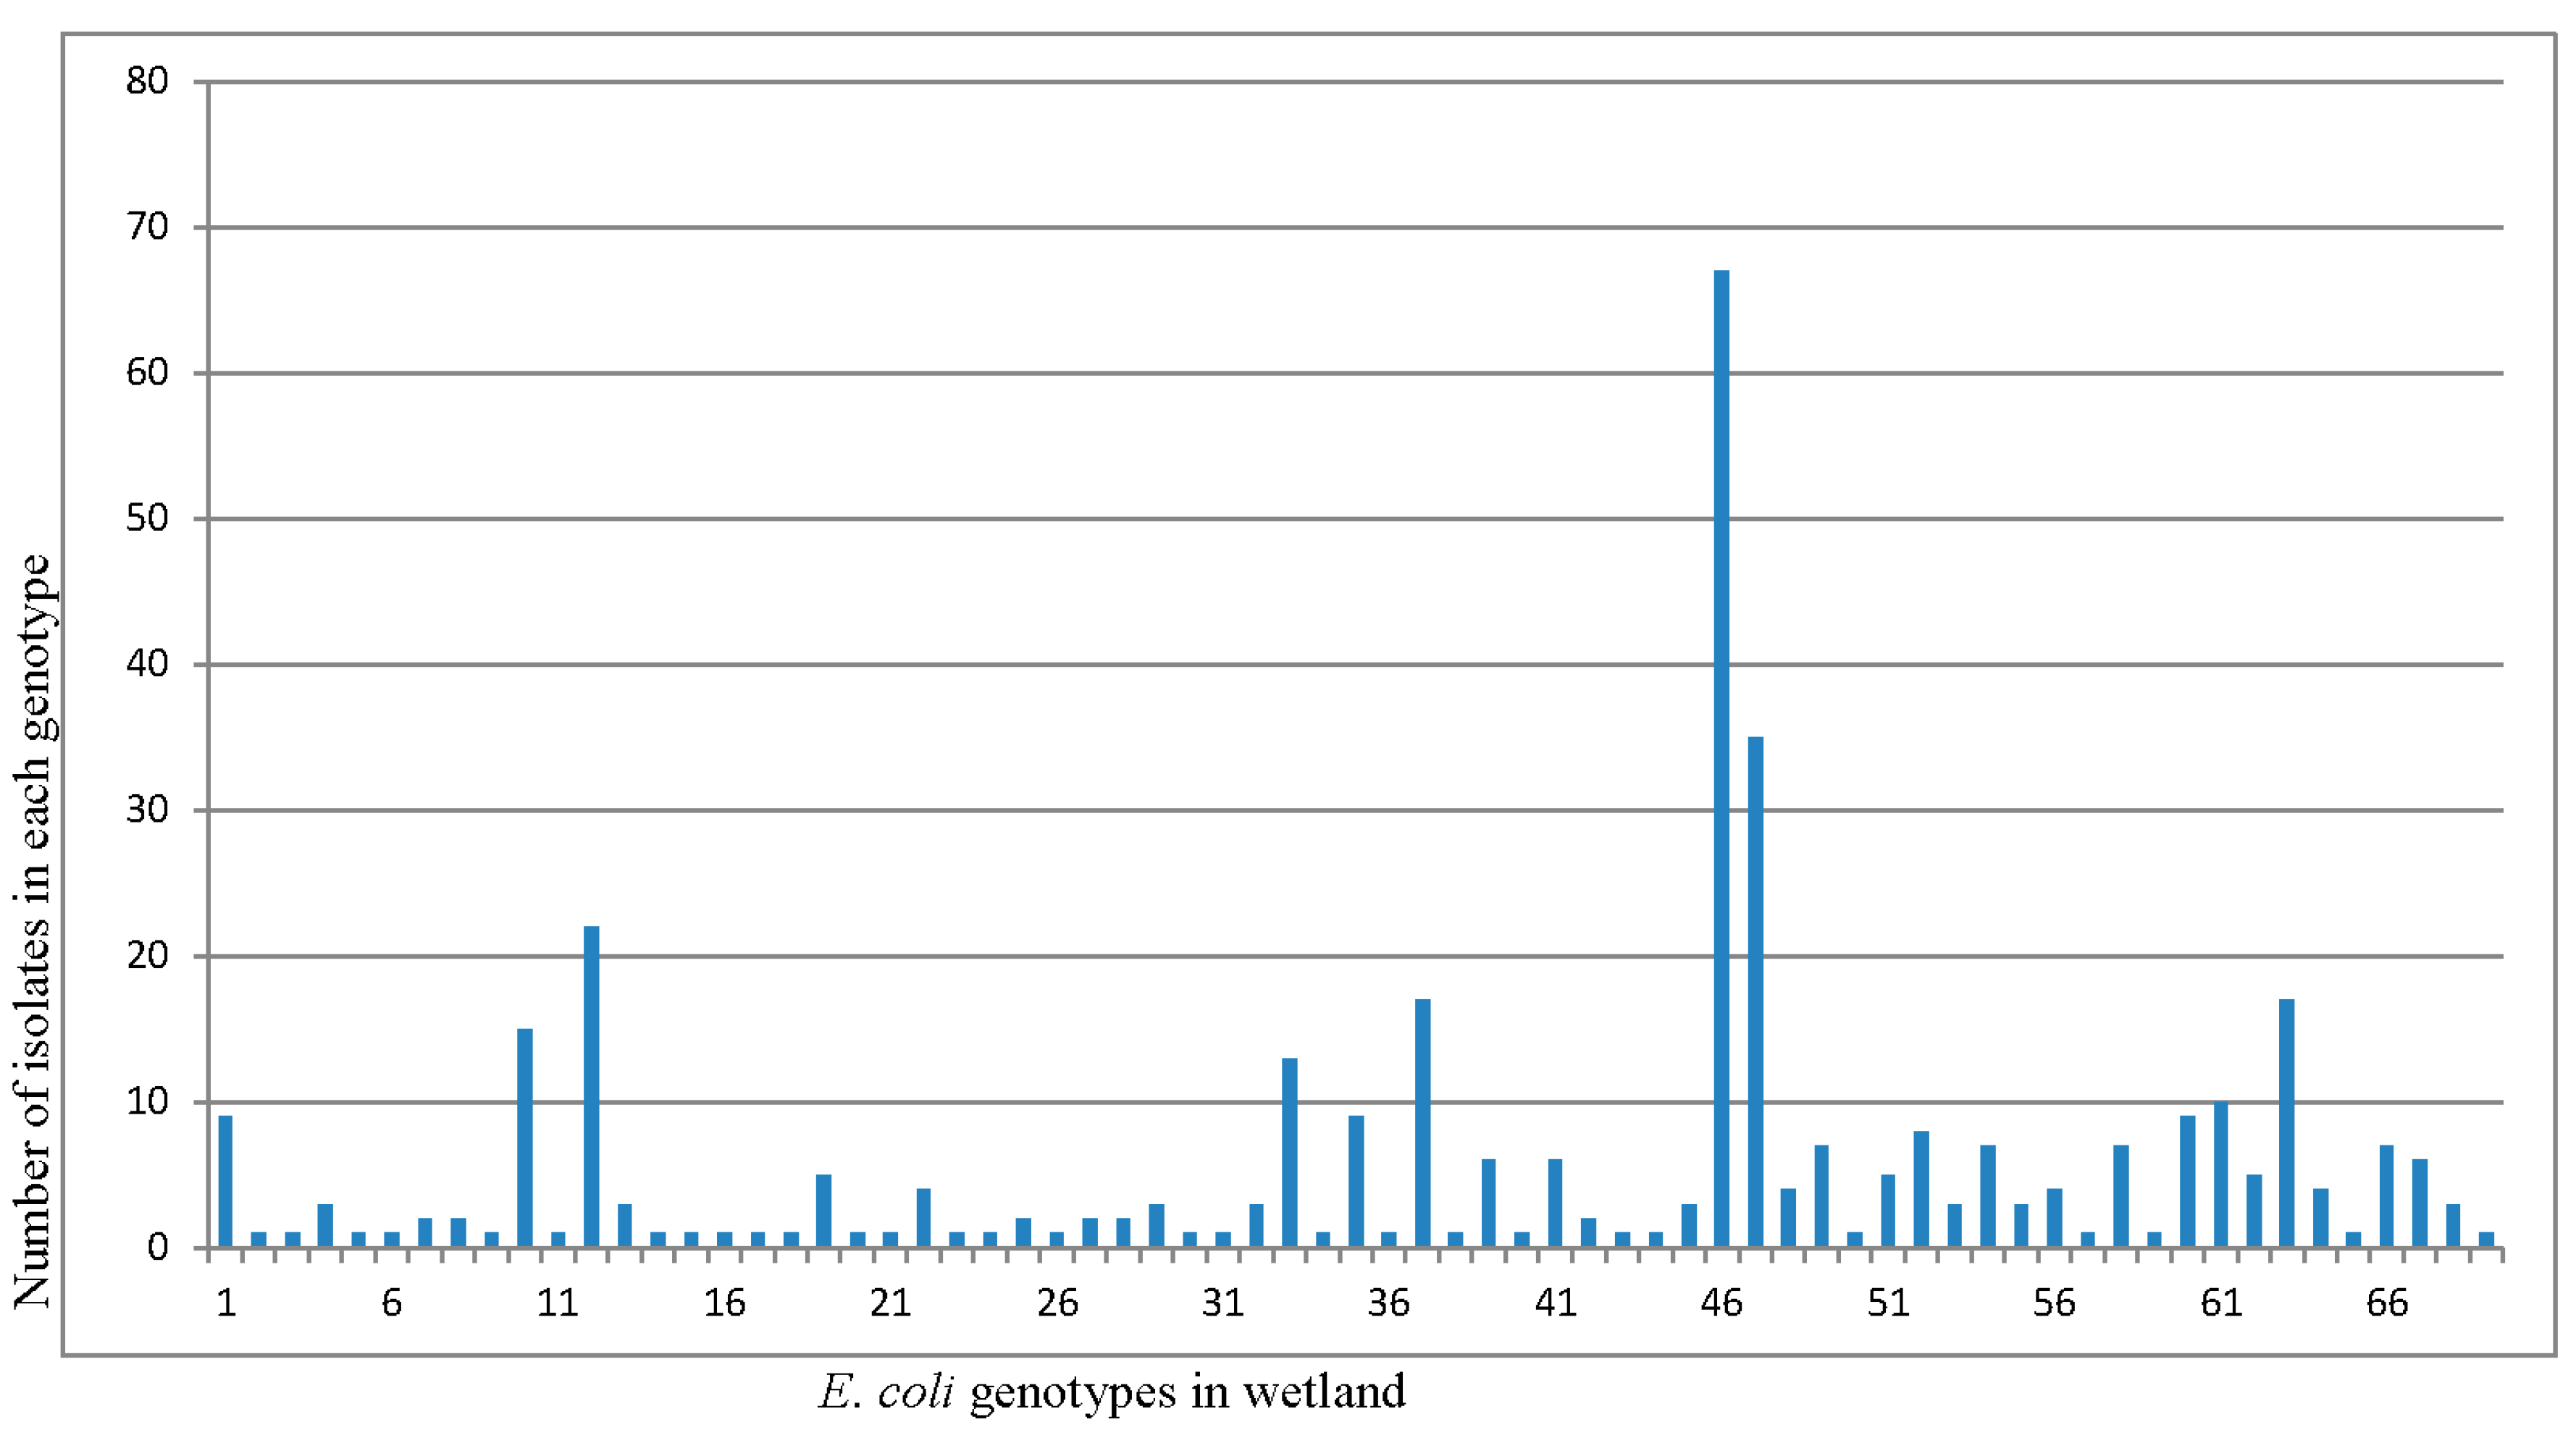
Figure 5.
E. coli genotypes based on REP PCR distributions. Symbols on the X-axis are effluent from swine house (S1), two-stage anaerobic lagoon system consisting of a primary lagoon 1 (S2) with overflow into a secondary lagoon 2 (S3) that flows to the storage tank (S4), continuous wetland cell influent (S5), continuous wetland cell effluent (S6), storage pond (S7), final effluent samples (S8) where it was recycled for flushing of the swine production facility and for land application.

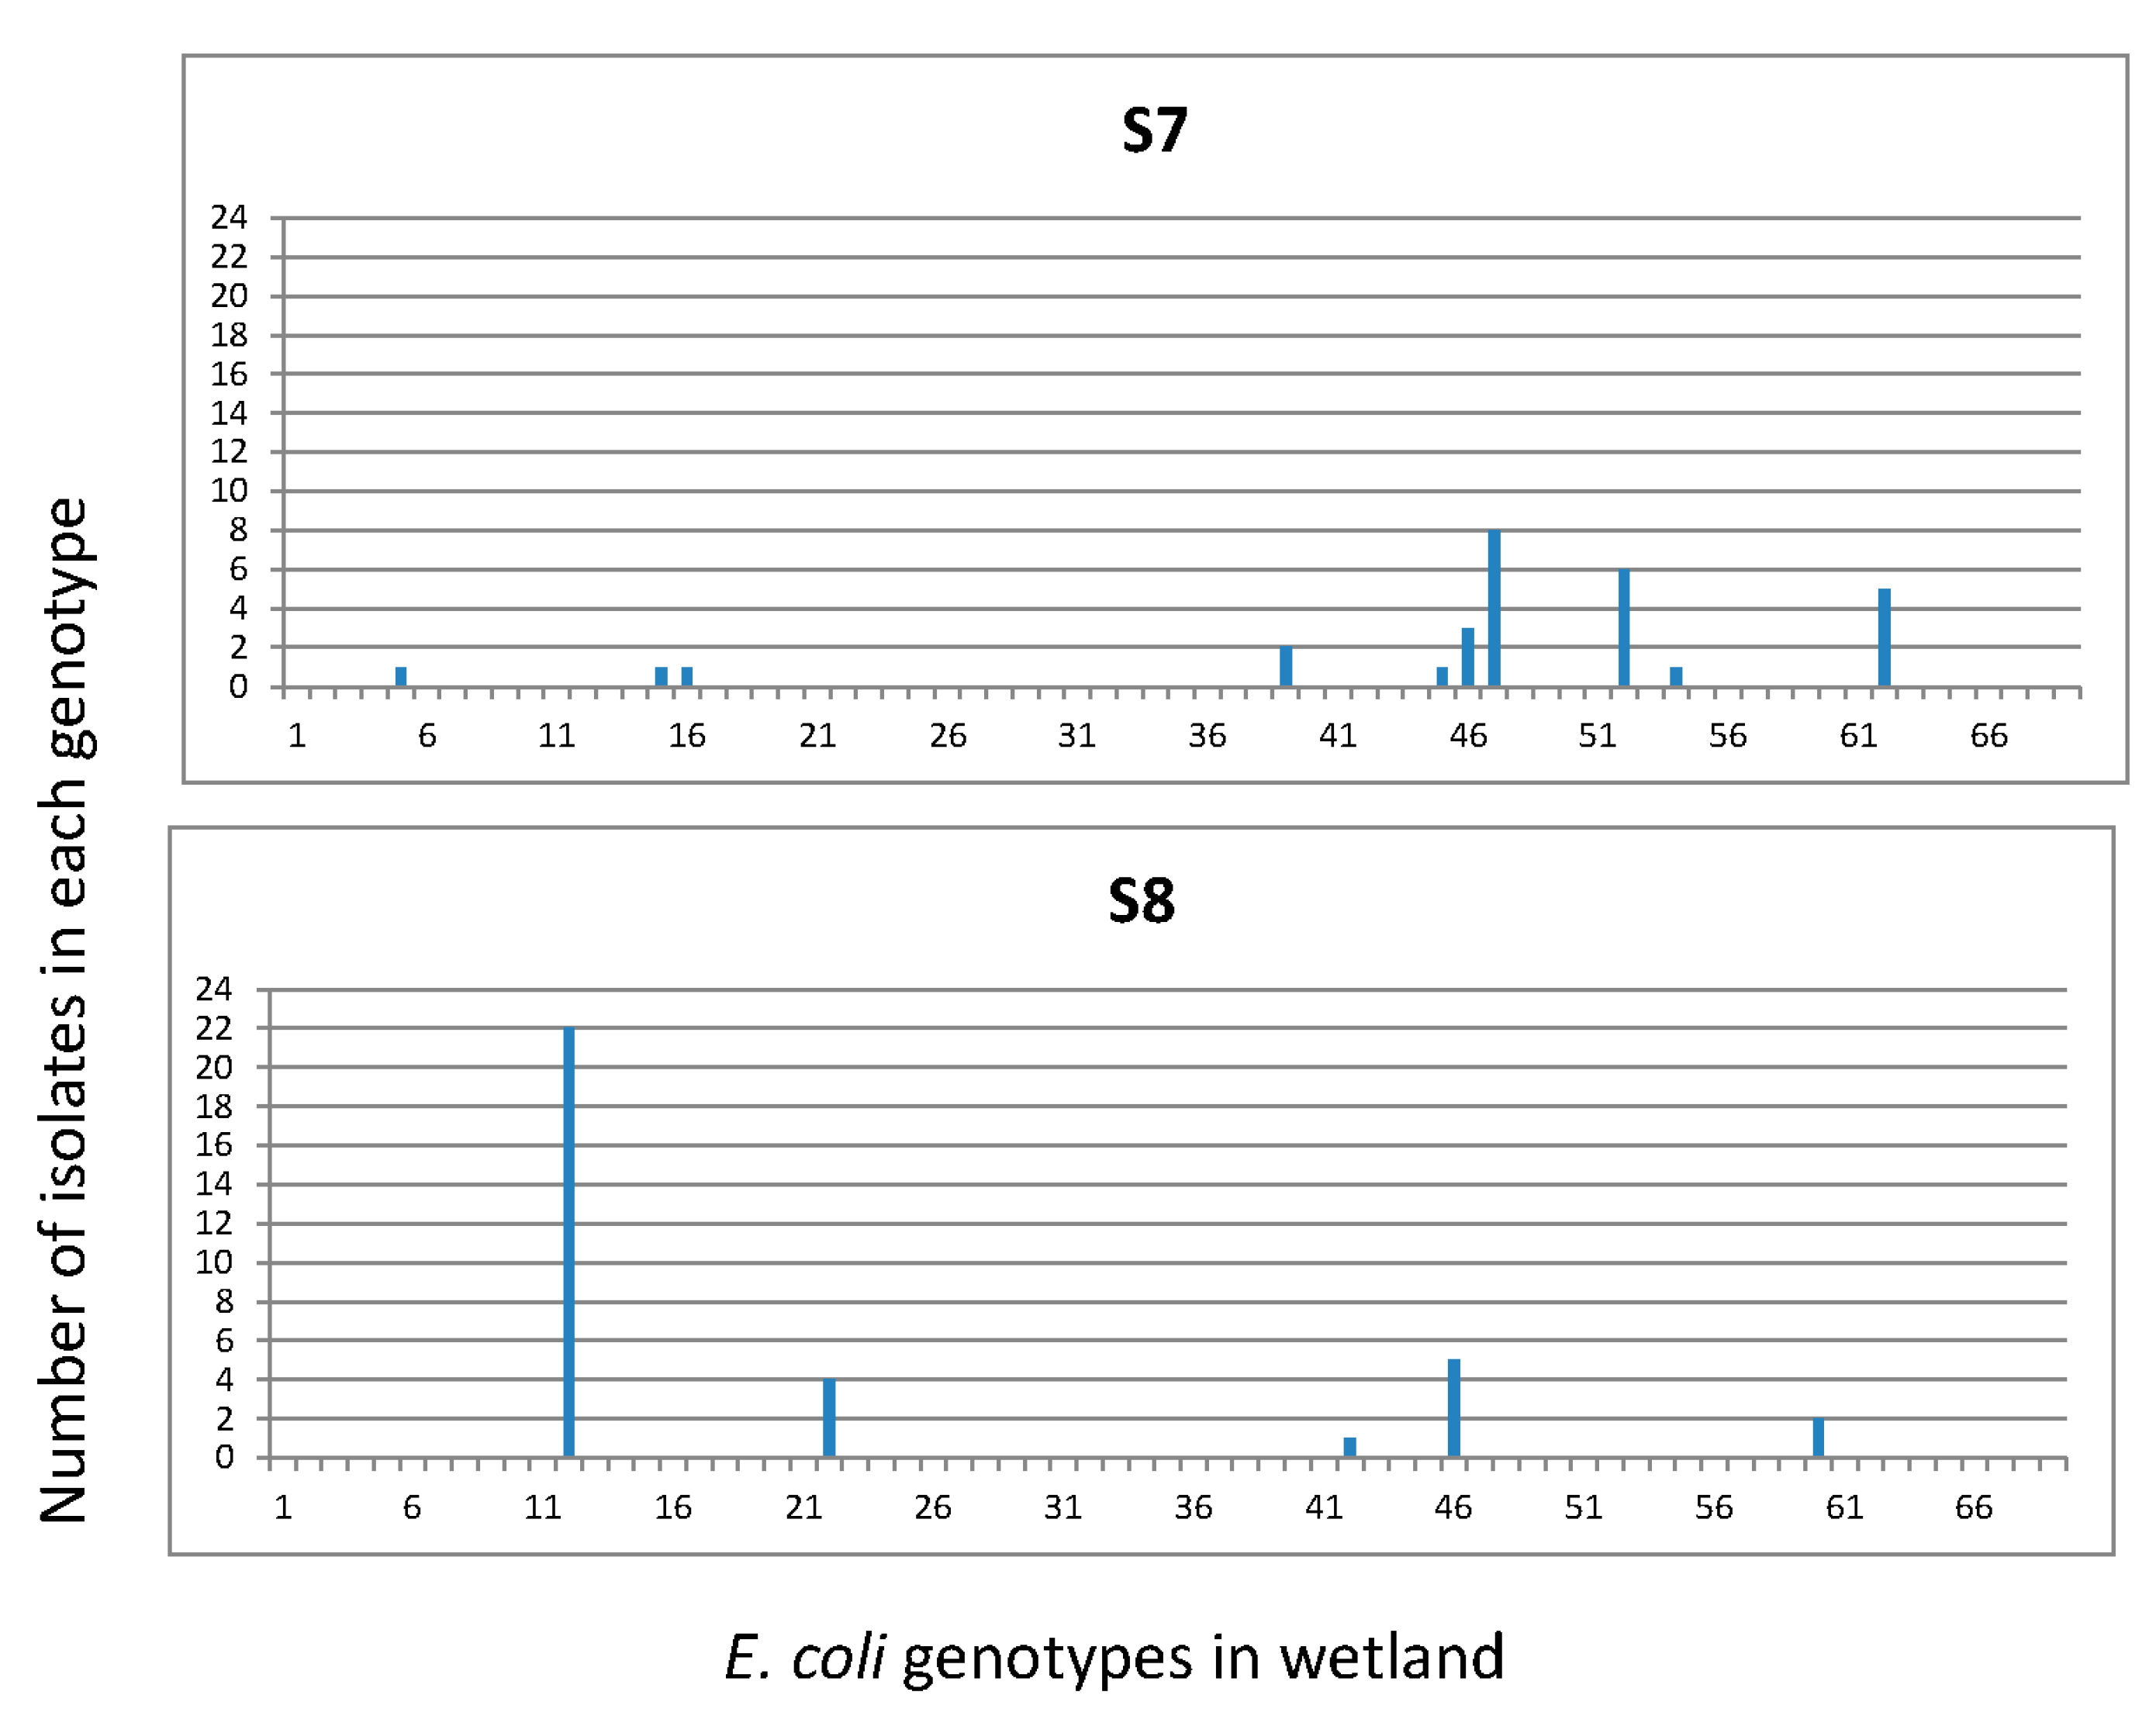
Figure 6.
Temporal variations of E. coli isolates based on rep-PCR analysis in wetland for March, August, and November.
Figure 6.
Temporal variations of E. coli isolates based on rep-PCR analysis in wetland for March, August, and November.


Table 1.
Virulence gene and resistant genotypes of potential pathogenic E. coli from swine constructed wetland.
Table 1.
Virulence gene and resistant genotypes of potential pathogenic E. coli from swine constructed wetland.
| Month | Sample Name | O Type | H Type | LT | Sta | STb | STX1 | STX2 | EAE | CNF1 | CNF2 |
|---|---|---|---|---|---|---|---|---|---|---|---|
| March | S1C | - | 43 | - | - | - | - | - | - | - | - |
| March | S1F | - | 43 | - | - | - | - | - | - | - | - |
| March | S1G | - | 43 | - | - | - | - | - | - | - | - |
| March | S1U | - | 19 | - | + | + | - | - | - | - | - |
| March | S1W | - | 4 | - | + | + | - | - | - | - | - |
| March | S2C | - | 11 | - | - | - | - | - | + | - | - |
| March | S2D | - | 11 | - | - | - | - | - | + | - | - |
| March | S2E | - | 11 | - | - | - | - | - | + | - | - |
| March | S2K | - | 43 | - | - | - | - | - | - | - | - |
| March | S2P | 88 | 38 | - | - | - | - | - | - | - | - |
| March | S2Y | - | 4 | - | + | + | - | - | - | - | - |
| March | S2Z | - | 4 | - | + | + | - | - | - | - | - |
| March | S2AA | - | 4 | - | + | + | - | - | - | - | - |
| March | S2AB | - | 4 | - | + | + | - | - | - | - | - |
| March | S2AC | - | 4 | - | + | + | - | - | - | - | - |
| March | S3W | - | 4 | - | + | + | - | - | - | - | - |
| March | S3X | - | 9 | - | + | - | - | - | - | - | - |
| March | S3Y | - | 4 | - | + | + | - | - | - | - | - |
| March | SM1A | - | 36 | - | + | + | - | + | - | - | - |
| March | SM1C | - | 36 | - | + | + | - | + | - | - | - |
| March | SM1T | - | 36 | - | + | + | - | + | - | - | - |
| March | SM1U | - | 36 | - | + | + | - | + | - | - | - |
| March | SM1V | - | 36 | - | + | + | - | + | - | - | - |
| March | SM2N | 98 | 5 | - | - | + | - | - | - | - | - |
| March | SM2U | - | 36 | - | + | + | - | + | - | - | - |
| March | SM2V | - | 36 | - | + | + | - | + | - | - | - |
| March | SM2W | - | 11 | - | - | - | - | - | + | - | - |
| March | SM2X | - | 36 | - | + | + | - | + | - | - | - |
| March | SM2Y | - | 11 | - | - | - | - | - | + | - | - |
| March | SM2Z | - | 19 | - | + | + | - | - | - | - | - |
| March | PW1A | - | 19 | - | + | + | - | - | - | - | - |
| March | PW1B | - | 19 | - | + | + | - | - | - | - | - |
| March | PW1C | - | 19 | - | + | + | - | - | - | - | - |
| March | PW1D | - | 19 | - | + | + | - | - | - | - | - |
| March | PW2A | - | 19 | - | + | + | - | - | - | - | - |
| March | PW2B | - | 19 | - | + | + | - | - | - | - | - |
| March | PW2C | - | 19 | - | + | + | - | - | - | - | - |
| March | PW2D | - | 19 | - | + | + | - | - | - | - | - |
| March | PW2E | - | 19 | - | + | + | - | - | - | - | - |
| March | PW3A | - | 19 | - | + | + | - | - | - | - | - |
| March | PSM2E | - | 19 | - | + | + | - | - | - | - | - |
| March | PSM2F | - | 19 | - | + | + | - | - | - | - | - |
| March | PSM2G | - | 19 | - | + | + | - | - | - | - | - |
| March | PSM2H | - | 19 | - | + | + | - | - | - | - | - |
| March | PSM2I | - | 19 | - | + | + | - | - | - | - | - |
| March | PSM2J | - | 19 | - | + | + | - | - | - | - | - |
| March | PSM2K | - | 19 | - | + | + | - | - | - | - | - |
| March | PSM2L | - | 19 | - | + | + | - | - | - | - | - |
| March | PSM2M | - | 19 | - | + | + | - | - | - | - | - |
| March | PSM2N | - | 19 | - | + | + | - | - | - | - | - |
| March | PSM2O | - | 19 | - | + | + | - | - | - | - | - |
| March | PSM2P | - | 19 | - | + | + | - | - | - | - | - |
| August | S1C | - | 11 | - | - | - | - | - | + | - | - |
| August | S1H | - | 11 | - | - | - | - | - | + | - | - |
| August | S1J | - | 11 | - | - | - | - | - | + | - | - |
| August | S1K | - | 11 | - | - | - | - | - | + | - | - |
| August | S2B | - | 32 | - | - | - | - | - | - | - | - |
| August | S3E | 178 | + | - | - | - | - | - | - | - | - |
| November | S1L | - | 11 | - | - | - | - | - | + | - | - |
| November | S2K | - | 11 | - | - | - | - | - | + | - | - |
| November | S2L | - | 11 | - | - | - | - | - | + | - | - |
| November | S3A | - | + | - | - | - | - | - | - | - | - |
| November | S3B | 2 | + | - | - | - | - | - | - | - | - |
| November | S3C | - | 4 | - | - | - | - | - | - | - | - |
| November | S3G | - | 11 | - | - | - | - | - | + | - | - |
| November | S3H | - | 11 | - | - | - | - | - | + | - | - |
| November | S3J | - | 11 | - | - | - | - | - | + | - | - |
| November | S3O | - | 4 | + | + | - | - | - | - | - | - |
| November | S6K | - | 11 | - | - | - | - | - | + | - | - |
| November | SM1G | - | 30 | - | + | - | - | + | - | - | - |
| November | SM1H | - | 30 | - | + | - | - | + | - | - | - |
| November | SM1L | - | 30 | - | + | - | - | + | - | - | - |
- means not detected and + means detected.
Table 2.
Temporal variations of Shannon diversity indices (H′) of E. coli isolate based on BOX PCR.
| Season | No. of Isolates | No. of Unique Genotypes | H′ Index | Frequency Ratio |
|---|---|---|---|---|
| March | 247 | 40 | 3.173 | 0.16 |
| August | 61 | 18 | 2.335 | 0.28 |
| November | 113 | 34 | 3.019 | 0.30 |
| Total | 421 | 92 | 3.231 | 0.25 |
Table 3.
Shannon diversity indices (H′) of E. coli isolates based on BOX PCR from different locations within the wetland.
Table 3.
Shannon diversity indices (H′) of E. coli isolates based on BOX PCR from different locations within the wetland.
| Sampling Locations | No. of Isolates | No. of Unique Genotypes | H′ Index | Frequency Ratio |
|---|---|---|---|---|
| swine house effluent (S1) | 135 | 31 | 2.976 | 0.23 |
| primary lagoon 1 (S2) | 57 | 18 | 2.569 | 0.31 |
| secondary lagoon 2 (S3) | 57 | 17 | 2.177 | 0.30 |
| storage tank (S4) | 48 | 20 | 2.779 | 0.42 |
| continuous wetland influent (S5) | 24 | 7 | 1.310 | 0.29 |
| continuous wetland effluent (S6) | 30 | 6 | 1.705 | 0.20 |
| storage pond (S7) | 36 | 10 | 2.090 | 0.27 |
| land application (S8) | 34 | 5 | 1.086 | 0.15 |
© 2018 by the authors. Licensee MDPI, Basel, Switzerland. This article is an open access article distributed under the terms and conditions of the Creative Commons Attribution (CC BY) license (http://creativecommons.org/licenses/by/4.0/).
Share and Cite
MDPI and ACS Style
Ibekwe, A.M.; Murinda, S.E. Continuous Flow-Constructed Wetlands for the Treatment of Swine Waste Water. Int. J. Environ. Res. Public Health 2018, 15, 1369. https://0-doi-org.brum.beds.ac.uk/10.3390/ijerph15071369
AMA Style
Ibekwe AM, Murinda SE. Continuous Flow-Constructed Wetlands for the Treatment of Swine Waste Water. International Journal of Environmental Research and Public Health. 2018; 15(7):1369. https://0-doi-org.brum.beds.ac.uk/10.3390/ijerph15071369
Chicago/Turabian StyleIbekwe, Abasiofiok M., and Shelton E. Murinda. 2018. "Continuous Flow-Constructed Wetlands for the Treatment of Swine Waste Water" International Journal of Environmental Research and Public Health 15, no. 7: 1369. https://0-doi-org.brum.beds.ac.uk/10.3390/ijerph15071369
Note that from the first issue of 2016, this journal uses article numbers instead of page numbers. See further details here.