Comparison of Ground-Based PM2.5 and PM10 Concentrations in China, India, and the U.S.

Abstract
:1. Introduction
2. Data and Methods
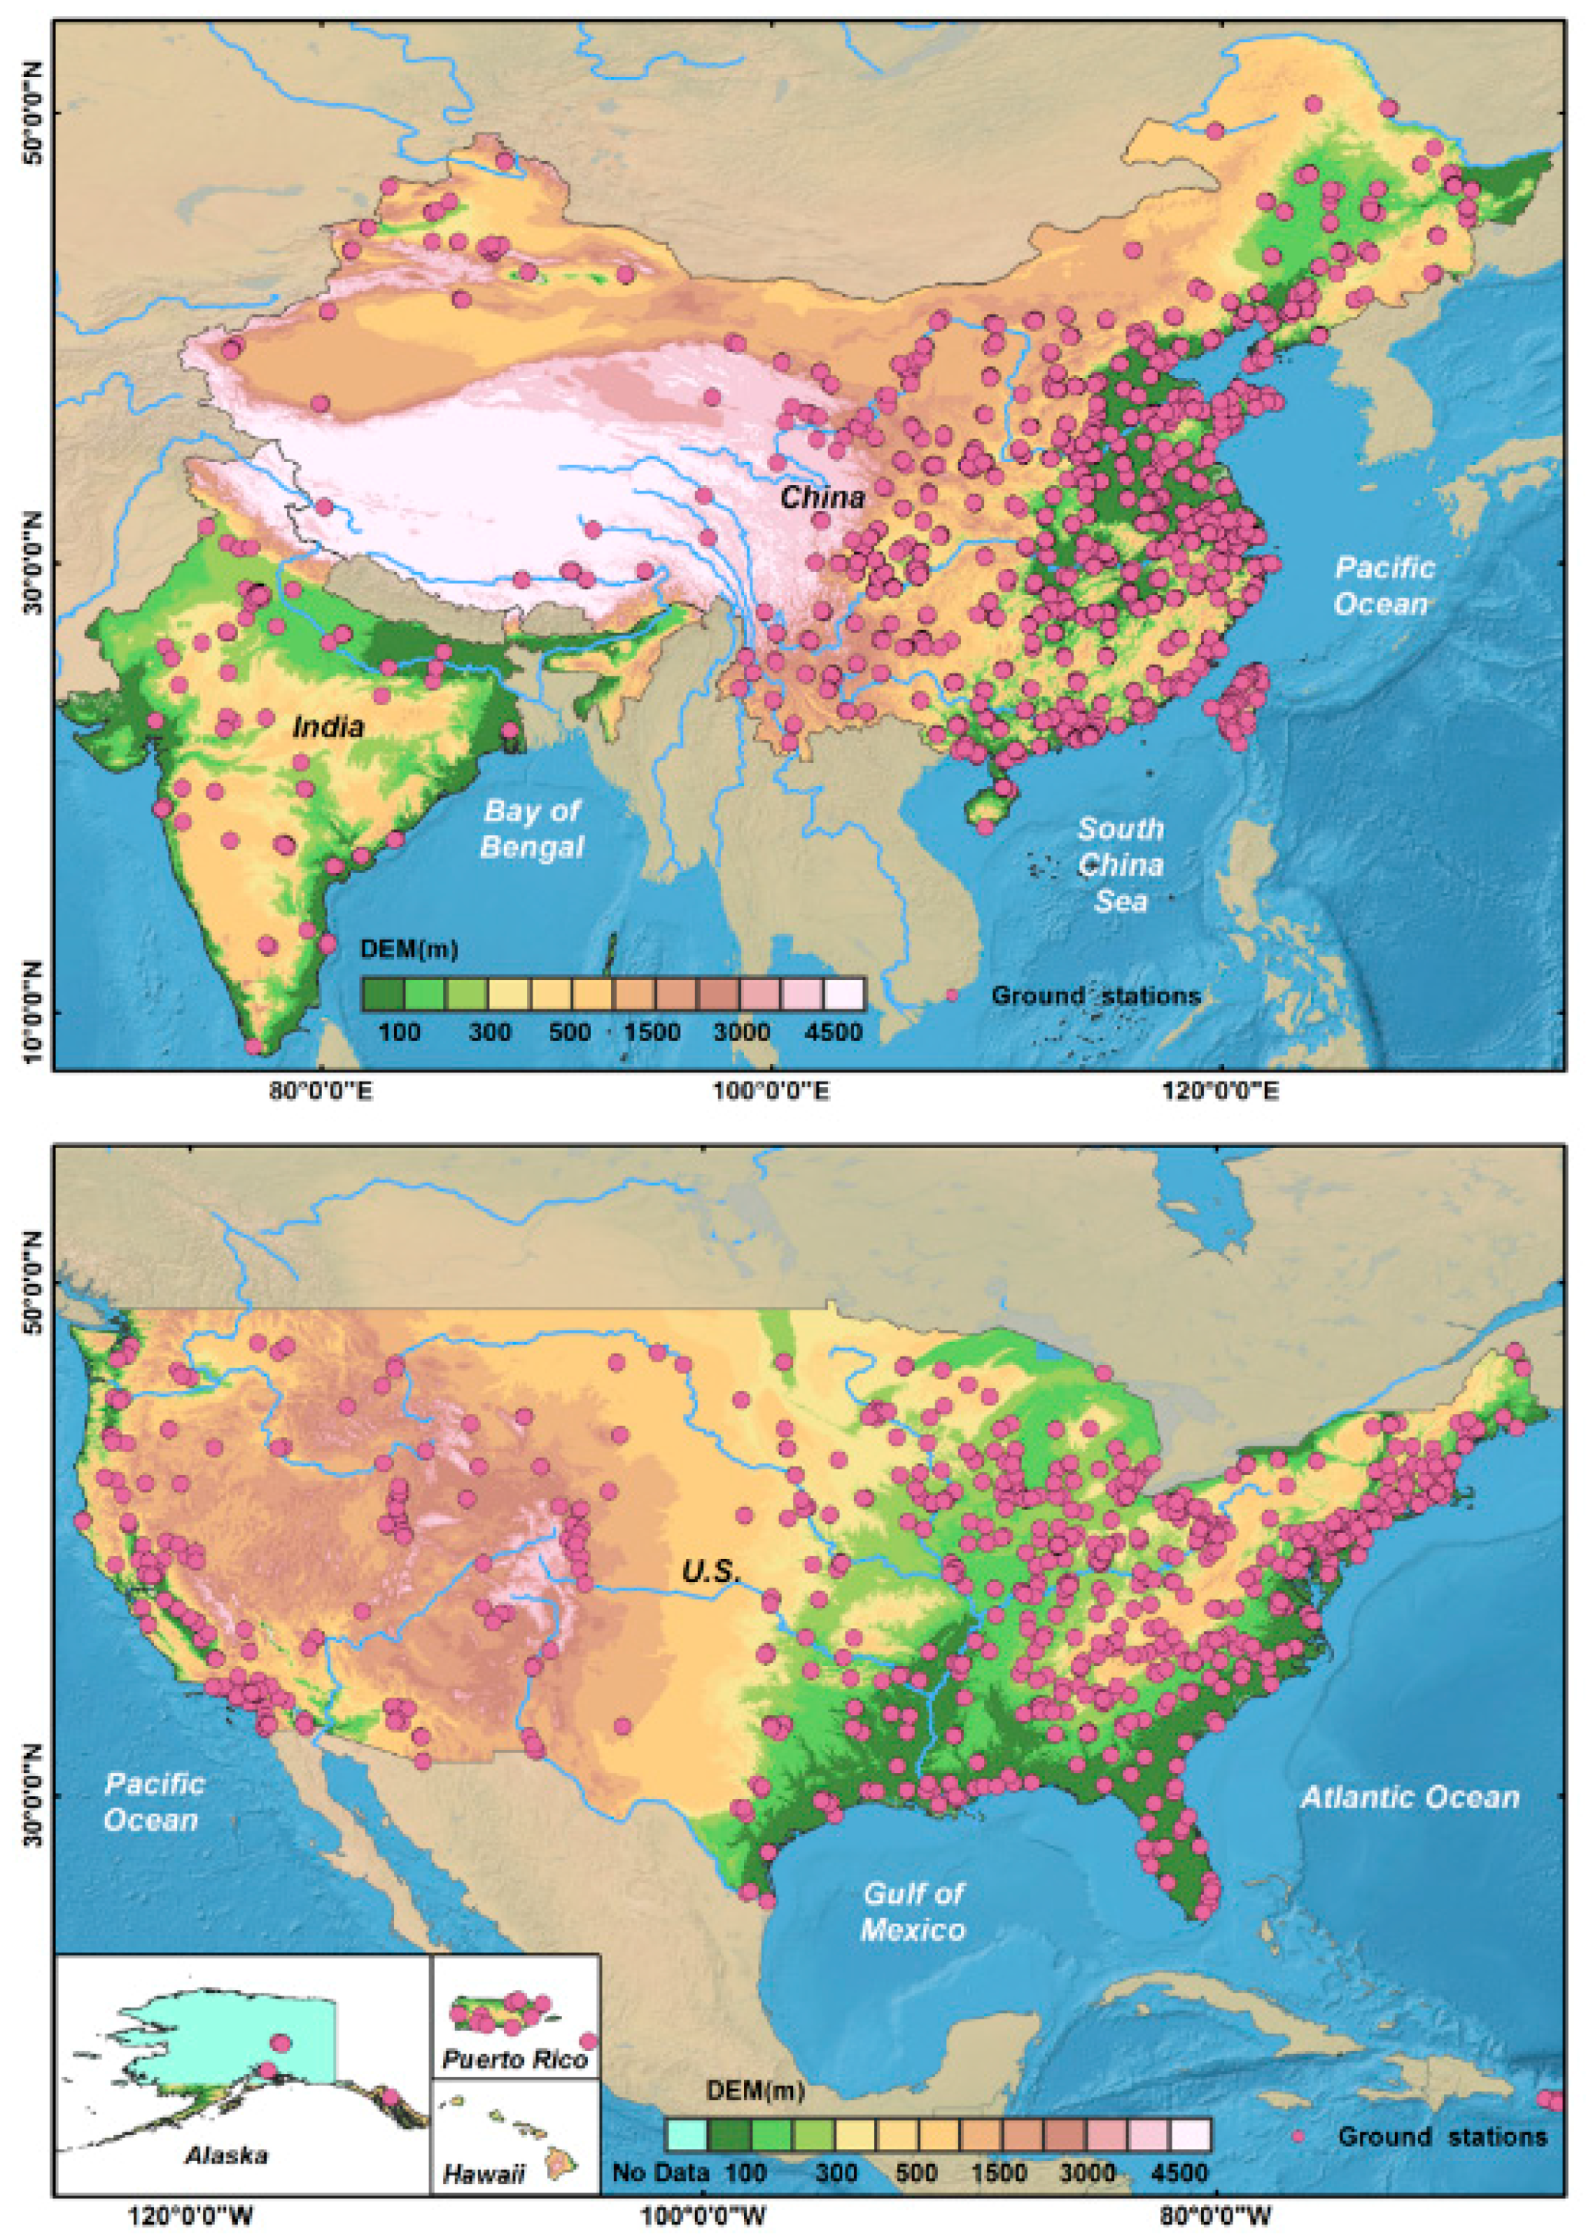
2.1. Data
2.2. Methods
3. Results
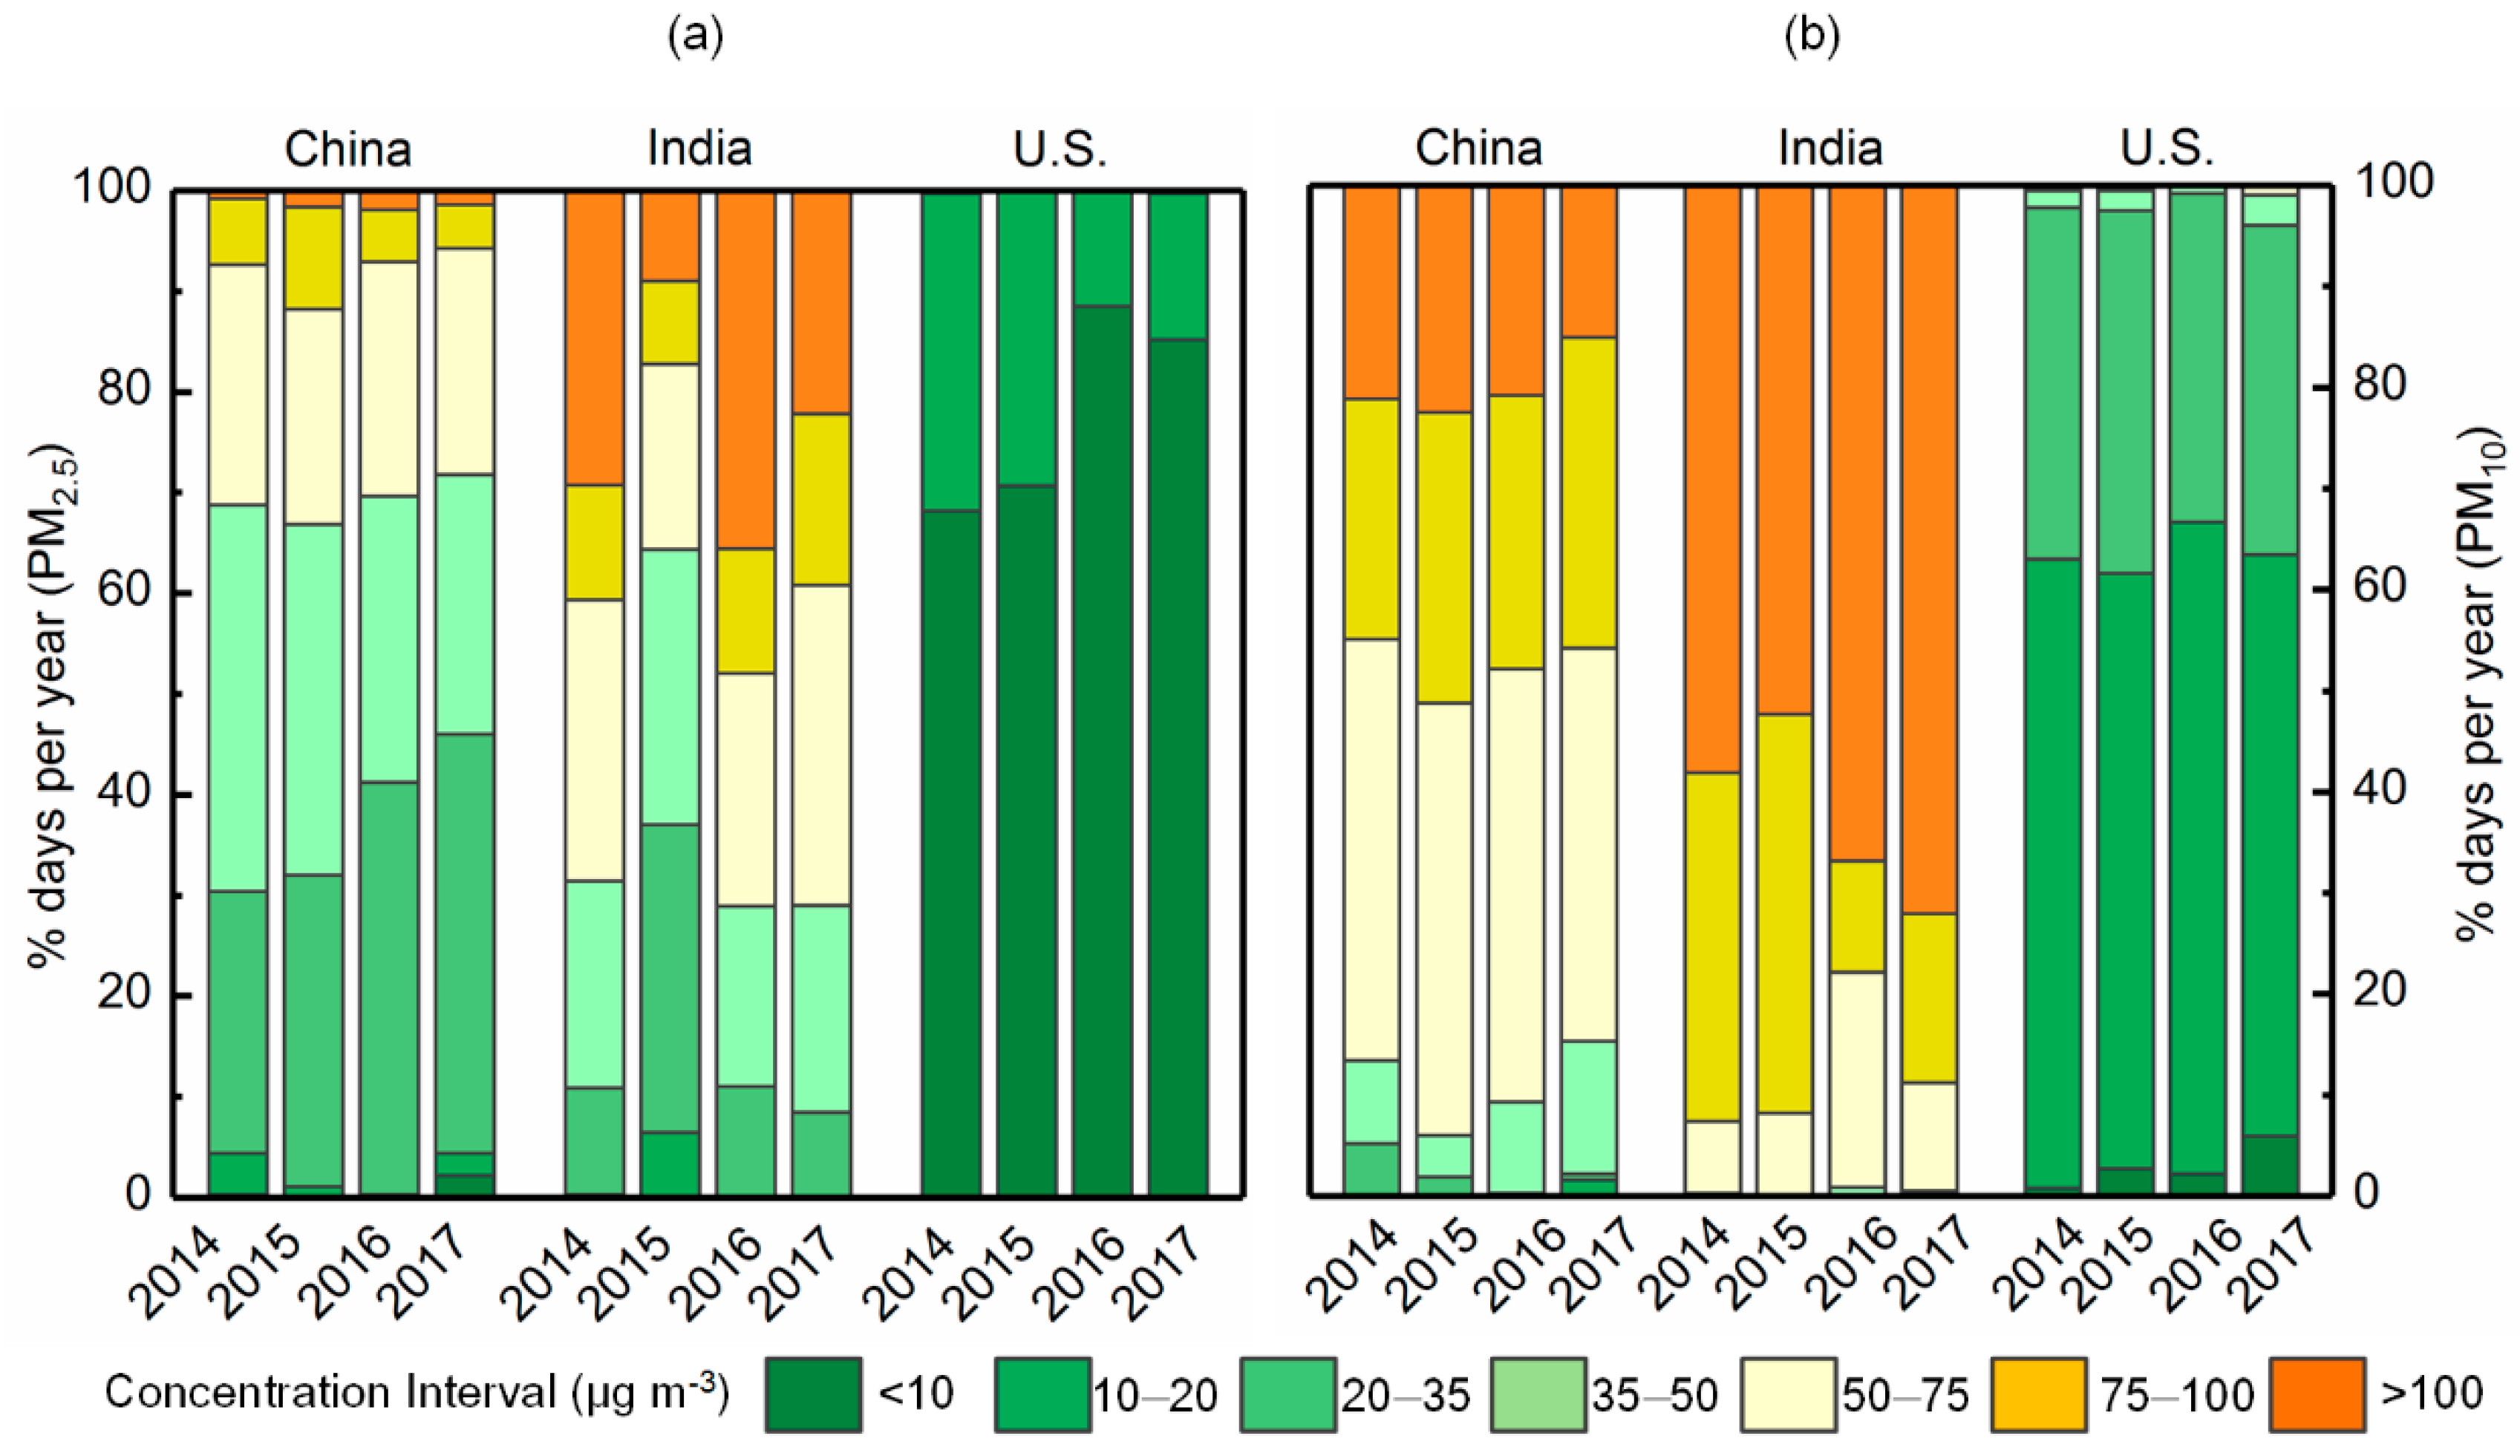
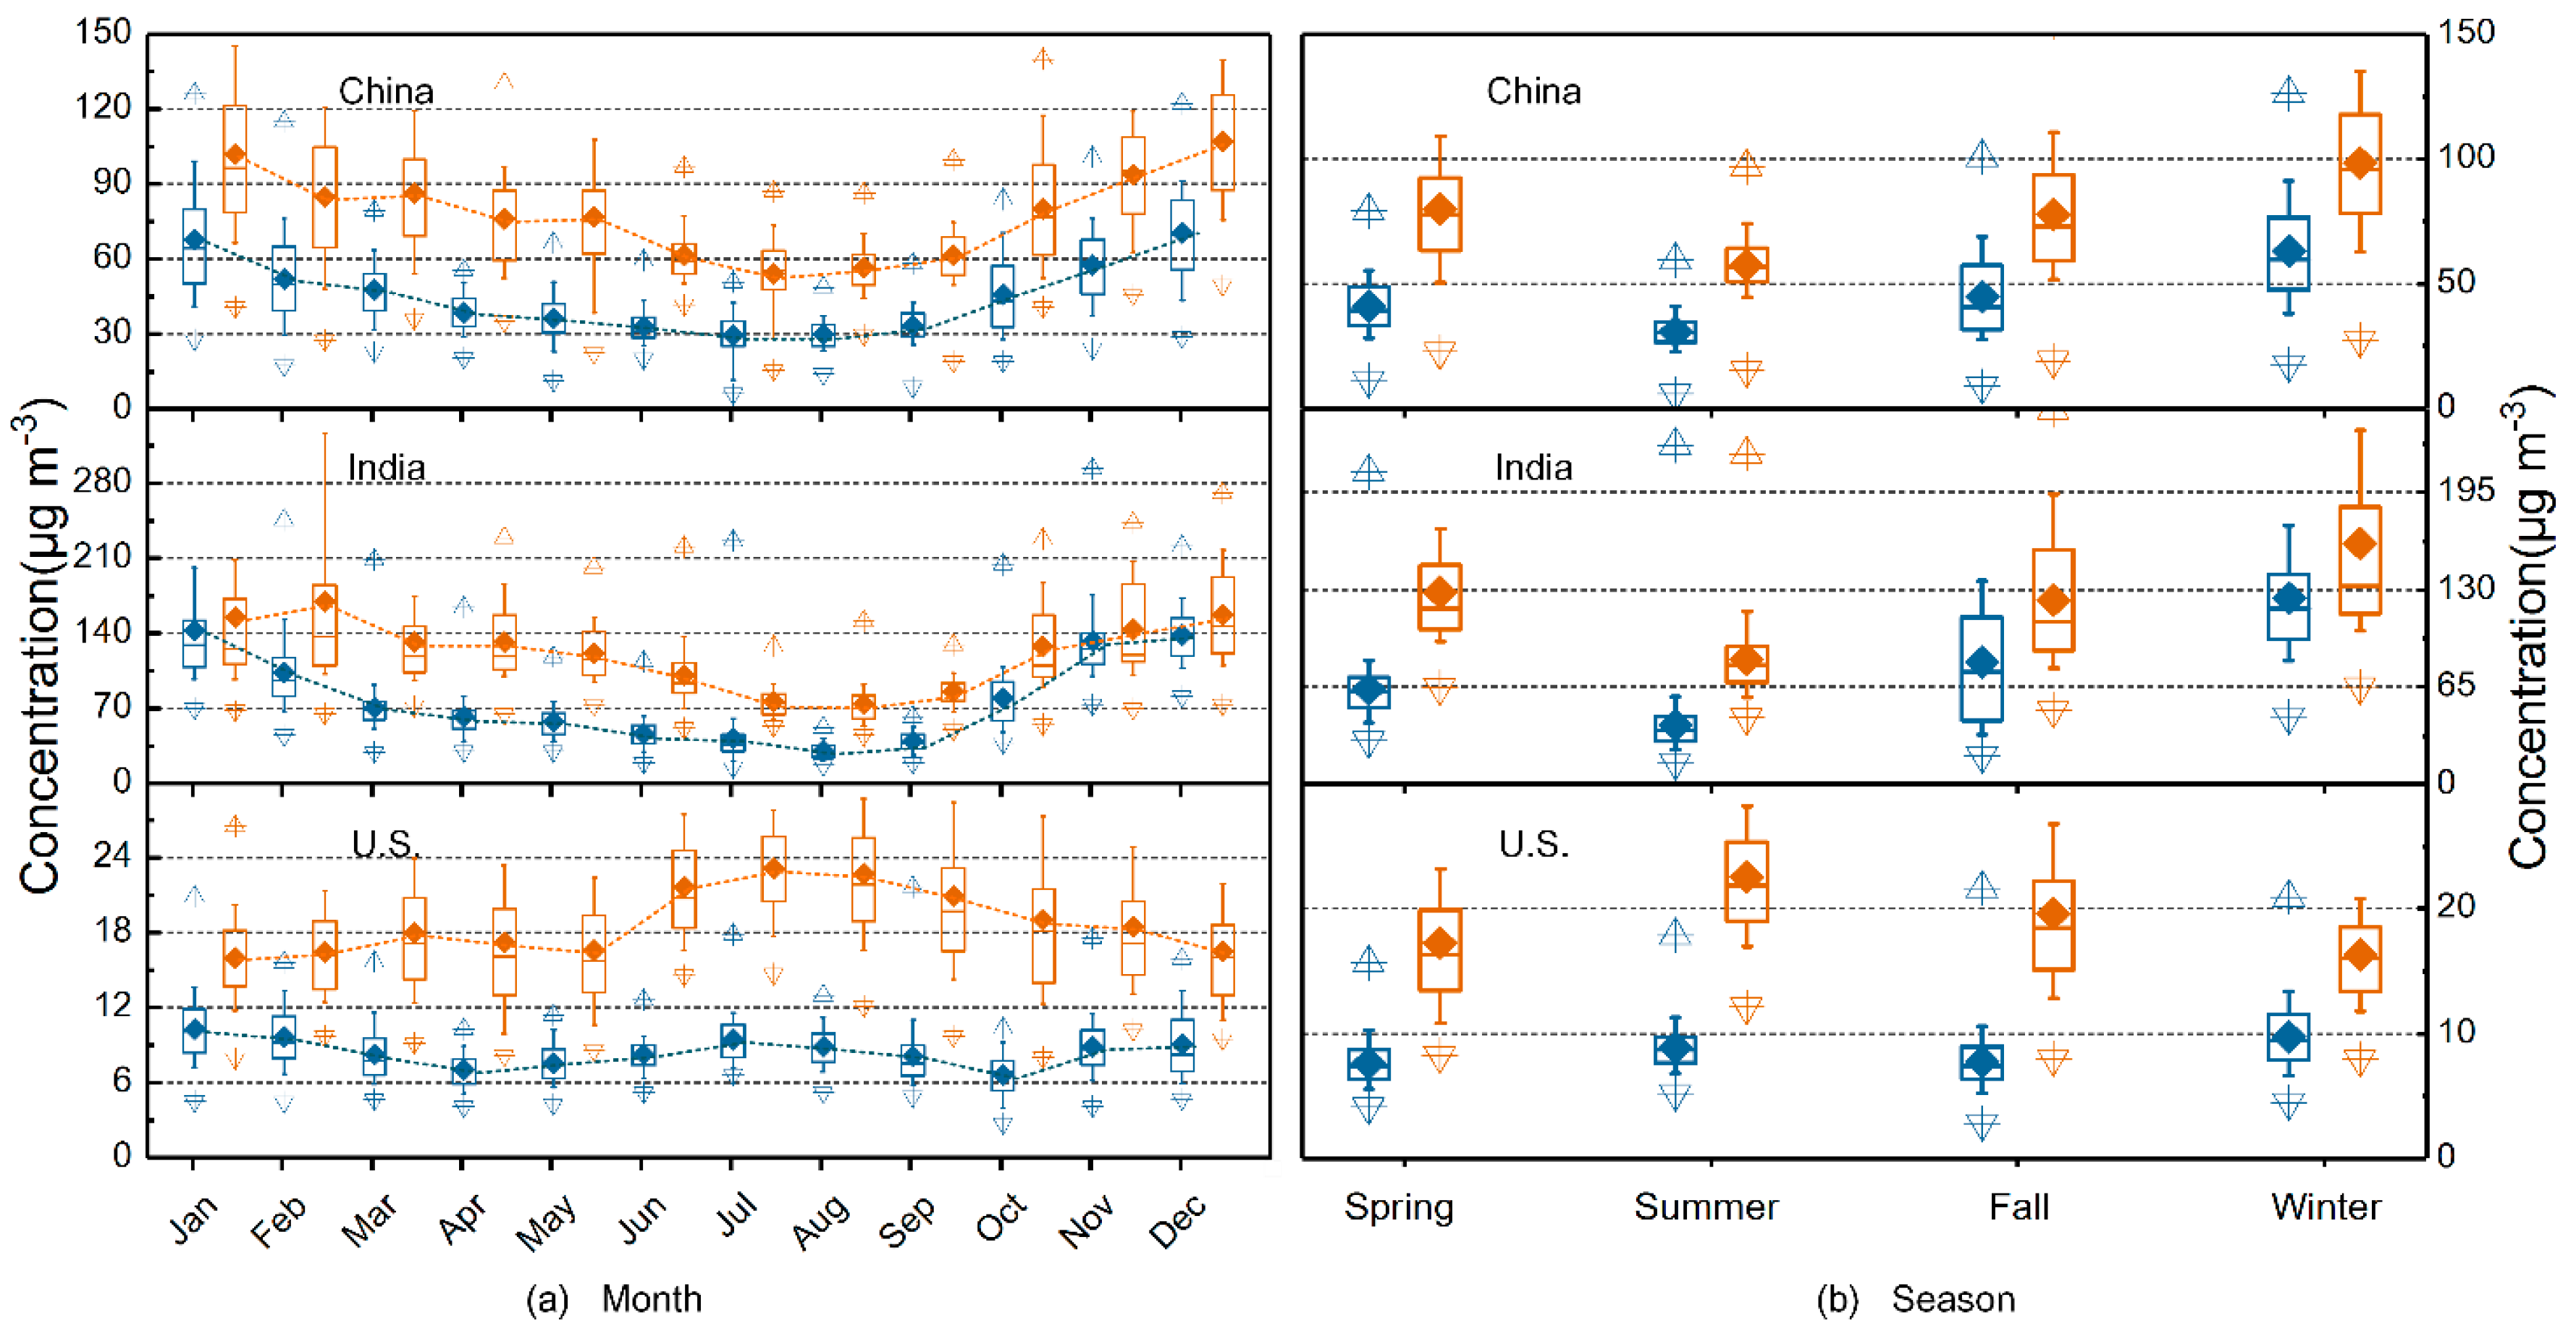
3.1. Temporal Variations
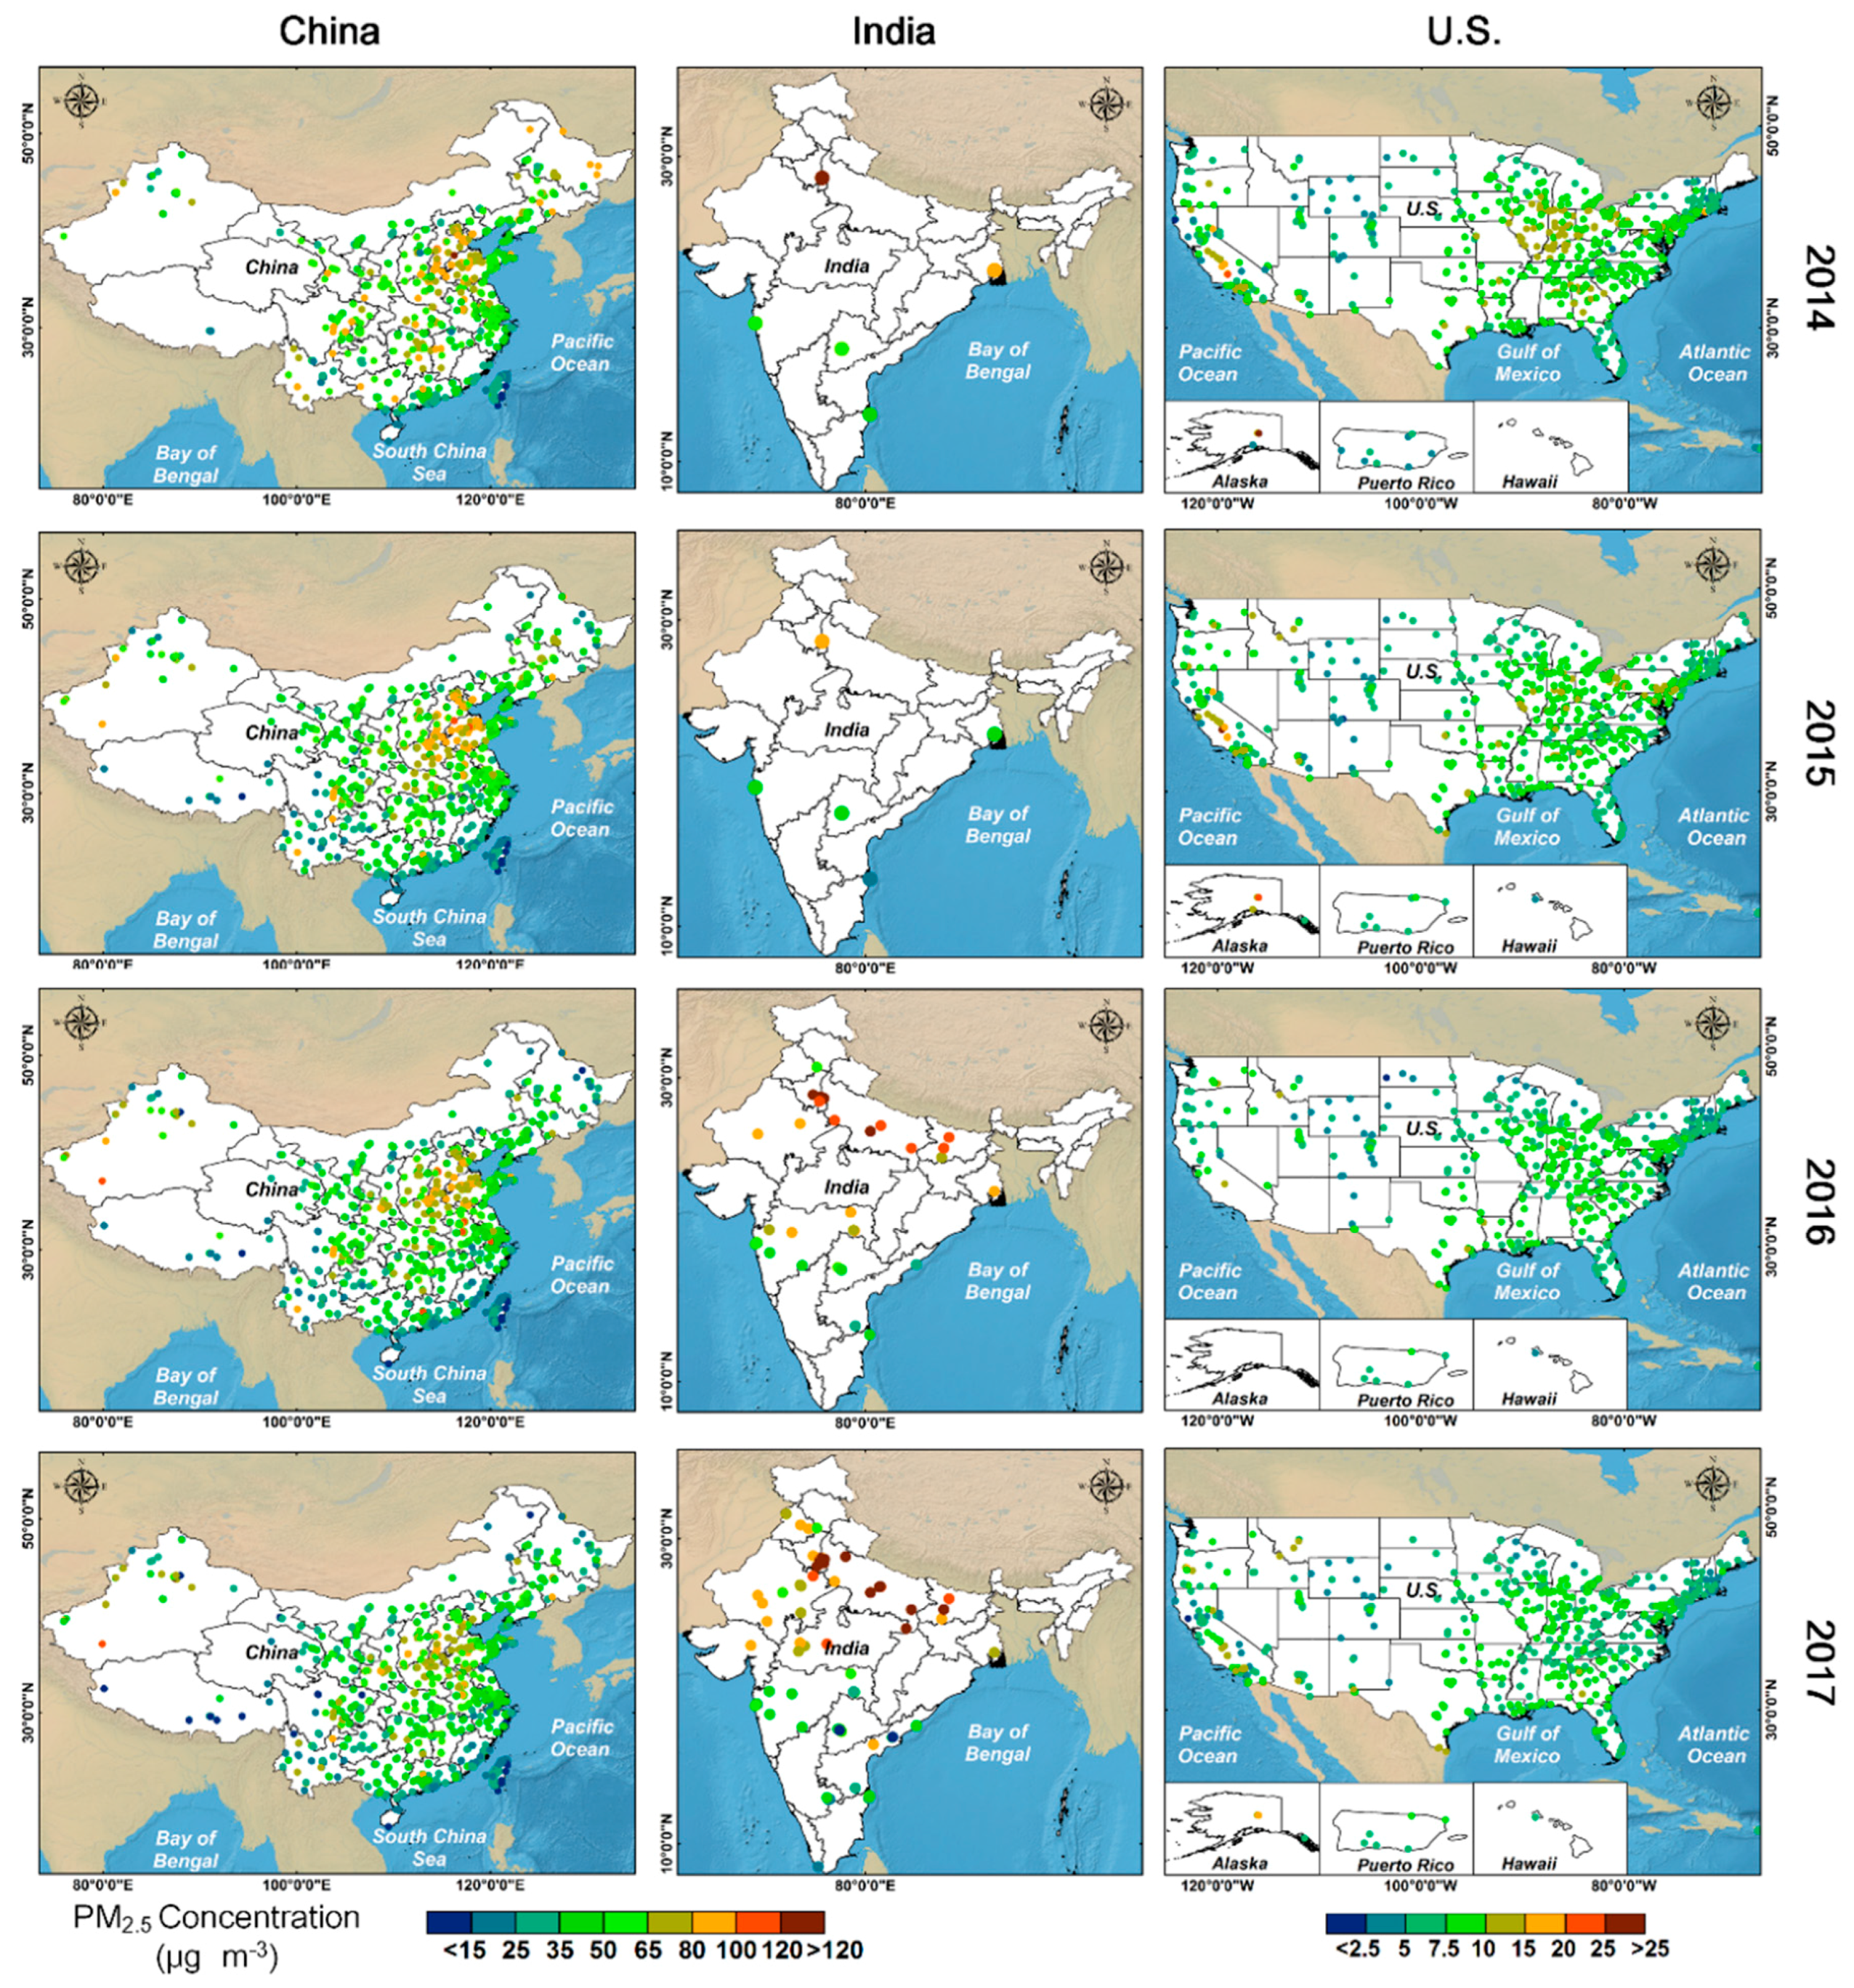
3.2. Spatial Variations
3.3. Correlation between PM2.5 and PM10 Concentrations
3.4. PM2.5 and PM10 Concentrations in Megacity Regions
4. Discussion
5. Conclusions
Supplementary Materials
Author Contributions
Funding
Acknowledgments
Conflicts of Interest
References
- Laden, F.; Schwartz, J.; Speizer, F.E.; Dockery, D.W. Reduction in fine particulate air pollution and mortality: Extended follow-up of the harvard six cities study. Am. J. Respir Crit. Care Med. 2006, 173, 667–672. [Google Scholar] [CrossRef] [PubMed]
- Pope, C.A., 3rd; Burnett, R.T.; Krewski, D.; Jerrett, M.; Shi, Y.; Calle, E.E.; Thun, M.J. Cardiovascular mortality and exposure to airborne fine particulate matter and cigarette smoke: Shape of the exposure-response relationship. Circulation 2009, 120, 941–948. [Google Scholar] [CrossRef] [PubMed]
- Pope, C.A.; Burnett, R.T.; Turner, M.C.; Cohen, A.; Krewski, D.; Jerrett, M.; Gapstur, S.M.; Thun, M.J. Lung cancer and cardiovascular disease mortality associated with ambient air pollution and cigarette smoke: Shape of the exposure-response relationships. Environ. Health Perspect. 2011, 119, 1616–1621. [Google Scholar] [CrossRef] [PubMed]
- Organization, W.H. Ambient Air Pollution: A Global Assessment of Exposure and Burden of Disease; Working Papers; World Health Organization: Geneva, Switzerland, 2016. [Google Scholar]
- Xiong, Q.; Zhao, W.; Zhao, J.; Zhao, W.; Jiang, L. Concentration levels, pollution characteristics and potential ecological risk of dust heavy metals in the metropolitan area of beijing, china. Int. J. Environ. Res. Public Health 2017, 14, 1159. [Google Scholar] [CrossRef] [PubMed]
- Tsai, Y.I.; Kuo, S.C.; Lee, W.J.; Chen, C.L.; Chen, P.T. Long-term visibility trends in one highly urbanized, one highly industrialized, and two rural areas of taiwan. Sci. Total Environ. 2007, 382, 324–341. [Google Scholar] [CrossRef] [PubMed]
- Li, Z.; Lau, W.K.M.; Ramanathan, V.; Wu, G.; Ding, Y.; Manoj, M.G.; Liu, J.; Qian, Y.; Li, J.; Zhou, T. Aerosol and monsoon climate interactions over asia. Rev. Geophys. 2016, 54, 866–929. [Google Scholar] [CrossRef]
- Kuklinska, K.; Wolska, L.; Namiesnik, J. Air quality policy in the U.S. And the eu—A review. Atmos. Pollut. Res. 2015, 6, 129–137. [Google Scholar] [CrossRef]
- Schwartz, J.; Hayward, S.F. Air Quality in America; AEI Press: Monnaz, CH, USA, 2007. [Google Scholar]
- Nallathamby, P.D.; Lewandowski, M.; Jaoui, M.; Offenberg, J.H.; Kleindienst, T.E.; Rubitschun, C.; Surratt, J.D.; Usenko, S.; Sheesley, R.J. Qualitative and quantitative assessment of unresolved complex mixture in PM 2.5 of bakersfield, CA. Atmos. Environ. 2014, 98, 368–375. [Google Scholar] [CrossRef]
- Zheng, Y.; Xue, T.; Zhang, Q.; Geng, G.; Tong, D.; Li, X.; He, K. Air quality improvements and health benefits from china’s clean air action since 2013. Environ. Res. Lett. 2017, 12, 114020. [Google Scholar] [CrossRef]
- Gurjar, B.R.; Ravindra, K.; Nagpure, A.S. Air pollution trends over Indian megacities and their local-to-global implications. Atmos. Environ. 2016, 142, 475–495. [Google Scholar] [CrossRef]
- Cohen, A.J.; Brauer, M.; Burnett, R.; Anderson, H.R.; Frostad, J.; Estep, K.; Balakrishnan, K.; Brunekreef, B.; Dandona, L.; Dandona, R. Estimates and 25-year trends of the global burden of disease attributable to ambient air pollution: An analysis of data from the global burden of diseases study 2015. Lancet 2017, 389, 1907–1918. [Google Scholar] [CrossRef]
- Wang, Y.; Xin, J.; Li, Z.; Wang, S.; Wang, P.; Hao, W.M.; Nordgren, B.L.; Chen, H.; Wang, L.; Sun, Y. Seasonal variations in aerosol optical properties over China. J. Geophys. Res. Atmos. 2011, 116, D18. [Google Scholar] [CrossRef]
- Van, D.A.; Martin, R.V.; Brauer, M.; Hsu, N.C.; Kahn, R.A.; Levy, R.C.; Lyapustin, A.; Sayer, A.M.; Winker, D.M. Global estimates of fine particulate matter using a combined geophysical-statistical method with information from satellites, models, and monitors. Environ. Sci. Technol. 2016, 50, 3762–3772. [Google Scholar]
- Shen, Z.; Cao, J.; Zhang, L.; Zhang, Q.; Huang, R.J.; Liu, S.; Zhao, Z.; Zhu, C.; Lei, Y.; Xu, H. Retrieving historical ambient PM 2.5 concentrations using existing visibility measurements in Xi’an, Northwest China. Atmos. Environ. 2016, 126, 15–20. [Google Scholar] [CrossRef]
- Wang, Y.; Ying, Q.; Hu, J.; Zhang, H. Spatial and temporal variations of six criteria air pollutants in 31 provincial capital cities in China during 2013–2014. Environ. Int. 2014, 73, 413–422. [Google Scholar] [CrossRef] [PubMed]
- Xie, Y.; Zhao, B.; Zhang, L.; Luo, R. Spatiotemporal variations of PM2.5 and PM10 concentrations between 31 Chinese cities and their relationships with SO2, NO2, CO and O3. Particuology 2015, 20, 141–149. [Google Scholar] [CrossRef]
- Guttikunda, S.K.; Goel, R.; Pant, P. Nature of air pollution, emission sources, and management in the Indian cities. Atmos. Environ. 2014, 95, 501–510. [Google Scholar] [CrossRef]
- Dey, S.; Girolamo, L.D.; Donkelaar, A.V.; Tripathi, S.N.; Gupta, T.; Mohan, M. Variability of outdoor fine particulate (PM2.5) concentration in the Indian subcontinent: A remote sensing approach. Remote Sens. Environ. 2012, 127, 153–161. [Google Scholar] [CrossRef]
- Trivedi, D.K.; Ali, K.; Beig, G. Impact of meteorological parameters on the development of fine and coarse particles over Delhi. Sci. Total Environ. 2014, 478, 175–183. [Google Scholar] [CrossRef] [PubMed]
- Giri, B.; Patel, K.S.; Jaiswal, N.K.; Sharma, S.; Ambade, B.; Wang, W.; Simonich, S.L.M.; Simoneit, B.R.T. Composition and sources of organic tracers in aerosol particles of industrial central India. Atmos. Res. 2013, 120–121, 312–324. [Google Scholar] [CrossRef] [Green Version]
- Das, R.; Khezri, B.; Srivastava, B.; Datta, S.; Sikdar, P.K.; Webster, R.D.; Wang, X. Trace element composition of PM 2.5 and PM 10 from Kolkata—A heavily polluted Indian metropolis. Atmos. Pollut. Res. 2015, 6, 742–750. [Google Scholar] [CrossRef]
- Singh, D.K.; Gupta, T. Effect through inhalation on human health of PM1 bound polycyclic aromatic hydrocarbons collected from foggy days in northern part of India. J. Hazard. Mater. 2015, 306, 257–268. [Google Scholar] [CrossRef] [PubMed]
- Srimuruganandam, B.; Shiva Nagendra, S.M. Application of positive matrix factorization in characterization of PM10 and PM2.5 emission sources at urban roadside. Chemosphere 2012, 88, 120–130. [Google Scholar] [CrossRef] [PubMed]
- Joseph, A.E.; Unnikrishnan, S.; Kumar, R. Chemical characterization and mass closure of fine aerosol for different land use patterns in Mumbai city. Aerosol Air Qual. Res. 2012, 12, 61–72. [Google Scholar] [CrossRef]
- Bell, M.L.; Dominici, F.; Ebisu, K.; Zeger, S.L.; Samet, J.M. Spatial and temporal variation in PM2.5 chemical composition in the United States for health effects studies. Environ. Health Perspect. 2007, 115, 989–995. [Google Scholar] [CrossRef] [PubMed]
- Vieira, V.M.; Villanueva, C.; Chang, J.; Ziogas, A.; Bristow, R.E. Impact of community disadvantage and air pollution burden on geographic disparities of ovarian cancer survival in California. Environ. Res. 2017, 156, 388–393. [Google Scholar] [CrossRef] [PubMed]
- Pope, R.; Wu, J.; Boone, C. Spatial patterns of air pollutants and social groups: A distributive environmental justice study in the phoenix metropolitan region of USA. Environ. Manag. 2016, 58, 1–14. [Google Scholar] [CrossRef] [PubMed]
- Guo, H.; Cheng, T.; Gu, X.; Wang, Y.; Chen, H.; Bao, F.; Shi, S.; Xu, B.; Wang, W.; Zuo, X. Assessment of PM2.5 concentrations and exposure throughout china using ground observations. Sci. Total Environ. 2017, 601–602, 1024–1030. [Google Scholar] [CrossRef] [PubMed]
- Wang, S.; Zhou, C.; Wang, Z.; Feng, K.; Hubacek, K. The characteristics and drivers of fine particulate matter (PM2.5) distribution in China. J. Clean. Prod. 2017, 142, 1800–1809. [Google Scholar] [CrossRef]
- Cao, S.; Zhao, W.; Guan, H.; Hu, D.; Mo, Y.; Zhao, W.; Li, S. Comparison of remotely sensed PM2.5 concentrations between developed and developing countries: Results from the US, Europe, China, and India. J. Clean. Prod. 2018, 182, 672–681. [Google Scholar]
- Van, D.A.; Martin, R.V.; Brauer, M.; Boys, B.L. Use of satellite observations for long-term exposure assessment of global concentrations of fine particulate matter. Environ. Health Perspect. 2015, 123, 135. [Google Scholar]
- Murukutla, N.; Negi, N.S.; Puri, P.; Mullin, S.; Onyon, L. Online media coverage of air pollution risks and current policies in India: A content analysis. WHO South East Asia J. Public Health 2017, 6, 41–50. [Google Scholar] [CrossRef] [PubMed]
- He, K.; Jia, Y.; Ma, Y.; Lei, Y.; Zhao, Q.; Shigeru, T.; Tomoaki, O. Regionality of episodic aerosol pollution in Beijing. Acta Sci. Circumst. 2009, 29, 482–487. [Google Scholar]
- Zhou, T.; Sun, J.; Yu, H. Temporal and spatial patterns of China’s main air pollutants: Years 2014 and 2015. Atmosphere 2017, 8, 137. [Google Scholar] [CrossRef]
- Li, M.S.; Ren, X.X.; Yu, Y.; Zhou, L. Spatiotemporal pattern of ground-level fine particulate matter (PM2.5) pollution in mainland China. China Environ. Sci. 2016, 36, 641–650. [Google Scholar]
- Song, C.; Wu, L.; Xie, Y.; He, J.; Chen, X.; Wang, T.; Lin, Y.; Jin, T.; Wang, A.; Liu, Y. Air pollution in China: Status and spatiotemporal variations. Environ. Pollut. 2017, 227, 334–347. [Google Scholar] [CrossRef] [PubMed]
- National Air Quality: Status and Trends of Key Air Pollutants. Available online: https://gispub.epa.gov/air/trendsreport/2017/ (accessed on 15 April 2018).
- Pant, P.; Guttikunda, S.K.; Peltier, R.E. Exposure to particulate matter in India: A synthesis of findings and future directions. Environ. Res. 2016, 147, 480–496. [Google Scholar] [CrossRef] [PubMed]
- Lin, Y.; Zou, J.; Yang, W.; Li, C.Q. A review of recent advances in research on PM2.5 in China. Int. J. Environ. Res. Public Health 2018, 15, 438. [Google Scholar] [CrossRef] [PubMed]
- Tai, A.P.K.; Mickley, L.J.; Jacob, D.J. Correlations between fine particulate matter (PM2.5) and meteorological variables in the United States: Implications for the sensitivity of PM2.5 to climate change. Atmos. Environ. 2010, 44, 3976–3984. [Google Scholar] [CrossRef]
- Cheng, Z.; Jiang, J.; Fajardo, O.; Wang, S.; Hao, J. Characteristics and health impacts of particulate matter pollution in China (2001–2011). Atmos. Environ. 2013, 65, 186–194. [Google Scholar] [CrossRef]
- Deka, P.; Hoque, R.R. Incremental effect of festive biomass burning on wintertime PM10 in Brahmaputra Valley of northeast India. Atmos. Res. 2014, 143, 380–391. [Google Scholar] [CrossRef]
- He, J.; Gong, S.; Yu, Y.; Yu, L.; Wu, L.; Mao, H.; Song, C.; Zhao, S.; Liu, H.; Li, X. Air pollution characteristics and their relation to meteorological conditions during 2014–2015 in major Chinese cities. Environ. Pollut. 2017, 223, 484–496. [Google Scholar] [CrossRef] [PubMed]
- Yang, X.; Zhao, W.; Xiong, Q.; Wang, L.; Zhao, W.; University, C.N.; Resources, S.O.; Amp, E. Spatio-temporal distribution of PM2.5 in Beijing-Tianjin-Hebei(BTH) area in 2016 and its relationship with meteorological factors. Ecol. Environ. Sci. 2017, 26, 1747–1754. [Google Scholar]
- Massey, D.; Kulshrestha, A.; Masih, J.; Taneja, A. Seasonal trends of PM10, PM5.0, PM2.5 & PM1.0 in indoor and outdoor environments of residential homes located in north-central India. Build. Environ. 2012, 47, 223–231. [Google Scholar]
- Jia, C.L.; Mickley, L.J.; Sulprizio, M.P.; Dominici, F.; Xu, Y.; Ebisu, K.; Anderson, G.B.; Khan, R.F.A.; Bravo, M.A.; Bell, M.L. Particulate air pollution from wildfires in the western us under climate change. Clim. Chang. 2016, 138, 655–666. [Google Scholar]
- Zhang, Y.L.; Cao, F. Fine particulate matter (PM2.5) in china at a city level. Sci. Rep. 2015, 5, 14884. [Google Scholar] [CrossRef] [PubMed]
- Pui, D.Y.H.; Chen, S.C.; Zuo, Z. PM2.5 in China: Measurements, sources, visibility and health effects, and mitigation. Particuology 2014, 13, 1–26. [Google Scholar] [CrossRef]
- Bano, S.; Pervez, S.; Chow, J.C.; Matawle, J.L.; Watson, J.G.; Sahu, R.K.; Srivastava, A.; Tiwari, S.; Pervez, Y.F.; Deb, M.K. Coarse particle (PM10–2.5) source profiles for emissions from domestic cooking and industrial process in central India. Sci. Total Environ. 2018, 627, 1137–1145. [Google Scholar] [CrossRef] [PubMed]
- National Emissions Inventory (NEI) Data. Available online: https://www.epa.gov/air-emissions-inventories/2014-national-emissions-inventory-nei-data (accessed on 15 April 2018).
- Beijing Continues to Promote Joint Prevention and Control of Air Pollution in the BTH Region. Available online: http://www.zhb.gov.cn/xxgk/gzdt/201702/t20170221_396926.shtml (accessed on 15 April 2018).
- Feng, L.; Liao, W. Legislation, plans, and policies for prevention and control of air pollution in China: Achievements, challenges, and improvements. J. Clean. Prod. 2015, 112, 1549–1558. [Google Scholar] [CrossRef]
- Helfand, W.H.; Lazarus, J.; Theerman, P. Donora, Pennsylvania: An environmental disaster of the 20th century. Am. J. Public Health 2001, 91, 553. [Google Scholar] [PubMed]
- Jin, Y.; Andersson, H.; Zhang, S. Air pollution control policies in China: A retrospective and prospects. Int. J. Environ. Res. Public Health 2016, 13, 1219. [Google Scholar] [CrossRef] [PubMed]
- Bhave, P.P.; Kulkarni, N. Air pollution and control legislation in India. J. Inst. Eng. 2015, 96, 259–265. [Google Scholar] [CrossRef]


| Statistic | China | India | U.S. | |||||||||
|---|---|---|---|---|---|---|---|---|---|---|---|---|
| 2014 | 2015 | 2016 | 2017 | 2014 | 2015 | 2016 | 2017 | 2014 | 2015 | 2016 | 2017 | |
| Average PM2.5 Concentration (μg m−3) | ||||||||||||
| Mean | 45.19 | 47.60 | 44.74 | 41.62 | 79.70 | 51.29 | 88.26 | 72.13 | 9.20 | 8.85 | 7.92 | 7.94 |
| Std. Dev. | 17.69 | 19.75 | 18.79 | 19.45 | 49.91 | 34.00 | 52.82 | 28.98 | 2.32 | 2.45 | 1.89 | 2.50 |
| Minimum | 9.68 | 11.25 | 13.99 | 6.03 | 19.63 | 15.16 | 21.77 | 25.50 | 4.48 | 3.53 | 4.11 | 2.79 |
| Median | 41.57 | 41.30 | 38.52 | 37.61 | 63.79 | 39.66 | 71.95 | 67.30 | 8.95 | 8.50 | 7.76 | 7.67 |
| Maximum | 107.95 | 121.71 | 122.11 | 126.02 | 536.50 | 242.76 | 309.56 | 137.86 | 20.91 | 17.57 | 17.58 | 21.64 |
| NOMs * | 1041 | 1568 | 1568 | 1568 | 5 | 5 | 40 | 92 | 750 | 758 | 736 | 706 |
| Percentage of days attaining targets (%) | ||||||||||||
| IT-1 (35 μg m−3) ** | 30 | 32 | 41 | 46 | 11 | 37 | 11 | 8 | 100 | 100 | 100 | 100 |
| IT-2 (25 μg m−3) ** | 8 | 3 | 5 | 15 | 1 | 18 | 1 | 0 | 100 | 100 | 100 | 100 |
| IT-3 (15 μg m−3) ** | 3 | 1 | 0 | 2 | 0 | 0 | 0 | 0 | 98 | 98 | 99 | 98 |
| Statistic | China | India | U.S. | |||||||||
|---|---|---|---|---|---|---|---|---|---|---|---|---|
| 2014 | 2015 | 2016 | 2017 | 2014 | 2015 | 2016 | 2017 | 2014 | 2015 | 2016 | 2017 | |
| Average PM10 concentration (μg m−3) | ||||||||||||
| Mean | 77.08 | 81.85 | 78.75 | 75.10 | 103.35 | 99.83 | 155.58 | 136.31 | 19.54 | 19.28 | 18.08 | 19.03 |
| Std. Dev. | 27.16 | 27.27 | 27.71 | 28.76 | 20.11 | 17.74 | 88.68 | 46.28 | 5.87 | 6.34 | 5.10 | 7.47 |
| Minimum | 23.42 | 22.75 | 29.68 | 15.07 | 49.87 | 56.58 | 44.66 | 46.82 | 9.16 | 8.23 | 8.22 | 7.94 |
| Median | 72.58 | 76.00 | 72.41 | 71.37 | 102.65 | 101.48 | 152.24 | 139.43 | 18.70 | 18.24 | 17.40 | 17.95 |
| Maximum | 159.71 | 178.34 | 175.48 | 211.62 | 182.82 | 163.55 | 646.35 | 250.15 | 58.35 | 57.29 | 41.35 | 61.06 |
| NOMs * | 1041 | 1568 | 1568 | 1568 | 573 | 573 | 40 | 92 | 468 | 429 | 412 | 378 |
| Percentage of days attaining targets (%) | ||||||||||||
| IT-1 (70 μg m−3) ** | 44 | 41 | 46 | 48 | 2 | 4 | 19 | 9 | 100 | 100 | 100 | 100 |
| IT-2 (50 μg m−3) ** | 13 | 6 | 9 | 15 | 0 | 0 | 1 | 1 | 99 | 99 | 100 | 99 |
| IT-3 (30 μg m−3) ** | 3 | 1 | 0 | 2 | 0 | 0 | 0 | 0 | 96 | 95 | 98 | 94 |
| PM2.5 | PM10 | |||||||||
|---|---|---|---|---|---|---|---|---|---|---|
| 2014 | 2015 | 2016 | 2017 | Average | 2014 | 2015 | 2016 | 2017 | Average | |
| China | 0.39 | 0.42 | 0.42 | 0.47 | 0.43 | 0.35 | 0.33 | 0.35 | 0.38 | 0.36 |
| BTH | 0.82 | 0.87 | 0.91 | 0.85 | 0.72 | 0.67 | 0.70 | 0.74 | 0.75 | 0.87 |
| CY | 0.59 | 0.69 | 0.62 | 0.78 | 0.61 | 0.54 | 0.60 | 0.57 | 0.68 | 0.68 |
| PRD | 0.59 | 0.63 | 0.59 | 0.62 | 0.56 | 0.53 | 0.56 | 0.56 | 0.58 | 0.61 |
| YRD | 0.54 | 0.64 | 0.65 | 0.64 | 0.57 | 0.54 | 0.56 | 0.59 | 0.56 | 0.63 |
| India | 0.63 | 0.66 | 0.60 | 0.40 | 0.61 | 0.19 | 0.18 | 0.57 | 0.34 | 0.45 |
| Chennai | 0.59 | 0.71 | 0.80 | 1.49 | 1.41 | 0.49 | 0.61 | * | * | 0.55 |
| Delhi | 0.90 | 0.99 | 0.98 | 0.96 | 0.98 | 0.52 | 0.48 | 0.69 | 0.76 | 0.73 |
| Hyderabad | 0.61 | 0.60 | 0.68 | 0.89 | 0.81 | 0.43 | 0.45 | 0.42 | 0.71 | 0.67 |
| Kolkata | 0.91 | 1.26 | 0.95 | 0.90 | 1.00 | 0.65 | 0.63 | 1.05 | 0.85 | 0.93 |
| Mumbai | 0.72 | 1.11 | 1.03 | 0.97 | 0.99 | 0.59 | 0.64 | 0.87 | 0.78 | 0.82 |
| U.S. | 0.25 | 0.28 | 0.24 | 0.32 | 0.28 | 0.30 | 0.33 | 0.28 | 0.39 | 0.33 |
| BosWash | 0.58 | 0.63 | 0.56 | 0.58 | 0.60 | 0.66 | 0.64 | 0.71 | 0.61 | 0.67 |
| SanSan | 0.87 | 0.76 | 0.64 | 0.59 | 0.75 | 0.90 | 0.80 | 0.73 | 0.68 | 0.81 |
© 2018 by the authors. Licensee MDPI, Basel, Switzerland. This article is an open access article distributed under the terms and conditions of the Creative Commons Attribution (CC BY) license (http://creativecommons.org/licenses/by/4.0/).
Share and Cite
Yang, X.; Jiang, L.; Zhao, W.; Xiong, Q.; Zhao, W.; Yan, X. Comparison of Ground-Based PM2.5 and PM10 Concentrations in China, India, and the U.S. Int. J. Environ. Res. Public Health 2018, 15, 1382. https://0-doi-org.brum.beds.ac.uk/10.3390/ijerph15071382
Yang X, Jiang L, Zhao W, Xiong Q, Zhao W, Yan X. Comparison of Ground-Based PM2.5 and PM10 Concentrations in China, India, and the U.S. International Journal of Environmental Research and Public Health. 2018; 15(7):1382. https://0-doi-org.brum.beds.ac.uk/10.3390/ijerph15071382
Chicago/Turabian StyleYang, Xingchuan, Lei Jiang, Wenji Zhao, Qiulin Xiong, Wenhui Zhao, and Xing Yan. 2018. "Comparison of Ground-Based PM2.5 and PM10 Concentrations in China, India, and the U.S." International Journal of Environmental Research and Public Health 15, no. 7: 1382. https://0-doi-org.brum.beds.ac.uk/10.3390/ijerph15071382