Waterborne Disease Outbreak Detection: A Simulation-Based Study

 ,
,
Abstract
:1. Introduction
2. Materials and Methods
2.1. Study Area and Period
2.2. Reference Health Data
2.3. Simulation Study
2.4. Simulation of Baseline Data
- (1)
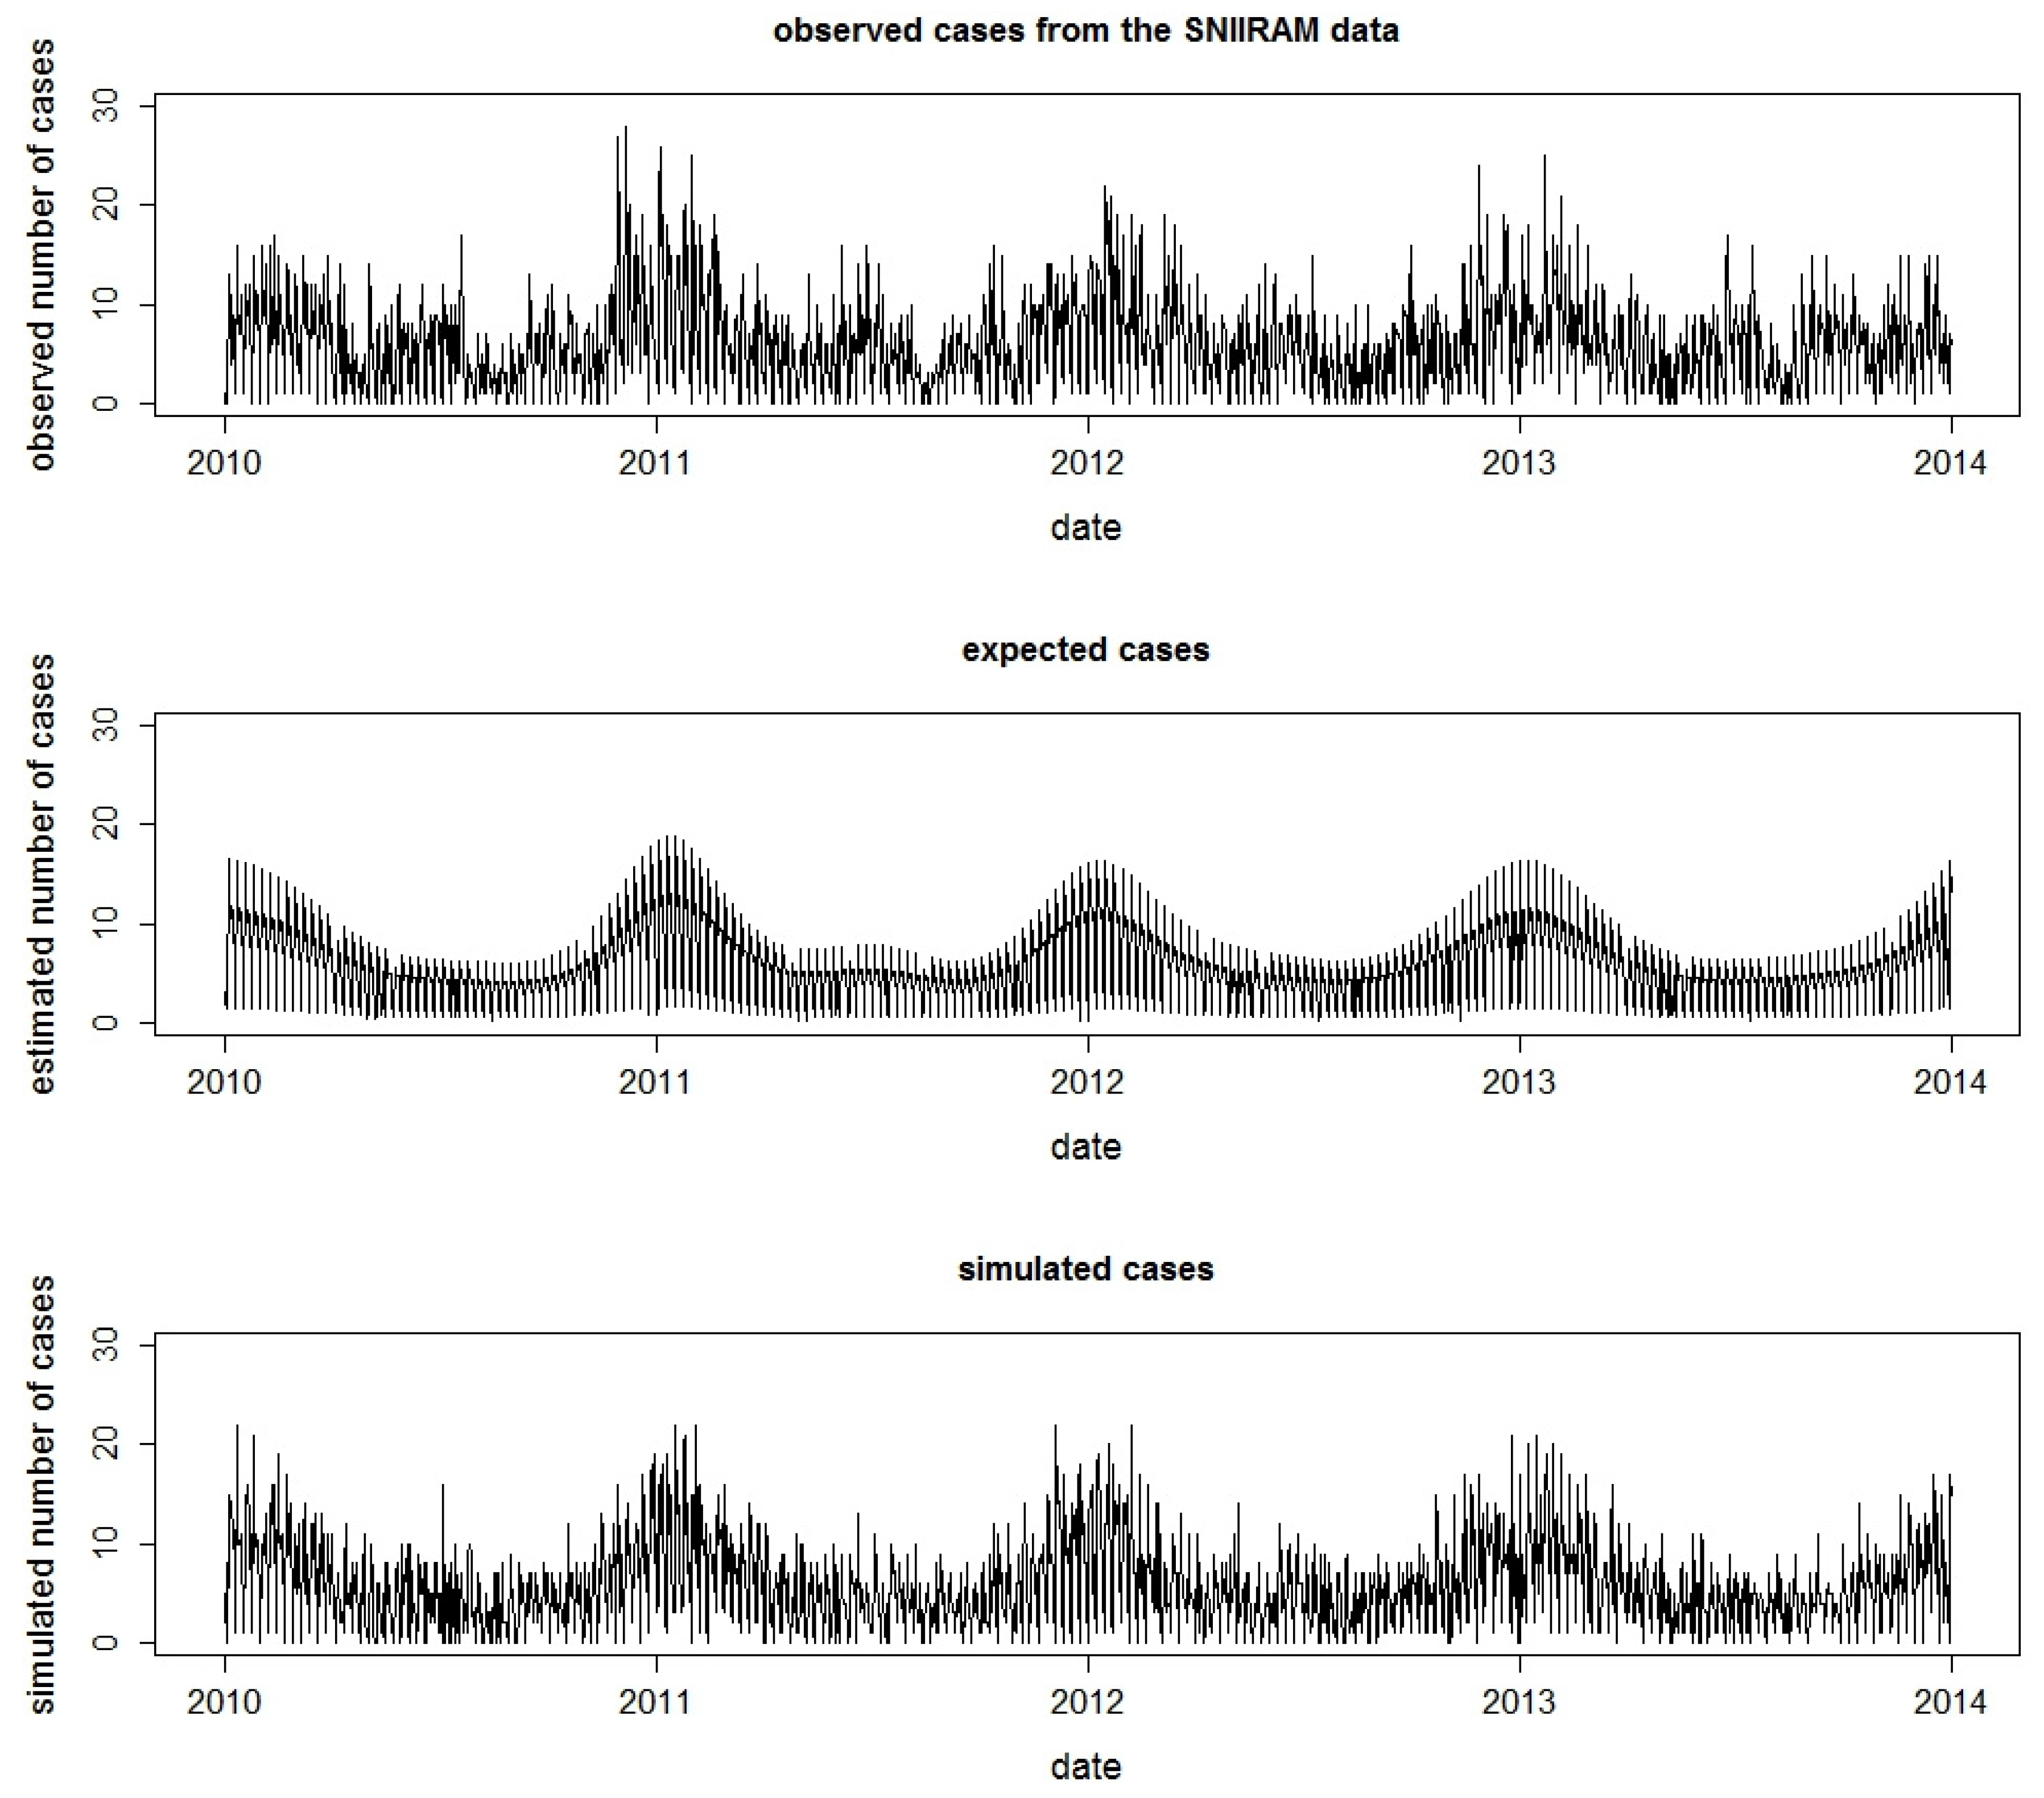
- A Poisson regression was used to model the daily observed counts of AGI at the département level (SNIIRAM data). A thin-plate regression spline [20] was used to model trend and seasonality in order to account for the seasonality of the AGI, in particular the variability of winter viral pandemic of AGI. Adjustments were made for days of the week and holidays [21].
- (2)
- The estimated expected values obtained from the regression model at (1) were then distributed at the zip code level in proportion to the number of cases observed in the SNIIRAM data. Finally, to introduce stochasticity, daily counts of AGI cases were simulated using a negative binomial distribution [15,21] (Figure 2).
2.5. The Simulation Process of Waterborne Disease Outbreaks
- DZs were randomly selected. DZs servicing fewer than 200 inhabitants were excluded from the simulation study to ensure statistical power of detection and because of their reduced impact on public health.
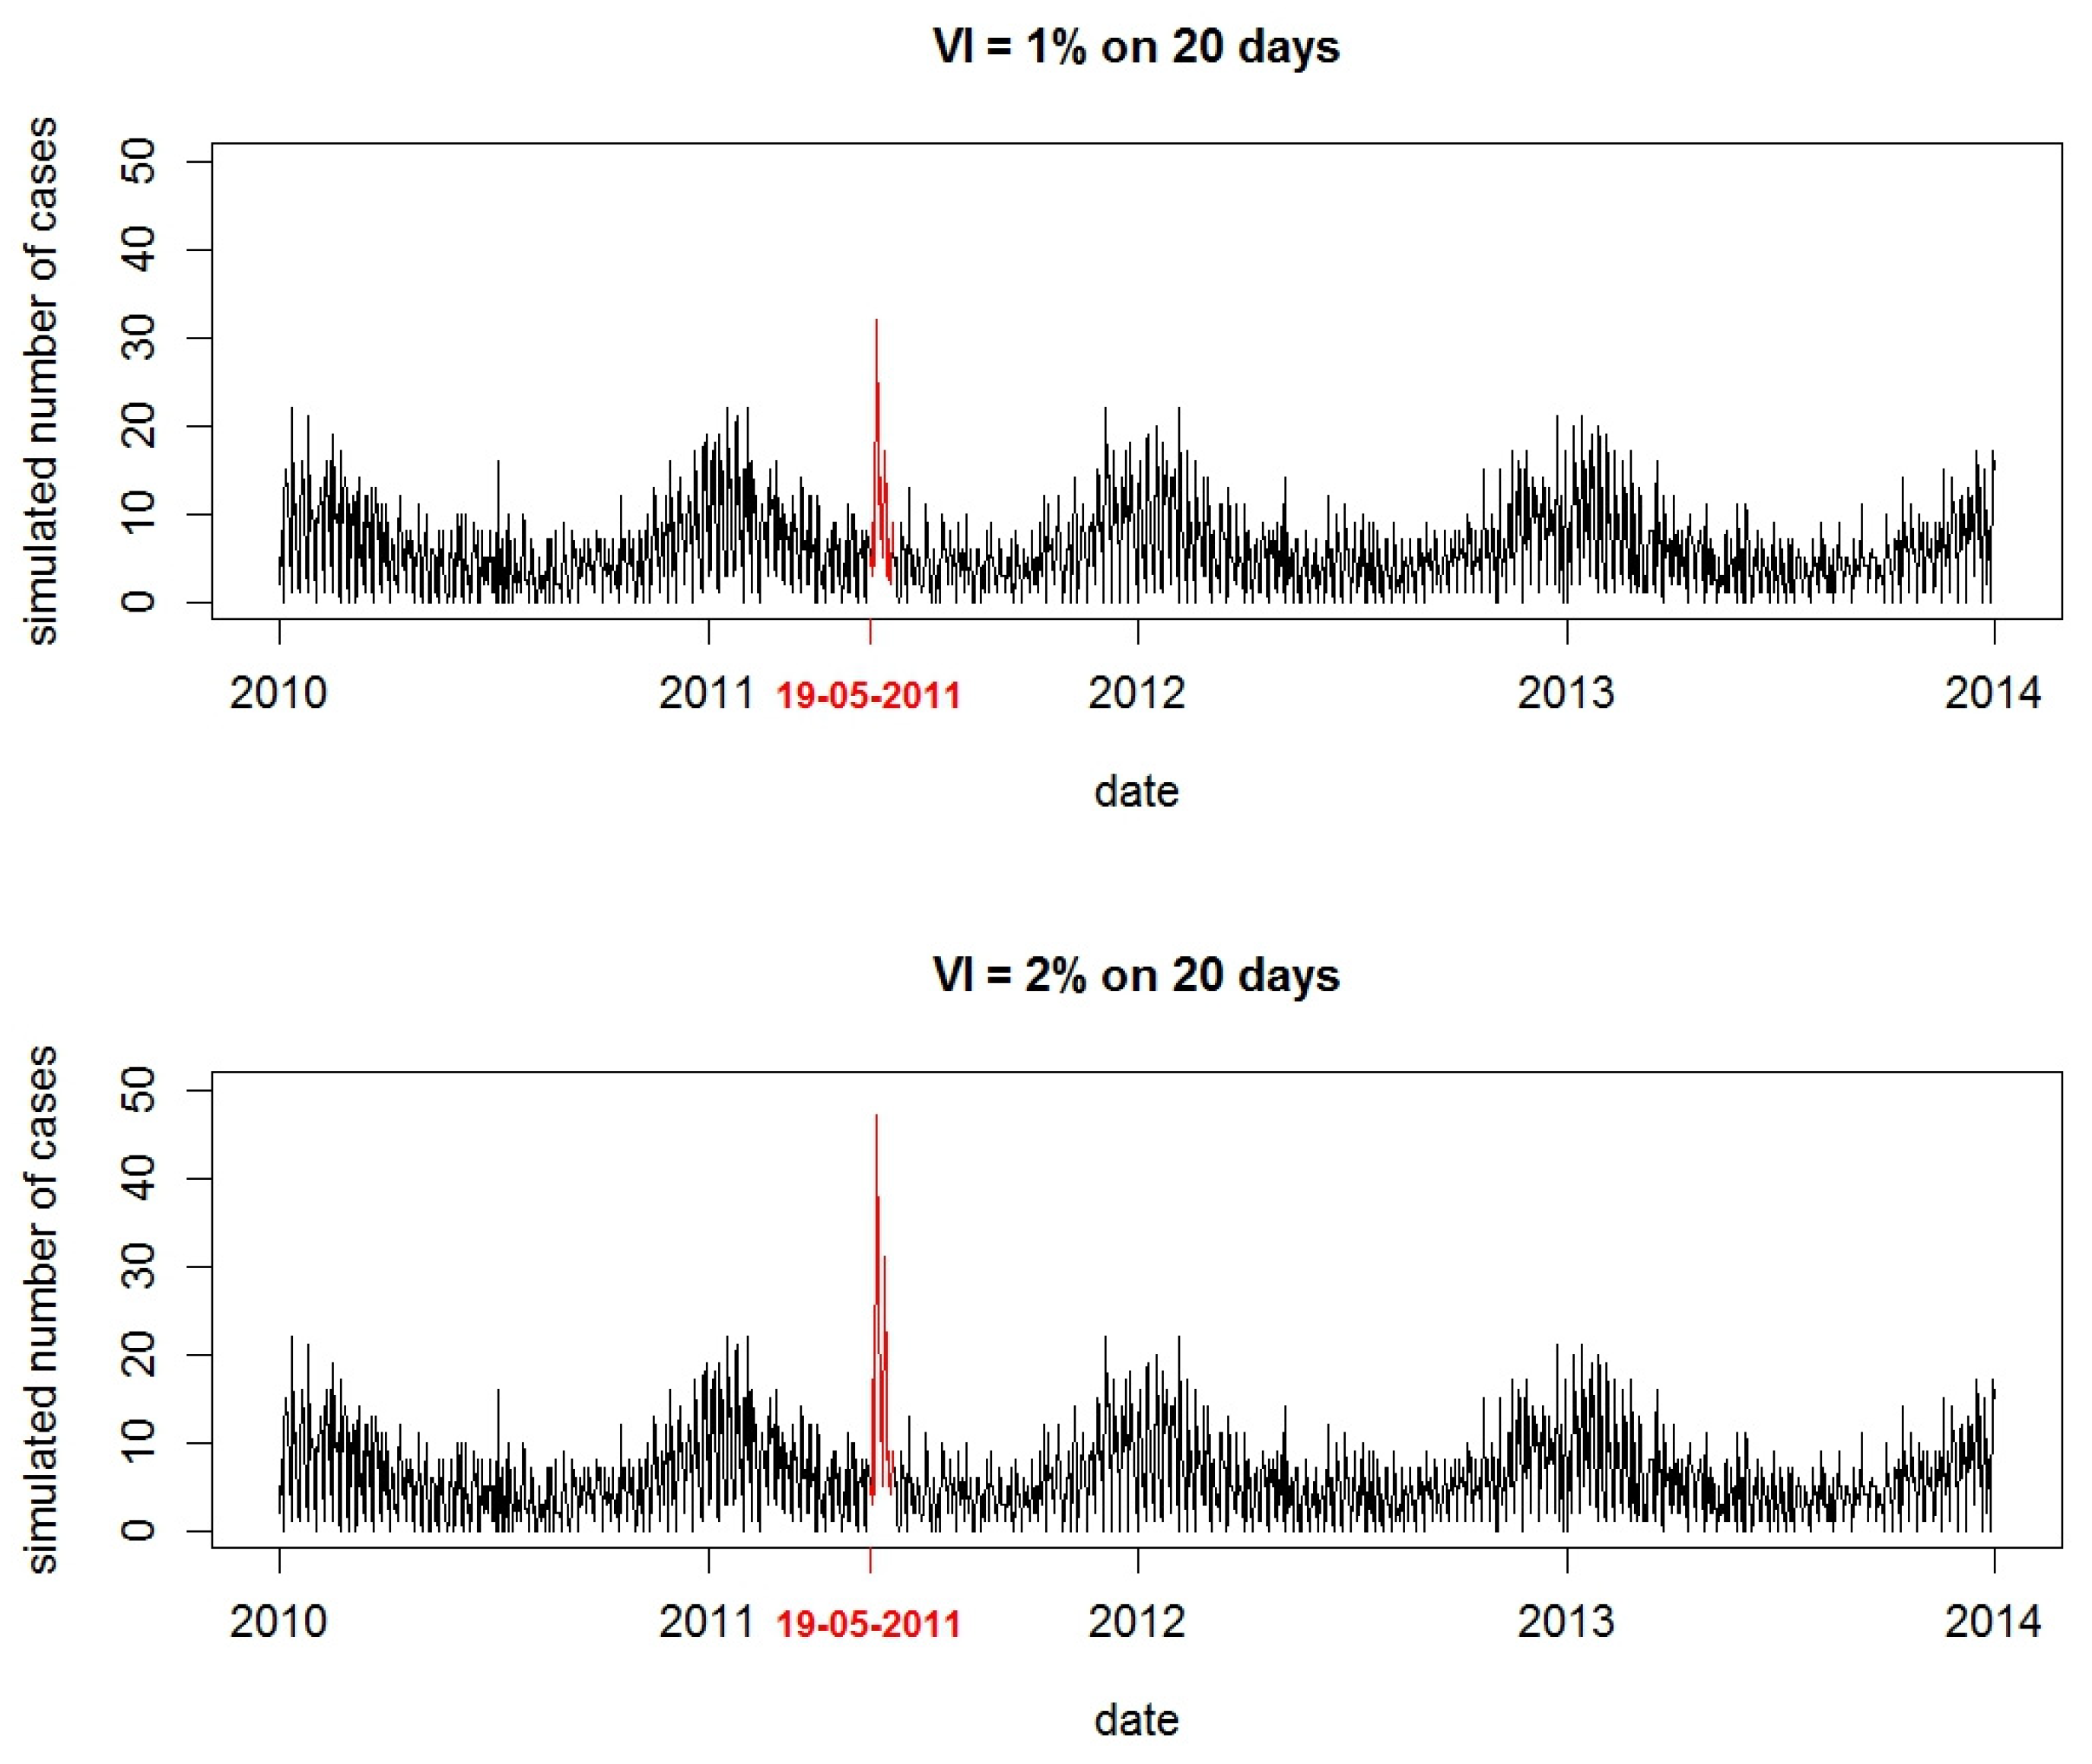
- For each simulation, the variation of incidence ratio (VI), defined as the proportion between the number of outbreak AGI cases and the number of expected cases of AGI (baseline data) during the outbreak period, was randomly selected between 0.5% and 6%. These values were chosen according to what we observed in previous WBDOs [10].
- The outbreak duration was randomly selected between 3 and 28 days in accordance with the observed values in reported WBDOs [6].
- The outbreak size, that is, the number of AGI cases in the outbreak, was generated by multiplying the VI by the number of inhabitants serviced by the DZ.
- Finally, outbreak cases were distributed over time according to a log-normal distribution [15,21] (Figure 3). The parameters of the log-normal distribution used to shape the time distribution of the outbreak AGI cases were randomly chosen between 0.33 and 0.5 for the median, and fixed at 0.5 for the standard deviation [10,21]. When the selected DZ serviced more than one zip code, daily cases in the AGI outbreak were then distributed according to the proportion of inhabitants serviced by the DZ in each zip code.
2.6. Detection of Simulated Waterborne Disease Outbreaks
2.7. Data Analysis
2.7.1. Evaluation Method
2.7.2. Factors Associated with WBDO Detection
3. Results
3.1. Description of Simulated WBDO
3.2. Sensitivity and Positive Predictive Value of the Detection Method
3.3. Factors Associated with WBDO Detection
4. Discussion
4.1. Simulation Process
4.2. Algorithm Performance for WBDO Detection
4.3. Factors Influencing Detection
4.4. International Comparison
5. Conclusions
Author Contributions
Funding
Acknowledgments
Conflicts of Interest
References
- Craun, G.F.; Brunkard, J.M.; Yoder, J.S.; Roberts, V.A.; Carpenter, J.; Wade, T.; Calderon, R.L.; Roberts, J.M.; Beach, M.J.; Roy, S.L. Causes of outbreaks associated with drinking water in the United States from 1971 to 2006. Clin. Microbiol. Rev. 2010, 23, 507–528. [Google Scholar] [CrossRef] [PubMed]
- Hrudey, S.E.; Hrudey, E.J. Safe Drinking Water: Lessons from Recent Outbreaks in Affluent Nations; IWA Publishing: London, UK, 2004. [Google Scholar]
- Widerstrom, M.; Schonning, C.; Lilja, M.; Lebbad, M.; Ljung, T.; Allestam, G.; Ferm, M.; Bjorkholm, B.; Hansen, A.; Hiltula, J.; et al. Large outbreak of Cryptosporidium hominis infection transmitted through the public water supply, Sweden. Emerg. Infect. Dis. 2014, 20, 581–589. [Google Scholar] [CrossRef] [PubMed]
- Rehn, M.; Wallensten, A.; Widerstrom, M.; Lilja, M.; Grunewald, M.; Stenmark, S.; Kark, M.; Lindh, J. Post-infection symptoms following two large waterborne outbreaks of Cryptosporidium hominis in Northern Sweden, 2010–2011. BMC Public Health 2015, 15, 529. [Google Scholar] [CrossRef] [PubMed]
- MacKenzie, W.R.; Schell, W.L.; Blair, K.A.; Addiss, D.G.; Peterson, D.E.; Hoxie, N.J.; Kazmierczak, J.J.; Davis, J.P. Massive outbreak of waterborne cryptosporidium infection in Milwaukee, Wisconsin: Recurrence of illness and risk of secondary transmission. Clin. Infect. Dis. 1995, 21, 57–62. [Google Scholar] [CrossRef] [PubMed]
- Beaudeau, P.; De Valk, H.; Vaillant, V.; Mannschott, C.; Tillier, C.; Mouly, D.; Ledrans, M. Lessons learned from ten investigations of waterborne gastroenteritis outbreaks, France, 1998–2006. J. Water Health 2008, 6, 491–503. [Google Scholar] [CrossRef] [PubMed] [Green Version]
- Bounoure, F.; Beaudeau, P.; Mouly, D.; Skiba, M.; Lahiani-Skiba, M. Syndromic surveillance of acute gastroenteritis based on drug consumption. Epidemiol. Infect. 2011, 139, 1388–1395. [Google Scholar] [CrossRef] [PubMed]
- Beaudeau, P. Syndromic Surveillance of Acute Gastroenteritis: An Opportunity for the Prevention of the Infectious Risk Attributable to Tap Water. Ph.D. Thesis, Université de Rennes, Rennes, France, 2012. [Google Scholar]
- Beaudeau, P.; Le Tertre, A.; Zeghnoun, A.; Zanobetti, A.; Schwartz, J. A time series study of drug sales and turbidity of tap water in Le Havre, France. J. Water Health 2012, 10, 221–235. [Google Scholar] [CrossRef] [PubMed] [Green Version]
- Mouly, D.; Van Cauteren, D.; Vincent, N.; Vaissiere, E.; Beaudeau, P.; Ducrot, C.; Gallay, A. Description of two waterborne disease outbreaks in France: A comparative study with data from cohort studies and from health administrative databases. Epidemiol. Infect. 2016, 144, 591–601. [Google Scholar] [CrossRef] [PubMed]
- Coly, S.; Vincent, N.; Vaissiere, E.; Charras-Garridol, M.; Gallay, A.; Ducrot, C.; Mouly, D. Waterborne disease outbreaks detection: An integrated approach using health administrative databases. J. Water Health 2017. [Google Scholar] [CrossRef] [PubMed]
- Kulldorff, M.; Heffernan, R.; Hartman, J.; Assuncao, R.; Mostashari, F. A space-time permutation scan statistic for disease outbreak detection. PLoS Med. 2005, 2, e59. [Google Scholar] [CrossRef] [PubMed] [Green Version]
- Rambaud, L.; Galey, C.; Beaudeau, P. Automated detection of case clusters of waterborne acute gastroenteritis from health insurance data—Pilot study in three French districts. J. Water Health 2016, 14, 306–316. [Google Scholar] [CrossRef] [PubMed]
- Goria, S.; Mouly, D.; Rambaud, L.; Guillet, A.; Beaudeau, P.; Galey, C. Evaluation of Different Methods of Detection of Aggregates of Cases of Medicalized Acute Waterborne Gastroenteritis; Santé Publique France: Saint Maurice, France, 2017. [Google Scholar]
- Noufaily, A.; Enki, D.G.; Farrington, P.; Garthwaite, P.; Andrews, N.; Charlett, A. An improved algorithm for outbreak detection in multiple surveillance systems. Stat. Med. 2013, 32, 1206–1222. [Google Scholar] [CrossRef] [PubMed]
- Buckeridge, D.L.; Jauvin, C.; Okhmatovskaia, A.; Verma, A.D. Simulation Analysis Platform (SnAP): A tool for evaluation of public health surveillance and disease control strategies. Annu. Symp. Proc. 2011, 2011, 161–170. [Google Scholar]
- Insee. Available online: https://www.insee.fr (accessed on 8 December 2015).
- Tuppin, P.; Rudant, J.; Constantinou, P.; Gastaldi-Ménager, C.; Rachas, A.; De Roquefeuil, L.; Maura, G.; Caillol, H.; Tajahmady, A.; Coste, J.; et al. Value of a national administrative database to guide public decisions: From the système national d’information interrégimes de l’Assurance Maladie (SNIIRAM) to the système national des donneés de santé (SNDS) in France. J. Epidemiol. Community Health 2017, 65S, 149–167. [Google Scholar] [CrossRef] [PubMed]
- Van Cauteren, D.; De Valk, H.; Vaux, S.; Le Strat, Y.; Vaillant, V. Burden of acute gastroenteritis and healthcare-seeking behaviour in France: A population-based study. Epidemiol. Infect. 2012, 140, 697–705. [Google Scholar] [CrossRef] [PubMed]
- Wood, S.N. Generalized Additive Models: An Introduction with R; Chapman and Hall: Boca Raton, FL, USA, 2006. [Google Scholar]
- Buckeridge, D.L.; Okhmatovskaia, A.; Tu, S.; O’Connor, M.; Nyulas, C.; Musen, M.A. Predicting outbreak detection in public health surveillance: Quantitative analysis to enable evidence-based method selection. Annu. Symp. Proc. 2008, 15, 76–80. [Google Scholar]
- French Ministry of Health. French Database on Public Drinking Water Quality; French Ministry of Health: Paris, France, 2011.
- Kulldorff, M. SaTScanTM v8.0: Software for the Spatial and Space-Time Scan Statistics; Information Management Services, Inc.: Calverton, MD, USA, 2006. [Google Scholar]
- Okhmatovskaia, A.; Verma, A.D.; Barbeau, B.; Carriere, A.; Pasquet, R.; Buckeridge, D.L. A simulation model of waterborne gastro-intestinal disease outbreaks: Description and initial evaluation. Annu. Symp. Proc. 2010, 2010, 557–561. [Google Scholar]
- Morrison, K.; Charland, K.; Okhmatovskaia, A.; Buckeridge, D. A Framework for Detecting and Classifying Outbreaks of Gastrointestinal Disease. Online J. Public Health Inform. 2013, 5. [Google Scholar] [CrossRef] [Green Version]


| Variables | n | Both départments | Puy-de-Dôme | Isère | ||||||||||||
|---|---|---|---|---|---|---|---|---|---|---|---|---|---|---|---|---|
| Total | Detected | % | Undetected | % | Total | Detected | % | Undetected | % | Total | Detected | % | Undetected | % | ||
| 2000 | 1460 | 540 | 1000 | 726 | 274 | 1000 | 734 | 266 | ||||||||
| DZ size (number of inhabitants served by DZ) | ||||||||||||||||
| 200–500 | 715 | 353 | 49.4 | 362 | 50.6 | 385 | 201 | 52.2 | 184 | 47.8 | 330 | 152 | 46.1 | 178 | 53.9 | |
| 501–1000 | 437 | 330 | 75.5 | 107 | 24.5 | 204 | 153 | 75.0 | 51 | 25.0 | 233 | 177 | 76.0 | 56 | 24.0 | |
| 1001–2000 | 309 | 264 | 85.4 | 45 | 14.6 | 128 | 107 | 83.6 | 21 | 16.4 | 181 | 157 | 86.7 | 24 | 13.3 | |
| 200–10,000 | 421 | 396 | 94.1 | 25 | 5.9 | 188 | 171 | 91.0 | 17 | 9.0 | 233 | 225 | 96.6 | 8 | 3.4 | |
| >10,000 | 118 | 117 | 99.2 | 1 | 0.8 | 95 | 94 | 98.9 | 1 | 1.1 | 23 | 23 | 100.0 | 0 | 0.0 | |
| Outbreak size (number of simulated cases of AGI) | ||||||||||||||||
| Min | 1 | 5 | 1 | 2 | 6 | 2 | 1 | 5 | 1 | |||||||
| p10 | 5 | 11 | 2 | 5 | 11 | 2 | 5 | 12 | 2 | |||||||
| Median | 22 | 38 | 6 | 22 | 35 | 6 | 23 | 39 | 6 | |||||||
| Mean | 96.2 | 128.8 | 8.1 | 122.5 | 165.3 | 8.9 | 69.9 | 92.6 | 7.3 | |||||||
| p90 | 199 | 271 | 14 | 255 | 412 | 15 | 140 | 187 | 14 | |||||||
| Max | 7392 | 7392 | 133 | 5551 | 5551 | 133 | 7392 | 7392 | 33 | |||||||
| Duration (days) | ||||||||||||||||
| Min | 3 | 3 | 3 | 3 | 3 | 3 | 3 | 3 | 3 | |||||||
| Median | 16 | 15 | 17 | 15 | 14 | 16 | 16 | 15 | 18 | |||||||
| Mean | 15.4 | 15.0 | 16.4 | 15.2 | 14.8 | 16.3 | 15.6 | 15.2 | 16.5 | |||||||
| Max | 28 | 28 | 28 | 28 | 28 | 28 | 28 | 28 | 28 | |||||||
| DZ area (number of municipalities served) | ||||||||||||||||
| 1 | 1466 | 1042 | 71.1 | 424 | 28.9 | 628 | 445 | 70.9 | 183 | 29.1 | 838 | 597 | 71.2 | 241 | 28.8 | |
| >1 | 534 | 418 | 78.3 | 116 | 21.7 | 372 | 281 | 75.5 | 91 | 24.5 | 162 | 137 | 84.6 | 25 | 15.4 | |
| Season | ||||||||||||||||
| Winter | 605 | 414 | 68.4 | 191 | 31.6 | 298 | 199 | 66.8 | 99 | 33.2 | 307 | 215 | 70.0 | 92 | 30.0 | |
| Other seasons | 1395 | 1046 | 75.0 | 349 | 25.0 | 702 | 527 | 75.1 | 175 | 24.9 | 693 | 519 | 74.9 | 174 | 25.1 | |
| Variables | Total | Isère | Puy-de-Dôme | ||||||||||
|---|---|---|---|---|---|---|---|---|---|---|---|---|---|
| Se | PPV | Se | PPV | Se | PPV | ||||||||
| % | N1 | % | N2 | % | N1 | % | N2 | % | N1 | % | N2 | ||
| 73.0 | 2000 | 90.5 | 1614 | 73.4 | 1000 | 89.0 | 825 | 72.6 | 1000 | 92.0 | 789 | ||
| DZ size (number of inhabitants served by DZ) | |||||||||||||
| 200–500 | 49.3 | 715 | 88.0 | 401 | 46.0 | 330 | 82.1 | 185 | 52.2 | 385 | 93.0 | 216 | |
| 501–1000 | 75.5 | 437 | 91.4 | 361 | 75.9 | 233 | 92.6 | 191 | 75.0 | 204 | 90.0 | 170 | |
| 1001–2000 | 85.4 | 309 | 92.9 | 284 | 86.7 | 181 | 91.2 | 172 | 83.5 | 128 | 95.5 | 112 | |
| 2001–10,000 | 94.0 | 421 | 91.4 | 433 | 96.5 | 233 | 89.2 | 252 | 90.9 | 188 | 94.4 | 181 | |
| >10,000 | 99.1 | 118 | 86.6 | 135 | 100.0 | 23 | 92.0 | 25 | 98.9 | 95 | 85.4 | 110 | |
| Outbreak size (number of simulated cases) | |||||||||||||
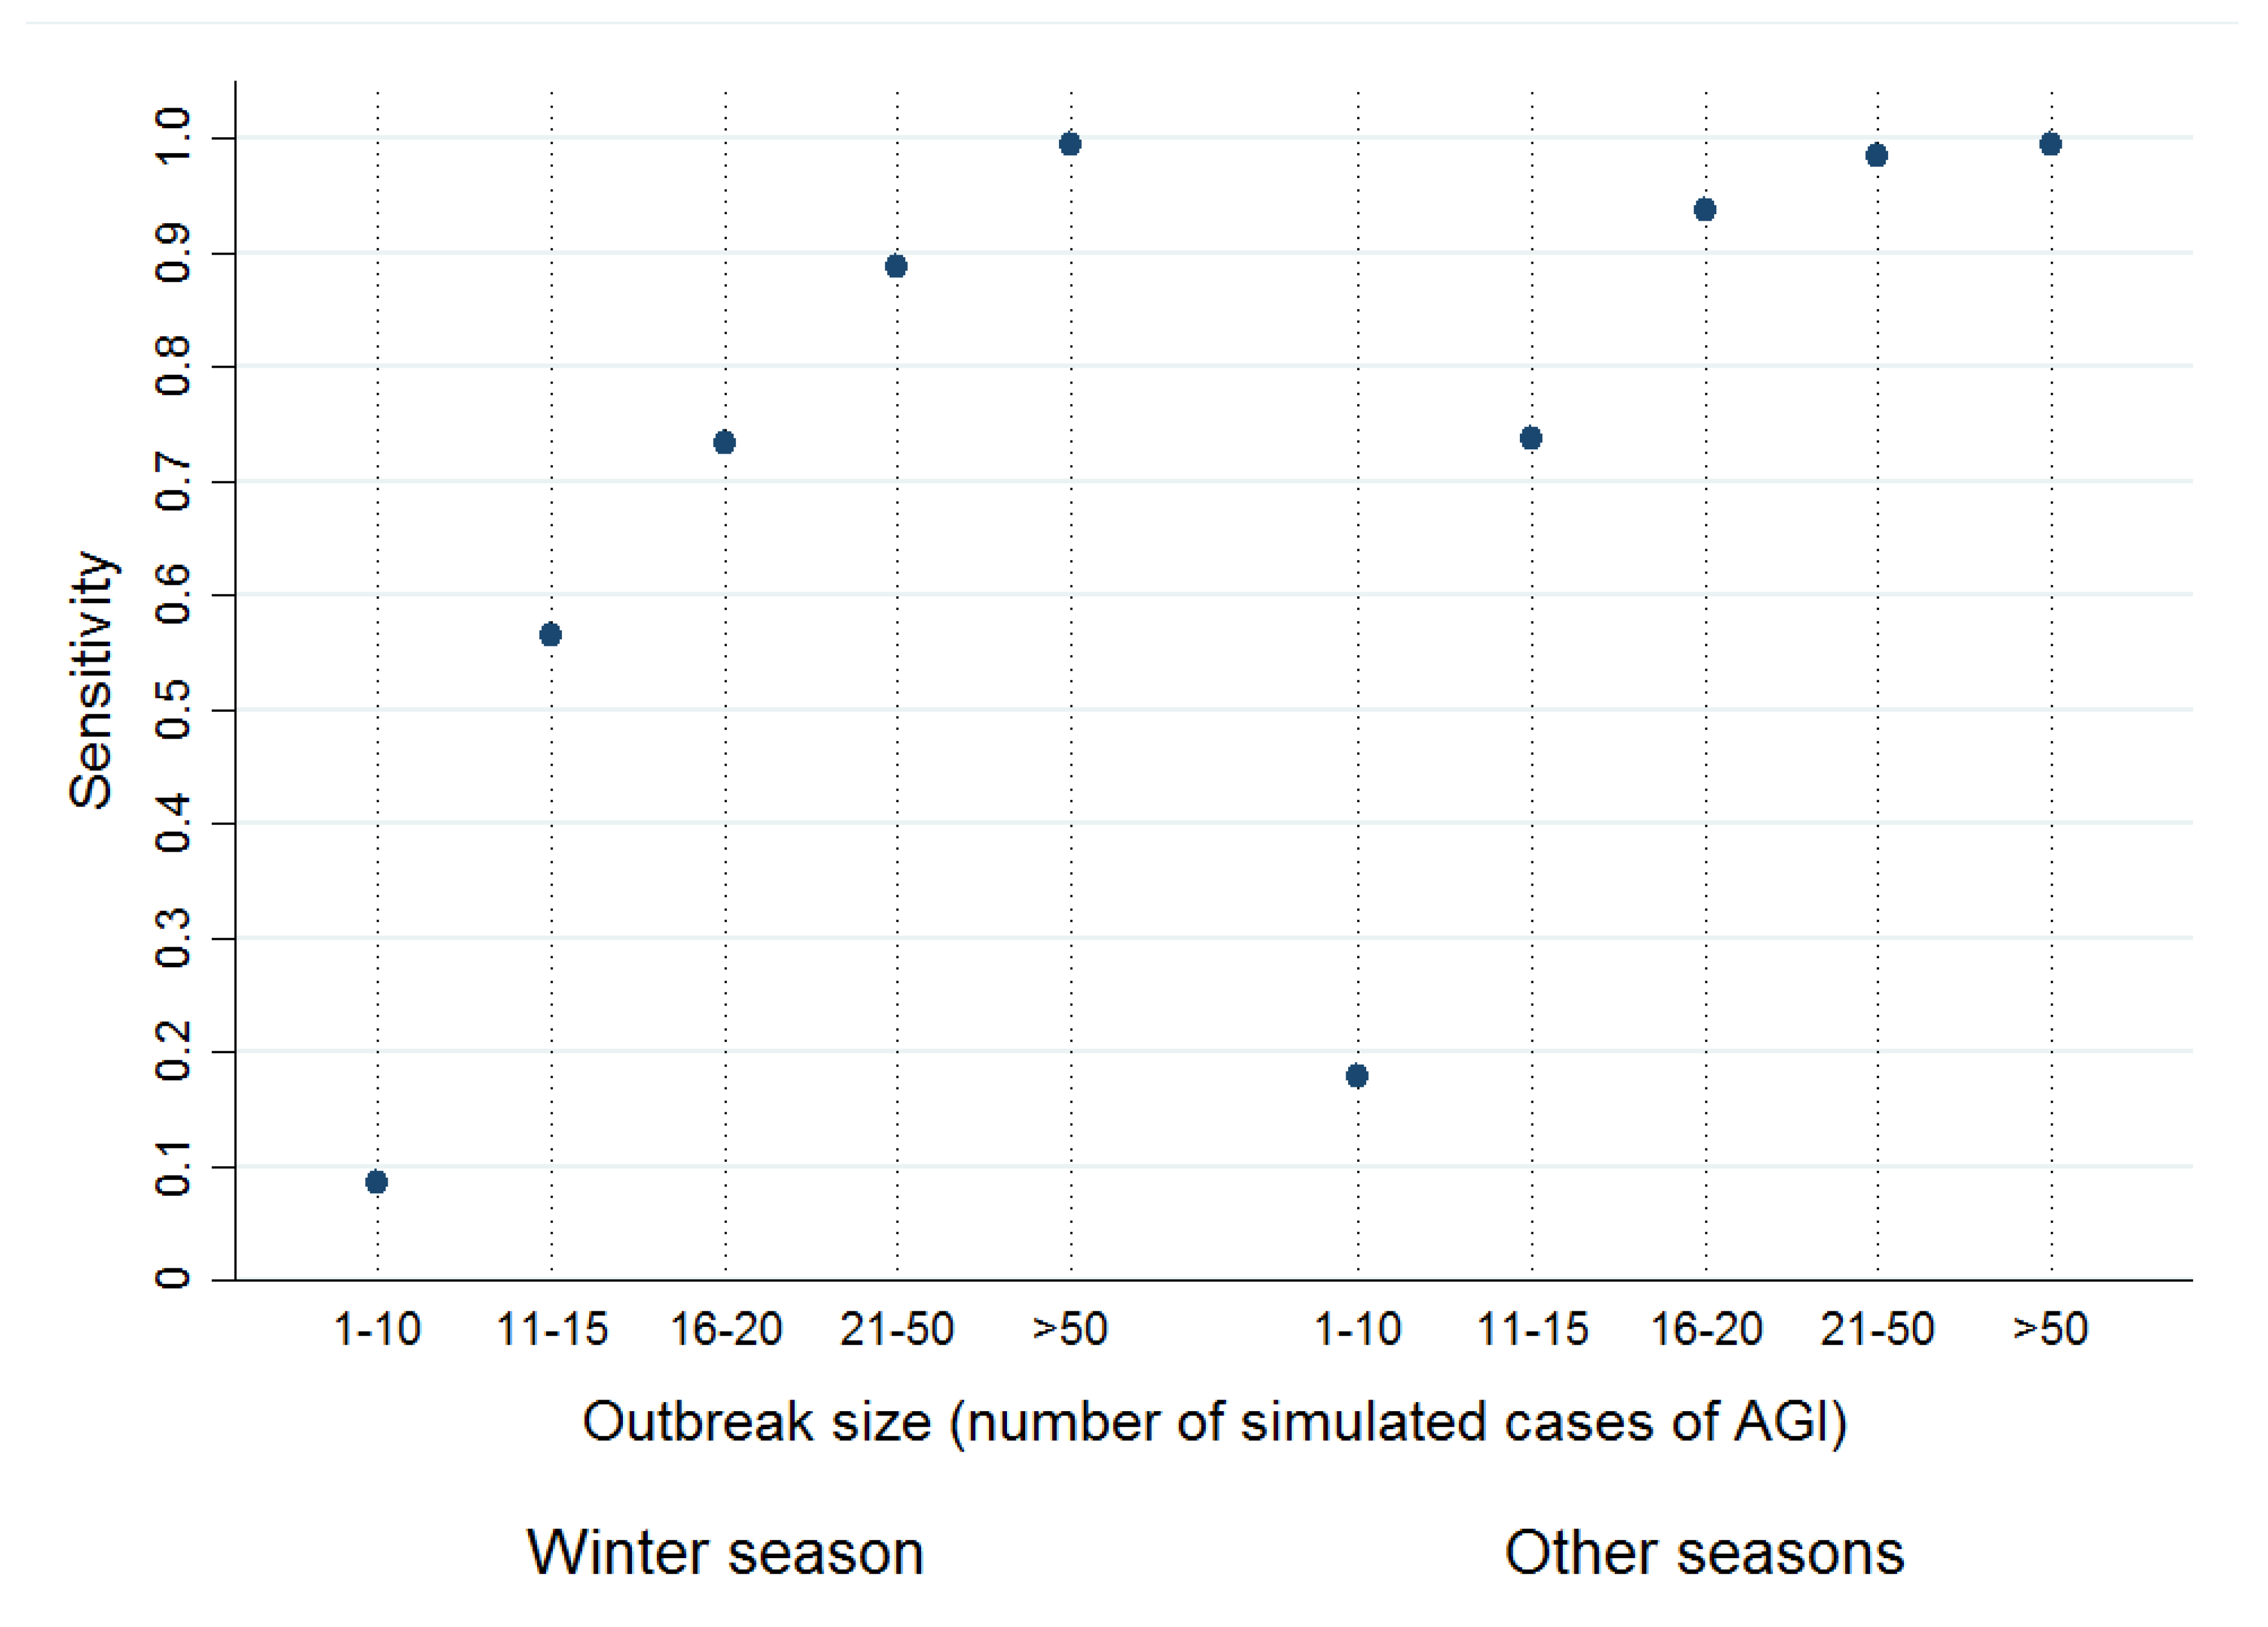
| 1–10 | 15.2 | 466 | 77.1 | 92 | 13.8 | 224 | 77.5 | 40 | 16.5 | 242 | 76.9 | 52 | |
| 11–15 | 68.5 | 312 | 91.4 | 234 | 64.6 | 150 | 85.8 | 113 | 72.2 | 162 | 96.6 | 121 | |
| 16–20 | 86.4 | 170 | 91.8 | 160 | 83.3 | 90 | 90.3 | 83 | 90.0 | 80 | 93.5 | 77 | |
| 21–50 | 95.3 | 449 | 90.8 | 471 | 97.9 | 240 | 89.0 | 264 | 92.3 | 209 | 93.2 | 207 | |
| >50 | 99.5 | 603 | 91.3 | 657 | 100.0 | 296 | 91.0 | 325 | 99.0 | 307 | 91.5 | 332 | |
| Season | |||||||||||||
| Winter * | 68.4 | 605 | 87.7 | 472 | 70.0 | 307 | 84.3 | 255 | 66.7 | 298 | 91.7 | 217 | |
| Other season | 74.9 | 1395 | 91.5 | 1142 | 74.8 | 693 | 91.0 | 570 | 75.0 | 702 | 92.1 | 572 | |
| DZ area (number of municipalities served) | |||||||||||||
| 1 | 71.0 | 1466 | 90.2 | 1155 | 71.2 | 838 | 88.7 | 673 | 70.8 | 628 | 92.3 | 482 | |
| >1 | 78.2 | 534 | 91.0 | 459 | 84.5 | 162 | 90.1 | 152 | 75.5 | 372 | 91.5 | 307 | |
| Variables | VI: 0.5%–2.0% | VI: 2.0%–4.0% | VI: 4.0%–6.0% | |||||||
|---|---|---|---|---|---|---|---|---|---|---|
| n = 642 | IRR | [95% CI] | n = 659 | IRR | [95% CI] | n = 699 | IRR | [95% CI] | ||
| Outbreak size (number of simulated cases) | ||||||||||
| 1–10 | 331 | ref | 129 | ref | 6 | ref | ||||
| 11–15 | 79 | 7.70 | [5.03–11.74] | 130 | 2.01 | [1.55–2.61] | 103 | 1.59 | [0.71–3.58] | |
| 16–20 | 40 | 10.30 | [6.79–15.60] | 51 | 2.62 | [2.02–3.39] | 79 | 1.91 | [0.86–4.28] | |
| 21–50 | 96 | 12.80 | [8.7118.82] | 151 | 2.85 | [2.24–3.62] | 202 | 1.96 | [0.88–4.37] | |
| >50 | 96 | 13.70 | [9.29–20.07] | 198 | 2.92 | [2.30–3.70] | 309 | 2.03 | [0.91–4.53] | |
| Season | ||||||||||
| Winter * | 193 | ref | 193 | ref | 219 | ref | ||||
| Other seasons | 449 | 1.37 | [1.20–1.56] | 466 | 1.11 | [1.03–1.19] | 480 | 1.05 | [1.01–1.10] | |
| Outbreak duration (days) | ||||||||||
| 3–7 | 131 | ref | 136 | ref | 133 | ref | ||||
| 8–14 | 173 | 0.84 | [0.73–0.97] | 180 | 1.00 | [0.92–1.09] | 184 | 0.97 | [0.94–1.01] | |
| 15–21 | 178 | 0.77 | [0.66–0.90] | 170 | 0.89 | [0.81–0.97] | 178 | 0.94 | [0.90–0.99] | |
| 22–28 | 160 | 0.64 | [0.54–0.76] | 173 | 0.89 | [0.81–0.98] | 204 | 0.93 | [0.89–0.97] | |
© 2018 by the authors. Licensee MDPI, Basel, Switzerland. This article is an open access article distributed under the terms and conditions of the Creative Commons Attribution (CC BY) license (http://creativecommons.org/licenses/by/4.0/).
Share and Cite
Mouly, D.; Goria, S.; Mounié, M.; Beaudeau, P.; Galey, C.; Gallay, A.; Ducrot, C.; Le Strat, Y. Waterborne Disease Outbreak Detection: A Simulation-Based Study. Int. J. Environ. Res. Public Health 2018, 15, 1505. https://0-doi-org.brum.beds.ac.uk/10.3390/ijerph15071505
Mouly D, Goria S, Mounié M, Beaudeau P, Galey C, Gallay A, Ducrot C, Le Strat Y. Waterborne Disease Outbreak Detection: A Simulation-Based Study. International Journal of Environmental Research and Public Health. 2018; 15(7):1505. https://0-doi-org.brum.beds.ac.uk/10.3390/ijerph15071505
Chicago/Turabian StyleMouly, Damien, Sarah Goria, Michael Mounié, Pascal Beaudeau, Catherine Galey, Anne Gallay, Christian Ducrot, and Yann Le Strat. 2018. "Waterborne Disease Outbreak Detection: A Simulation-Based Study" International Journal of Environmental Research and Public Health 15, no. 7: 1505. https://0-doi-org.brum.beds.ac.uk/10.3390/ijerph15071505