Rural Versus Urban Patients: Benchmarking the Outcomes of Patients with Acute Myocardial Infarction in Shanxi, China from 2013 to 2017


Abstract
:1. Introduction
2. Methods
2.1. Data Source
2.2. Study Population
2.3. Variables of Interest
2.4. Patient and Hospital Level Covariates
2.5. Statistical Models
3. Results
3.1. Patient Characteristics
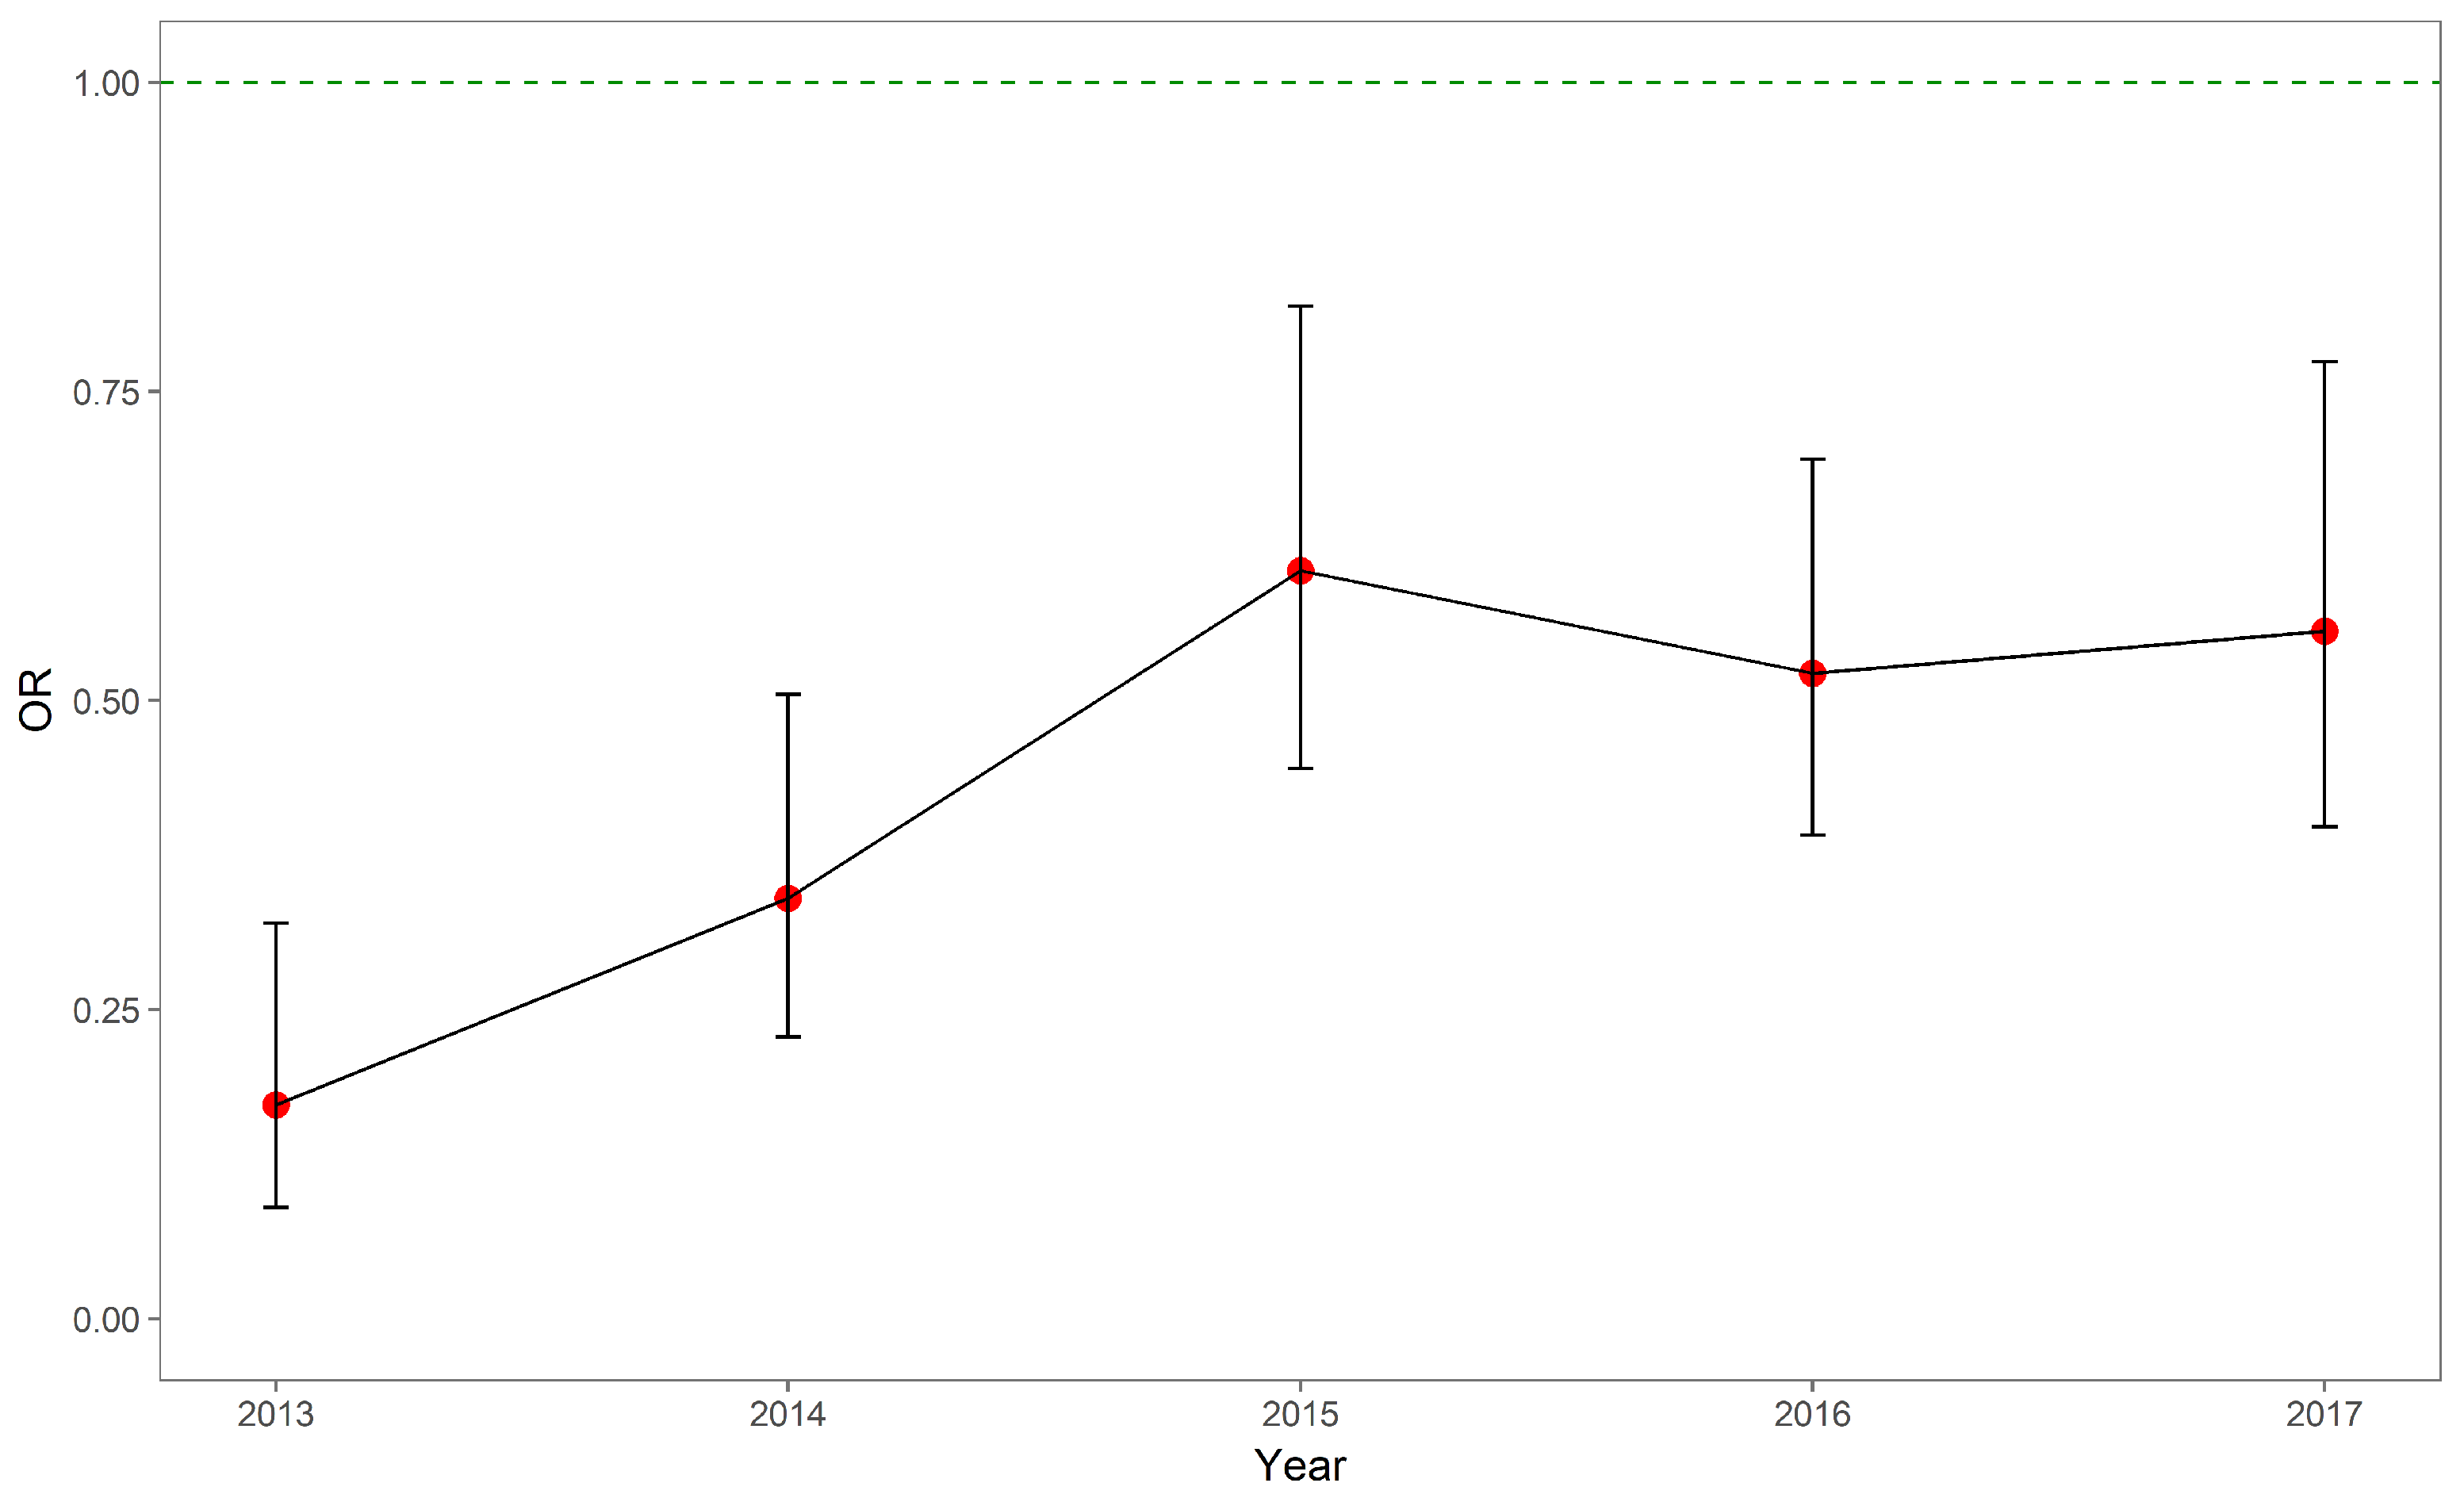
3.2. In-Hospital Mortality
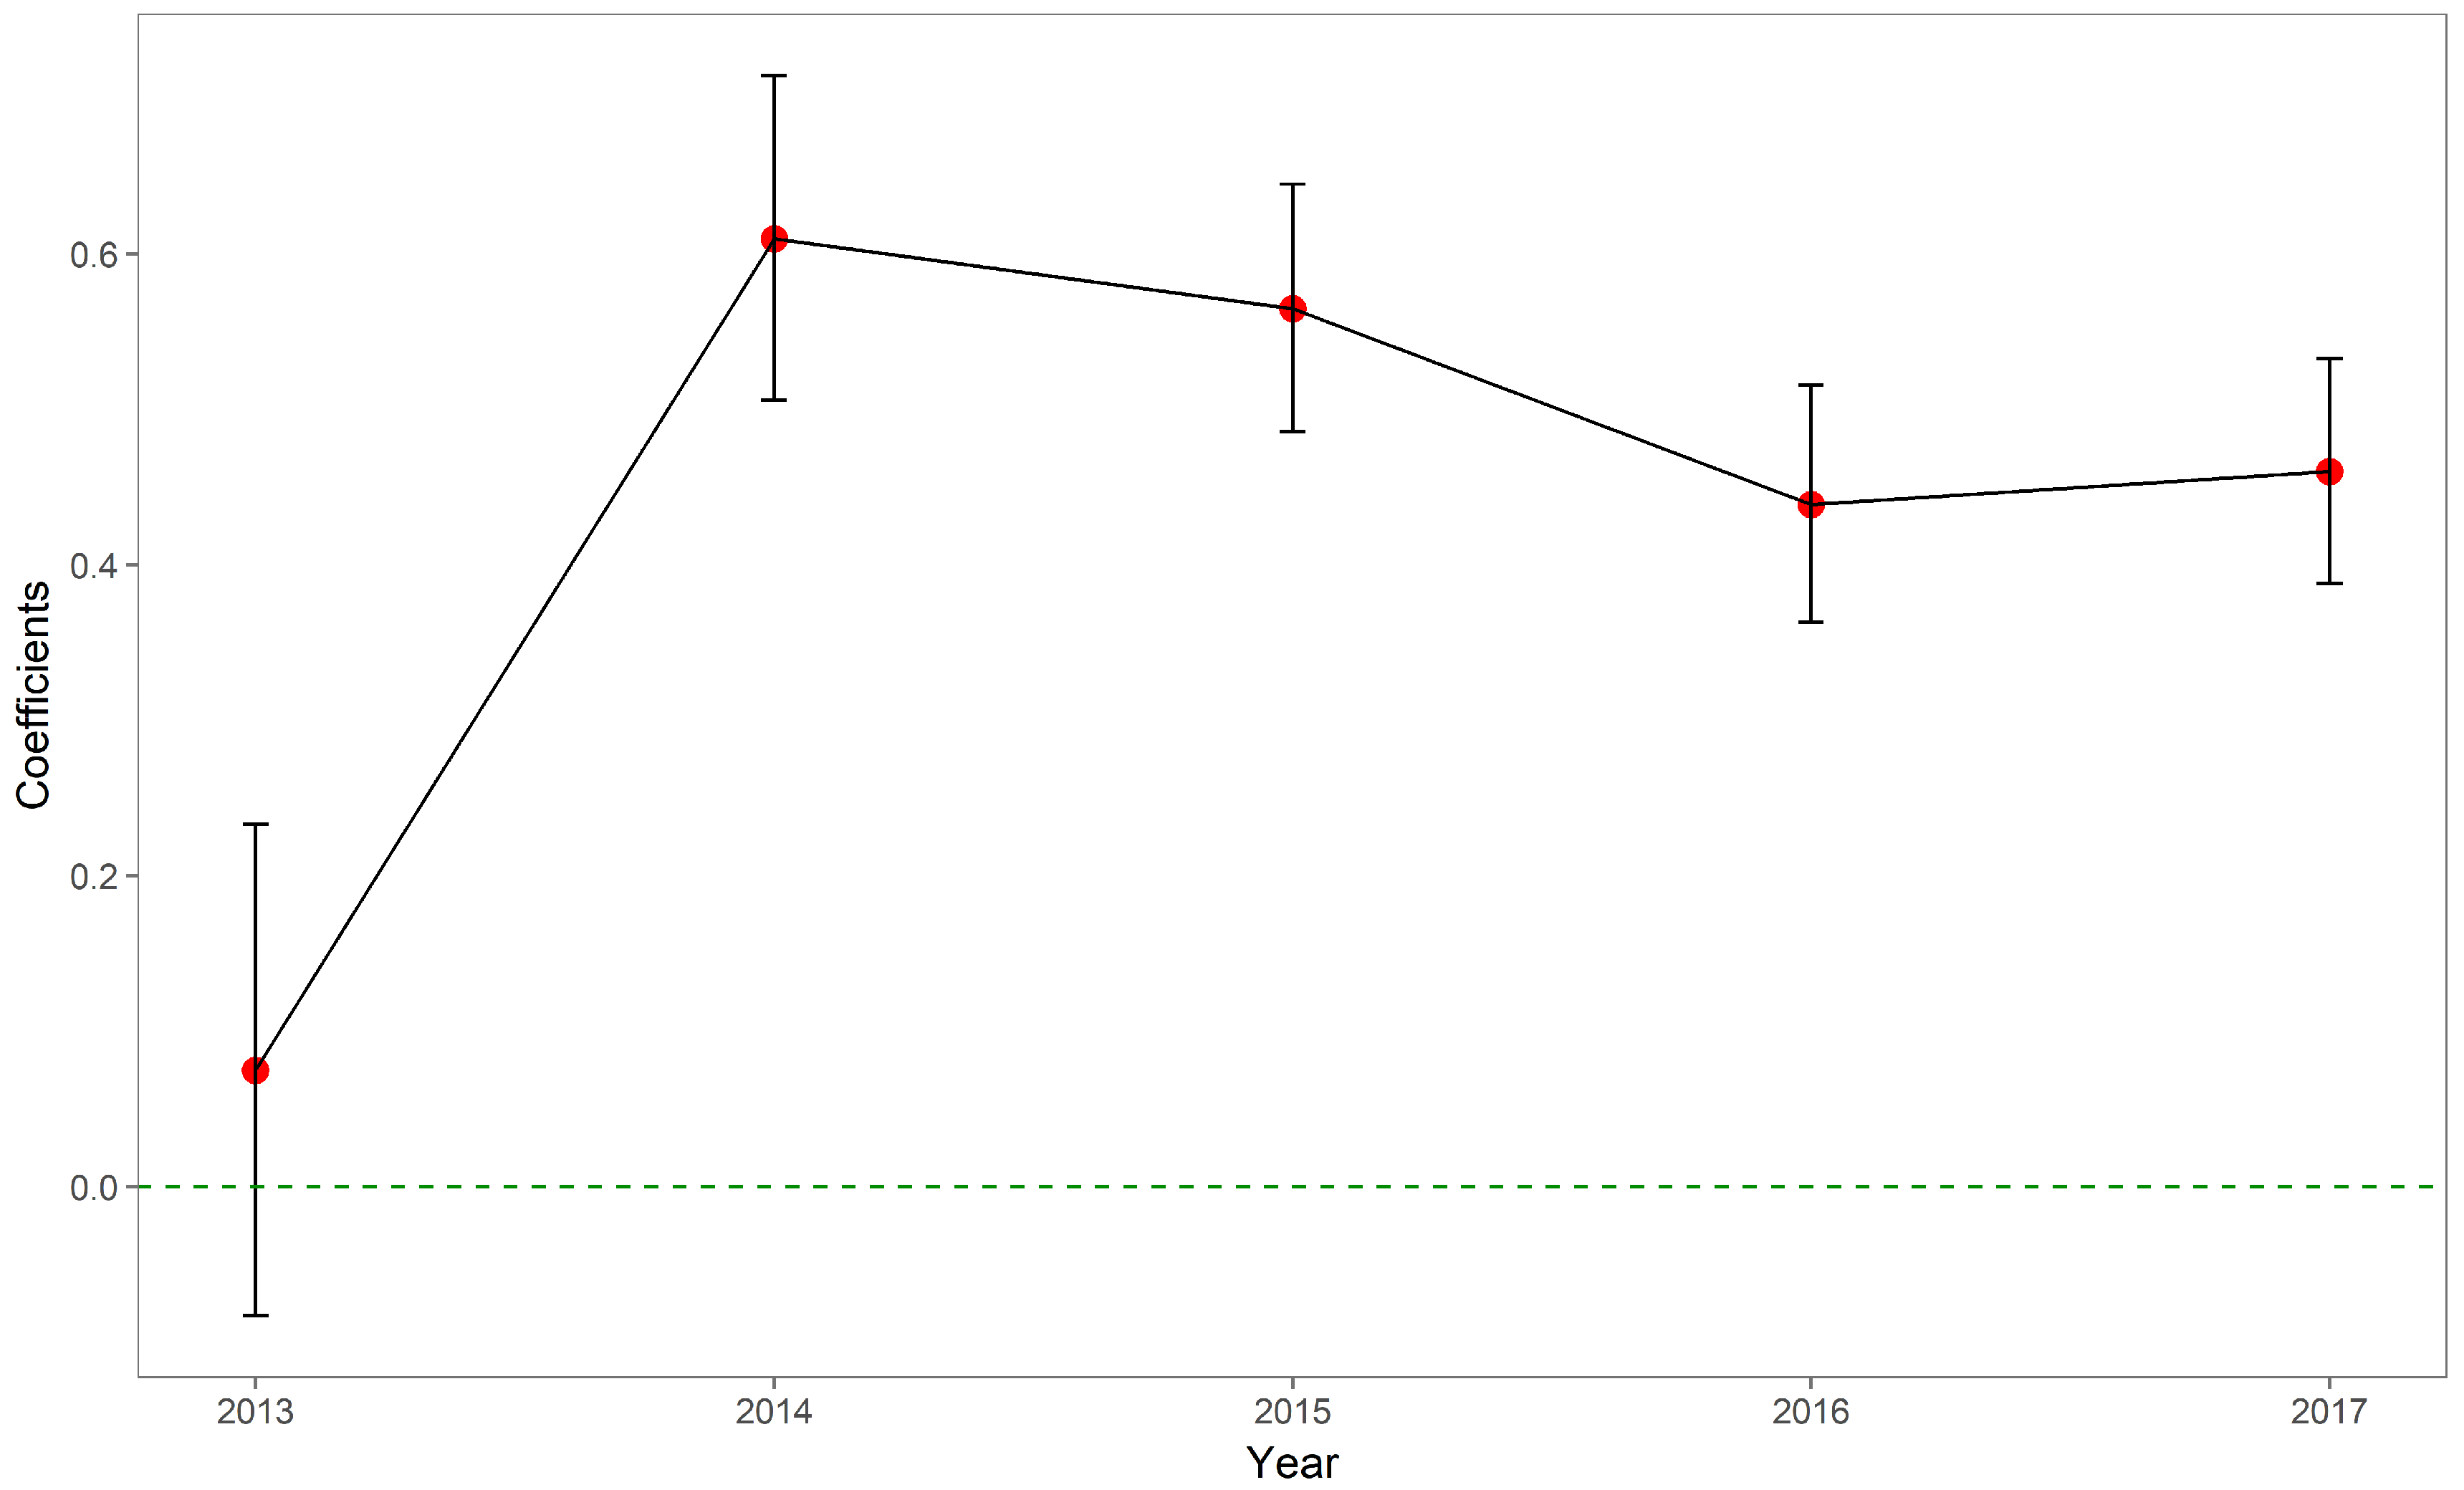
3.3. OOP Expenses
4. Discussion
5. Conclusions
Author Contributions
Funding
Acknowledgments
Conflicts of Interest
Abbreviations
| AMI | Acute Myocardial Infarction |
| EMR | Electronic Medical Records |
| ICD-9 | The International Classification of Disease, Ninth Revision |
| ICD-10 | The International Classification of Disease, Tenth Revision |
| NCMS | New Cooperative Medical Scheme |
| OR | Odds Ratio |
| OOP | Out-of-pocket |
| PCI | Percutaneous Coronary Intervention |
| URBMI | Urban Resident-based Basic Medical Insurance Scheme |
| UEBMI | Urban Employee-based Basic Medical Insurance Scheme |
References
- Pong, R.W.; DesMeules, M.; Lagacé, C. Rural–urban disparities in health: How does Canada fare and how does Canada compare with Australia? Aust. J. Rural Health 2009, 17, 58–64. [Google Scholar] [CrossRef] [PubMed]
- Riva, M.; Curtis, S.; Gauvin, L.; Fagg, J. Unravelling the extent of inequalities in health across urban and rural areas: Evidence from a national sample in England. Soc. Sci. Med. 2009, 68, 654–663. [Google Scholar] [CrossRef] [PubMed] [Green Version]
- Srinivasan, C.S.; Zanello, G.; Shankar, B. Rural-urban disparities in child nutrition in Bangladesh and Nepal. BMC Public Health 2013, 13, 581. [Google Scholar] [CrossRef] [PubMed]
- Nennecke, A.; Geiss, K.; Hentschel, S.; Vettorazzi, E.; Jansen, L.; Eberle, A.; Holleczek, B.; Gondos, A.; Brenner, H.; GEKID cancer survival working group. Survival of cancer patients in urban and rural areas of Germany—A comparison. Cancer Epidemiol. 2014, 38, 259–265. [Google Scholar] [CrossRef] [PubMed]
- Singh, G.K.; Siahpush, M. Widening rural–urban disparities in life expectancy, US, 1969–2009. Am. J. Prev. Med. 2014, 46, e19–e29. [Google Scholar] [CrossRef] [PubMed]
- Sonnappa, S.; Lum, S.; Kirkby, J.; Bonner, R.; Wade, A.; Subramanya, V.; Lakshman, P.T.; Rajan, B.; Nooyi, S.C.; Stocks, J. Disparities in pulmonary function in healthy children across the Indian urban–rural continuum. Am. J. Respir. Crit. Care Med. 2015, 191, 79–86. [Google Scholar] [CrossRef] [PubMed]
- Choi, K.M. Investigation of cancer mortality inequalities between rural and urban areas in South Korea. Aust. J. Rural Health 2016, 24, 61–66. [Google Scholar] [CrossRef] [PubMed]
- Amoah, P.A.; Edusei, J.; Amuzu, D. Social Networks and Health: Understanding the Nuances of Healthcare Access between Urban and Rural Populations. Int. J. Environ. Res. Public Health 2018, 15, 973. [Google Scholar] [CrossRef] [PubMed]
- The World Bank Group. Rural Population (% of Total Population) 1960–2017. 2018. Available online: https://data.worldbank.org/indicator/SP.RUR.TOTL.ZS (accessed on 30 August 2018).
- Hartley, D. Rural health disparities, population health, and rural culture. Am. J. Public Health 2004, 94, 1675–1678. [Google Scholar] [CrossRef] [PubMed]
- Kulshreshtha, A.; Goyal, A.; Dabhadkar, K.; Veledar, E.; Vaccarino, V. Urban-rural differences in coronary heart disease mortality in the United States: 1999–2009. Public Health Rep. 2014, 129, 19–29. [Google Scholar] [CrossRef] [PubMed]
- Fang, H.; Chen, J.; Rizzo, J.A. Explaining urban-rural health disparities in China. Med. Care 2009, 47, 1209–1216. [Google Scholar] [CrossRef] [PubMed]
- Jian, W.; Chan, K.Y.; Reidpath, D.D.; Xu, L. China’s rural-urban care gap shrank for chronic disease patients, but inequities persist. Health Aff. 2010, 29, 2189–2196. [Google Scholar] [CrossRef] [PubMed]
- Gong, P.; Liang, S.; Carlton, E.J.; Jiang, Q.; Wu, J.; Wang, L.; Remais, J.V. Urbanisation and health in China. Lancet 2012, 379, 843–852. [Google Scholar] [CrossRef] [Green Version]
- National Bureau of Statistics of China. Tabulation on the 2010 Population Census of the People’s Republic of China. 2010. Available online: http://www.stats.gov.cn/tjsj/pcsj/rkpc/6rp/indexch.htm (accessed on 30 August 2018).
- Liu, M.; Zhang, Q.; Lu, M.; Kwon, C.S.; Quan, H. Rural and urban disparity in health services utilization in China. Med. Care 2007, 45, 767–774. [Google Scholar] [CrossRef] [PubMed]
- Anand, S.; Fan, V.Y.; Zhang, J.; Zhang, L.; Ke, Y.; Dong, Z.; Chen, L.C. China’s human resources for health: quantity, quality, and distribution. Lancet 2008, 372, 1774–1781. [Google Scholar] [CrossRef]
- Yip, W.C.M.; Hsiao, W.C.; Chen, W.; Hu, S.; Ma, J.; Maynard, A. Early appraisal of China’s huge and complex health-care reforms. Lancet 2012, 379, 833–842. [Google Scholar] [CrossRef]
- Yip, W.; Hsiao, W. Harnessing the privatisation of China’s fragmented health-care delivery. Lancet 2014, 384, 805–818. [Google Scholar] [CrossRef]
- Yao, Q.; Liu, C.; Ferrier, J.A.; Liu, Z.; Sun, J. Urban-rural inequality regarding drug prescriptions in primary care facilities—A pre-post comparison of the National Essential Medicines Scheme of China. Int. J. Equity Health 2015, 14, 58. [Google Scholar] [CrossRef] [PubMed]
- Ge, D.; Chu, J.; Zhou, C.; Qian, Y.; Zhang, L.; Sun, L. Rural–urban difference in the use of annual physical examination among seniors in Shandong, China: A cross-sectional study. Int. J. Equity Health 2017, 16, 86. [Google Scholar] [CrossRef] [PubMed]
- Bragg, F.; Holmes, M.V.; Iona, A.; Guo, Y.; Du, H.; Chen, Y.; Bian, Z.; Yang, L.; Herrington, W.; Bennett, D.; et al. Association between diabetes and cause-specific mortality in rural and urban areas of China. JAMA 2017, 317, 280–289. [Google Scholar] [CrossRef] [PubMed]
- Zhang, X.H.; Guan, T.; Mao, J.; Liu, L. Disparity and its time trends in stroke mortality between urban and rural populations in China 1987 to 2001: Changing patterns and their implications for public health policy. Stroke 2007, 38, 3139–3144. [Google Scholar] [CrossRef] [PubMed]
- Fu, R.; Wang, Y.; Bao, H.; Wang, Z.; Li, Y.; Su, S.; Liu, M. Trend of urban-rural disparities in hospital admissions and medical expenditure in China from 2003 to 2011. PLoS ONE 2014, 9, e108571. [Google Scholar] [CrossRef] [PubMed]
- Hu, Z.; Yuan, X.; Rao, K.; Zheng, Z.; Hu, S. National trend in congenital heart disease mortality in China during 2003 to 2010: A population-based study. J. Thorac. Cardiovasc. Surg. 2014, 148, 596–602. [Google Scholar] [CrossRef] [PubMed]
- Sun, W.; Zhou, Y.; Zhang, Z.; Cao, L.; Chen, W. The Trends in Cardiovascular Diseases and Respiratory Diseases Mortality in Urban and Rural China, 1990–2015. Int. J. Environ. Res. Public Health 2017, 14, 1391. [Google Scholar] [CrossRef] [PubMed]
- Chung, S.C.; Sundström, J.; Gale, C.P.; James, S.; Deanfield, J.; Wallentin, L.; Timmis, A.; Jernberg, T.; Hemingway, H. Comparison of hospital variation in acute myocardial infarction care and outcome between Sweden and United Kingdom: Population based cohort study using nationwide clinical registries. BMJ 2015, 351, h3913. [Google Scholar] [CrossRef] [PubMed]
- Kessler, D.P.; McClellan, M.B. Is hospital competition socially wasteful? Q. J. Econ. 2000, 115, 577–615. [Google Scholar] [CrossRef]
- Gaynor, M.; Moreno-Serra, R.; Propper, C. Death by market power: Reform, competition, and patient outcomes in the National Health Service. Am. Econ. J. Econ. Policy 2013, 5, 134–166. [Google Scholar] [CrossRef]
- Moore, B.J.; White, S.; Washington, R.; Coenen, N.; Elixhauser, A. Identifying increased risk of readmission and in-hospital mortality using hospital administrative data. Med. Care 2017, 55, 698–705. [Google Scholar] [CrossRef] [PubMed]
- Deb, P.; Norton, E.C. Modeling Health Care Expenditures and Use. Annu. Rev. Public Health 2018, 39, 489–505. [Google Scholar] [CrossRef] [PubMed]
- R Core Team. R: A Language and Environment for Statistical Computing; R Foundation for Statistical Computing: Vienna, Austria, 2013. [Google Scholar]
- Abubakar, I.; Tillmann, T.; Banerjee, A. Global, regional, and national age-sex specific all-cause and cause-specific mortality for 240 causes of death, 1990–2013: A systematic analysis for the Global Burden of Disease Study 2013. Lancet 2015, 385, 117–171. [Google Scholar]
- Chen, H.; Shi, L.; Xue, M.; Wang, N.; Dong, X.; Cai, Y.; Chen, J.; Zhu, W.; Xu, H.; Meng, Q. Geographic Variations in In-Hospital Mortality and Use of Percutaneous Coronary Intervention Following Acute Myocardial Infarction in China: A Nationwide Cross-Sectional Analysis. J. Am. Heart Assoc. 2018, 7, e008131. [Google Scholar] [CrossRef]
- Zhang, Y.X.; Zhou, J.Y.; Zhao, J.S.; Chu, Z.H. Urban–rural and regional disparities in the prevalence of elevated blood pressure among children and adolescents in Shandong, China. Int. J. Cardiol. 2014, 176, 1053–1055. [Google Scholar] [CrossRef] [PubMed]
- Pingali, P. Westernization of Asian diets and the transformation of food systems: Implications for research and policy. Food Policy 2007, 32, 281–298. [Google Scholar] [CrossRef]
- Lee, Y.H.; Shelley, M.; Liu, C.T.; Chang, Y.C. Assessing the association of food preferences and self-reported psychological well-being among middle-aged and older adults in contemporary China-results from the China Health and Nutrition Survey. Int. J. Environ. Res. Public Health 2018, 15, 463. [Google Scholar] [CrossRef] [PubMed]
- Garg, C.C.; Karan, A.K. Reducing out-of-pocket expenditures to reduce poverty: A disaggregated analysis at rural-urban and state level in India. Health Policy Plan. 2008, 24, 116–128. [Google Scholar] [CrossRef] [PubMed]
- Kruk, M.E.; Mbaruku, G.; Rockers, P.C.; Galea, S. User fee exemptions are not enough: Out-of-pocket payments for ‘free’delivery services in rural Tanzania. Trop. Med. Int. Health 2008, 13, 1442–1451. [Google Scholar] [CrossRef] [PubMed]
- Lin, X.; Cai, M.; Tao, H.; Liu, E.; Cheng, Z.; Xu, C.; Wang, M.; Xia, S.; Jiang, T. Insurance status, inhospital mortality and length of stay in hospitalised patients in Shanxi, China: A cross-sectional study. BMJ Open 2017, 7, e015884. [Google Scholar] [CrossRef] [PubMed]
- Meng, Q.; Fang, H.; Liu, X.; Yuan, B.; Xu, J. Consolidating the social health insurance schemes in China: Towards an equitable and efficient health system. Lancet 2015, 386, 1484–1492. [Google Scholar] [CrossRef]
- Wang, H.Q.; Liu, Z.H.; Zhang, Y.Z.; Luo, Z.J. Integration of current identity-based district-varied health insurance schemes in China: Implications and challenges. Front. Med. 2012, 6, 79–84. [Google Scholar] [CrossRef] [PubMed]
- Wang, X.; Zheng, A.; He, X.; Jiang, H. Integration of rural and urban healthcare insurance schemes in China: An empirical research. BMC Health Serv. Res. 2014, 14, 142. [Google Scholar] [CrossRef] [PubMed]
- Cai, M.; Liu, E.; Tao, H.; Qian, Z.; Lin, X.; Cheng, Z. Does Level of Hospital Matter? A Study of Mortality of Acute Myocardial Infarction Patients in Shanxi, China. Am. J. Med. Qual. 2018, 33, 185–192. [Google Scholar] [CrossRef] [PubMed]
- Xu, Y.; Liu, Y.; Shu, T.; Yang, W.; Liang, M. Variations in the quality of care at large public hospitals in Beijing, China: A condition-based outcome approach. PLoS ONE 2015, 10, e0138948. [Google Scholar] [CrossRef] [PubMed]
- Wu, H.; Liu, L.; Wang, Y.; Gao, F.; Zhao, X.; Wang, L. Factors associated with burnout among Chinese hospital doctors: A cross-sectional study. BMC Public Health 2013, 13, 786. [Google Scholar] [CrossRef] [PubMed]
- Menees, D.S.; Peterson, E.D.; Wang, Y.; Curtis, J.P.; Messenger, J.C.; Rumsfeld, J.S.; Gurm, H.S. Door-to-balloon time and mortality among patients undergoing primary PCI. N. Engl. J. Med. 2013, 369, 901–909. [Google Scholar] [CrossRef] [PubMed]


| 2013 | 2014 | 2015 | 2016 | 2017 | ||||||
|---|---|---|---|---|---|---|---|---|---|---|
| Urban/Rural | Urban | Rural | Urban | Rural | Urban | Rural | Urban | Rural | Urban | Rural |
| n (%) | 2243 (54.7) | 1854 (45.3) | 7073 (50.4) | 6966 (49.6) | 9092 (41.4) | 12,882 (58.6) | 10,349 (41.7) | 14,458 (58.3) | 9233 (41.4) | 13,069 (58.6) |
| Death | 0.03 (0.18) | 0.01 (0.10) | 0.03 (0.17) | 0.01 (0.12) | 0.03 (0.17) | 0.01 (0.12) | 0.03 (0.18) | 0.01 (0.12) | 0.03 (0.17) | 0.01 (0.12) |
| Out-of-pocket expenses | ||||||||||
| % of 0 values | 68.9 | 86.7 | 72.4 | 76.4 | 71.8 | 76.1 | 76.2 | 80.1 | 71.8 | 75.3 |
| median | 12,331 | 10,953 | 12,591 | 22,714 | 12,701 | 17,602 | 11,939 | 13,694 | 12,582 | 15,664 |
| 1st quartile | 4652 | 6168 | 4796 | 9260 | 4677 | 8216 | 4911 | 7749 | 5542 | 8015 |
| 3rd quartile | 24,837 | 33,465 | 22,864 | 45,539 | 25,065 | 42,488 | 22,304 | 35,545 | 24,338 | 37,474 |
| Female | 0.22 (0.42) | 0.29 (0.45) | 0.22 (0.41) | 0.29 (0.45) | 0.22 (0.41) | 0.31 (0.46) | 0.21 (0.41) | 0.30 (0.46) | 0.21 (0.41) | 0.30 (0.46) |
| Age (%) | ||||||||||
| 18–45 | 226 (10.1) | 246 (13.3) | 651 (9.2) | 892 (12.8) | 831 (9.1) | 1392 (10.8) | 910 (8.8) | 1476 (10.2) | 711 (7.7) | 1252 (9.6) |
| 46–65 | 993 (44.3) | 981 (52.9) | 3205 (45.3) | 3836 (55.1) | 4145 (45.6) | 6552 (50.9) | 4632 (44.8) | 7390 (51.1) | 4143 (44.9) | 6755 (51.7) |
| 66–75 | 559 (24.9) | 386 (20.8) | 1592 (22.5) | 1457 (20.9) | 2021 (22.2) | 3033 (23.5) | 2248 (21.7) | 3402 (23.5) | 2069 (22.4) | 3190 (24.4) |
| 75+ | 465 (20.7) | 241 (13.0) | 1625 (23.0) | 781 (11.2) | 2095 (23.0) | 1905 (14.8) | 2559 (24.7) | 2190 (15.1) | 2310 (25.0) | 1872 (14.3) |
| Marriage (%) | ||||||||||
| Married | 2101 (93.7) | 1680 (90.6) | 6578 (93.0) | 6439 (92.4) | 8355 (91.9) | 11,853 (92.0) | 9525 (92.0) | 13,343 (92.3) | 8330 (90.2) | 11,932 (91.3) |
| Unmarried | 26 (1.2) | 79 (4.3) | 94 (1.3) | 213 (3.1) | 94 (1.0) | 216 (1.7) | 97 (0.9) | 253 (1.7) | 223 (2.4) | 360 (2.8) |
| Widowed | 60 (2.7) | 51 (2.8) | 194 (2.7) | 156 (2.2) | 372 (4.1) | 471 (3.7) | 401 (3.9) | 496 (3.4) | 373 (4.0) | 431 (3.3) |
| Divorced | 48 (2.1) | 23 (1.2) | 167 (2.4) | 112 (1.6) | 159 (1.7) | 145 (1.1) | 173 (1.7) | 155 (1.1) | 176 (1.9) | 140 (1.1) |
| Other | 8 (0.4) | 21 (1.1) | 40 (0.6) | 46 (0.7) | 112 (1.2) | 197 (1.5) | 153 (1.5) | 211 (1.5) | 131 (1.4) | 206 (1.6) |
| Occupation (%) | ||||||||||
| Public institution | 194 (8.6) | 33 (1.8) | 902 (12.8) | 127 (1.8) | 1273 (14.0) | 145 (1.1) | 1421 (13.7) | 157 (1.1) | 1258 (13.6) | 105 (0.8) |
| Private institution | 617 (27.5) | 97 (5.2) | 1989 (28.1) | 346 (5.0) | 2041 (22.4) | 386 (3.0) | 2321 (22.4) | 462 (3.2) | 1998 (21.6) | 448 (3.4) |
| Farmer | 370 (16.5) | 1249 (67.4) | 385 (5.4) | 5553 (79.7) | 634 (7.0) | 10,526 (81.7) | 680 (6.6) | 12,158 (84.1) | 621 (6.7) | 10,928 (83.6) |
| Jobless | 110 (4.9) | 47 (2.5) | 383 (5.4) | 223 (3.2) | 560 (6.2) | 236 (1.8) | 640 (6.2) | 294 (2.0) | 563 (6.1) | 268 (2.1) |
| Retired | 601 (26.8) | 90 (4.9) | 2581 (36.5) | 292 (4.2) | 3437 (37.8) | 350 (2.7) | 4203 (40.6) | 412 (2.8) | 3872 (41.9) | 286 (2.2) |
| Other | 351 (15.6) | 338 (18.2) | 833 (11.8) | 425 (6.1) | 1147 (12.6) | 1239 (9.6) | 1084 (10.5) | 975 (6.7) | 921 (10.0) | 1034 (7.9) |
| Length of stay (%) | ||||||||||
| 1st quartile | 432 (19.3) | 484 (26.1) | 1380 (19.5) | 1768 (25.4) | 2082 (22.9) | 3882 (30.1) | 2519 (24.3) | 4470 (30.9) | 2370 (25.7) | 4458 (34.1) |
| 2nd quartile | 536 (23.9) | 521 (28.1) | 1807 (25.5) | 2018 (29.0) | 2467 (27.1) | 3665 (28.5) | 3076 (29.7) | 4534 (31.4) | 3007 (32.6) | 4340 (33.2) |
| 3rd quartile | 525 (23.4) | 406 (21.9) | 1650 (23.3) | 1544 (22.2) | 2074 (22.8) | 2885 (22.4) | 2180 (21.1) | 3037 (21.0) | 1899 (20.6) | 2454 (18.8) |
| 4th quartile | 750 (33.4) | 443 (23.9) | 2236 (31.6) | 1636 (23.5) | 2469 (27.2) | 2450 (19.0) | 2574 (24.9) | 2417 (16.7) | 1957 (21.2) | 1817 (13.9) |
| Gravity of disease (%) | ||||||||||
| Dangerous | 488 (21.8) | 337 (18.2) | 1719 (24.3) | 1181 (17.0) | 2106 (23.2) | 2253 (17.5) | 2193 (21.2) | 2843 (19.7) | 1915 (20.7) | 2560 (19.6) |
| Severe | 628 (28.0) | 499 (26.9) | 1873 (26.5) | 2141 (30.7) | 2074 (22.8) | 2771 (21.5) | 2610 (25.2) | 3642 (25.2) | 2321 (25.1) | 3267 (25.0) |
| Normal | 1127 (50.2) | 1018 (54.9) | 3481 (49.2) | 3644 (52.3) | 4912 (54.0) | 7858 (61.0) | 5546 (53.6) | 7973 (55.1) | 4997 (54.1) | 7242 (55.4) |
| Percutaneous coronary intervention | 0.14 (0.34) | 0.15 (0.36) | 0.17 (0.38) | 0.15 (0.36) | 0.19 (0.39) | 0.13 (0.33) | 0.23 (0.42) | 0.17 (0.38) | 0.31 (0.46) | 0.24 (0.43) |
| Tertiary hospitals (%) | 2215 (98.8) | 1840 (99.2) | 7013 (99.2) | 6841 (98.2) | 7773 (85.5) | 7855 (61.0) | 8634 (83.4) | 8889 (61.5) | 7859 (85.1) | 8195 (62.7) |
| Elixhauser score | 4.91 (5.90) | 4.99 (5.68) | 6.10 (6.11) | 6.08 (5.91) | 6.46 (6.21) | 5.90 (6.26) | 7.17 (6.18) | 6.46 (6.17) | 7.42 (6.30) | 6.63 (6.28) |
| 2013 | 2014 | 2015 | 2016 | 2017 | ||||||
|---|---|---|---|---|---|---|---|---|---|---|
| OR | p-Value | OR | p-Value | OR | p-Value | OR | p-Value | OR | p-Value | |
| (Intercept) | 0.211 | 0.097 | 0.04 | <0.001 | 0.035 | <0.001 | 0.017 | <0.001 | 0.009 | <0.001 |
| Rural (Ref. = Urban) | 0.173 | <0.001 | 0.34 | <0.001 | 0.605 | 0.001 | 0.522 | <0.001 | 0.556 | 0.001 |
| Female (Ref. = Male) | 1.82 | 0.023 | 1.153 | 0.305 | 1.164 | 0.179 | 1.404 | 0.001 | 1.392 | 0.003 |
| Age (Ref. = 18–45) | ||||||||||
| 46–65 | 0.661 | 0.373 | 2.291 | 0.038 | 1.398 | 0.218 | 1.662 | 0.067 | 1.313 | 0.348 |
| 66–75 | 0.961 | 0.935 | 4.059 | 0.001 | 2.915 | <0.001 | 2.863 | <0.001 | 2.069 | 0.014 |
| ≥76 | 2.344 | 0.072 | 6.347 | <0.001 | 3.307 | <0.001 | 4.358 | <0.001 | 3.08 | <0.001 |
| Marriage (Ref. = Married) | ||||||||||
| Unmarried | 2.875 | 0.067 | 1.363 | 0.483 | 0.768 | 0.61 | 0.478 | 0.215 | 1.059 | 0.886 |
| Widowed | 0.376 | 0.136 | 1.119 | 0.686 | 1.22 | 0.297 | 1.015 | 0.93 | 1.293 | 0.171 |
| Divorced | 3.281 | 0.014 | 1.941 | 0.012 | 2.09 | 0.006 | 0.691 | 0.308 | 0.854 | 0.662 |
| Other | 5.028 | 0.141 | 1.642 | 0.438 | 0.882 | 0.767 | 1.501 | 0.18 | 2.387 | 0.003 |
| Occupation (Ref. = Public institution) | ||||||||||
| Private institution | 0.824 | 0.729 | 1.608 | 0.193 | 0.877 | 0.627 | 1.107 | 0.73 | 1.908 | 0.104 |
| Farmer | 1.411 | 0.526 | 2.382 | 0.022 | 0.67 | 0.128 | 1.174 | 0.575 | 2.145 | 0.055 |
| Jobless | 0.478 | 0.305 | 0.731 | 0.509 | 0.738 | 0.357 | 1.209 | 0.559 | 2.059 | 0.09 |
| Retired | 1.082 | 0.882 | 2.273 | 0.017 | 1.399 | 0.15 | 2.052 | 0.006 | 3.615 | 0.001 |
| Other | 0.556 | 0.32 | 0.891 | 0.776 | 0.604 | 0.065 | 1.082 | 0.788 | 1.459 | 0.361 |
| Length of stay (Ref. 1st quartile) | ||||||||||
| 2nd quartile | 0.112 | <0.001 | 0.136 | <0.001 | 0.13 | <0.001 | 0.103 | <0.001 | 0.116 | <0.001 |
| 3rd quartile | 0.023 | <0.001 | 0.062 | <0.001 | 0.085 | <0.001 | 0.048 | <0.001 | 0.076 | <0.001 |
| 4th quartile | 0.107 | <0.001 | 0.118 | <0.001 | 0.149 | <0.001 | 0.119 | <0.001 | 0.225 | <0.001 |
| Gravity of disease (Ref. Normal) | ||||||||||
| Dangerous | 1.655 | 0.041 | 1.707 | <0.001 | 1.553 | <0.001 | 2.305 | <0.001 | 2.323 | <0.001 |
| Severe | 0.48 | 0.032 | 0.825 | 0.23 | 0.866 | 0.308 | 0.968 | 0.794 | 0.97 | 0.831 |
| PCI | 0.566 | 0.292 | 0.137 | <0.001 | 0.296 | <0.001 | 0.339 | <0.001 | 0.423 | <0.001 |
| Level of hospitals (Ref. = Secondary) | ||||||||||
| Tertiary | 0.377 | 0.181 | 0.352 | 0.001 | 0.953 | 0.686 | 1.185 | 0.11 | 1.474 | 0.002 |
| Elixhauser score | 1.053 | 0.002 | 1.023 | 0.011 | 1.023 | 0.002 | 1.018 | 0.008 | 1.016 | 0.025 |
| 2013 | 2014 | 2015 | 2016 | 2017 | ||||||
|---|---|---|---|---|---|---|---|---|---|---|
| Coefficient | p-Value | Coefficient | p-Value | Coefficient | p-Value | Coefficient | p-Value | Coefficient | p-Value | |
| (Intercept) | 0.33 | 0.012 | 0.515 | 0.001 | 0.163 | <0.001 | 0.147 | <0.001 | 0.154 | <0.001 |
| Rural (Ref. = Urban) | 0.159 | <0.001 | 0.573 | <0.001 | 1.278 | <0.001 | 1.281 | <0.001 | 1.65 | <0.001 |
| Female (Ref. = Male) | 0.895 | 0.282 | 0.968 | 0.524 | 1.013 | 0.753 | 1.082 | 0.056 | 1.147 | 0.001 |
| Age (Ref. = 18–45) | ||||||||||
| 46–65 | 1.006 | 0.964 | 0.965 | 0.588 | 1.003 | 0.956 | 1.015 | 0.803 | 1.184 | 0.006 |
| 66–75 | 1.208 | 0.22 | 1.083 | 0.298 | 1.088 | 0.191 | 1.001 | 0.991 | 1.278 | <0.001 |
| 75+ | 1.508 | 0.014 | 0.999 | 0.994 | 1.009 | 0.898 | 1.158 | 0.042 | 1.405 | <0.001 |
| Marriage (Ref. = Married) | ||||||||||
| Unmarried | 0.151 | <0.001 | 0.343 | <0.001 | 0.627 | 0.004 | 1.114 | 0.437 | 0.882 | 0.219 |
| Widowed | 0.839 | 0.509 | 0.975 | 0.849 | 0.646 | <0.001 | 0.753 | 0.005 | 0.676 | <0.001 |
| Divorced | 0.24 | 0.003 | 0.254 | <0.001 | 0.691 | 0.015 | 0.973 | 0.852 | 1.91 | <0.001 |
| Other | 0.206 | 0.124 | 0.163 | <0.001 | 0.147 | <0.001 | 0.223 | <0.001 | 0.34 | <0.001 |
| Occupation (Ref. = Public institution) | ||||||||||
| Private institution | 2.46 | <0.001 | 0.878 | 0.11 | 0.871 | 0.059 | 1.339 | <0.001 | 1.317 | <0.001 |
| Farmer | 6.43 | <0.001 | 1.134 | 0.175 | 0.575 | <0.001 | 0.776 | 0.003 | 0.585 | <0.001 |
| Jobless | 2.625 | 0.001 | 1.101 | 0.411 | 0.902 | 0.303 | 1.486 | <0.001 | 1.257 | 0.026 |
| Retired | 1.011 | 0.96 | 0.549 | <0.001 | 0.603 | <0.001 | 1.188 | 0.025 | 1.037 | 0.634 |
| Other | 1.784 | 0.008 | 0.203 | <0.001 | 0.348 | <0.001 | 0.318 | <0.001 | 0.551 | <0.001 |
| Length of stay (Ref. 1st quartile) | ||||||||||
| 2nd quartile | 1.261 | 0.054 | 1.279 | <0.001 | 1.085 | 0.077 | 0.914 | 0.044 | 0.766 | <0.001 |
| 3rd quartile | 1.279 | 0.047 | 1.383 | <0.001 | 1.142 | 0.006 | 0.854 | 0.002 | 0.704 | <0.001 |
| 4th quartile | 1.093 | 0.452 | 1.192 | 0.003 | 1.328 | <0.001 | 0.977 | 0.637 | 0.918 | 0.079 |
| Gravity of disease (Ref. Normal) | ||||||||||
| Dangerous | 0.984 | 0.883 | 1.207 | <0.001 | 1.368 | <0.001 | 1.598 | <0.001 | 1.504 | <0.001 |
| Severe | 1 | 0.997 | 1.058 | 0.236 | 1.075 | 0.078 | 0.623 | <0.001 | 0.62 | <0.001 |
| PCI | 3.083 | <0.001 | 1.923 | <0.001 | 2.875 | <0.001 | 4.389 | <0.001 | 2.886 | <0.001 |
| Level of hospital (Ref. = Secondary hospital) | ||||||||||
| Tertiary | 0.508 | 0.077 | 0.638 | 0.008 | 2.375 | <0.001 | 1.74 | <0.001 | 2.004 | <0.001 |
| Elixhauser score | 0.966 | <0.001 | 1.027 | <0.001 | 1.005 | 0.048 | 0.97 | <0.001 | 0.985 | <0.001 |
| 2013 | 2014 | 2015 | 2016 | 2017 | ||||||
|---|---|---|---|---|---|---|---|---|---|---|
| OR | p-Value | OR | p-Value | OR | p-Value | OR | p-Value | OR | p-Value | |
| (Intercept) | 8.278 | <0.001 | 7.913 | <0.001 | 7.91 | <0.001 | 7.998 | <0.001 | 7.883 | <0.001 |
| Rural (Ref. = Urban) | 0.075 | 0.352 | 0.61 | <0.001 | 0.565 | <0.001 | 0.439 | <0.001 | 0.46 | <0.001 |
| Female (Ref. = Male) | −0.034 | 0.69 | −0.101 | 0.012 | −0.072 | 0.017 | −0.01 | 0.741 | −0.006 | 0.845 |
| Age (Ref. = 18–45) | ||||||||||
| 46–65 | −0.204 | 0.054 | −0.021 | 0.69 | −0.111 | 0.006 | −0.07 | 0.094 | −0.143 | 0.001 |
| 66–75 | −0.25 | 0.042 | −0.237 | <0.001 | −0.222 | <0.001 | −0.182 | <0.001 | −0.189 | <0.001 |
| 75+ | −0.533 | <0.001 | −0.493 | <0.001 | −0.474 | <0.001 | −0.379 | <0.001 | −0.385 | <0.001 |
| Marriage (Ref. = Married) | ||||||||||
| Unmarried | 0.9 | 0.065 | 0.169 | 0.336 | 0.009 | 0.945 | −0.158 | 0.107 | −0.424 | <0.001 |
| Widowed | 0.281 | 0.185 | −0.168 | 0.109 | 0.01 | 0.9 | −0.183 | 0.019 | −0.051 | 0.499 |
| Divorced | 0.045 | 0.917 | 0.026 | 0.894 | 0.082 | 0.486 | 0.074 | 0.476 | −0.108 | 0.177 |
| Other | −0.071 | 0.941 | 0.007 | 0.987 | −0.015 | 0.956 | −0.056 | 0.799 | −0.396 | 0.022 |
| Occupation (Ref. = Public institution) | ||||||||||
| Private institution | −0.586 | 0.001 | −0.603 | <0.001 | −0.349 | <0.001 | −0.196 | <0.001 | −0.055 | 0.314 |
| Farmer | 0.582 | 0.001 | −0.106 | 0.145 | 0.065 | 0.243 | 0.046 | 0.434 | 0.205 | <0.001 |
| Jobless | −0.195 | 0.407 | −0.142 | 0.107 | 0.039 | 0.572 | −0.046 | 0.526 | 0.16 | 0.026 |
| Retired | −0.199 | 0.292 | -0.362 | <0.001 | −0.045 | 0.374 | 0.01 | 0.859 | 0.069 | 0.204 |
| Other | −0.015 | 0.935 | −0.214 | 0.048 | 0.021 | 0.769 | 0.042 | 0.607 | 0.313 | <0.001 |
| Length of stay (Ref. 1st quartile) | ||||||||||
| 2nd quartile | 0.4 | <0.001 | 0.501 | <0.001 | 0.509 | <0.001 | 0.396 | <0.001 | 0.41 | <0.001 |
| 3rd quartile | 0.584 | <0.001 | 0.689 | <0.001 | 0.749 | <0.001 | 0.625 | <0.001 | 0.577 | <0.001 |
| 4th quartile | 1.047 | <0.001 | 1.139 | <0.001 | 1.224 | <0.001 | 1.115 | <0.001 | 1.035 | <0.001 |
| Gravity of disease | ||||||||||
| Dangerous | −0.201 | 0.019 | 0.079 | 0.055 | 0.005 | 0.855 | 0.213 | <0.001 | 0.091 | 0.001 |
| Severe | −0.171 | 0.028 | −0.027 | 0.465 | −0.1 | 0.001 | −0.131 | <0.001 | −0.094 | 0.003 |
| PCI | 1.233 | <0.001 | 0.887 | <0.001 | 0.752 | <0.001 | 0.844 | <0.001 | 0.869 | <0.001 |
| Level of hospital (Ref. = Secondary hospital) | ||||||||||
| Tertiary | 0.418 | 0.173 | 0.875 | <0.001 | 0.722 | <0.001 | 0.535 | <0.001 | 0.603 | <0.001 |
| Elixhauser score | −0.01 | 0.076 | 0.005 | 0.045 | 0.008 | <0.001 | −0.002 | 0.274 | 0.011 | <0.001 |
© 2018 by the authors. Licensee MDPI, Basel, Switzerland. This article is an open access article distributed under the terms and conditions of the Creative Commons Attribution (CC BY) license (http://creativecommons.org/licenses/by/4.0/).
Share and Cite
Cai, M.; Liu, E.; Li, W. Rural Versus Urban Patients: Benchmarking the Outcomes of Patients with Acute Myocardial Infarction in Shanxi, China from 2013 to 2017. Int. J. Environ. Res. Public Health 2018, 15, 1930. https://0-doi-org.brum.beds.ac.uk/10.3390/ijerph15091930
Cai M, Liu E, Li W. Rural Versus Urban Patients: Benchmarking the Outcomes of Patients with Acute Myocardial Infarction in Shanxi, China from 2013 to 2017. International Journal of Environmental Research and Public Health. 2018; 15(9):1930. https://0-doi-org.brum.beds.ac.uk/10.3390/ijerph15091930
Chicago/Turabian StyleCai, Miao, Echu Liu, and Wei Li. 2018. "Rural Versus Urban Patients: Benchmarking the Outcomes of Patients with Acute Myocardial Infarction in Shanxi, China from 2013 to 2017" International Journal of Environmental Research and Public Health 15, no. 9: 1930. https://0-doi-org.brum.beds.ac.uk/10.3390/ijerph15091930