Waist Circumference and All-Cause Mortality among Older Adults in Rural Indonesia


Abstract
:1. Background
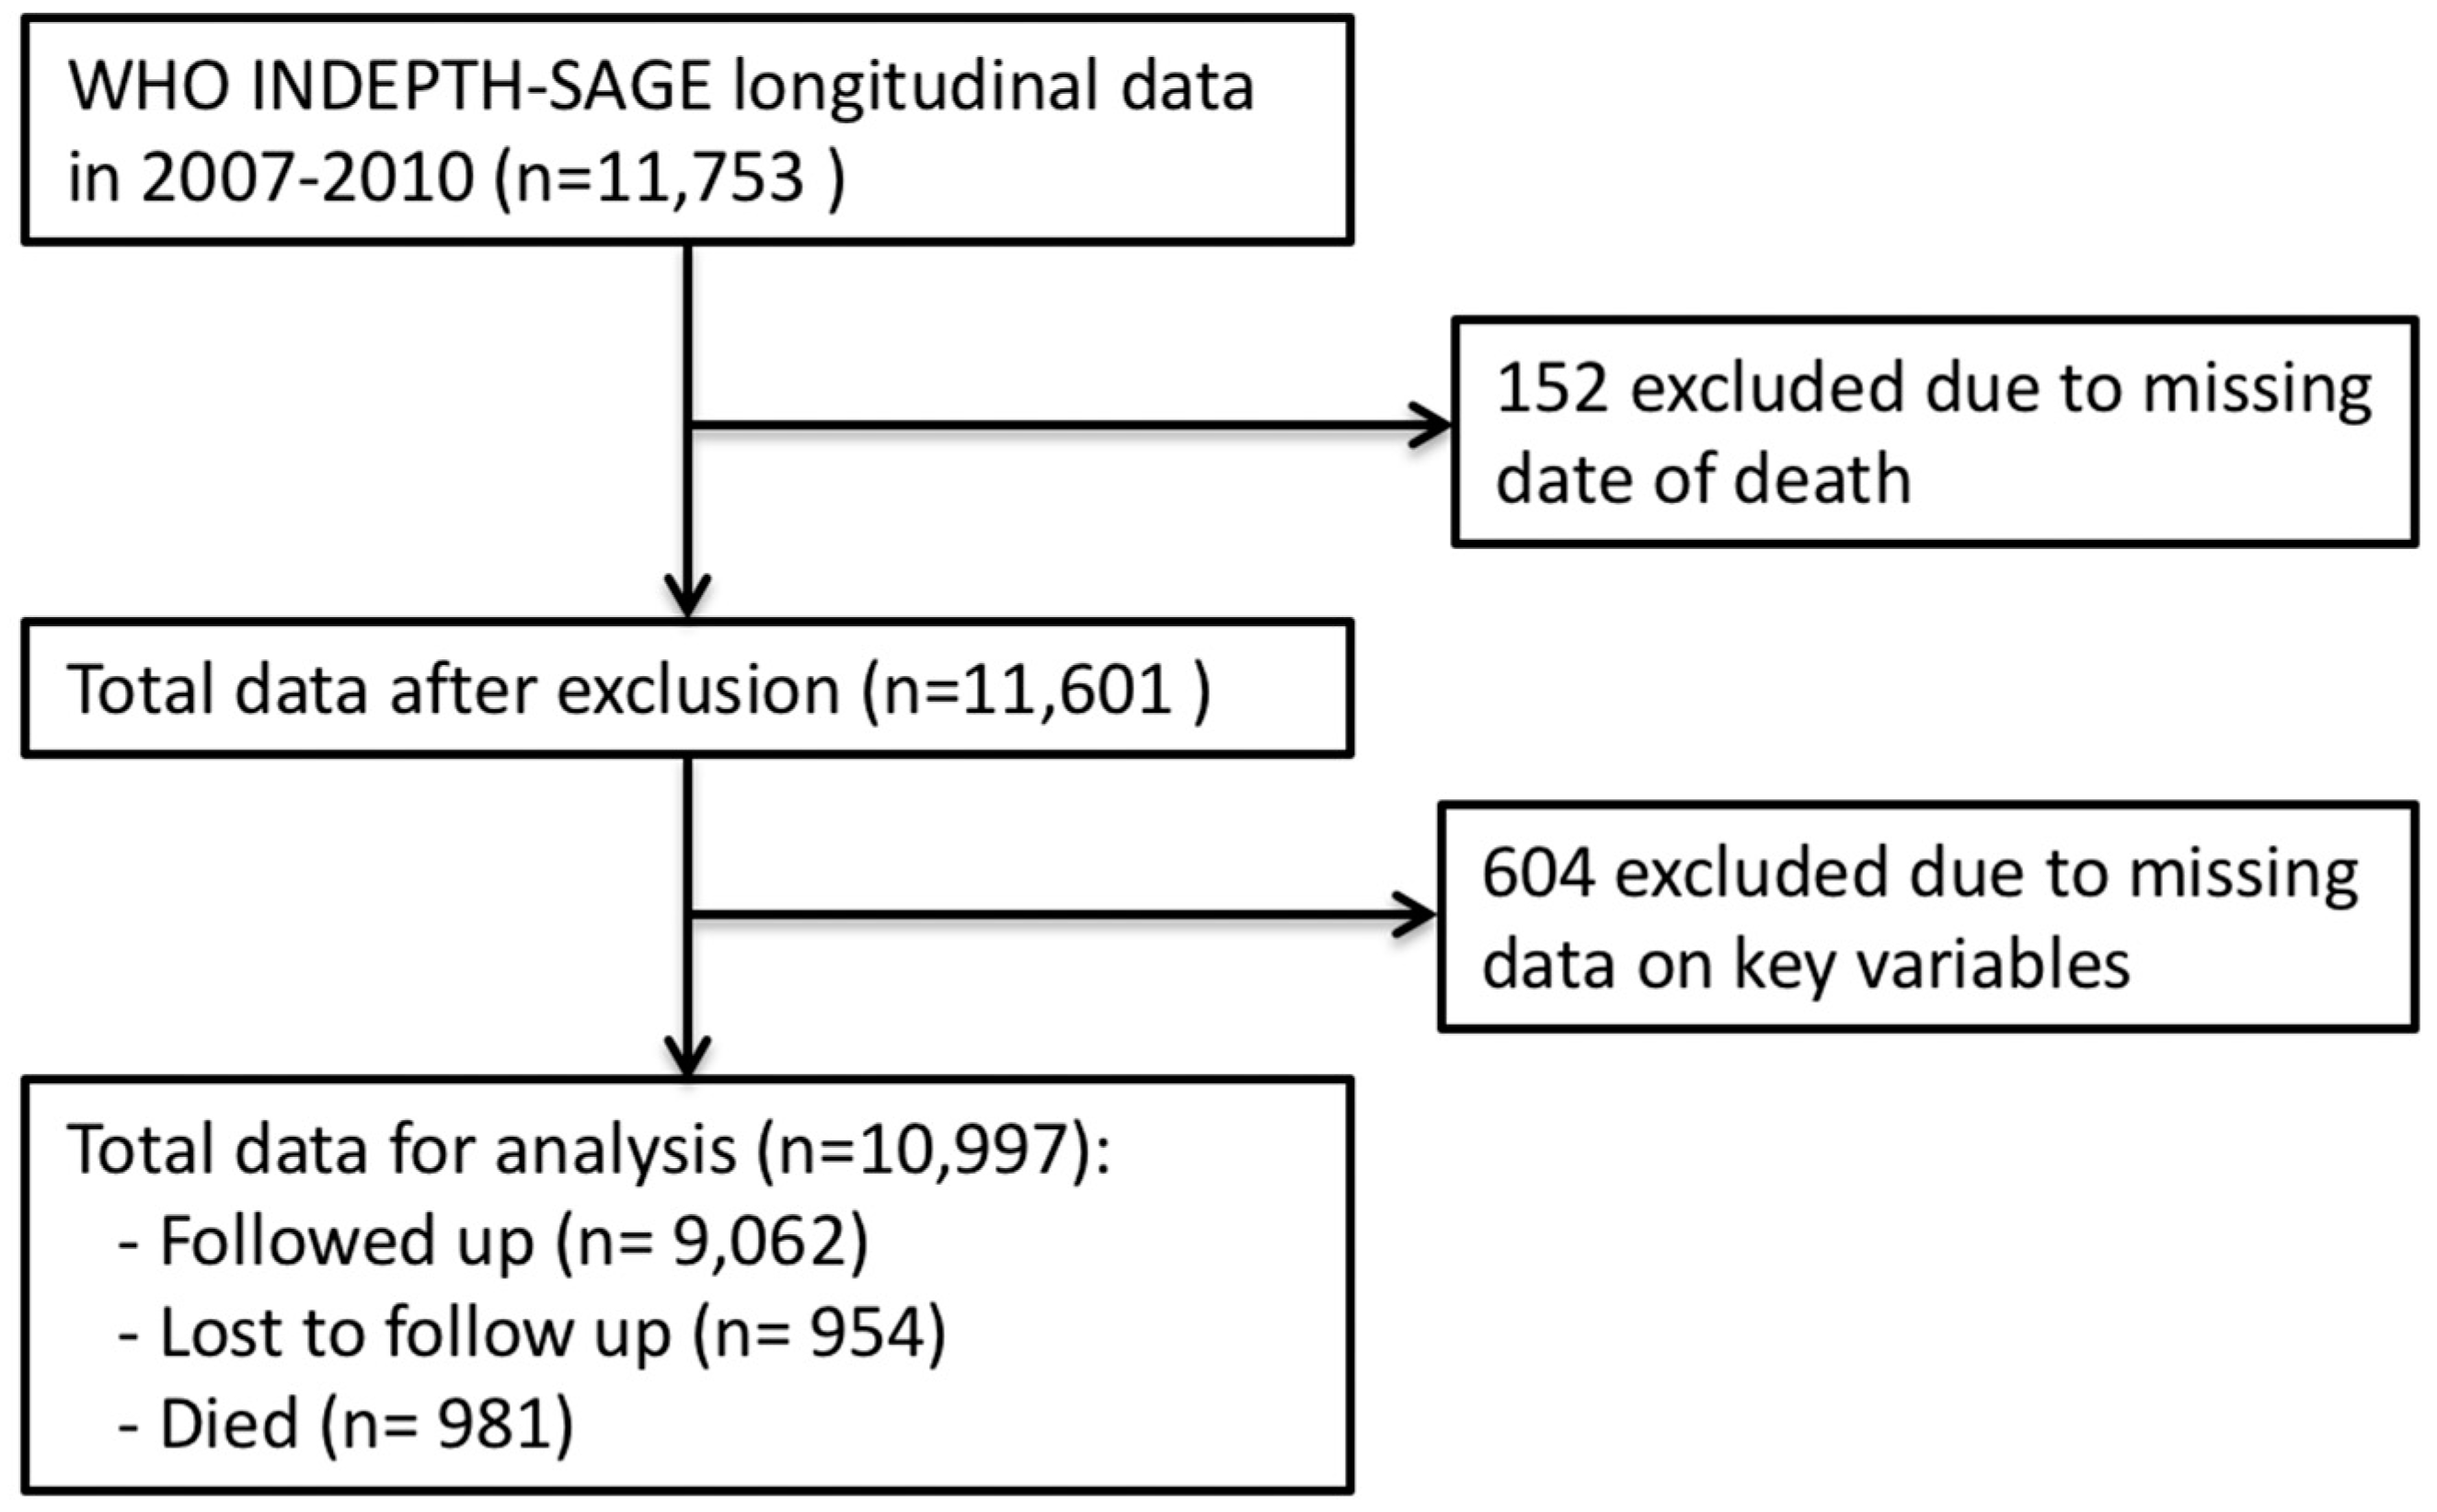
2. Methods
Study Setting
3. Instruments and Variables
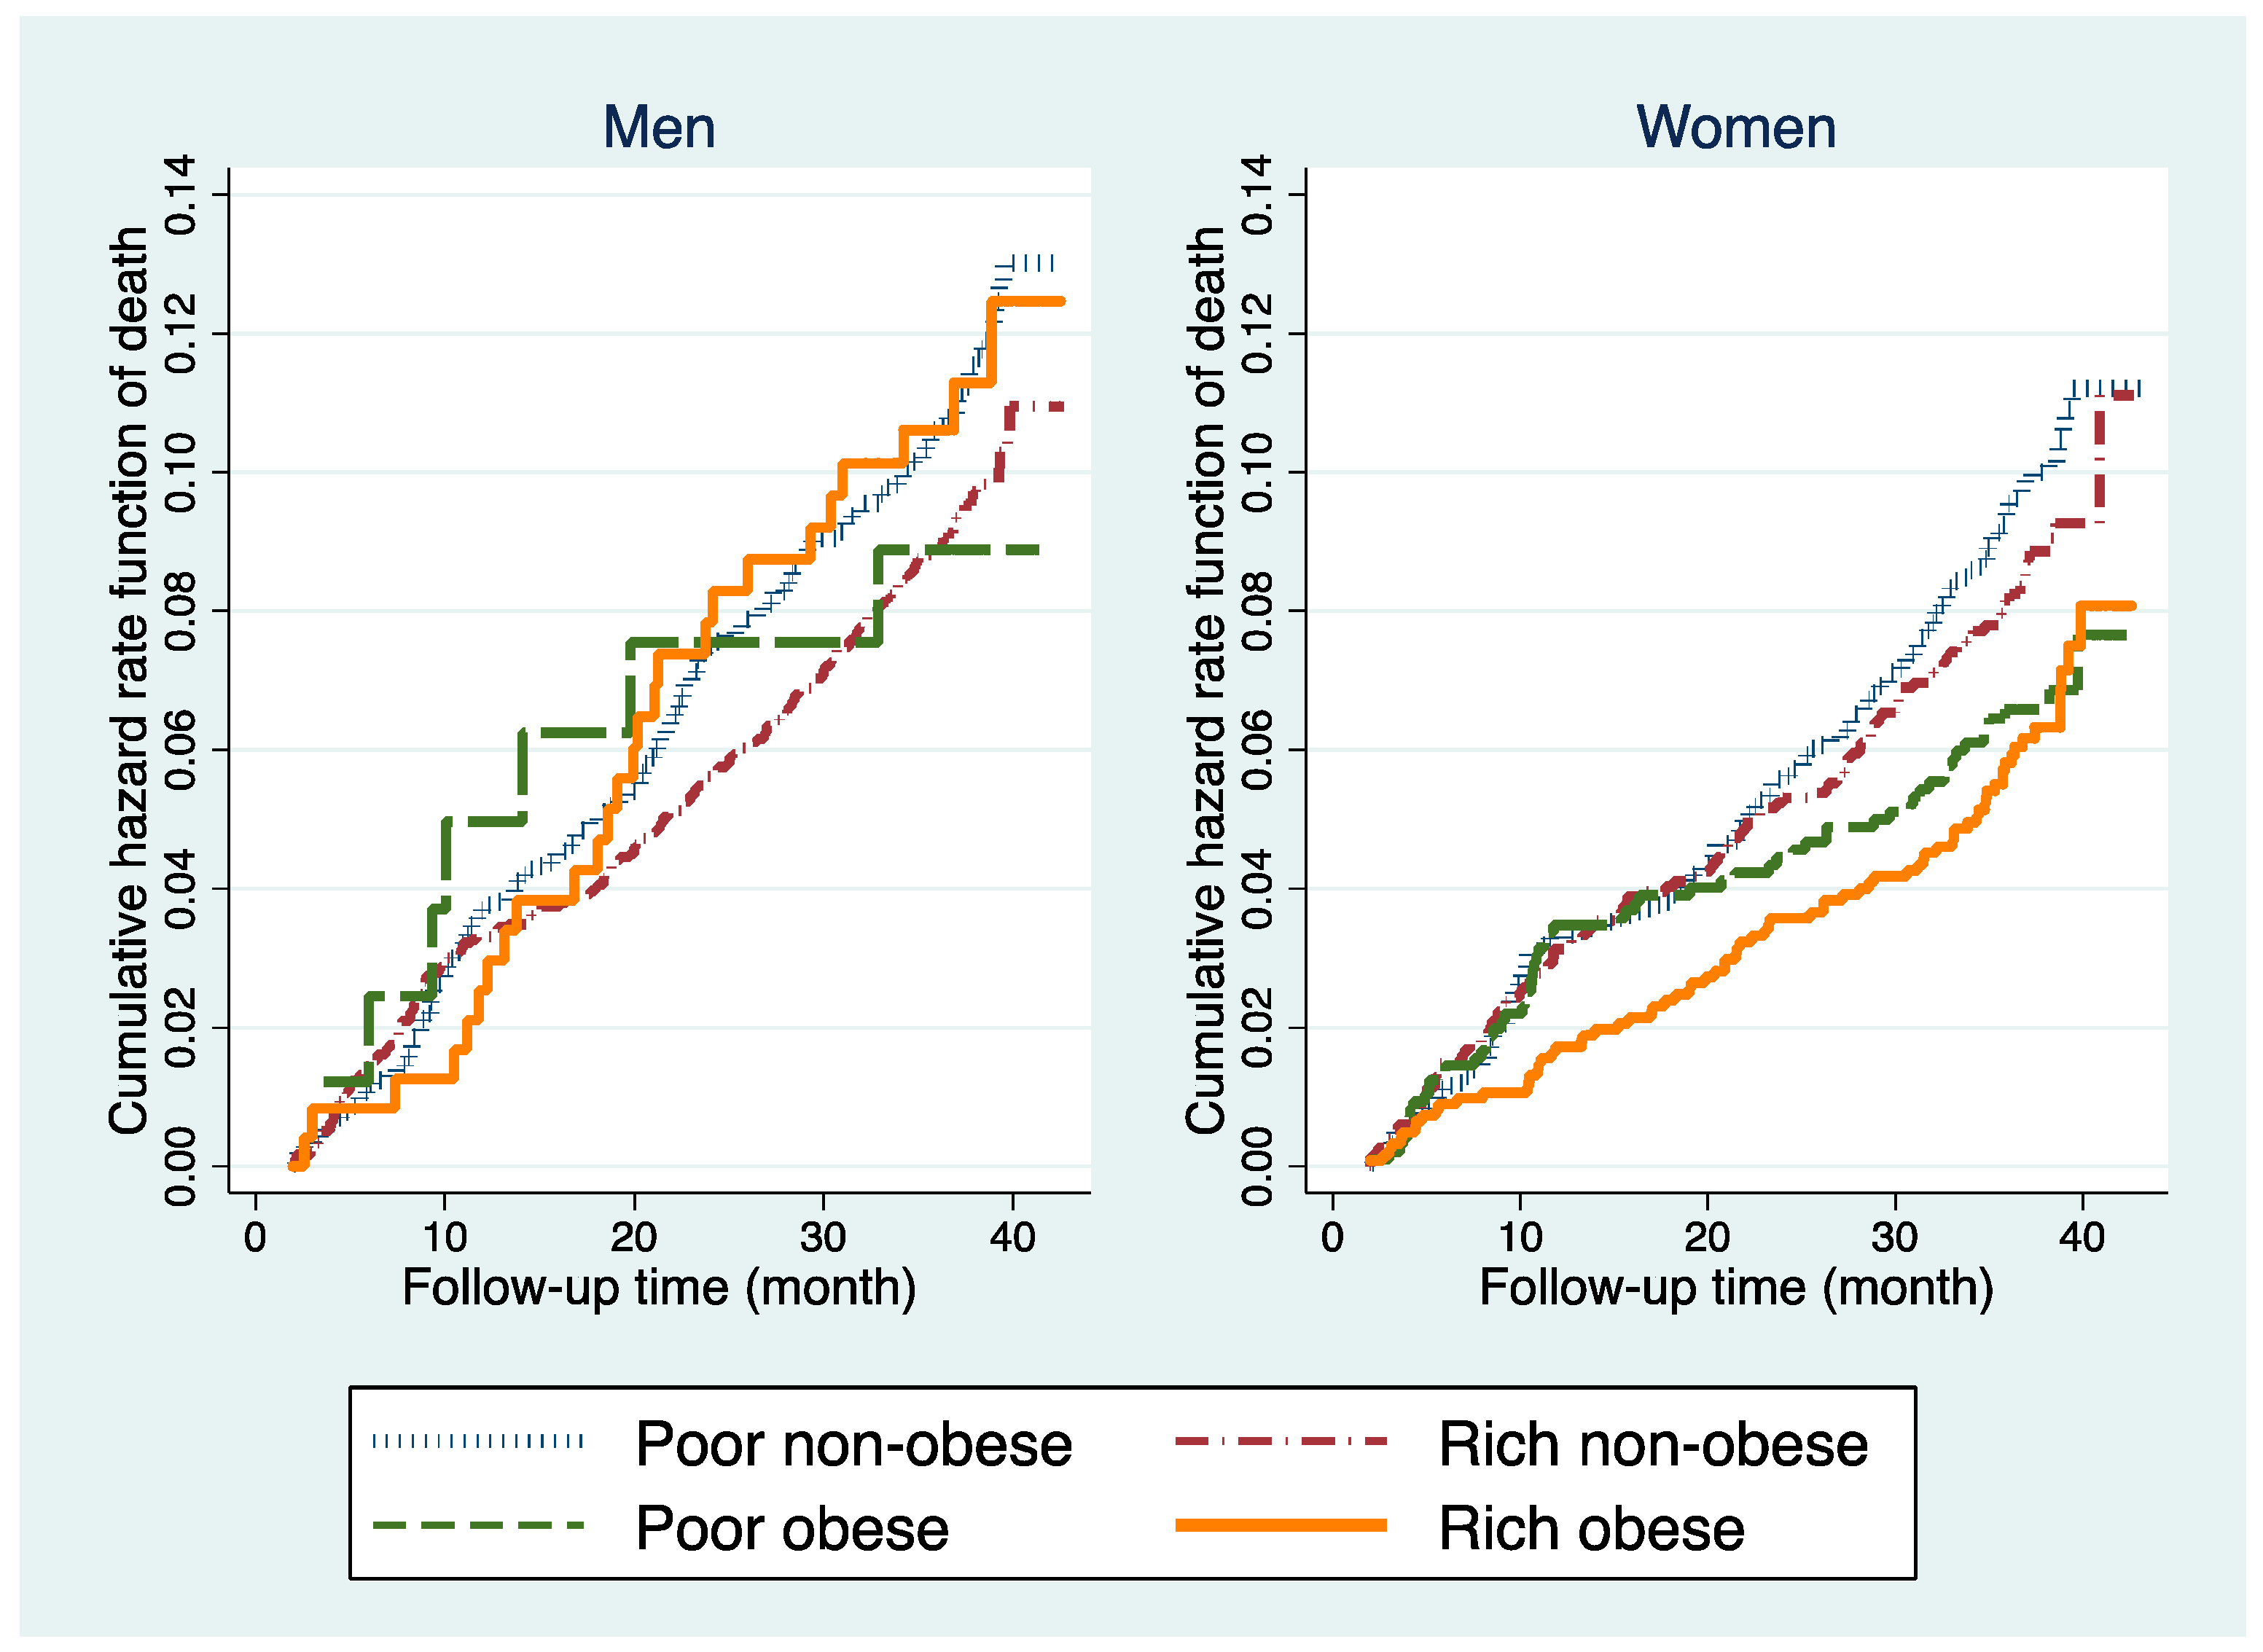
4. Statistical Analyses
5. Ethics
6. Results
7. Discussion
Strength, Limitations and Future Studies
8. Conclusions
Supplementary Materials
Author Contributions
Funding
Acknowledgments
Conflicts of Interest
References
- World Health Organization. Global Status Report on Noncommunicable Diseases 2014; World Health Organization: Geneva, Switzerland, 2014. [Google Scholar]
- Borrell, L.N.; Samuel, L. Body mass index categories and mortality risk in US adults: The effect of overweight and obesity on advancing death. Am. J. Public Health 2014, 104, 512–519. [Google Scholar] [CrossRef] [PubMed]
- Cerhan, J.R.; Moore, S.C.; Jacobs, E.J.; Kitahara, C.M.; Rosenberg, P.S.; Adami, H.-O.; Ebbert, J.O.; English, D.R.; Gapstur, S.M.; Giles, G.G.; et al. A pooled analysis of waist circumference and mortality in 650,000 adults. Mayo Clin. Proc. 2014, 89, 335–345. [Google Scholar] [CrossRef] [PubMed]
- De Hollander, E.L.; Bemelmans, W.J.; Boshuizen, H.C.; Friedrich, N.; Wallaschofski, H.; Guallar-Castillon, P.; Walter, S.; Zillikens, M.C.; Rosengren, A.; Lissner, L.; et al. The association between waist circumference and risk of mortality considering body mass index in 65- to 74-year-olds: A meta-analysis of 29 cohorts involving more than 58,000 elderly persons. Int. J. Epidemiol. 2012, 41, 805–817. [Google Scholar] [CrossRef] [PubMed]
- Di Angelantonio, E.; Bhupathiraju, S.N.; Wormser, D.; Gao, P.; Kaptoge, S.; de Gonzalez, A.B.; Cairns, B.J.; Huxley, R.; Jackson, C.L.; Joshy, G.; et al. Body-mass index and all-cause mortality: Individual-participant-data meta-analysis of 239 prospective studies in four continents. Lancet 2016, 388, 776–786. [Google Scholar] [CrossRef]
- Pischon, T.; Boeing, H.; Hoffmann, K.; Bergmann, M.; Schulze, M.B.; Overvad, K.; van der Schouw, Y.T.; Spencer, E.; Moons, K.G.M.; Tjønneland, A.; et al. General and abdominal adiposity and risk of death in Europe. N. Engl. J. Med. 2008, 359, 2105–2120. [Google Scholar] [CrossRef] [PubMed]
- Reis, J.P.; Macera, C.A.; Araneta, M.R.; Lindsay, S.P.; Marshall, S.J.; Wingard, D.L. Comparison of overall obesity and body fat distribution in predicting risk of mortality. Obesity 2009, 17, 1232–1239. [Google Scholar] [CrossRef] [PubMed]
- Winter, J.E.; MacInnis, R.J.; Wattanapenpaiboon, N.; Nowson, C.A. BMI and all-cause mortality in older adults: A meta-analysis. Am. J. Clin. Nutr. 2014, 99, 875–890. [Google Scholar] [CrossRef]
- Zheng, W.; McLerran, D.F.; Rolland, B.; Zhang, X.; Inoue, M.; Matsuo, K.; He, J.; Gupta, P.C.; Ramadas, K.; Tsugane, S.; et al. Association between body-mass index and risk of death in more than 1 million Asians. N. Engl. J. Med. 2011, 364, 719–729. [Google Scholar] [CrossRef]
- World Health Organization. Obesity: Preventing and Managing the Global Epidemic; Report of a WHO Consultation (WHO Technical Report Series 894); World Health Organization: Geneva, Switzerland, 2000. [Google Scholar]
- Bowman, K.; Delgado, J.; Henley, W.E.; Masoli, J.A.; Kos, K.; Brayne, C.; Thokala, P.; Lafortune, L.; Kuchel, G.A.; Ble, A.; et al. Obesity in older people with and without conditions associated with weight loss: Follow-up of 955,000 primary care patients. J. Gerontol. Ser. A 2017, 72, 203–209. [Google Scholar] [CrossRef]
- Flegal, K.M.; Kit, B.K.; Orpana, H.; Graubard, B.I. Association of all-cause mortality with overweight and obesity using standard body mass index categories: A systematic review and meta-analysis. JAMA 2013, 309, 71–82. [Google Scholar] [CrossRef]
- Hainer, V.; Aldhoon-Hainerova, I. Obesity paradox does exist. Diabetes Care 2013, 36 (Suppl. 2), S276–S281. [Google Scholar] [CrossRef] [PubMed]
- Beleigoli, A.M.; Boersma, E.; Diniz Mde, F.; Lima-Costa, M.F.; Ribeiro, A.L. Overweight and class I obesity are associated with lower 10-year risk of mortality in Brazilian older adults: The Bambui Cohort Study of Ageing. PLoS ONE 2012, 7, e52111. [Google Scholar] [CrossRef] [PubMed]
- Hamer, M.; O’Donovan, G. Sarcopenic obesity, weight loss, and mortality: The English Longitudinal Study of Ageing. Am. J. Clin. Nutr. 2017, 106, 125–129. [Google Scholar] [CrossRef] [PubMed]
- Vlassopoulos, A.; Combet, E.; Lean, M.E. Changing distributions of body size and adiposity with age. Int. J. Obes. 2014, 38, 857–864. [Google Scholar] [CrossRef] [PubMed]
- Jacobs, E.J.; Newton, C.C.; Wang, Y.; Patel, A.V.; McCullough, M.L.; Campbell, P.T.; Thun, M.J.; Gapstur, S.M. Waist circumference and all-cause mortality in a large US cohort. Arch. Intern. Med. 2010, 170, 1293–1301. [Google Scholar] [CrossRef] [PubMed]
- Seidell, J.C. Waist circumference and waist/hip ratio in relation to all-cause mortality, cancer and sleep apnea. Eur. J. Clin. Nutr. 2010, 64, 35–41. [Google Scholar] [CrossRef]
- Seidell, J.C.; Visscher, T.L. Body weight and weight change and their health implications for the elderly. Eur. J. Clin. Nutr. 2000, 54 (Suppl. 3), S33–S39. [Google Scholar] [CrossRef]
- Testa, G.; Cacciatore, F.; Galizia, G.; Della-Morte, D.; Mazzella, F.; Langellotto, A.; Russo, S.; Gargiulo, G.; De Santis, D.; Ferrara, N.; et al. Waist circumference but not body mass index predicts long-term mortality in elderly subjects with chronic heart failure. J. Am. Geriatr. Soc. 2010, 58, 1433–1440. [Google Scholar] [CrossRef]
- Rachmi, C.N.; Li, M.; Alison Baur, L. Overweight and obesity in Indonesia: Prevalence and risk factors—A literature review. Public Health 2017, 147, 20–29. [Google Scholar] [CrossRef]
- Schroders, J.; Wall, S.; Hakimi, M.; Dewi, F.S.T.; Weinehall, L.; Nichter, M.; Nilsson, M.; Kusnanto, H.; Rahajeng, E.; Ng, N. How is Indonesia coping with its epidemic of chronic noncommunicable diseases? A systematic review with meta-analysis. PLoS ONE 2017, 12, e0179186. [Google Scholar]
- Kabupaten Purworejo Dalam Angka 2017 (Purworejo Regency in Figures 2017) [Internet]. Badan Pusat Statistik Kabupaten Purworejo, 2017. Available online: https://purworejokab.bps.go.id/website/pdf_publikasi/Kabupaten-Purworejo-Dalam-Angka-2017.pdf (accessed on 4 October 2017).
- Ng, N.; Kowal, P.; Kahn, K.; Naidoo, N.; Abdullah, S.; Bawah, A.; Binka, F.; Chuc, N.T.K.; Debpuur, C.; Egondi, T.; et al. Health inequalities among older men and women in Africa and Asia: Evidence from eight Health and Demographic Surveillance System sites in the INDEPTH WHO-SAGE Study. Glob. Health Act. 2010, 3, 5420. [Google Scholar] [CrossRef] [PubMed]
- Kowal, P.; Chatterji, S.; Naidoo, N.; Biritwum, R.; Fan, W.; Ridaura, R.L.; Maximova, T.; Arokiasamy, P.; Phaswana-Mafuya, N.; Williams, S.; et al. Data resource profile: The World Health Organization Study on global AGEing and adult health (SAGE). Int. J. Epidemiol. 2012, 41, 1639–1649. [Google Scholar] [CrossRef] [PubMed]
- World Health Organization. Waist Circumference and Waist–Hip Ratio: Report of a WHO Expert Consultation, Geneva, 8–11 December 2008; World Health Organization: Geneva, Switzerland, 2011. [Google Scholar]
- Alberti, K.G.M.M.; Zimmet, P.; Shaw, J. Metabolic syndrome—A new world-wide definition. A consensus statement from the International Diabetes Federation. Diabet. Med. 2006, 23, 469–480. [Google Scholar] [CrossRef] [PubMed]
- Howe, L.D.; Galobardes, B.; Matijasevich, A.; Gordon, D.; Johnston, D.; Onwujekwe, O.; Patel, R.; Webb, E.A.; Lawlor, D.A.; Hargreaves, J.R.; et al. Measuring socio-economic position for epidemiological studies in low- and middle-income countries: A methods of measurement in epidemiology paper. Int. J. Epidemiol. 2012, 41, 871–886. [Google Scholar] [CrossRef] [PubMed]
- Pujilestari, C.U.; Nystrom, L.; Norberg, M.; Weinehall, L.; Hakimi, M.; Ng, N. Socioeconomic inequality in abdominal obesity among older people in Purworejo District, Central Java, Indonesia—A decomposition analysis approach. Int. J. Equity Health 2017, 16, 214. [Google Scholar] [CrossRef] [PubMed]
- Gasparrini, A. Distributed lag linear and non-linear models in R: The package dlnm. J. Stat. Softw. 2011, 43, 1–20. [Google Scholar] [CrossRef]
- Zamboni, M.; Mazzali, G.; Zoico, E.; Harris, T.B.; Meigs, J.B.; Di Francesco, V.; Fantin, F.; Bissoli, L.; Bosello, O. Health consequences of obesity in the elderly: A review of four unresolved questions. Int. J. Obes. 2005, 29, 1011–1029. [Google Scholar] [CrossRef]
- Hughes, V. The big fat truth. Nature 2013, 497, 428–430. [Google Scholar] [CrossRef]
- Watson, R.R. Handbook of Nutrition in the Aged, 4th ed.; Taylor & Francis: New York, NY, USA, 2009. [Google Scholar]
- Lee, S.; Kuk, J.L.; Hannon, T.S.; Arslanian, S.A. Race and gender differences in the relationships between anthropometrics and abdominal fat in youth. Obesity 2008, 16, 1066–1071. [Google Scholar] [CrossRef]
- Qiao, Q.; Nyamdorj, R. The optimal cutoff values and their performance of waist circumference and waist-to-hip ratio for diagnosing type II diabetes. Eur. J. Clin. Nutr. 2010, 64, 23–29. [Google Scholar] [CrossRef]
- Wang, Z.; Ma, J.; Si, D. Optimal cut-off values and population means of waist circumference in different populations. Nutr. Res. Rev. 2010, 23, 191–199. [Google Scholar] [CrossRef] [PubMed] [Green Version]
- Haldar, S.; Chia, S.C.; Henry, C.J. Body composition in Asians and Caucasians: Comparative analyses and influences on cardiometabolic outcomes. Adv. Food Nutr. Res. 2015, 75, 97–154. [Google Scholar] [PubMed]
- Wildman, R.P.; Gu, D.; Reynolds, K.; Duan, X.; He, J. Appropriate body mass index and waist circumference cutoffs for categorization of overweight and central adiposity among Chinese adults. Am. J. Clin. Nutr. 2004, 80, 1129–1136. [Google Scholar] [CrossRef] [Green Version]
- Hastuti, J.; Kagawa, M.; Byrne, N.M.; Hills, A.P. Determination of new anthropometric cut-off values for obesity screening in Indonesian adults. Asia Pac. J. Clin. Nutr. 2017, 26, 650–656. [Google Scholar] [PubMed]
- Marmot, M.; Bell, R. Fair society, healthy lives. Public Health 2012, 126 (Suppl. 1), S4–S10. [Google Scholar] [CrossRef]
- Demakakos, P.; Biddulph, J.P.; Bobak, M.; Marmot, M.G. Wealth and mortality at older ages: A prospective cohort study. J. Epidemiol. Community Health 2016, 70, 346–353. [Google Scholar] [CrossRef] [PubMed]
- Utomo, B.; Sucahya, P.K.; Utami, F.R. Priorities and realities: Addressing the rich-poor gaps in health status and service access in Indonesia. Int. J. Equity Health 2011, 10, 47. [Google Scholar] [CrossRef]
- Pujilestari, C.U.; Ng, N.; Hakimi, M.; Eriksson, M. “It is not possible for me to have diabetes”-community perceptions on diabetes and its risk factors in Rural Purworejo District, Central Java, Indonesia. Glob. J. Health Sci. 2014, 6, 204–218. [Google Scholar] [CrossRef]
- Aizawa, T. Regional disparity in the body mass index distribution of Indonesians: New evidence beyond the mean. Bull. Indones. Econ. Stud. 2018, 54, 85–112. [Google Scholar] [CrossRef]
- Ng, N.; Hakimi, M.; Van Minh, H.; Juvekar, S.; Razzaque, A.; Ashraf, A.; Ahmed, S.M.; Kanungsukkasem, U.; Soonthornthada, K.; Bich, T.H. Prevalence of physical inactivity in nine rural INDEPTH Health and Demographic Surveillance Systems in five Asian countries. Glob. Health Action 2009, 2 (Suppl. 1), 44–53. [Google Scholar] [CrossRef]
- Vina, E.R.; Kwoh, C.K. Epidemiology of osteoarthritis: Literature update. Curr. Opin. Rheumatol. 2018, 30, 160–167. [Google Scholar] [CrossRef] [PubMed]
- Kivipelto, M.; Ngandu, T.; Fratiglioni, L.; Viitanen, M.; Kareholt, I.; Winblad, B.; Helkala, E.-L.; Tuomilehto, J.; Soininen, H.; Nissinen, A. Obesity and vascular risk factors at midlife and the risk of dementia and Alzheimer disease. Arch. Neurol. 2005, 62, 1556–1560. [Google Scholar] [CrossRef] [PubMed]
- Janssen, I.; Bacon, E. Effect of current and midlife obesity status on mortality risk in the elderly. Obesity 2008, 16, 2504–2509. [Google Scholar] [CrossRef] [PubMed]


| Characteristic | Number (%) | Death Rate/1000 people | ||
|---|---|---|---|---|
| Men (n = 5129) | Women (n = 5868) | Men (n = 511) | Women (n = 470) | |
| Sex | 99 | 80 | ||
| Age (years) | ||||
| 50–59 | 1921 (37.5) | 2130 (36.3) | 31 | 27 |
| 60–69 | 1681 (32.8) | 2097 (35.7) | 89 | 74 |
| 70–79 | 1186 (23.1) | 1331 (22.7) | 172 | 137 |
| 80+ | 341 (6.6) | 310 (5.3) | 287 | 235 |
| Education | ||||
| No formal education | 803 (15.7) | 2377 (40.5) | 143 | 116 |
| ≤6 years | 3217 (62.7) | 2899 (49.4) | 94 | 56 |
| >6 years | 1109 (21.6) | 592 (10.1) | 83 | 51 |
| Occupation | ||||
| Non-physical labour | 470 (9.1) | 491 (8.4) | 76 | 31 |
| No occupation | 701 (13.7) | 1915 (32.6) | 231 | 130 |
| Physical labour | 3958 (77.2) | 3462 (59.0) | 79 | 59 |
| Marital status | ||||
| Single/widowed | 648 (12.6) | 2418 (41.2) | 172 | 117 |
| Partnership | 4481 (87.4) | 3450 (58.8) | 89 | 54 |
| Self-reported chronic disease | ||||
| No | 4235 (82.6) | 4710 (80.3) | 77 | 65 |
| Yes | 894 (17.4) | 1158 (19.7) | 204 | 142 |
| Residence | ||||
| Coastal | 2556 (49.8) | 2943 (50.2) | 94 | 84 |
| Inland | 1225 (23.9) | 1473 (25.1) | 122 | 71 |
| Hilly & mountainous | 1348 (26.3) | 1452 (24.7) | 89 | 80 |
| Wealth status | ||||
| Poor | 2521 (49.2) | 3141 (53.5) | 107 | 86 |
| Rich | 2608 (50.8) | 2727 (46.5) | 92 | 74 |
| Abdominal obesity | 322 (6.3) | 2198 (37.5) | 102 | 63 |
| N | Percentiles | ||||||||
|---|---|---|---|---|---|---|---|---|---|
| 5th | 25th | 75th | 95th | ||||||
| Waist (cm) | HR (95% CI) | Waist (cm) | HR (95% CI) | Waist (cm) | HR (95% CI) | Waist (cm) | HR (95% CI) | ||
| Men | |||||||||
| Poor | 2521 | 64 | 2.06 (1.28, 3.31) * | 70 | 1.51 (0.94, 2.41) | 80 | 1.27 (0.83, 1.94) | 88 | 1.06 (0.91, 1.22) |
| Rich | 2608 | 65 | 1.01 (0.67, 1.54) | 72 | 1.00 (0.69, 1.47) | 83 | 0.92 (0.74, 1.16) | 93 | 1.01 (0.92, 1.12) |
| Women | |||||||||
| Poor | 3141 | 62 | 1.36 (0.97, 1.90) | 69 | 1.39 (1.06,1.82) * | 81 | 0.98 (0.93, 1.03) | 92 | 0.89 (0.64, 1.25) |
| Rich | 2727 | 63 | 1.32 (0.86, 2.03) | 72 | 1.22 (0.89, 1.66) | 85 | 0.98 (0.77, 1.24) | 97 | 1.24 (0.78, 1.98) |
| Men | Women | |||
|---|---|---|---|---|
| Poor | Rich | Poor | Rich | |
| N | 2521 | 2608 | 3141 | 2727 |
| Death rate/1000 | 107 | 92 | 86 | 74 |
| Age (years) | ||||
| 50–59 | Ref. | Ref. | Ref. | Ref. |
| 60–69 | 2.2 (1.4, 3.4) * | 3.4 (2.2, 5.3) * | 2.6 (1.6, 4.1) * | 1.8 (1.1, 2.6) * |
| 70–79 | 3.8 (2.5, 5.9) * | 6.5 (4.1, 10) * | 3.8 (2.4, 6.2) * | 3.1 (1.9, 4.5) * |
| 80+ | 5.0 (3.0, 8.1) * | 12 (7.1, 20) * | 4.8 (2.7, 8.5) * | 5.3 (2.7, 8.5) * |
| Education | ||||
| No formal education | 1.8 (0.93, 3.6) | 1.1 (0.67, 1.8) | 2.1 (0.67, 6.7) | 1.2 (0.73, 1.9) |
| ≤6 years | 1.7 (0.91, 3.3) | 1.0 (0.72, 1.4) | 1.7 (0.53, 5.4) | 0.89 (0.56, 1.4) |
| >6 years | Ref. | Ref. | Ref. | Ref. |
| Occupation | ||||
| Non-physical labour | Ref. | Ref. | Ref. | Ref. |
| No occupation | 2.1 (0.96, 6.0) | 0.81 (0.52, 1.3) | 3.9 (1.4, 10) * | 2.0 (1.1, 3.8) * |
| Physical labour | 0.87 (0.39, 2.3) | 0.46 (0.30, 0.71) | 2.2 (0.79, 5.9) | 1.4 (0.71, 2.6) |
| Marital status | ||||
| Single/widowed | 1.3 (1.0, 1.6) | 1.0 (0.71, 1.4) | 1.1 (0.86, 1.4) | 1.6 (1.2, 2.2) * |
| Partnership | Ref. | Ref. | Ref. | Ref. |
| Self-reported chronic disease | ||||
| No | Ref. | Ref. | Ref. | Ref. |
| Yes | 1.7 (1.3, 2.2) * | 2.4 (1.8, 3.1) * | 2.2 (1.7, 2.9) * | 1.6 (1.2, 2.2) * |
| Residence | ||||
| Coastal | Ref. | Ref. | Ref. | Ref. |
| Inland | 1.6 (1.2, 2.1) * | 1.0 (0.80, 1.4) | 1.0 (0.73, 1.4) | 0.81 (0.58, 1.1) |
| Hilly & mountainous | 1.2 (0.90, 1.5) | 0.81 (0.51, 1.3) | 1.1 (0.80, 1.4) | 1.3 (0.85, 2.1) |
© 2019 by the authors. Licensee MDPI, Basel, Switzerland. This article is an open access article distributed under the terms and conditions of the Creative Commons Attribution (CC BY) license (http://creativecommons.org/licenses/by/4.0/).
Share and Cite
Pujilestari, C.U.; Nyström, L.; Norberg, M.; Ng, N. Waist Circumference and All-Cause Mortality among Older Adults in Rural Indonesia. Int. J. Environ. Res. Public Health 2019, 16, 116. https://0-doi-org.brum.beds.ac.uk/10.3390/ijerph16010116
Pujilestari CU, Nyström L, Norberg M, Ng N. Waist Circumference and All-Cause Mortality among Older Adults in Rural Indonesia. International Journal of Environmental Research and Public Health. 2019; 16(1):116. https://0-doi-org.brum.beds.ac.uk/10.3390/ijerph16010116
Chicago/Turabian StylePujilestari, Cahya Utamie, Lennarth Nyström, Margareta Norberg, and Nawi Ng. 2019. "Waist Circumference and All-Cause Mortality among Older Adults in Rural Indonesia" International Journal of Environmental Research and Public Health 16, no. 1: 116. https://0-doi-org.brum.beds.ac.uk/10.3390/ijerph16010116