Recovery Degree of the Natural Flow Regimes and the Corresponding Economic Costs for Reservoir Operation in Fish Spawning Seasons


Abstract
:1. Introduction
2. Methodology
2.1. Objective Function
2.1.1. Ecological Objective
2.1.2. Hydropower Objective
2.2. Constraints
2.2.1. Water Balance Equation
2.2.2. Water Level Constraint
2.2.3. Hydropower Output Constraint
2.2.4. Turbine Working Constraint
2.2.5. Ecological Flow Constraint
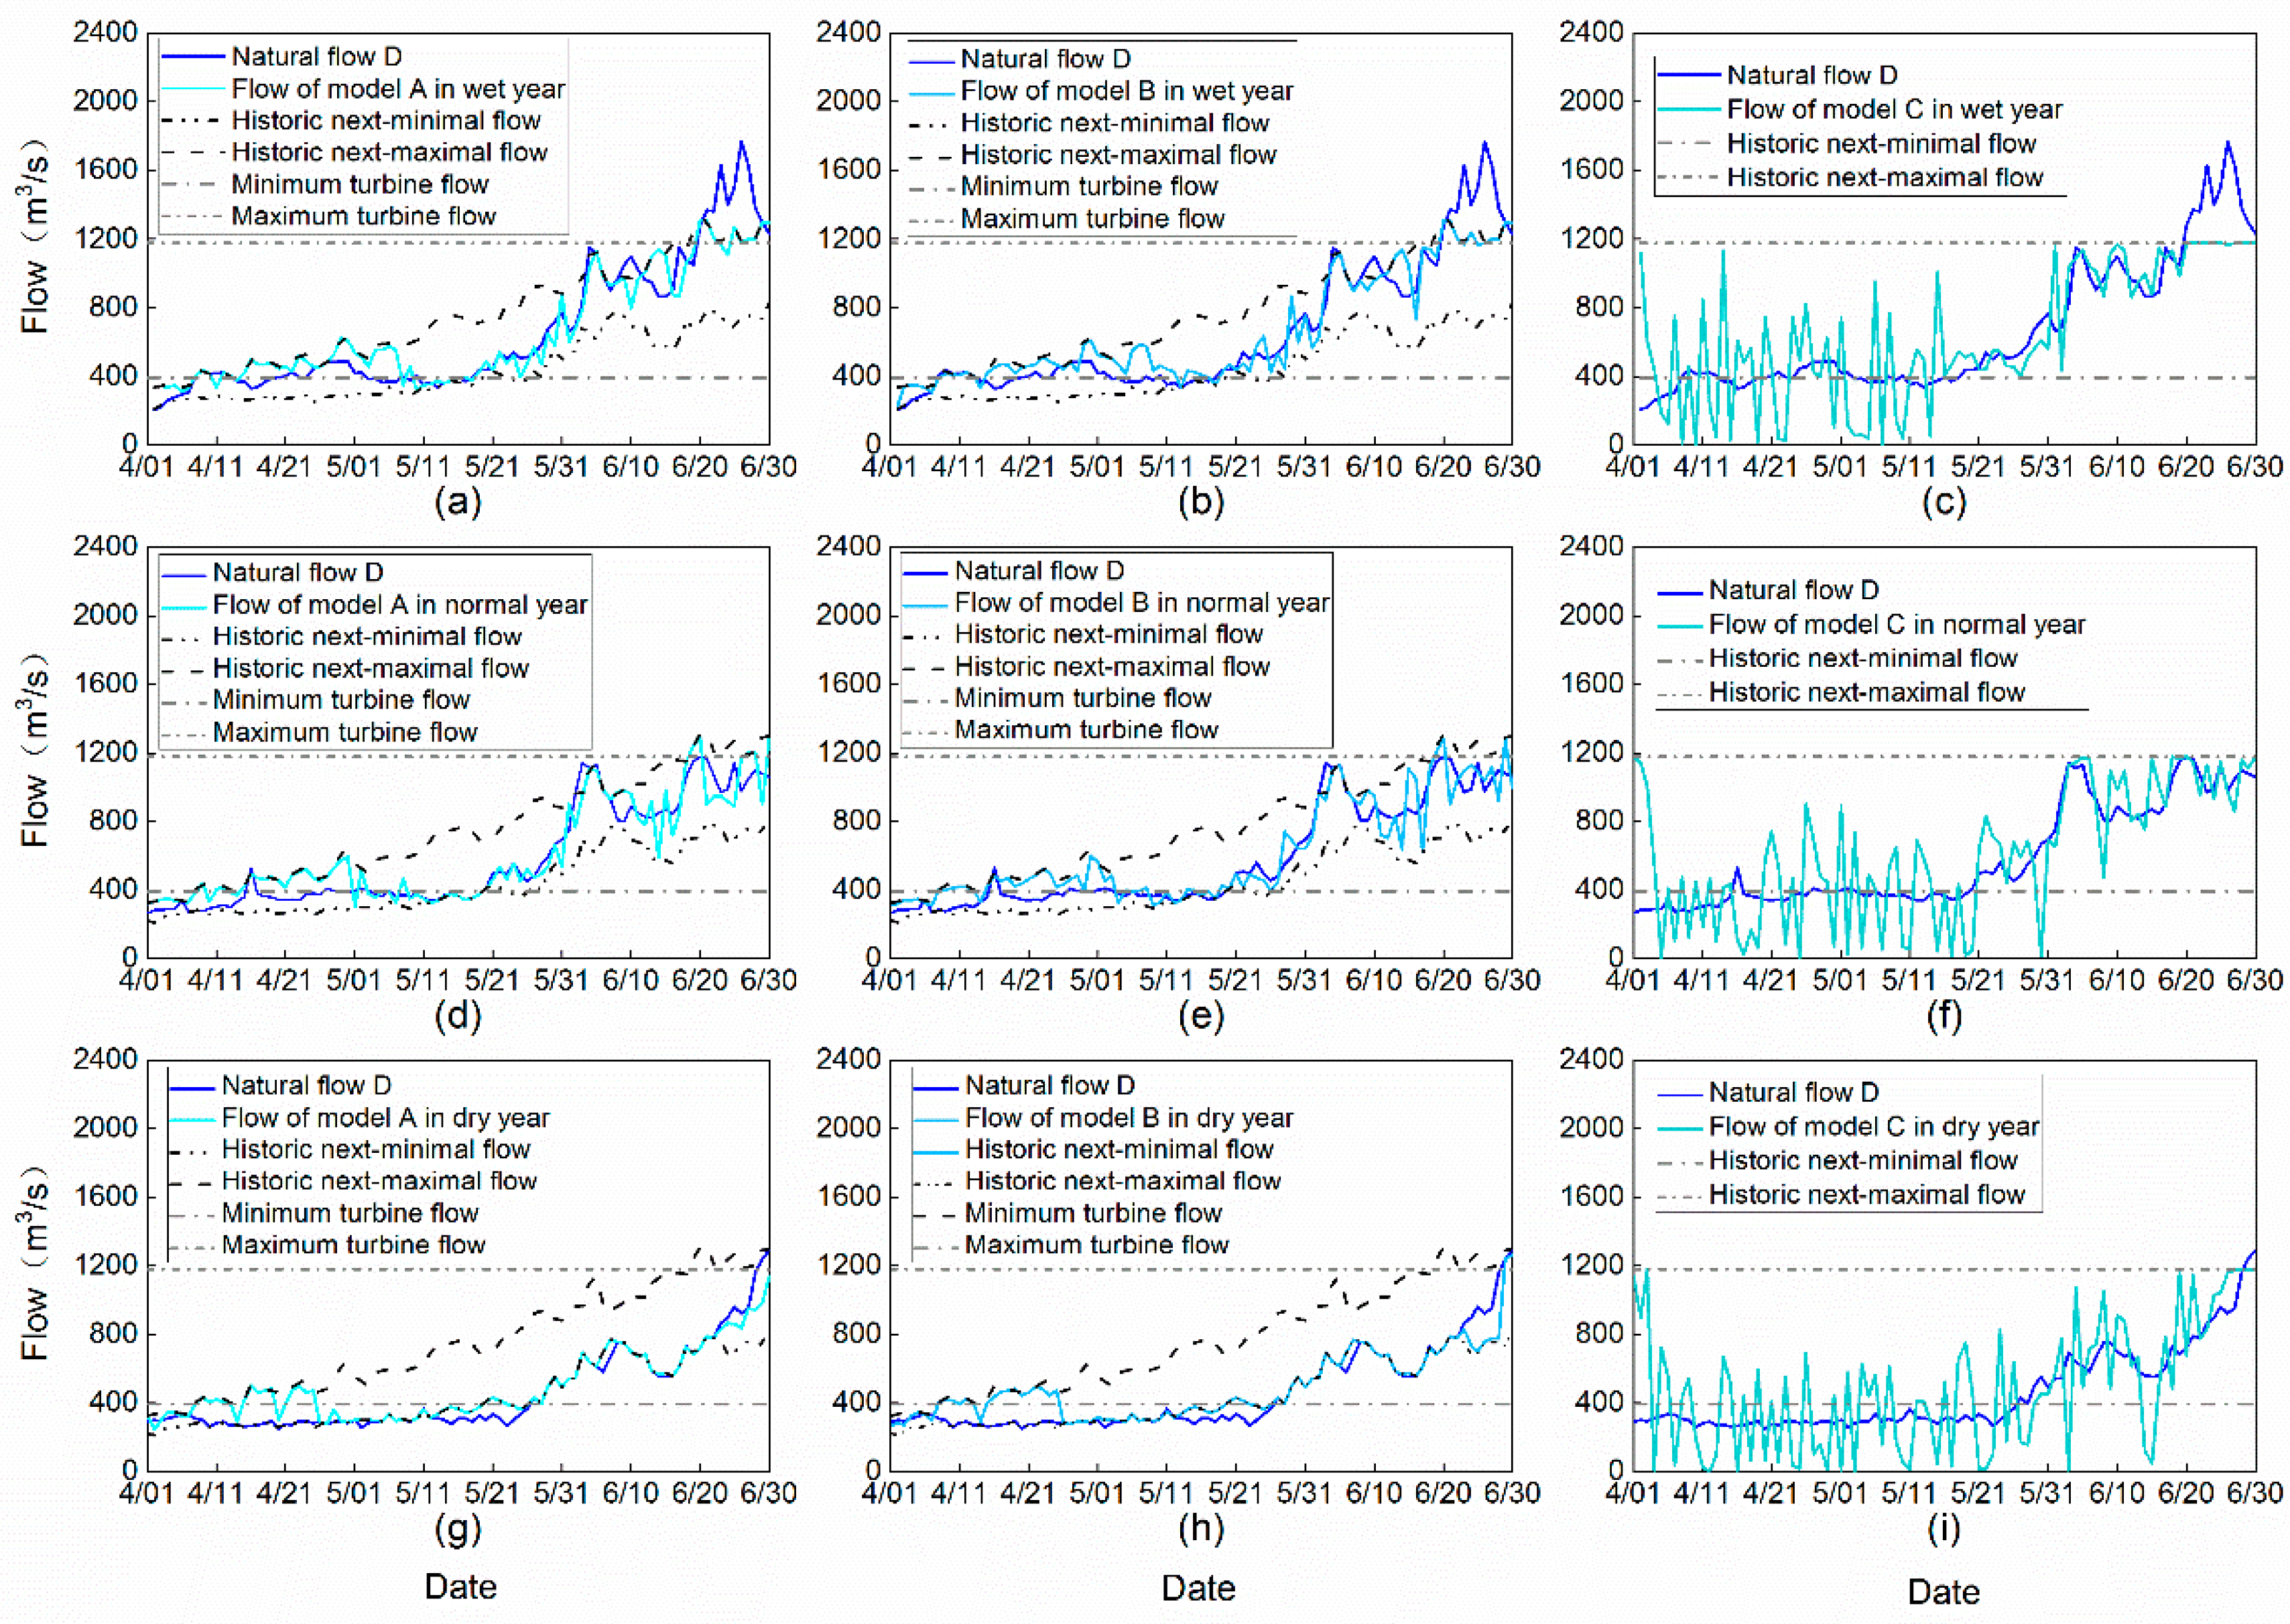
2.3. Optimization Models
- A:
- Minimize Z1 in Equation (1) s.t. Water balance constraint Equation (4) Water level constraint Equation (5) Hydropower constraint Equation (6) Turbine working constraint Equations (7) and (8) Ecological flow constraint Equation (9)
- B:
- Maximize Z2 in Equation (2) s.t. Water balance constraint Equation (4) Water level constraint Equation (5) Hydropower constraint Equation (6) Turbine working constraint Equations (7) and (8) Ecological flow constraint Equation (9)
- C:
- Maximize Z2 in Equation (2) s.t. Water balance constraint Equation (4) Water level constraint Equation (5) Hydropower constraint Equation (6) Turbine working constraint Equations (7) and (8)
- D:
- Natural flow regime (no optimization) Calculate ecological objective in Equation (1) Calculate hydropower objective in Equation (2) s.t. Hydropower constraint Equation (6) Turbine working constraint Equations (7) and (8)
2.4. Implementation
3. Case Study
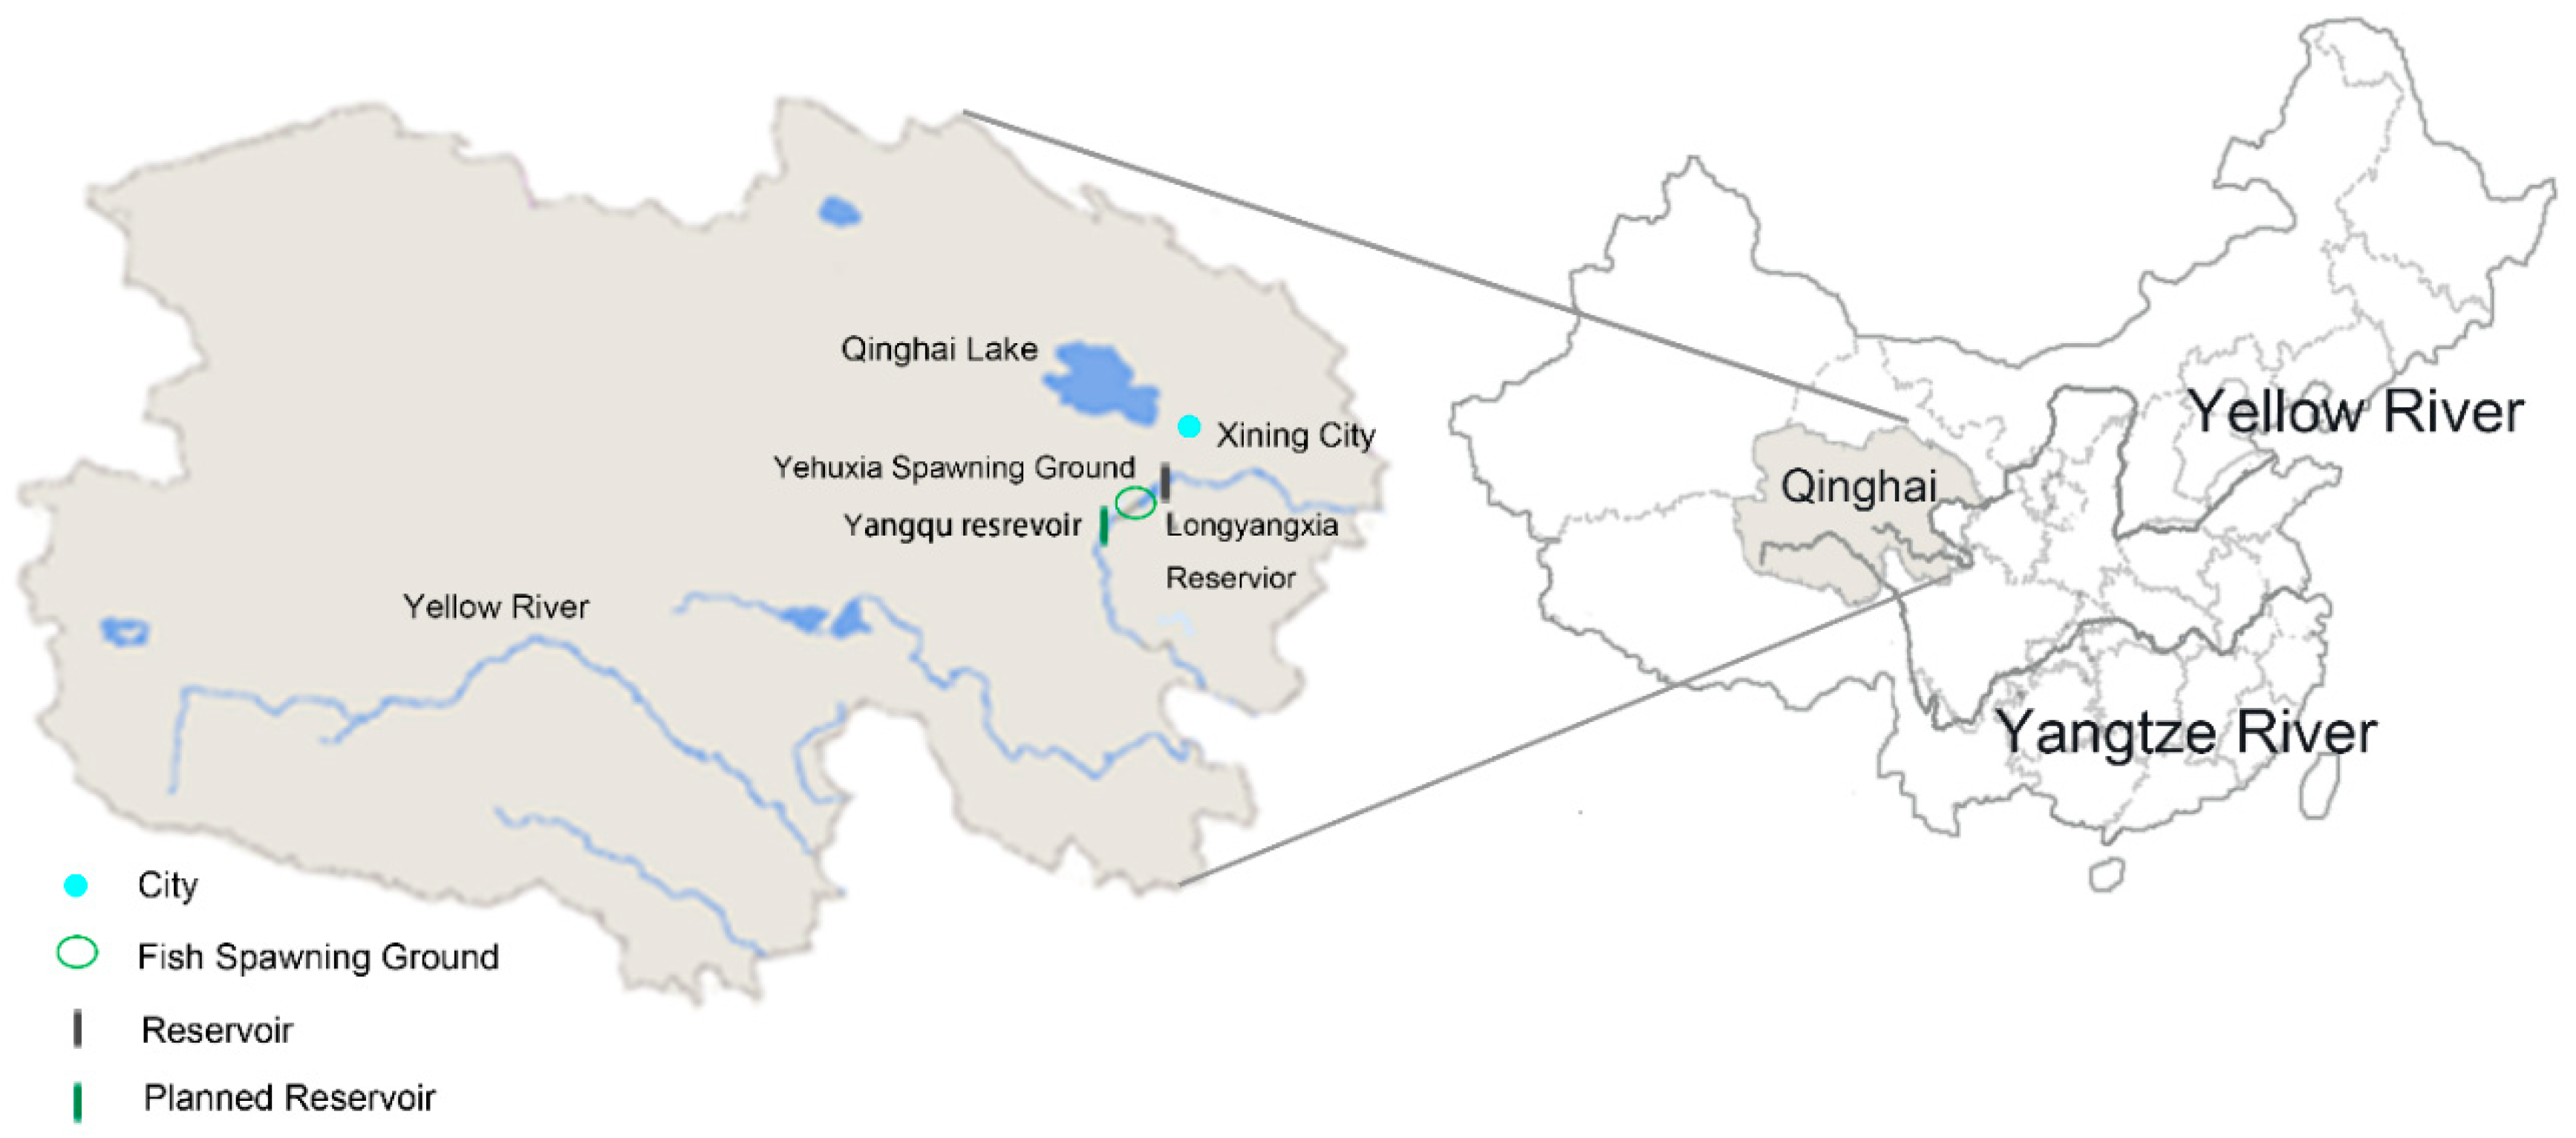
3.1. Study Area
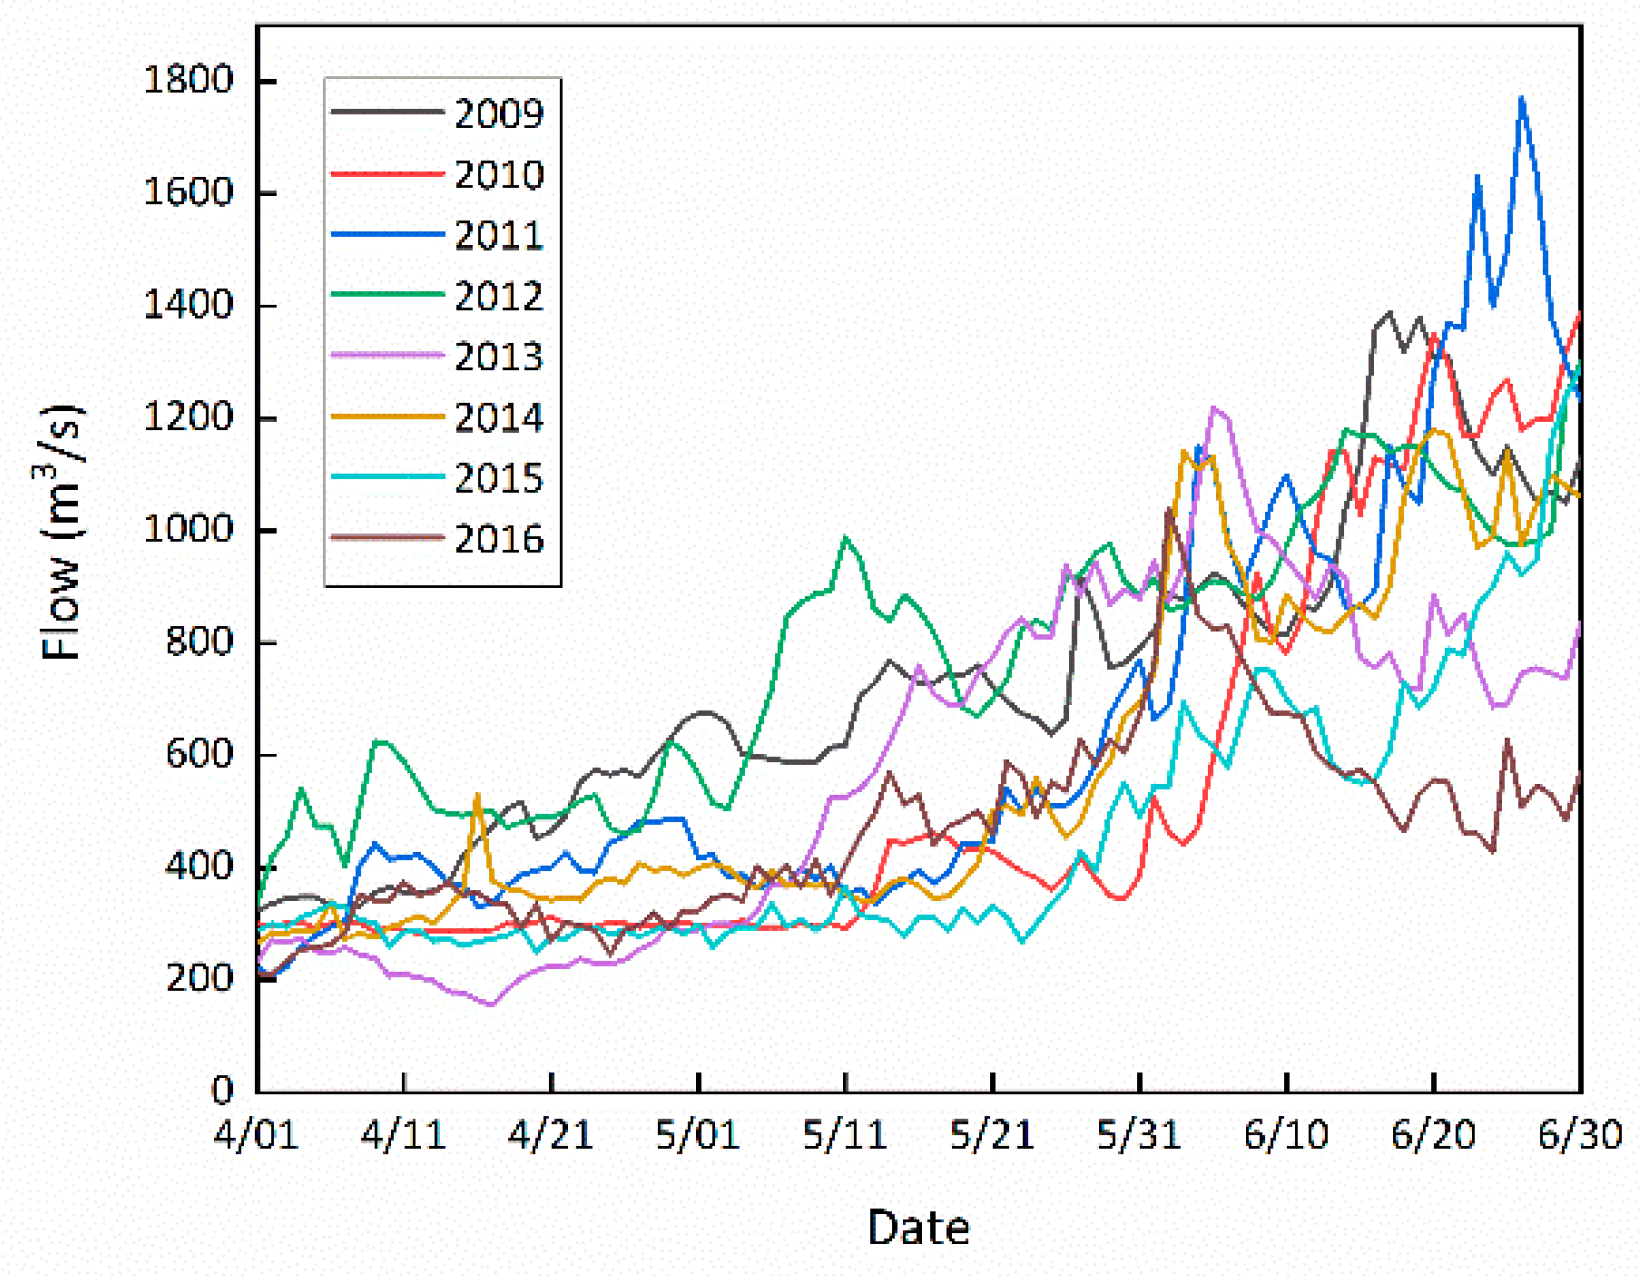
3.2. Analysis of Natural Flow Regimes
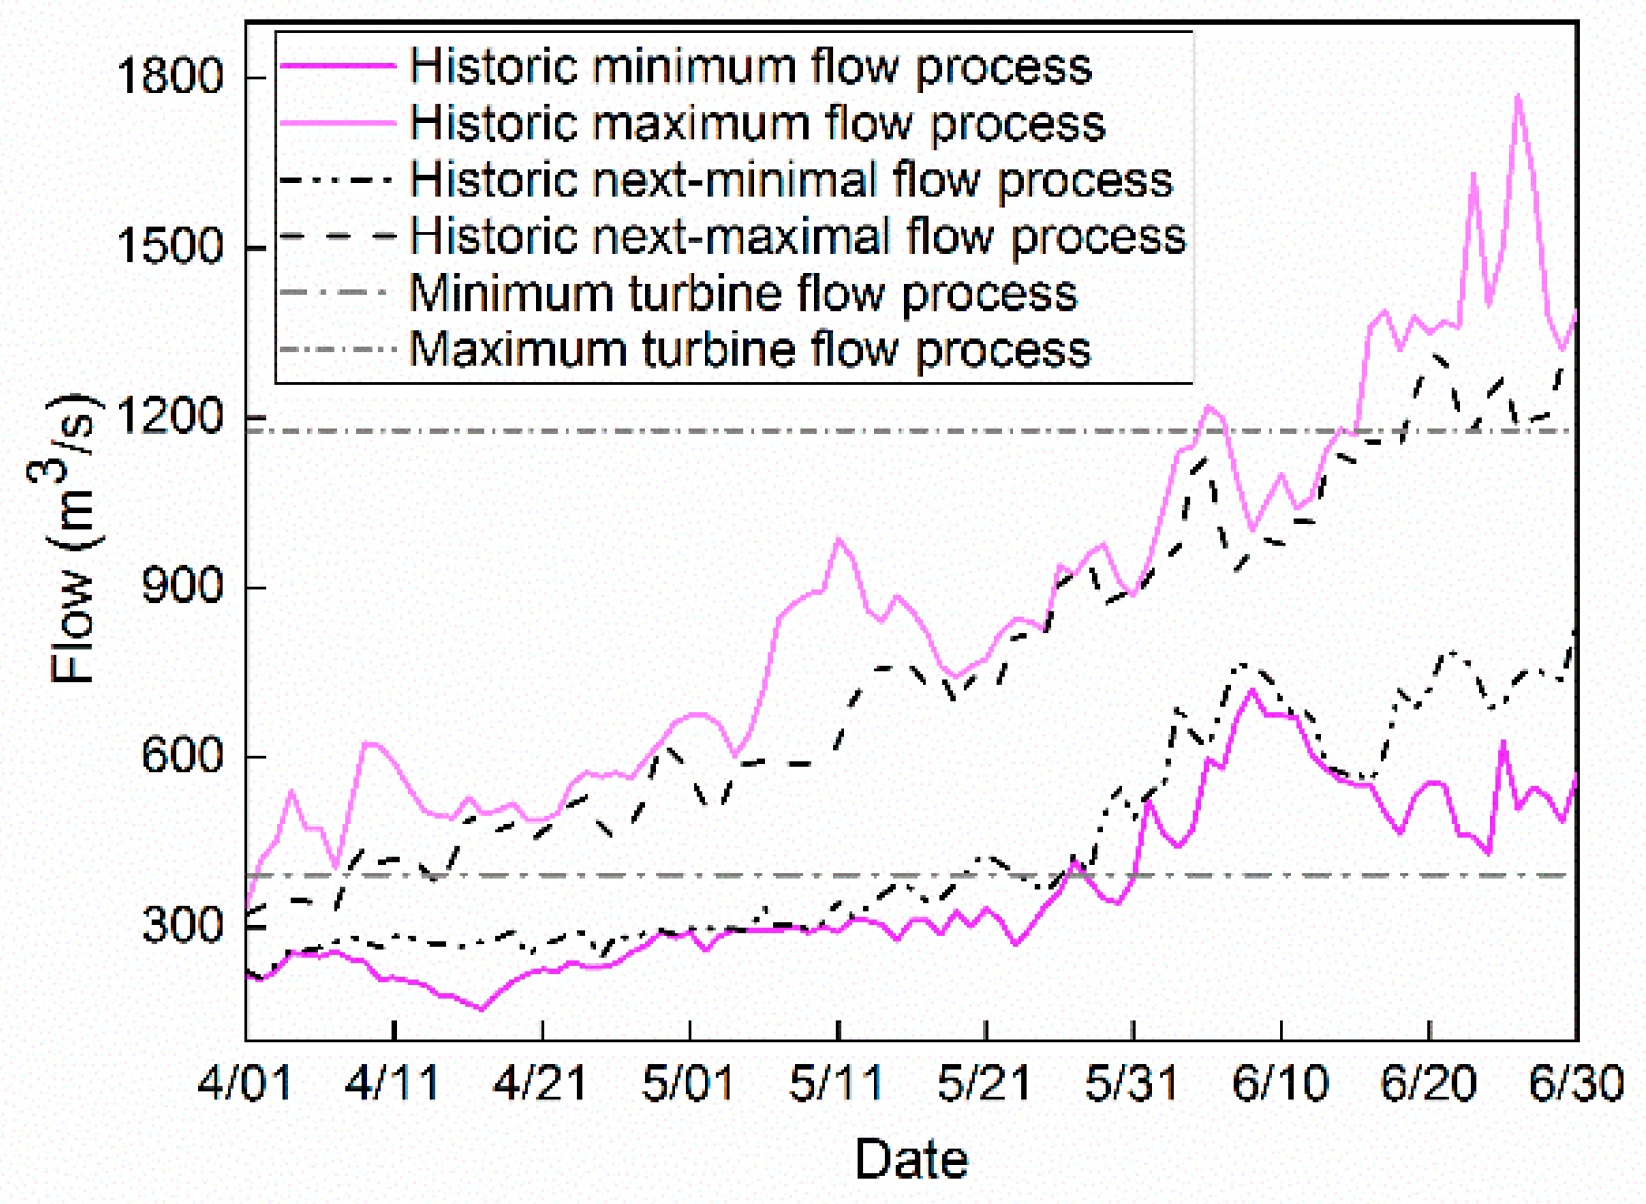
3.3. Ecological Flow Constraint Based on Historical Flow Process
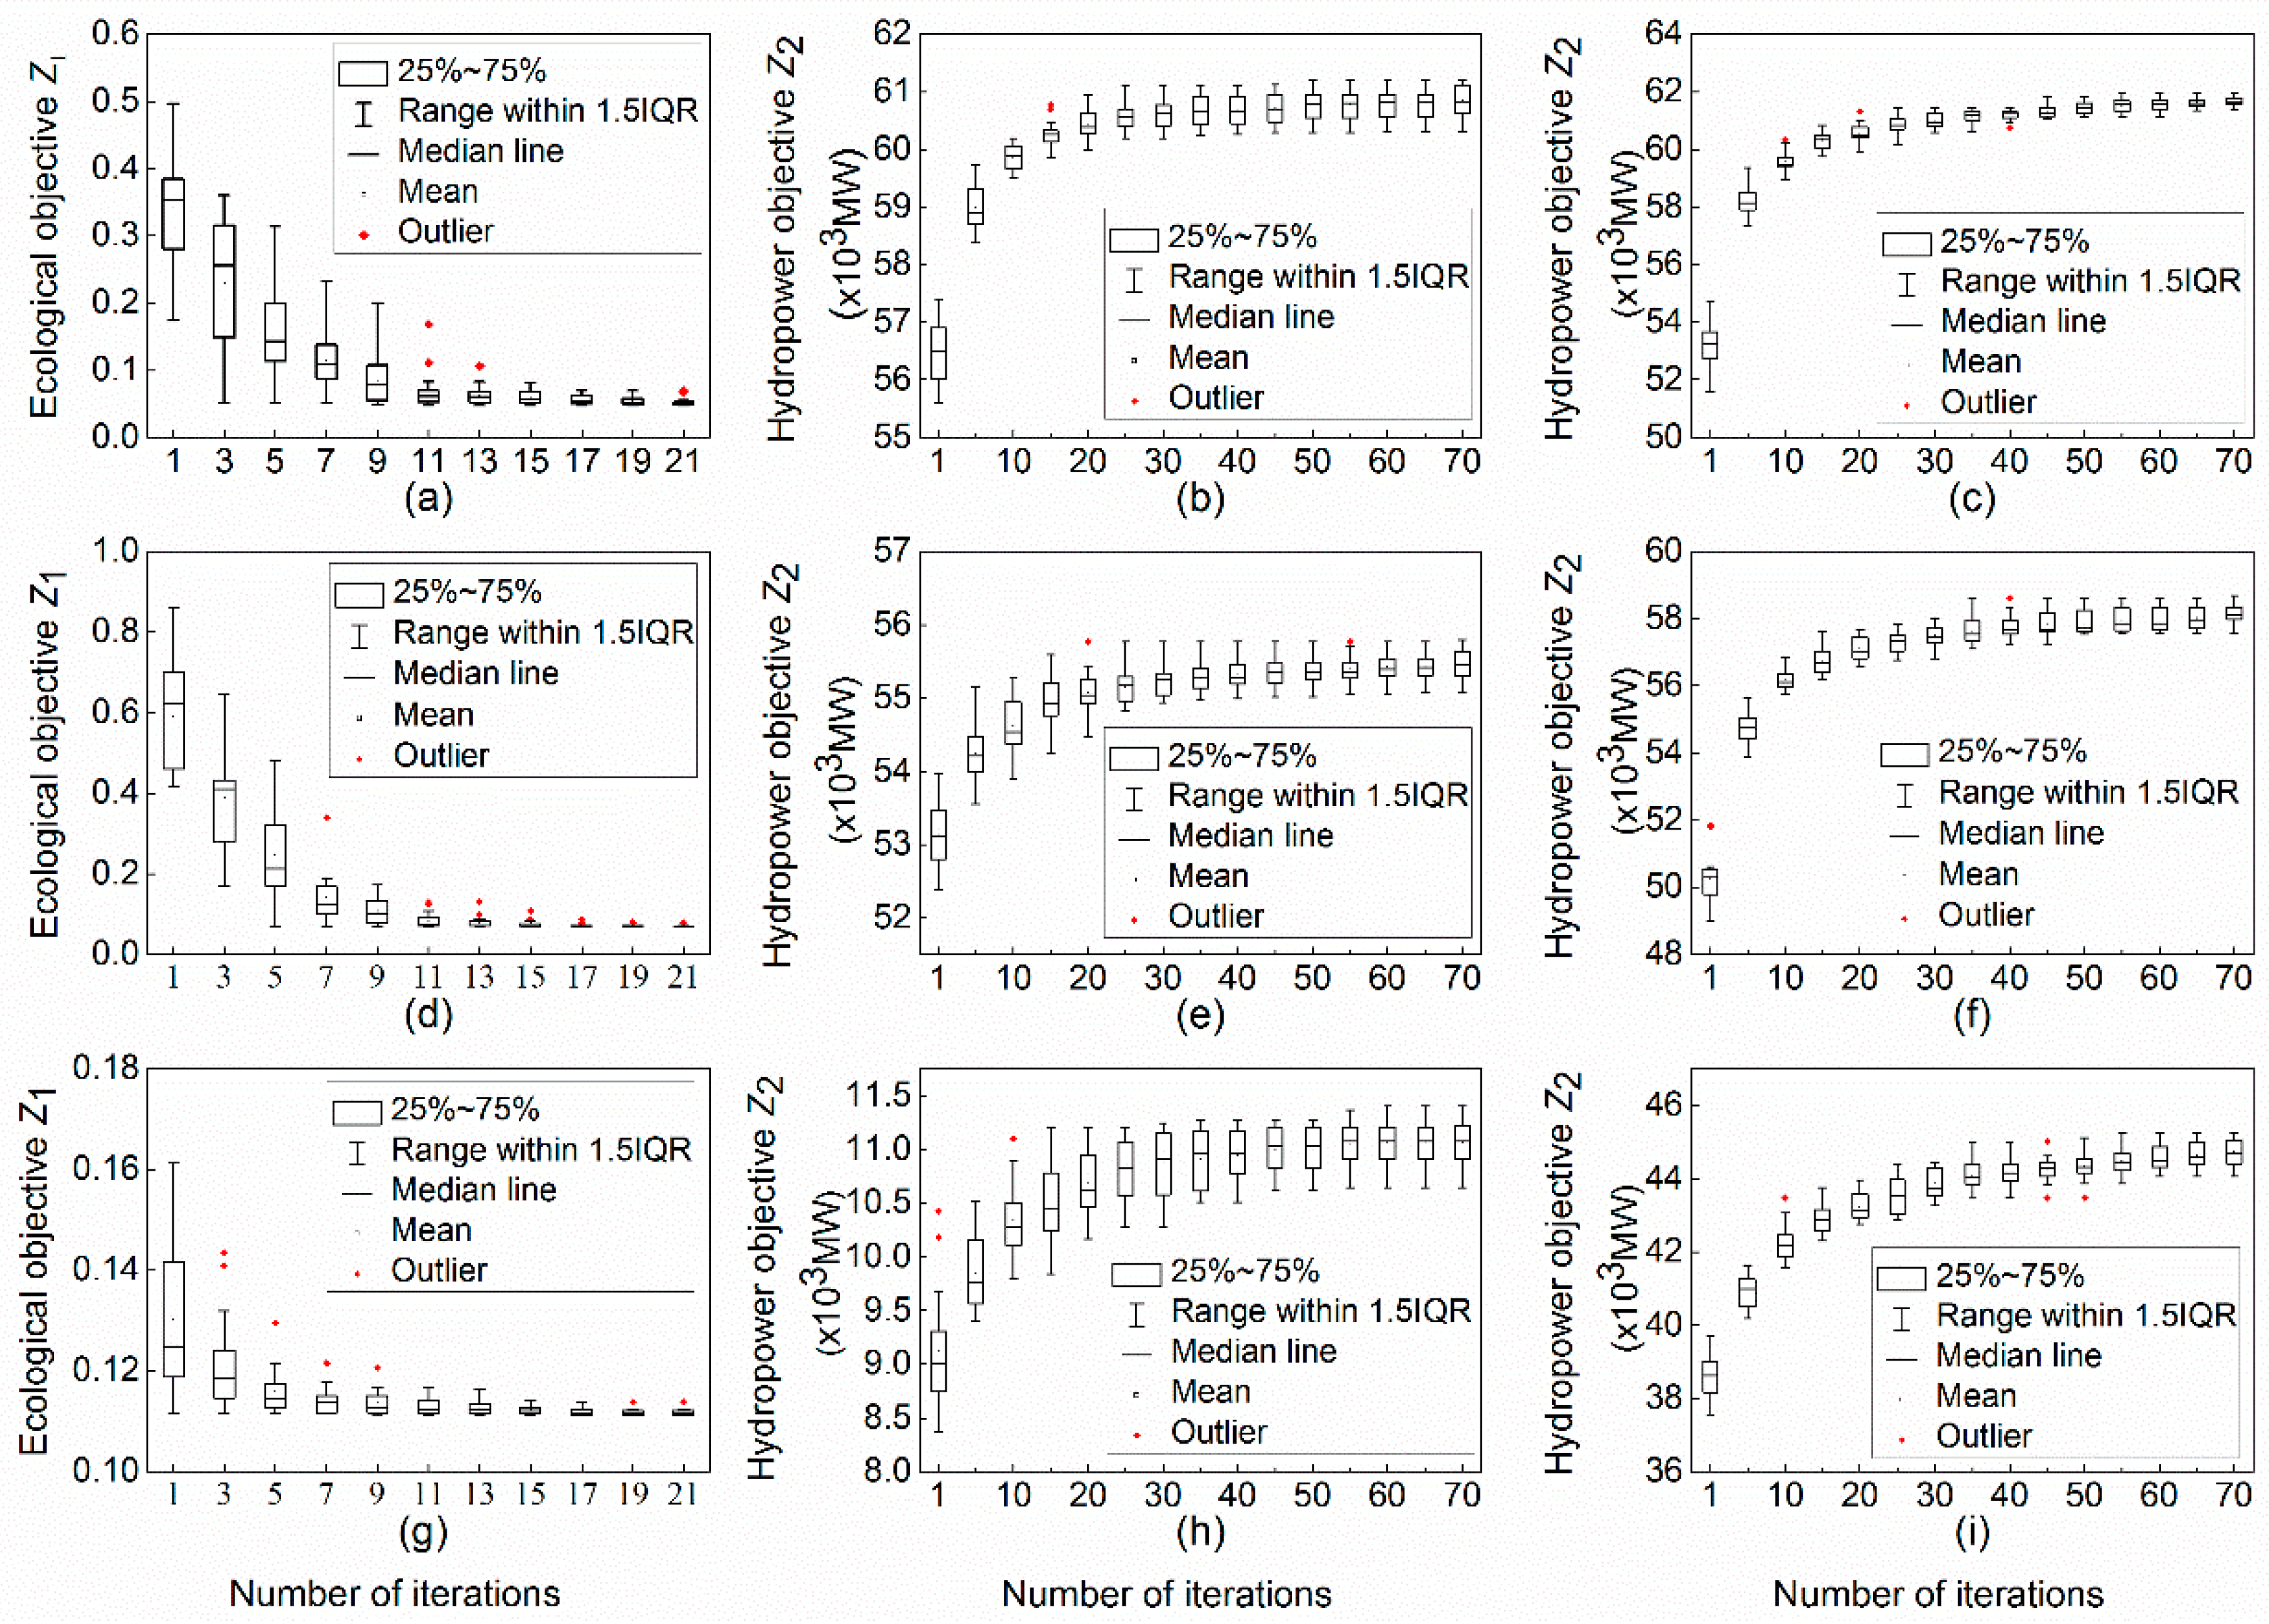
4. Results
5. Discussion
6. Conclusions
Author Contributions
Funding
Acknowledgments
Conflicts of Interest
References
- Magilligan, F.J.; Nislow, K.H.; Graber, B.E. Scale-Independent Assessment of Discharge Reduction and Riparian Disconnectivity following Flow Regulation by Dams. Geology 2003, 31, 569–572. [Google Scholar] [CrossRef]
- Poff, N.L.; Olden, J.D.; Merritt, D.M.; Pepin, D.M. Homogenization of Regional River Dynamics by Dams and Global Biodiversity Implications. Proc. Natl. Acad. Sci. USA 2007, 104, 5732–5737. [Google Scholar] [CrossRef] [PubMed]
- Rasanen, T.A.; Koponen, J.; Lauri, H.; Kummu, M. Downstream Hydrological Impacts of Hydropower Development in the Upper Mekong Basin. Water Resour. Manag. 2012, 26, 3495–3513. [Google Scholar] [CrossRef]
- Szemis, J.M.; Dandy, G.C.; Maier, H.R. A Multiobjective Ant Colony Optimization Approach for Scheduling Environmental Flow Management Alternatives with Application to the River Murray, Australia. Water Resour. Manag. 2013, 49, 6393–6411. [Google Scholar] [CrossRef]
- Pan, B.-Z.; Wang, H.-Z.; Ban, X.; Yin, X.-A. An Exploratory Analysis of Ecological Water Requirements of Macroinvertebrates in the Wuhan Branch of the Yangtze River. Quat. Int. 2015, 380, 256–261. [Google Scholar] [CrossRef]
- Krstolic, J.L.; Hayes, D.C.; Ruhl, P.H. Physical Habitat Classification and Instream Flow Modeling to Determine Habitat Availability during Low-Flow Periods, North Fork Shenandoah River, Virginia. In U.S. Geological Survey Scientific Investigations Report; USGS: Reston, VA, USA, 2006; Volume 5025, pp. 1–56. [Google Scholar]
- Liu, Q.; Yu, H.; Liang, L.; Ping, F.; Xia, X.; Mou, X.; Liang, J. Assessment of Ecological Instream Flow Requirements under Climate Change Pseudorasbora Parva. Int. J. Environ. Sci. Technol. 2017, 14, 509–520. [Google Scholar] [CrossRef]
- Li, R.; Chen, Q.; Duan, C. Ecological Hydrograph Based on Schizothorax Chongi Habitat Conservation in the Dewatered River Channel between Jinping Cascaded Dams. Sci. China Technol. Sci. 2011, 54, 54–63. [Google Scholar] [CrossRef]
- Li, W.; Chen, Q.; Cai, D.; Li, R. Determination of an Appropriate Ecological Hydrograph for a Rare Fish Species using an Improved Fish Habitat Suitability Model Introducing Landscape Ecology Index. Ecol. Model. 2015, 311, 31–38. [Google Scholar] [CrossRef]
- Harman, C.; Stewardson, M. Optimizing Dam Release Rules to Meet Environmental Flow Targets. River Res. Appl. 2005, 21, 113–129. [Google Scholar] [CrossRef]
- Zagona, E.A.; Fulp, T.J.; Shane, R.; Magee, Y.; Goranflo, H.M. Riverware: A Generalized Tool for Complex Reservoir System Modeling. J. Am. Water Resour. Assoc. 2001, 37, 913–929. [Google Scholar] [CrossRef]
- Hughes, D.A.; Okeefe, J.; Smakhtin, V.; King, J. Development of an Operating Rule Model to Simulate Time Series of Reservoir Releases for Instream Flow Requirements. Water SA 1997, 23, 21–30. [Google Scholar]
- Bunn, S.E.; Arthington, A.H. Basic Principles and Ecological Consequences of Altered Flow Regimes for Aquatic Biodiversity. Environ. Manag. 2002, 30, 492–507. [Google Scholar] [CrossRef] [Green Version]
- Bednarek, A.T.; Hart, D.D. Modifying Dam Operations to Restore Rivers: Ecological Responses to Tennessee River Dam Mitigation. Ecol. Appl. 2005, 15, 997–1008. [Google Scholar] [CrossRef]
- Wu, W.; Xu, Z.; Yin, X.; Zuo, D. Assessment of Ecosystem Health Based on Fish Assemblages in the Wei River Basin, China. Environ. Monit. Assess. 2014, 186, 3701–3716. [Google Scholar] [CrossRef]
- Liu, C.; Men, B. An Ecological Hydraulic Radius Approach to Estimate the Instream Ecological Water Requirement. Prog. Nat. Sci. 2007, 17, 320–327. [Google Scholar]
- Hur, J.W.; Jang, C.L.; Kim, K.H. Assessment of Ecological Flowrate and Fish Community to Weir Type in Stream. J. Korean Soc. Environ. Eng. 2017, 39, 339–347. [Google Scholar] [CrossRef]
- Hoagstrom, C.W.; DeWitte, A.C.; Gosch, N.J.C.; Berry, C.R., Jr. Historical Fish Assemblage Flux in the Cheyenne River below Angostura Dam. J. Freshw. Ecol. 2007, 22, 219–229. [Google Scholar] [CrossRef] [Green Version]
- Propst, D.L.; Gido, K.B. Responses of Native and Nonnative Fishes to Natural Flow Regime Mimicry in the San Juan River. Trans. Am. Fish. Soc. 2004, 133, 922–931. [Google Scholar] [CrossRef]
- Schneider, S.C.; Petrin, Z. Effects of Flow Regime on Benthic Algae and Macroinvertebrates—A Comparison between Regulated and Unregulated Rivers. Sci. Total Environ. 2016, 579, 1059–1072. [Google Scholar] [CrossRef]
- He, S.; Yin, X.A.; Yu, C.; Xu, Z.; Yang, Z. Quantifying Parameter Uncertainty in Reservoir Operation Associated with Environmental Flow Management. J. Clean. Prod. 2018, 176, 1271–1282. [Google Scholar] [CrossRef]
- Wang, H.; Brill, E.D.; Ranjithan, R.S.; Sankarasubramanian, A. A Framework for Incorporating Ecological Releases in Single Reservoir Operation. Adv. Water Resour. 2015, 78, 9–21. [Google Scholar] [CrossRef]
- Baron, J.S.; Poff, N.L.; Angermeier, P.L.; Dahm, C.N.; Gleick, P.H.; Hairston, N.G.; Jackson, R.B.; Johnston, C.A.; Richter, B.D.; Steinman, A.D. Meeting Ecological and Societal Needs for Freshwater. Ecol. Appl. 2002, 12, 1247–1260. [Google Scholar] [CrossRef]
- Suen, J.P.; Eheart, J.W. Reservoir Management to Balance Ecosystem and Human Needs: Incorporating the Paradigm of the Ecological Flow Regime. Water Resour. Manag. 2006, 42, W03417. [Google Scholar] [CrossRef]
- Yang, Z.; Yang, K.; Hu, H.; Su, L. The Cascade Reservoirs Multi-Objective Ecological Operation Optimization Considering Different Ecological Flow Demand. Water Resour. Manag. 2019, 33, 207–228. [Google Scholar] [CrossRef]
- Huang, S.; Chang, J.; Huang, Q.; Wang, Y.; Chen, Y. Calculation of the Instream Ecological Flow of the Wei River Based on Hydrological Variation. J. Appl. Math. 2014, 2014. [Google Scholar] [CrossRef]
- Jager, H.I.; Rose, K.A. Designing Optimal Flow Patterns for Fall Chinook Salmon in a Central Valley, California, River. N. Am. J. Fish. Manag. 2003, 23, 1–21. [Google Scholar] [CrossRef]
- Poff, N.L.; Allan, J.D.; Bain, M.B.; Karr, J.R.; Prestegaard, K.L.; Richter, B.D.; Sparks, R.E.; Stromberg, J.C. The Natural Flow Regime. Bioscience 1997, 47, 769–784. [Google Scholar] [CrossRef] [Green Version]
- Wang, C.; Yu, Y.; Wang, P.F.; Sun, Q.Y.; Hou, J.; Qian, J. Assessment of the Ecological Reservoir Operation in the Yangtze Estuary Based on the Salinity Requirements of the Indicator Species. River Res. Appl. 2016, 32, 946–957. [Google Scholar] [CrossRef]
- Cheng, C.-T.; Wang, W.-C.; Xu, D.-M.; Chau, K.W. Optimizing Hydropower Reservoir Operation using Hybrid Genetic Algorithm and Chaos. Water Resour. Manag. 2008, 22, 895–909. [Google Scholar] [CrossRef]
- Borghetti, A.; D’Ambrosio, C.; Lodi, A.; Martello, S. An MILP Approach for Short-Term Hydro Scheduling and Unit Commitment with Head-Dependent Reservoir. IEEE Trans. Power Syst. 2008, 23, 1115–1124. [Google Scholar] [CrossRef]
- Fleten, S.-E.; Kristoffersen, T.K. Short-Term Hydropower Production Planning by Stochastic Programming. Comput. Oper. Res. 2008, 35, 2656–2671. [Google Scholar] [CrossRef]
- Ardizzon, G.; Cavazzini, G.; Pavesi, G. A New Generation of Small Hydro and Pumped-Hydro Power Plants: Advances and Future Challenges. Renew. Sustain. Energy Rev. 2014, 31, 746–761. [Google Scholar] [CrossRef]
- Bozorg-Haddad, O.; Afshar, A.; Marino, M.A. Honey-Bee Mating Optimization (HBMO) Algorithm in Deriving Optimal Operation Rules for Reservoirs. J. Hydroinform. 2008, 10, 257–264. [Google Scholar] [CrossRef]
- Ahmadi, M.; Bozorg-Haddad, O.; Marino, M.A. Extraction of Flexible Multi-Objective Real-Time Reservoir Operation Rules. Water Resour. Manag. 2014, 28, 131–147. [Google Scholar] [CrossRef]
- Richter, B.D.; Thomas, G.A. Restoring Environmental Flows by Modifying Dam Operations. Ecol. Soc. 2007, 12, 12. [Google Scholar] [CrossRef]
- Jager, H.I.; Smith, B.T. Sustainable Reservoir Operation: Can We Generate Hydropower and Preserve Ecosystem Values? River Res. Appl. 2008, 24, 340–352. [Google Scholar] [CrossRef]
- Shiau, J.T.; Wu, F.C. Feasible Diversion and Instream Flow Release using Range of Variability Approach. J. Water Res. Plan. Manag. 2004, 130, 395–404. [Google Scholar] [CrossRef]
- Xu, X.; Bin, L.; Pan, C.; Ding, A.; Chen, D. Optimal Reoperation of Multi-Reservoirs for Integrated Watershed Management with Multiple Benefits. Water 2014, 6, 796–812. [Google Scholar] [CrossRef] [Green Version]
- Yin, X.-A.; Liu, Y.; Yang, Z.; Zhao, Y.; Cai, Y.; Sun, T.; Yang, W. Eco-Compensation Standards for Sustaining High Flow Events below Hydropower Plants. J. Clean. Prod. 2018, 182, 1–7. [Google Scholar] [CrossRef]
- Kotchen, M.J.; Moore, M.R.; Lupi, F.; Rutherford, E.S. Environmental Constraints on Hydropower: An Ex Post Benefit-Cost Analysis of Dam Relicensing in Michigan. Land. Econ. 2006, 82, 384–403. [Google Scholar] [CrossRef]
- Babel, M.S.; Chien Nguyen, D.; Mullick, M.R.A.; Nanduri, U.V. Operation of a Hydropower System Considering Environmental Flow Requirements: A Case Study in La Nga River Basin, Vietnam. J. Hydro-Environ. Res. 2012, 6, 63–73. [Google Scholar] [CrossRef]
- Wang, C.; Zhou, J.; Wang, X.; Zhang, C. The Ecological Optimization Dispatch of the Three Gorges Reservoir Considering Aquatic Organism Protection. In Proceedings of the International Conference on Control, Automation and Robotics (ICCAR 2015), Singapore, 20–22 May 2015; pp. 204–208. [Google Scholar]
- Dai, L.; Zhang, P.; Wang, Y.; Jiang, D.; Dai, H.; Mao, J.; Wang, M. Multi-Objective Optimization of Cascade Reservoirs using NSGA-II: A Case Study of the Three Gorges-Gezhouba Cascade Reservoirs in the Middle Yangtze River, China. Hum. Ecol. Risk Assess. 2017, 23, 814–835. [Google Scholar] [CrossRef]
- Zhang, H.; Chang, J.; Gao, C.; Wu, H.; Wang, Y.; Lei, K.; Long, R.; Zhang, L. Cascade Hydropower Plants Operation Considering Comprehensive Ecological Water Demands. Energy Convers. Manag. 2019, 180, 119–133. [Google Scholar] [CrossRef]
- Available online: https://baike.so.com/doc/5071376-5298921.html/ (accessed on 28 April 2019).
- Cai, W.; Zhang, J.; Wang, S. Fish of the Yellow River Valley; Northwest A&F University Press: Shanxi, China, 2013; Volume 5, pp. 1–282. [Google Scholar]


| Model | Ecological Objective in Equation (1) | Hydropower Objective in Equation (2) | Ecological Flow Constraint in Equation (9) |
|---|---|---|---|
| A | √ | × | √ |
| B | × | √ | √ |
| C | × | √ | × |
| D | Calculated | Calculated | × |
| Year | N (times) | (times) | (d) | (d) | ((m3/s)/d) | ((m3/s)/d) | |
|---|---|---|---|---|---|---|---|
| Wet years | 2009 | 6 | 6.3 | 11.3 | 10.7 | 50.7 | 59.4 |
| 2011 | 6 | 10.5 | 64.3 | ||||
| 2012 | 7 | 10.4 | 63.3 | ||||
| Normal years | 2010 | 5 | 4.3 | 8.2 | 10.9 | 65.7 | 61.7 |
| 2013 | 4 | 12.8 | 70.2 | ||||
| 2014 | 4 | 11.8 | 49.1 | ||||
| Dry years | 2015 | 3 | 4.5 | 12.7 | 12.2 | 58.5 | 60.4 |
| 2016 | 6 | 11.8 | 62.2 | ||||
| Average | - | - | 5.0 | - | 11.3 | - | 60.5 |
| Model | Wet Year 2011 | Normal Year 2014 | Dry Year 2015 | |
|---|---|---|---|---|
| Ecological objective Z1 | A | 0.0476 | 0.0704 | 0.1113 |
| B | 0.6104 | 0.9916 | 0.3954 | |
| C | 4.9520 | 4.9712 | 4.7327 | |
| D | 0.0971 | 0.2311 | 0.3373 | |
| Hydropower objective Z2 (×103 MW) | A | 56.36 | 50.99 | 6.92 |
| B | 61.04 | 55.77 | 11.22 | |
| C | 62.31 | 58.67 | 45.45 | |
| D | 52.49 | 43.92 | 28.15 |
| Wet Year 2011 | Normal Year 2014 | Dry Year 2015 | ||
|---|---|---|---|---|
| Ecological objective | ( − )/ | 50.98% | 69.54% | 67.00% |
| ( − )/ | −528.63% | −329.08% | −17.23% | |
| ( − )/ | −4999.90% | −2051.10% | −1303.11% | |
| Hydropower objective | ( − )/ | 7.37% | 16.10% | −75.42% |
| ( − )/ | 16.29% | 26.98% | −60.14% | |
| ( − )/ | 18.71% | 33.58% | 61.46% |
| Wet Year 2011 | Normal Year 2014 | Dry Year 2015 | ||
|---|---|---|---|---|
| Ecological objective | ( − )/ | 99.04% | 98.58% | 97.65% |
| ( − )/ | 92.20% | 92.90% | 71.85% | |
| ( − )/ | 87.67% | 80.05% | 91.65% | |
| Hydropower objective | ( − )/ | −9.55% | −13.09% | −84.77% |
| ( − )/ | −7.67% | −8.57% | −38.32% | |
| ( − )/ | −2.04% | −4.94% | −75.31% |
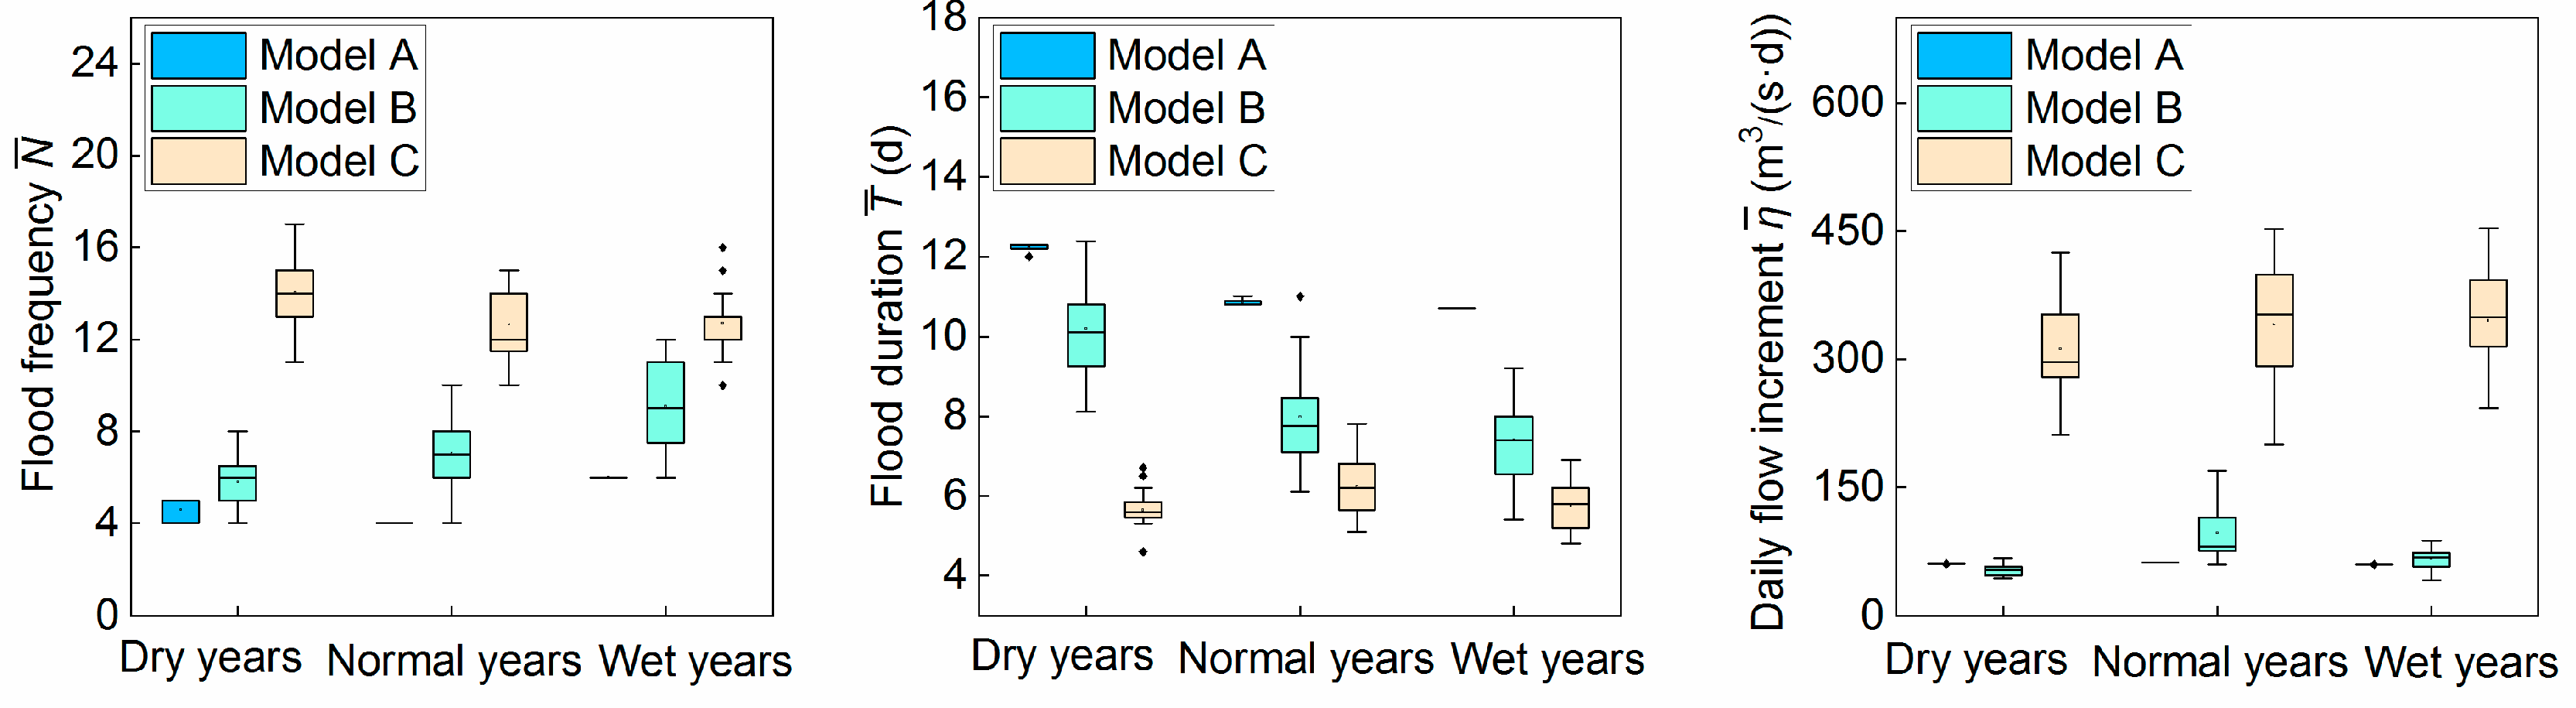
| Ecological Objective Z1 | ||||
|---|---|---|---|---|
| Wet years | 6.3 | 10.7 | 59.4 | 0 |
| A | 6.0 | 10.70 | 59.42 | 0.0476 |
| B | 9.1 | 7.41 | 66.61 | 0.6104 |
| C | 12.7 | 5.75 | 345.33 | 4.9520 |
| D | 6.0 | 10.50 | 64.30 | 0.0971 |
| Normal years | 4.3 | 10.9 | 61.7 | 0 |
| A | 4.0 | 10.85 | 61.70 | 0.0704 |
| B | 7.05 | 7.98 | 96.30 | 0.9916 |
| C | 12.65 | 6.24 | 340.79 | 4.9712 |
| D | 4.0 | 11.80 | 49.10 | 0.2311 |
| Dry years | 4.5 | 12.2 | 60.4 | 0 |
| A | 4.6 | 12.23 | 60.39 | 0.1113 |
| B | 5.80 | 10.19 | 52.88 | 0.3954 |
| C | 14.05 | 5.65 | 312.27 | 4.7327 |
| D | 3.0 | 12.70 | 58.50 | 0.3373 |
© 2019 by the authors. Licensee MDPI, Basel, Switzerland. This article is an open access article distributed under the terms and conditions of the Creative Commons Attribution (CC BY) license (http://creativecommons.org/licenses/by/4.0/).
Share and Cite
Liu, C.-M.; Qiu, J.; Li, F.-F. Recovery Degree of the Natural Flow Regimes and the Corresponding Economic Costs for Reservoir Operation in Fish Spawning Seasons. Int. J. Environ. Res. Public Health 2019, 16, 1699. https://0-doi-org.brum.beds.ac.uk/10.3390/ijerph16101699
Liu C-M, Qiu J, Li F-F. Recovery Degree of the Natural Flow Regimes and the Corresponding Economic Costs for Reservoir Operation in Fish Spawning Seasons. International Journal of Environmental Research and Public Health. 2019; 16(10):1699. https://0-doi-org.brum.beds.ac.uk/10.3390/ijerph16101699
Chicago/Turabian StyleLiu, Cong-Min, Jun Qiu, and Fang-Fang Li. 2019. "Recovery Degree of the Natural Flow Regimes and the Corresponding Economic Costs for Reservoir Operation in Fish Spawning Seasons" International Journal of Environmental Research and Public Health 16, no. 10: 1699. https://0-doi-org.brum.beds.ac.uk/10.3390/ijerph16101699