Brain Magnetic Resonance Imaging Findings in Children after Antenatal Maternal Depression Treatment, a Longitudinal Study Built on a Pilot Randomized Controlled Trial

 ,
, 
Abstract
:1. Introduction
2. Methods and Materials
2.1. Participants
2.2. Study Procedure and Planning
2.3. MRI-Procedure
2.4. Characteristics
2.5. Statistical Analyses
2.5.1. Voxel-Based Morphometry
2.5.2. Subcortical Gray Matter Volumes and Gray Matter Cortical Thickness
2.5.3. Fixel-Based Analysis
3. Results
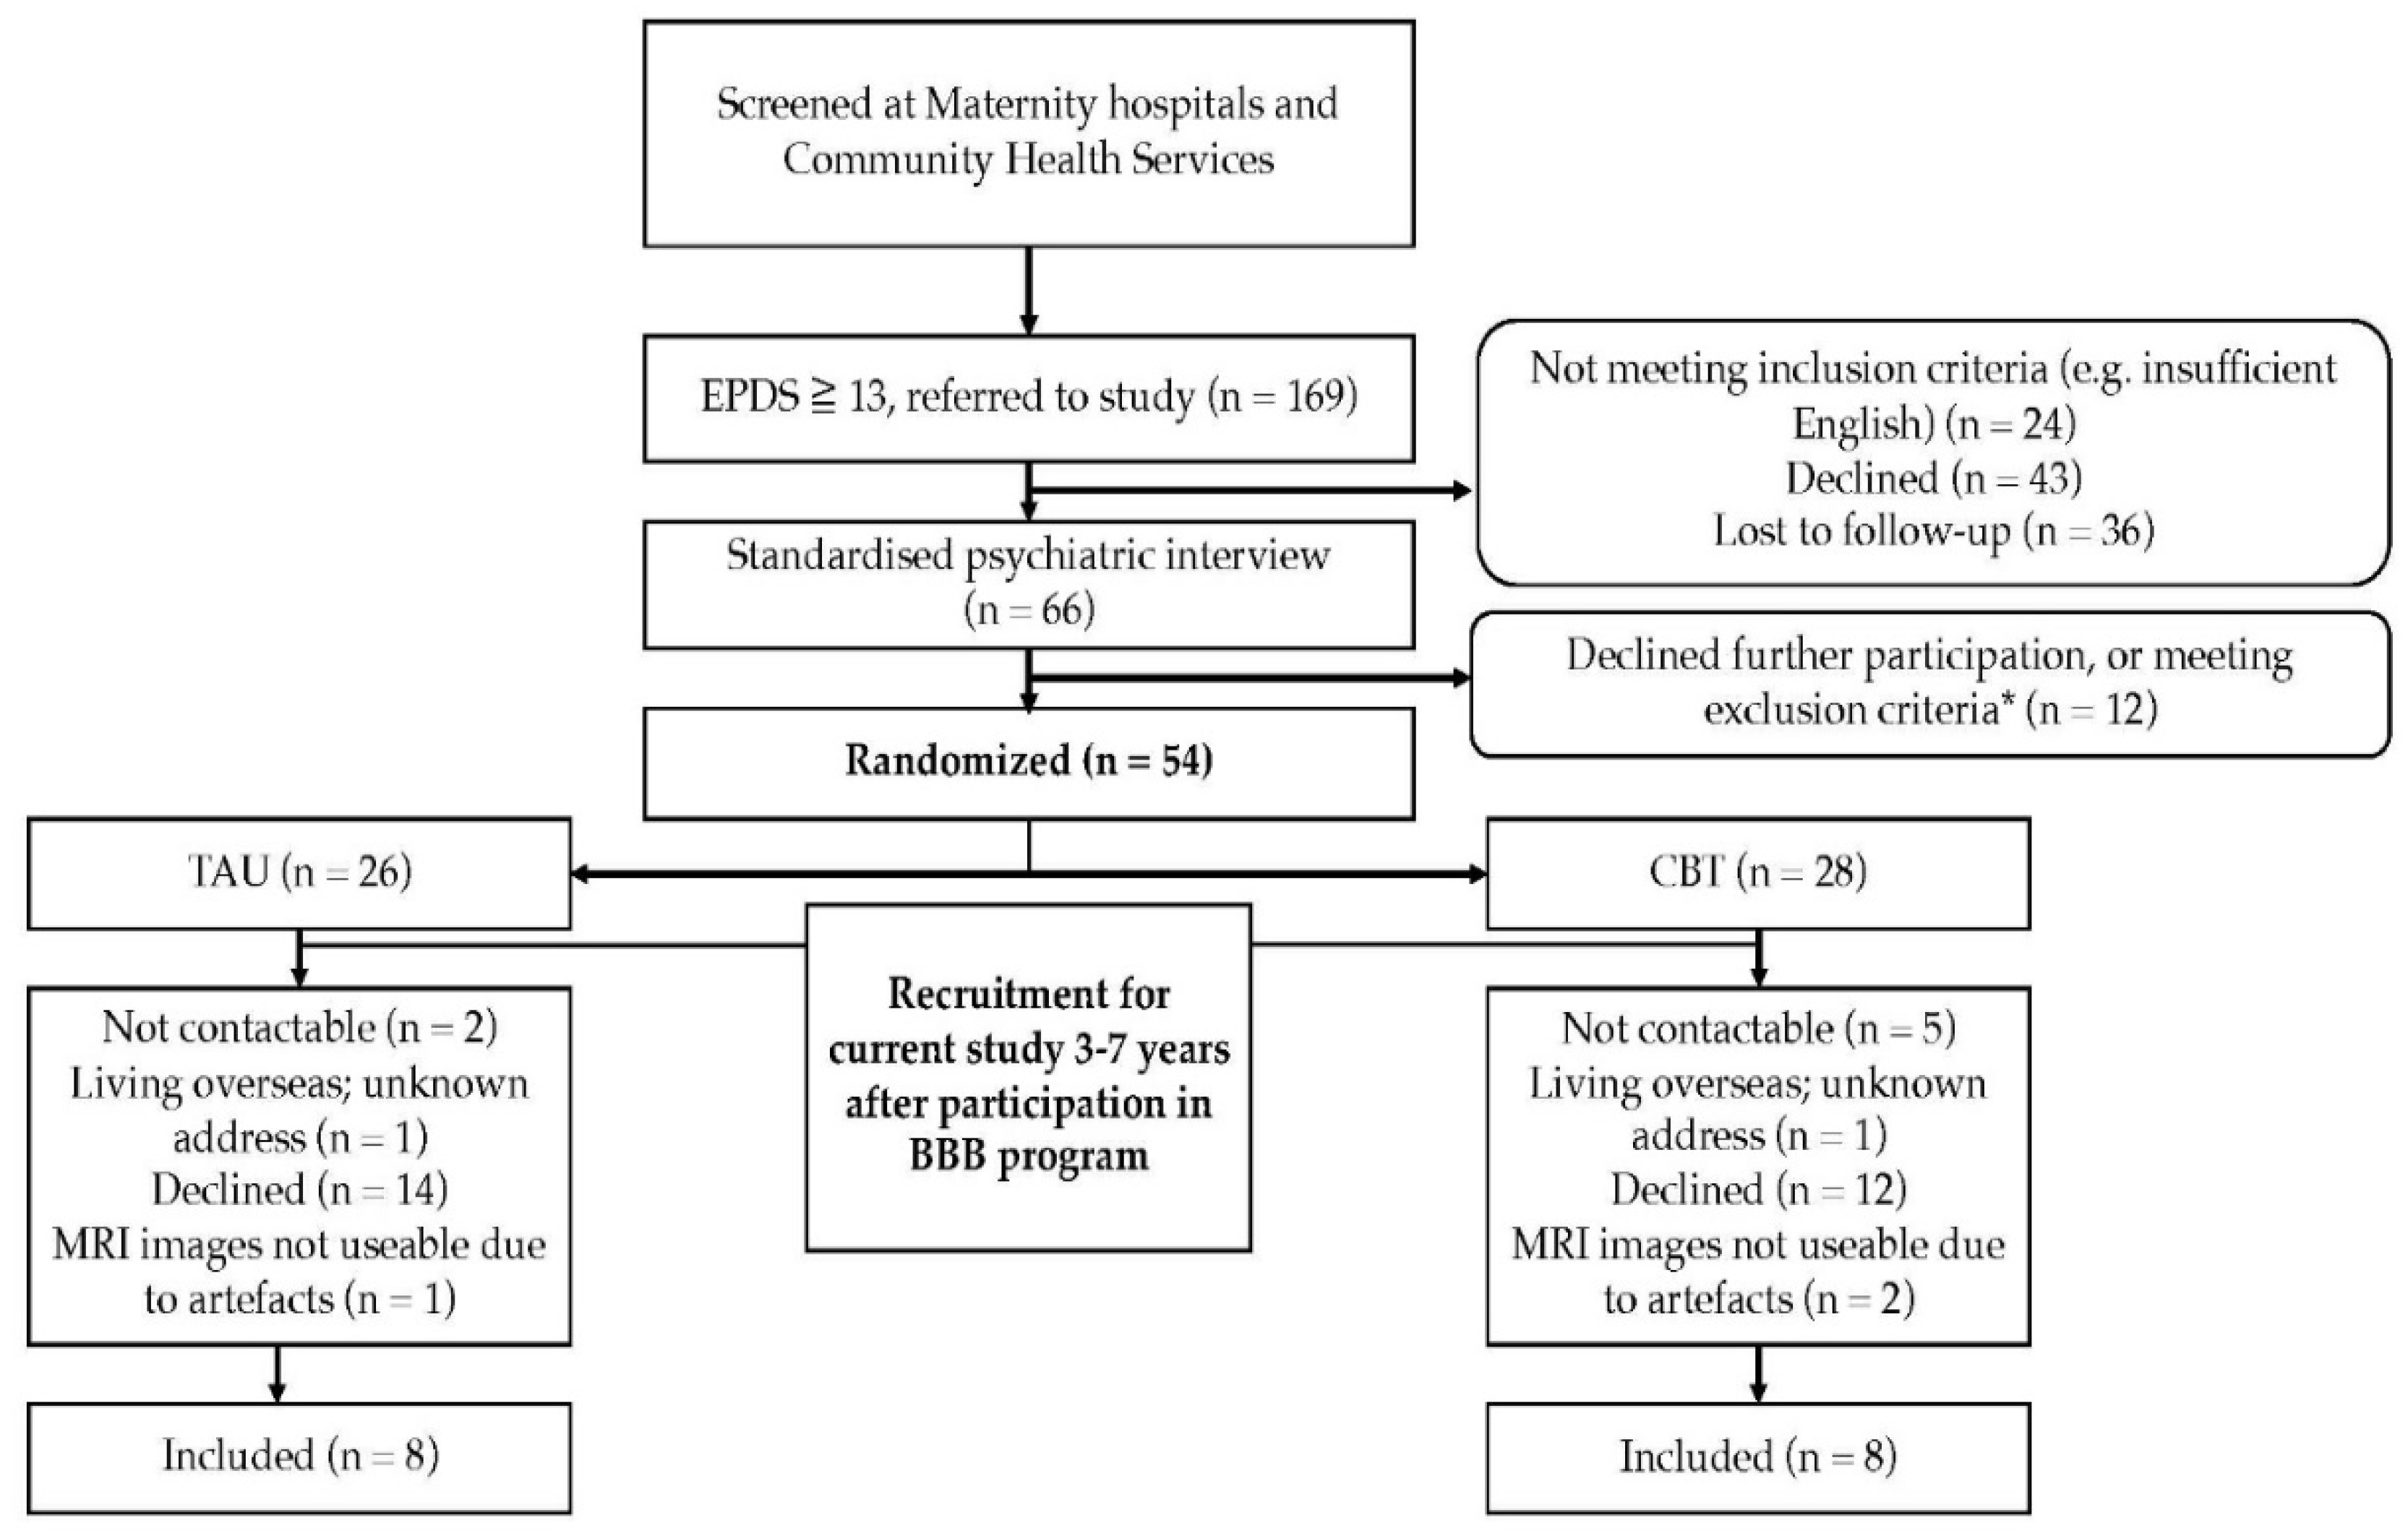
3.1. Participants
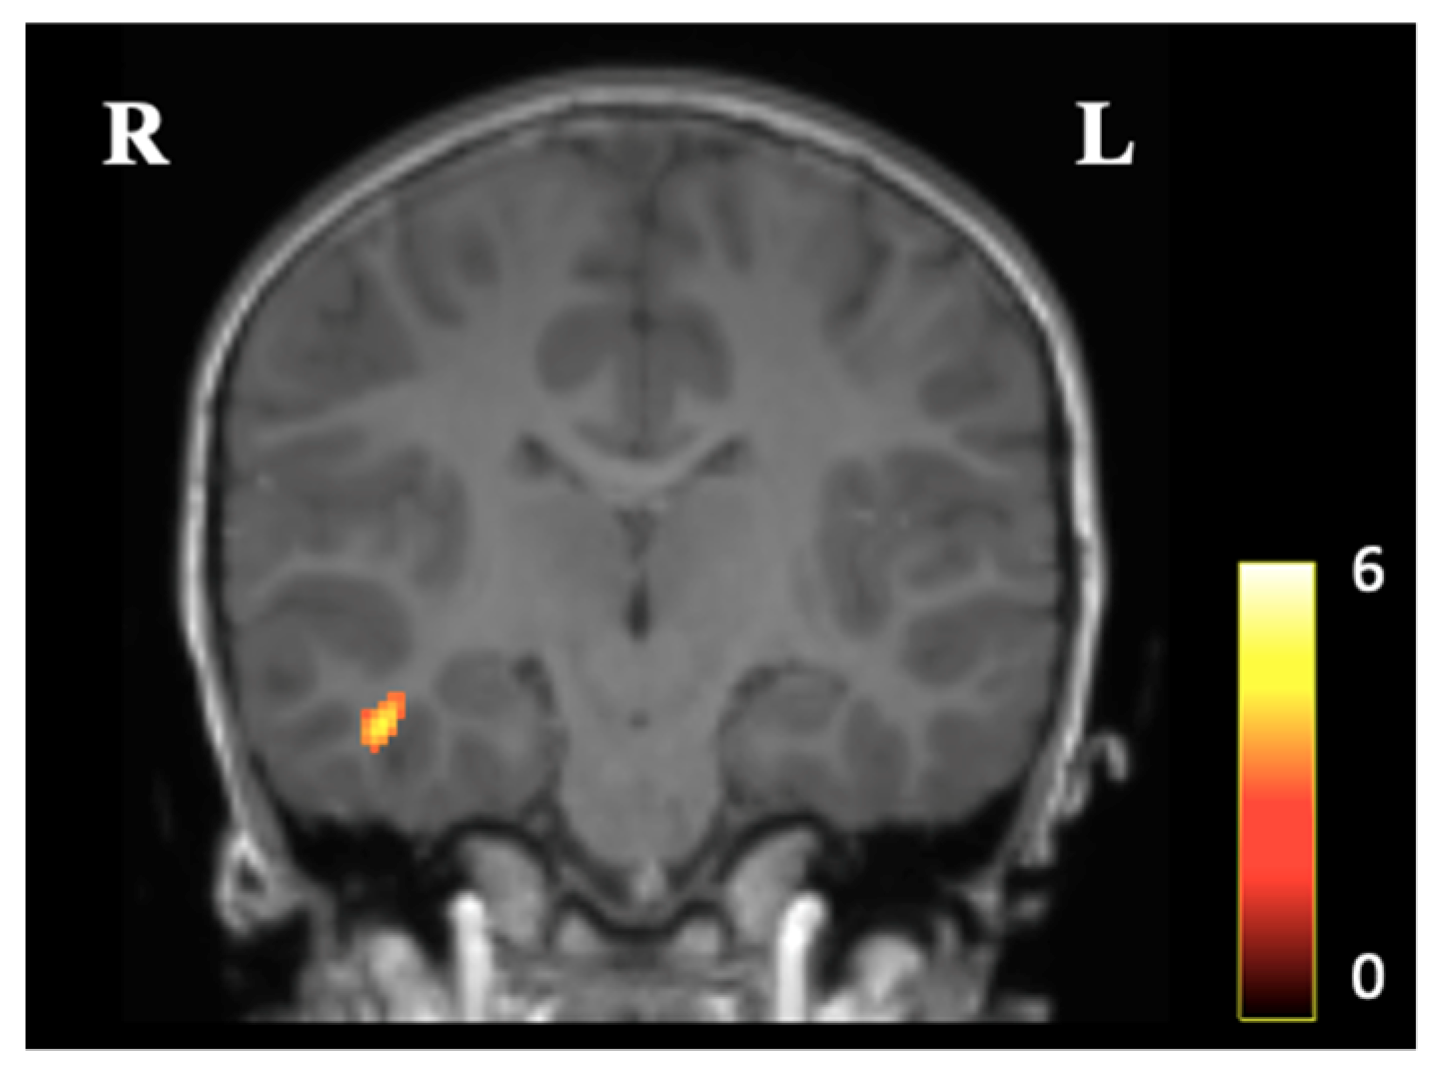
3.2. Voxel-Based Morphometry
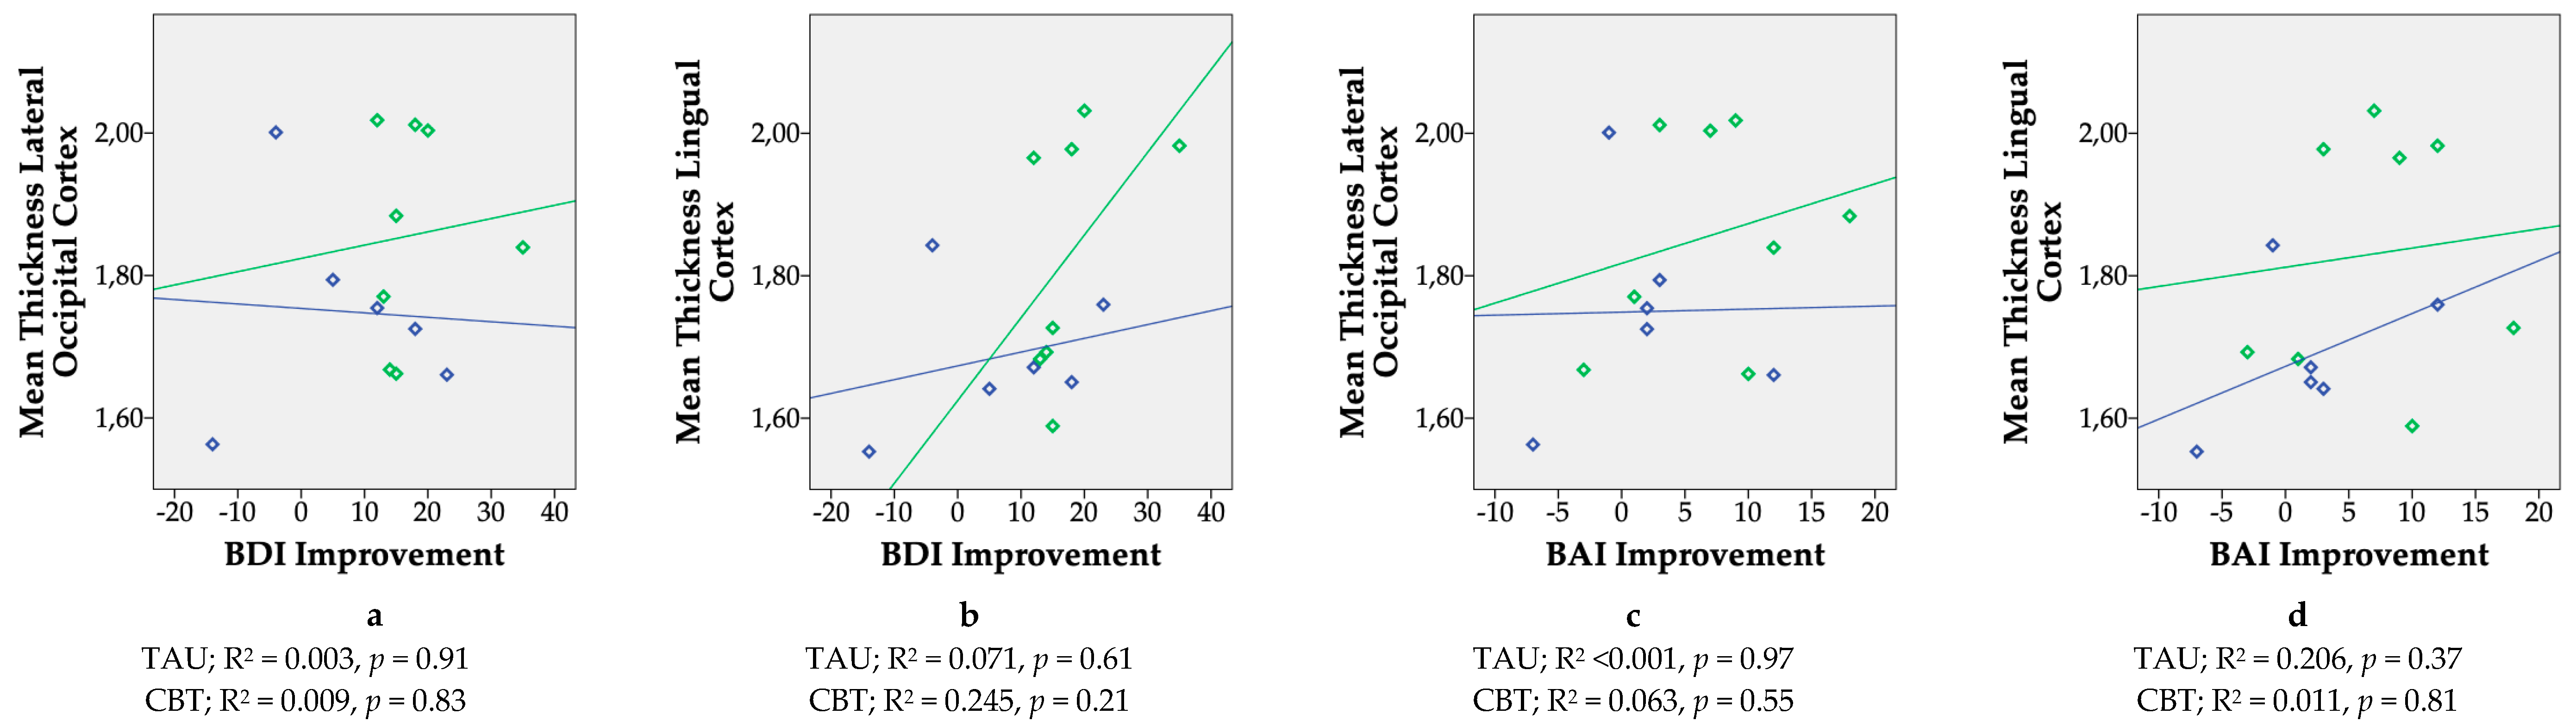
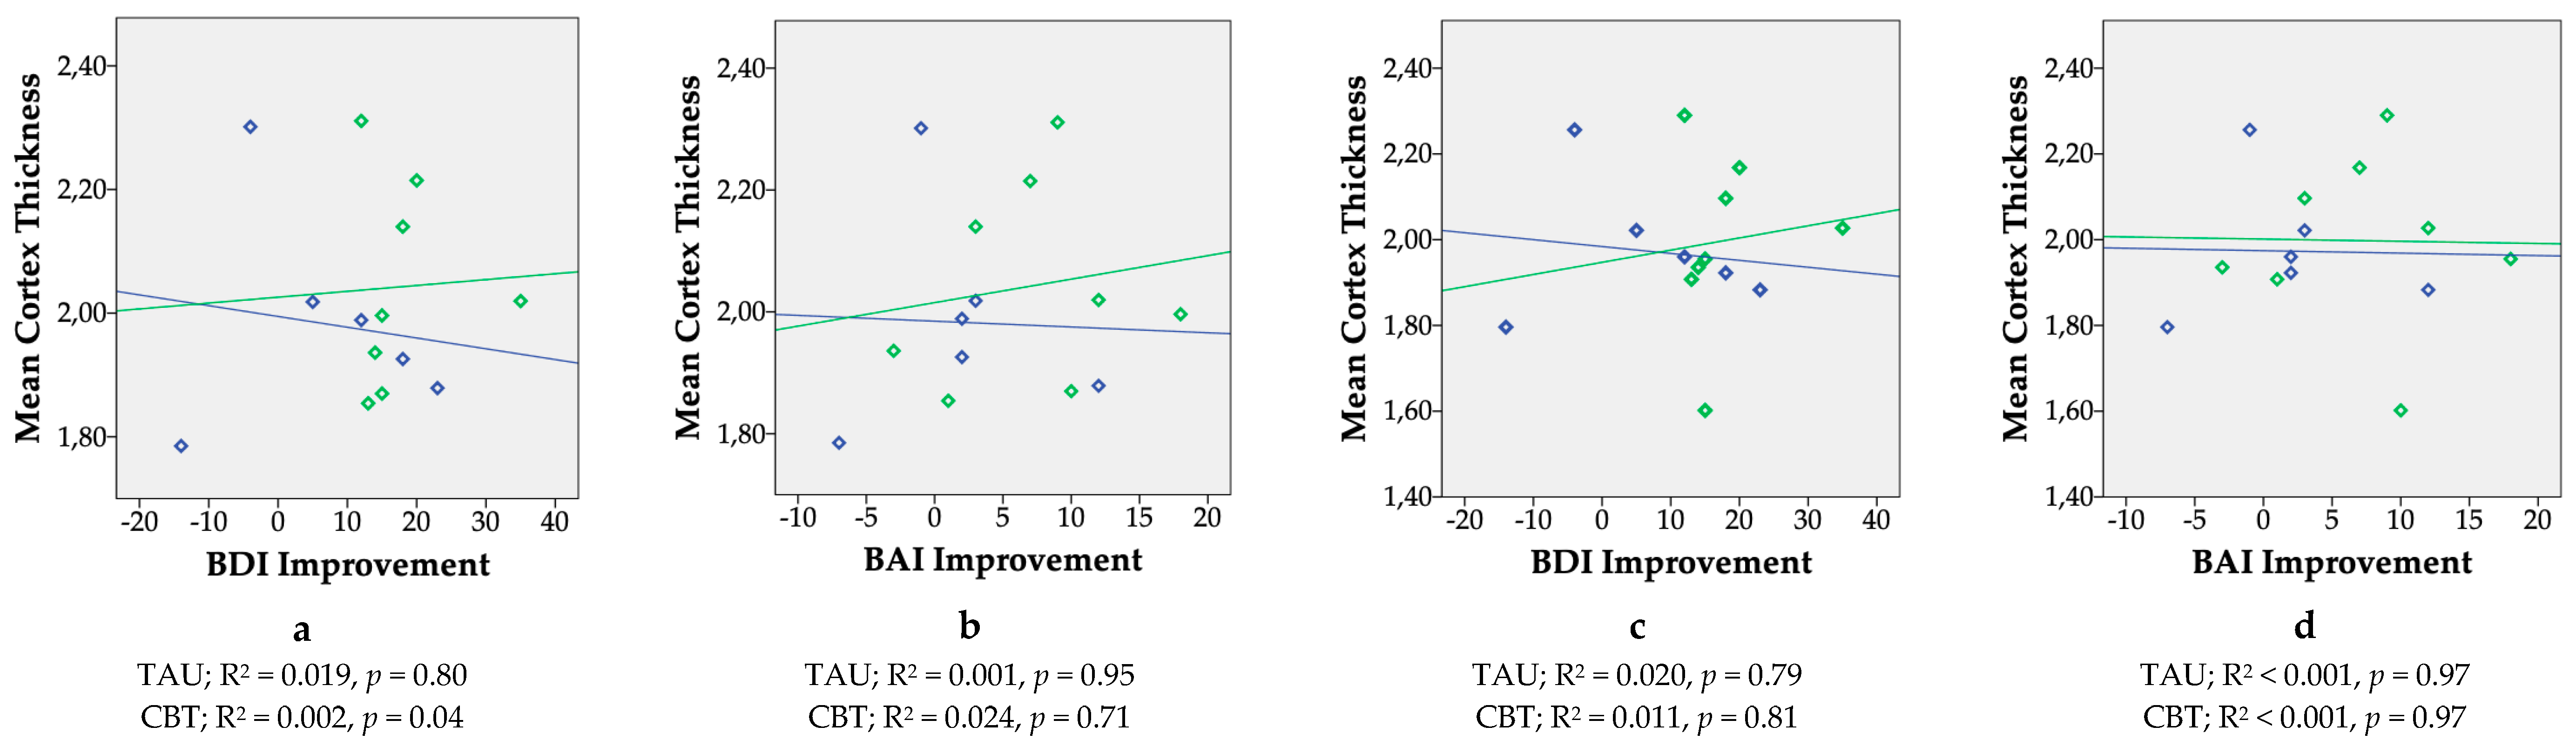
3.3. Subcortical Gray Matter Volumes and Gray Matter Cortical Thickness
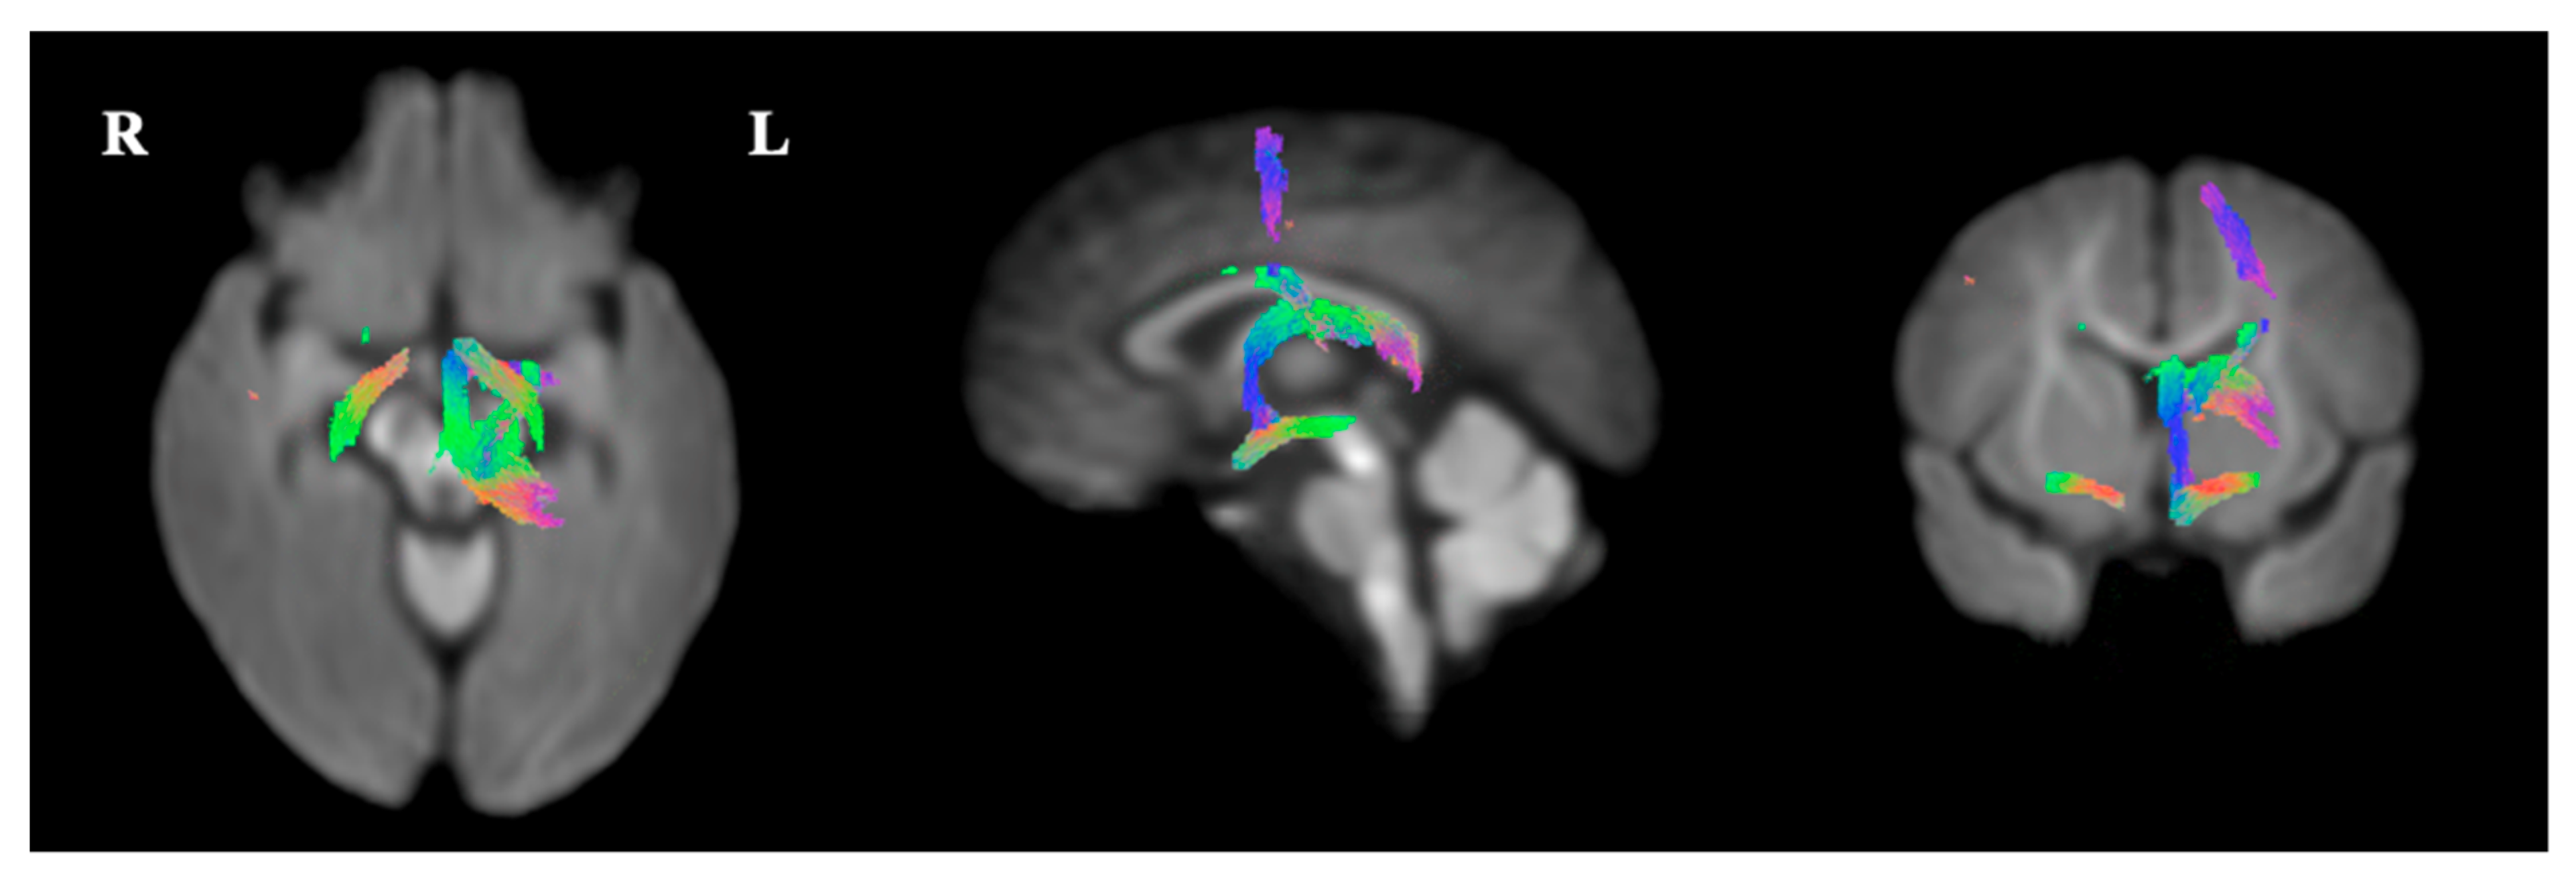
3.4. Fixel-Based Diffusion
4. Discussion
5. Conclusions
Author Contributions
Funding
Conflicts of Interest
References
- Bergman, K.; Sarkar, P.; O’connor, T.G.; Modi, N.; Glover, V. Maternal Stress During Pregnancy Predicts Cognitive Ability and Fearfulness in Infancy. J. Am. Acad. Child Adolesc. Psychiatry 2007, 46, 1454–1463. [Google Scholar] [CrossRef] [PubMed] [Green Version]
- Glover, V. Maternal depression, anxiety and stress during pregnancy and child outcome; what needs to be done. Best Pract. Res. Clin. Obstet. Gynaecol. 2014, 28, 25–35. [Google Scholar] [CrossRef]
- Rice, F.; Harold, G.T.; Boivin, J.; van den Bree, M.; Hay, D.F.; Thapar, A. The links between prenatal stress and offspring development and psychopathology: Disentangling environmental and inherited influences. Psychol. Med. 2010, 40, 335. [Google Scholar] [CrossRef]
- Van den Bergh, B.R.H.; van den Heuvel, M.I.; Lahti, M.; Braeken, M.; de Rooij, S.R.; Entringer, S.; Hoyer, D.; Roseboom, T.; Räikkönen, K.; King, S.; et al. Prenatal developmental origins of behavior and mental health: The influence of maternal stress in pregnancy. Neurosci. Biobehav. Rev. 2017. [Google Scholar] [CrossRef] [PubMed]
- Woody, C.A.; Ferrari, A.J.; Siskind, D.J.; Whiteford, H.A.; Harris, M.G. A systematic review and meta-regression of the prevalence and incidence of perinatal depression. J. Affect. Disord. 2017, 219, 86–92. [Google Scholar] [CrossRef] [Green Version]
- Austin, M.-P.; Tully, L.; Parker, G. Examining the relationship between antenatal anxiety and postnatal depression. J. Affect. Disord. 2007, 101, 169–174. [Google Scholar] [CrossRef] [PubMed]
- de Bruijn, A.T.C.E.; van Bakel, H.J.A.; van Baar, A.L. Sex differences in the relation between prenatal maternal emotional complaints and child outcome. Early Hum. Dev. 2009, 85, 319–324. [Google Scholar] [CrossRef]
- O’Connor, T.G.; Heron, J.; Golding, J.; Beveridge, M.; Glover, V. Maternal antenatal anxiety and children’s behavioural/emotional problems at 4 years. Report from the Avon Longitudinal Study of Parents and Children. Br. J. Psychiatry 2002, 180, 502–508. [Google Scholar] [CrossRef]
- Austin, M.-P.; Hadzi-Pavlovic, D.; Leader, L.; Saint, K.; Parker, G. Maternal trait anxiety, depression and life event stress in pregnancy: Relationships with infant temperament. Early Hum. Dev. 2005, 81, 183–190. [Google Scholar] [CrossRef]
- Pawlby, S.; Hay, D.F.; Sharp, D.; Waters, C.S.; O’Keane, V. Antenatal depression predicts depression in adolescent offspring: Prospective longitudinal community-based study. J. Affect. Disord. 2009, 113, 236–243. [Google Scholar] [CrossRef]
- Glover, V. Prenatal Stress and Its Effects on the Fetus and the Child: Possible Underlying Biological Mechanisms. Adv. Neurobiol. 2015, 10, 269–283. [Google Scholar]
- Connors, S.L.; Levitt, P.; Matthews, S.G.; Slotkin, T.A.; Johnston, M.V.; Kinney, H.C.; Johnson, W.G.; Dailey, R.M.; Zimmerman, A.W. Fetal Mechanisms in Neurodevelopmental Disorders. Pediatr. Neurol. 2008, 38, 163–176. [Google Scholar] [CrossRef]
- Qiu, A.; Anh, T.T.; Li, Y.; Chen, H.; Rifkin-Graboi, A.; Broekman, B.F.P.; Kwek, K.; Saw, S.-M.; Chong, Y.-S.; Gluckman, P.D.; et al. Prenatal maternal depression alters amygdala functional connectivity in 6-month-old infants. Transl. Psychiatry 2015, 5, e508. [Google Scholar] [CrossRef]
- Rifkin-Graboi, A.; Bai, J.; Chen, H.; Hameed, W.B.; Sim, L.W.; Tint, M.T.; Leutscher-Broekman, B.; Chong, Y.-S.; Gluckman, P.D.; Fortier, M.V.; et al. Prenatal Maternal Depression Associates with Microstructure of Right Amygdala in Neonates at Birth. Biol. Psychiatry 2013, 74, 837–844. [Google Scholar] [CrossRef]
- Sandman, C.A.; Buss, C.; Head, K.; Davis, E.P. Fetal Exposure to Maternal Depressive Symptoms Is Associated With Cortical Thickness in Late Childhood. Biol. Psychiatry 2015, 77, 324–334. [Google Scholar] [CrossRef]
- Lebel, C.; Walton, M.; Letourneau, N.; Giesbrecht, G.F.; Kaplan, B.J.; Dewey, D. Prepartum and Postpartum Maternal Depressive Symptoms Are Related to Children’s Brain Structure in Preschool. Biol. Psychiatry 2016, 80, 859–868. [Google Scholar] [CrossRef]
- El Marroun, H.; Tiemeier, H.; Muetzel, R.L.; Thijssen, S.; van der Knaap, N.J.F.; Jaddoe, V.W.V.; Fernández, G.; Verhulst, F.C.; White, T.J.H. Prenatal exposure to maternal and paternal depressive symptoms and brain morphology: A population-based prospective neuroimaging study in young children. Depress. Anxiety 2016, 33, 658–666. [Google Scholar] [CrossRef]
- Wen, D.J.; Poh, J.S.; Ni, S.N.; Chong, Y.-S.; Chen, H.; Kwek, K.; Shek, L.P.; Gluckman, P.D.; Fortier, M.V.; Meaney, M.J.; et al. Influences of prenatal and postnatal maternal depression on amygdala volume and microstructure in young children. Transl. Psychiatry 2017, 7, e1103. [Google Scholar] [CrossRef]
- Zuckerman, B.; Amaro, H.; Bauchner, H.; Cabral, H. Depressive symptoms during pregnancy: Relationship to poor health behaviors. Am. J. Obstet. Gynecol. 1989, 160, 1107–1111. [Google Scholar] [CrossRef]
- Bublitz, M.H.; Stroud, L.R. Maternal Smoking During Pregnancy and Offspring Brain Structure and Function: Review and Agenda for Future Research. Nicotine Tob. Res. 2012, 14, 388–397. [Google Scholar] [CrossRef]
- Milgrom, J.; Holt, C.; Holt, C.J.; Ross, J.; Ericksen, J.; Gemmill, A.W. Feasibility study and pilot randomised trial of an antenatal depression treatment with infant follow-up. Arch. Womens. Ment. Health 2015, 18, 717–730. [Google Scholar] [CrossRef]
- Rubertsson, C.; Börjesson, K.; Berglund, A.; Josefsson, A.; Sydsjö, G. The Swedish validation of Edinburgh Postnatal Depression Scale (EPDS) during pregnancy. Nord. J. Psychiatry 2011, 65, 414–418. [Google Scholar] [CrossRef]
- First, M.B.; Spitzer, R.L.; Gibbon, M. Structured Clinical Interview for DSM-IV Axis I Disorders, Patient Edition (SCID-I/P, version 2.0); American Psychiatric Publishing, Inc.: Washington, DC, USA, 1996. [Google Scholar]
- Beck, A.T.; Steer, R.A.; Brown, G.K. BDI-II Manual; The Psychological Corporation: San Antonio, TX, USA, 1996. [Google Scholar]
- Beck, A.T.; Epstein, N.; Brown, G.; Steer, R.A. An inventory for measuring clinical anxiety: Psychometric properties. J. Consult. Clin. Psychol. 1988, 56, 893–897. [Google Scholar] [CrossRef]
- Wechsler, D. The Wechsler Preschool and Primary Scale of Intelligence—Third Edition. San antonio, TX Psychol. Corp. 2002. [Google Scholar]
- Dale, A.; Fischl, B.; Sereno, M.I. Cortical Surface-Based Analysis: I. Segmentation and Surface Reconstruction. Neuroimage 1999, 9, 179–194. [Google Scholar] [CrossRef]
- Fischl, B.; Salat, D.-H.; Busa, E.; Albert, M.; Dieterich, M.; Haselgrove, C.; van der Kouwe, A.; Killiany, R.; Kennedy, D.; Klaveness, S.; et al. Whole brain segmentation: Automated labeling of neuroanatomical structures in the human brain. Neuron 2002, 33, 341–355. [Google Scholar] [CrossRef]
- Raffelt, D.A.; Smith, R.E.; Ridgway, G.R.; Tournier, J.-D.; Vaughan, D.N.; Rose, S.; Henderson, R.; Connelly, A. Connectivity-based fixel enhancement: Whole-brain statistical analysis of diffusion MRI measures in the presence of crossing fibres. Neuroimage 2015, 117, 40–55. [Google Scholar] [CrossRef] [Green Version]
- Tournier, J.-D.; Calamante, F.; Connelly, A. A Robust Spherical Deconvolution Method for the Analysis of Low SNR or Low Angular Resolution Diffusion Data. 2013. Available online: http://cds.ismrm.org/protected/13MProceedings/files/0772.PDF (accessed on 16 May 2018).
- Raffelt, D.; Tournier, J.-D.; Rose, S.; Ridgway, G.R.; Henderson, R.; Crozier, S.; Salvado, O.; Connelly, A. Apparent Fibre Density: A novel measure for the analysis of diffusion-weighted magnetic resonance images. Neuroimage 2012, 59, 3976–3994. [Google Scholar] [CrossRef]
- Raffelt, D.A.; Tournier, J.-D.; Smith, R.E.; Vaughan, D.N.; Jackson, G.; Ridgway, G.R.; Connelly, A. Investigating white matter fibre density and morphology using fixel-based analysis. Neuroimage 2017, 144, 58–73. [Google Scholar] [CrossRef]
- Moher, D.; Hopewell, S.; Schulz, K.F.; Montori, V.; Gøtzsche, P.C.; Devereaux, P.J.; Elbourne, D.; Egger, M.; Altman, D.G. CONSORT 2010 Explanation and Elaboration: Updated guidelines for reporting parallel group randomised trials. J. Clin. Epidemiol. 2010, 63, e1–e37. [Google Scholar] [CrossRef]
- Salm, A.K.; Pavelko, M.; Krouse, E.M.; Webster, W.; Kraszpulski, M.; Birkle, D.L. Lateral amygdaloid nucleus expansion in adult rats is associated with exposure to prenatal stress. Dev. Brain Res. 2004, 148, 159–167. [Google Scholar] [CrossRef]
- Murmu, M.S.; Salomon, S.; Biala, Y.; Weinstock, M.; Braun, K.; Bock, J. Changes of spine density and dendritic complexity in the prefrontal cortex in offspring of mothers exposed to stress during pregnancy. Eur. J. Neurosci. 2006, 24, 1477–1487. [Google Scholar] [CrossRef] [PubMed]
- Buss, C.; Davis, E.P.; Muftuler, L.T.; Head, K.; Sandman, C.A. High pregnancy anxiety during mid-gestation is associated with decreased gray matter density in 6–9-year-old children. Psychoneuroendocrinology 2010, 35, 141–153. [Google Scholar] [CrossRef] [PubMed]
- Favaro, A.; Tenconi, E.; Degortes, D.; Manara, R.; Santonastaso, P. Neural correlates of prenatal stress in young women. Psychol. Med. 2015, 45, 2533–2543. [Google Scholar] [CrossRef] [PubMed] [Green Version]
- Ahmad, Z.; Balsamo, L.M.; Sachs, B.C.; Xu, B.; Gaillard, W.D. Auditory comprehension of language in young children: Neural networks identified with fMRI. Neurology 2003, 60, 1598–1605. [Google Scholar] [CrossRef]
- Mestres-Missé, A.; Càmara, E.; Rodriguez-Fornells, A.; Rotte, M.; Münte, T.F. Functional Neuroanatomy of Meaning Acquisition from Context. J. Cogn. Neurosci. 2008, 20, 2153–2166. [Google Scholar] [CrossRef] [Green Version]
- Davis, E.P.; Head, K.; Buss, C.; Sandman, C.A. Prenatal maternal cortisol concentrations predict neurodevelopment in middle childhood. Psychoneuroendocrinology 2017, 75, 56–63. [Google Scholar] [CrossRef]
- Menary, K.; Collins, P.F.; Porter, J.N.; Muetzel, R.; Olson, E.A.; Kumar, V.; Steinbach, M.; Lim, K.O.; Luciana, M. Associations between cortical thickness and general intelligence in children, adolescents and young adults. Intelligence 2013, 41, 597–606. [Google Scholar] [CrossRef] [Green Version]
- MacKinnon, N.; Kingsbury, M.; Mahedy, L.; Evans, J.; Colman, I. The Association Between Prenatal Stress and Externalizing Symptoms in Childhood: Evidence From the Avon Longitudinal Study of Parents and Children. Biol. Psychiatry 2018, 83, 100–108. [Google Scholar] [CrossRef] [Green Version]
- Price, J.L.; Drevets, W.C. Neurocircuitry of Mood Disorders. Neuropsychopharmacology 2010, 35, 192–216. [Google Scholar] [CrossRef]
- Holmes, A.J.; Lee, P.H.; Hollinshead, M.O.; Bakst, L.; Roffman, J.L.; Smoller, J.W.; Buckner, R.L. Individual Differences in Amygdala-Medial Prefrontal Anatomy Link Negative Affect, Impaired Social Functioning, and Polygenic Depression Risk. J. Neurosci. 2012, 32, 18087–18100. [Google Scholar] [CrossRef] [PubMed] [Green Version]
- Malykhin, N.V.; Carter, R.; Hegadoren, K.M.; Seres, P.; Coupland, N.J. Fronto-limbic volumetric changes in major depressive disorder. J. Affect. Disord. 2012, 136, 1104–1113. [Google Scholar] [CrossRef]
- van der Knaap, N.J.F.; Klumpers, F.; El Marroun, H.; Mous, S.; Schubert, D.; Jaddoe, V.; Hofman, A.; Homberg, J.R.; Tiemeier, H.; White, T.; et al. Maternal depressive symptoms during pregnancy are associated with amygdala hyperresponsivity in children. Eur. Child Adolesc. Psychiatry 2018, 27, 57–64. [Google Scholar] [CrossRef] [PubMed]
- Buss, C.; Davis, E.P.; Shahbaba, B.; Pruessner, J.C.; Head, K.; Sandman, C.A. Maternal cortisol over the course of pregnancy and subsequent child amygdala and hippocampus volumes and affective problems. Proc. Natl. Acad. Sci. 2012, 109, E1312–E1319. [Google Scholar] [CrossRef] [PubMed] [Green Version]
- Choi, D.C.; Furay, A.R.; Evanson, N.K.; Ulrich-Lai, Y.M.; Nguyen, M.M.N.; Ostrander, M.M.; Herman, J.P. The role of the posterior medial bed nucleus of the stria terminalis in modulating hypothalamic-pituitary-adrenocortical axis responsiveness to acute and chronic stress. Psychoneuroendocrinology 2008, 33, 659–669. [Google Scholar] [CrossRef] [PubMed]
- Walker, D.L.; Davis, M. Role of the extended amygdala in short-duration versus sustained fear: A tribute to Dr. Lennart Heimer. Brain Struct. Funct. 2008, 213, 29–42. [Google Scholar] [CrossRef]
- Lebow, M.A.; Chen, A. Overshadowed by the amygdala: The bed nucleus of the stria terminalis emerges as key to psychiatric disorders. Mol. Psychiatry 2016, 21, 450–463. [Google Scholar] [CrossRef]
- Leow, A.D.; Zhan, L.; Zhu, S.; Hageman, N.; Chiang, M.-C.; Barysheva, M.; Toga, A.W.; McMahon, K.L.; de Zubicaray, G.I.; Wright, M.J.; et al. White matter integrity measured by fractional anisotropy correlates poorly with actual individual fiber anisotropy. In Proceedings of the 2009 IEEE International Symposium on Biomedical Imaging: From Nano to Macro, Boston, MA, USA, 28 June–1 July 2009; 2009; pp. 622–625. [Google Scholar] [Green Version]
- Sharifzadeh, S. The Influence of Maternal Depression during Pregnancy on Neonatal Fiber Tract Integrity. 2016. Available online: https://openarchive.ki.se/xmlui/handle/10616/45432 (accessed on 20 May 2019).
- Thomason, M.E.; Dougherty, R.F.; Colich, N.L.; Perry, L.M.; Rykhlevskaia, E.I.; Louro, H.M.; Hallmayer, J.F.; Waugh, C.E.; Bammer, R.; Glover, G.H.; et al. COMT genotype affects prefrontal white matter pathways in children and adolescents. Neuroimage 2010, 53, 926–934. [Google Scholar] [CrossRef] [Green Version]
- Versace, A.; Almeida, J.R.C.; Hassel, S.; Walsh, N.D.; Novelli, M.; Klein, C.R.; Kupfer, D.J.; Phillips, M.L. Elevated Left and Reduced Right Orbitomedial Prefrontal Fractional Anisotropy in Adults With Bipolar Disorder Revealed by Tract-Based Spatial Statistics. Arch. Gen. Psychiatry 2008, 65, 1041. [Google Scholar] [CrossRef]
- Fleming, A.S.; Ruble, D.N.; Flett, G.L.; Shaul, D.L. Postpartum adjustment in first-time mothers: Relations between mood, maternal attitudes, and mother-infant interactions. Dev. Psychol. 1988, 24, 71–81. [Google Scholar] [CrossRef]


| Baseline Demographics | Non-Responders | Responders | ||
|---|---|---|---|---|
| CBT (n = 20) | TAU (n = 18) | CBT (n = 8) | TAU (n = 8) | |
| BDI-II pre-treatment score | 31.8 ± 8.6 | 32.5 ± 7.8 | 29.8 ± 11.3 | 26.4 ± 10.1 |
| BAI pre-treatment score | 25.0 ± 10.5 | 23.1 ± 11.2 | 18.8 ± 9.7 | 17.5 ± 6.4 |
| BDI-II post-treatment score 1 | 13.7 ± 9.4 | 18.4 ± 11.3 | 12.0 ± 10.7 | 18.3 ± 6.2 |
| BAI post-treatment score 1 | 11.1 ± 7.0 | 17.4 ± 12.9 | 11.6 ± 10.9 | 15.5 ± 8.0 |
| ∆ BDI-II score (pre-treatment–post-treatment) | 18.9 ± 10.9 | 15.0 ± 12.0 | 17.8 ± 7.4 | 6.7 ± 13.9 |
| ∆ BAI score (pre-treatment–post-treatment) | 13.5 ± 9.7 | 5.5 ± 8.8 | 7.1 ± 6.7 | 1.8 ± 6.2 |
| Gestational age at enrolment in weeks | 21.3 ± 7.6 | 21.4 ± 6.5 | 16.6 ± 7.2 | 20.0 ± 5.1 |
| Antidepressant use at baseline (%) | 15.8 | 27.8 | 0 | 12.5 |
| Marital status (%) | ||||
| Married | 60.0 | 66.7 | 62.5 | 62.5 |
| De Facto | 35.0 | 16.7 | 25 | 25 |
| Separated | 0 | 5.6 | 0 | 12.5 |
| Single | 5.0 | 11.1 | 12.5 | 0 |
| Birth location (%) | ||||
| Australia | 70.0 | 66.7 | 87.5 | 100 |
| Other | 30.0 | 23.3 | 12.5 | 0 |
| Income (%) | ||||
| Up to $20,000 | 5.3 | 5.9 | 0 | 12.5 |
| $20,001−$40,000 | 5.3 | 23.5 | 12.5 | 12.5 |
| $40,001−$60,000 | 26.3 | 23.5 | 0 | 0 |
| $60,001−$80,000 | 21.1 | 23.5 | 37.5 | 25 |
| >$80,001 | 31.6 | 17.6 | 37.5 | 50 |
| Do not wish to divulge | 10.5 | 5.9 | 12.5 | 0 |
| Highest level of education (%) | ||||
| Did not finish school | 5.0 | 16.7 | 0 | 0 |
| High School | 10.0 | 22.2 | 0 | 25 |
| Certificate Level/Apprenticeship | 25.0 | 0 | 12.5 | 12.5 |
| Advanced Diploma | 15.0 | 11.1 | 25 | 0 |
| Bachelor degree | 25.0 | 16.7 | 0 | 25 |
| Graduate diploma/certificate | 10.0 | 16.7 | 37.5 | 25 |
| Postgraduate Degree | 10.0 | 16.7 | 25 | 12.5 |
| Women | CBT (n = 8) | TAU (n = 8) |
|---|---|---|
| Age at giving birth | 34.1 ± 6.0 | 35.6 ± 3.9 |
| Current BDI-II | 15.0 ± 15.8 | 14.4 ± 10.1 |
| Baseline BDI-II | 29.8 ± 11.3 | 26.4 ± 10.1 |
| Current BAI | 11.1 ± 9.5 | 10.4 ± 11.3 |
| Baseline BAI | 18.8 ± 9.7 | 17.5 ± 6.4 |
| Antidepressant use (%) | 12.5 | 50 |
| Marital status (%) | ||
| Married | 62.5 | 75 |
| De Facto | 12.5 | 12.5 |
| Separated/Single | 25 | 12.5 |
| Family Income (%) | ||
| Up to $20,000 | 0 | 12.5 |
| $20,0001–$40,000 | 12.5 | 0 |
| $40,001–$60,000 | 0 | 12.5 |
| $60,001–$80,000 | 0 | 12.5 |
| >$80,001 | 87.5 | 62.5 |
| Highest level of education (%) | ||
| Did not finish school | 0 | 0 |
| High school | 0 | 25 |
| Certificate level/apprenticeship | 12.5 | 12.5 |
| Advanced diploma | 0 | 0 |
| Bachelor degree | 12.5 | 12.5 |
| Graduate diploma/certificate | 50 | 12.5 |
| Postgraduate Degree | 25 | 37.5 |
| Children | ||
| Age (years) | 5.7 ± 1.0 | 6.2 ± 0.8 |
| Birth weight (grams) | 3622 ± 343 | 3393 ± 580 |
| Gender (boys) (%) | 62.5 | 75 |
| Region of Interest | CBT (n = 8) | TAU (n = 8) | Regression Coefficients 1 | |
|---|---|---|---|---|
| Mean mm ± SD | Mean mm ± SD | B | 95% CI | |
| Superior Frontal Gyrus | 2.93 ± 0.24 | 3.02 ± 0.17 | −0.07 | −0.32 to 0.17 |
| Caudal Middle Frontal Cortex | 2.72 ± 0.15 | 2.79 ± 0.21 | −0.06 | −0.27 to 0.15 |
| Rostral Middle Frontal Gyrus | 2.73 ± 0.22 | 2.77 ± 0.18 | −0.04 | −0.28 to 0.20 |
| Inferior Frontal Gyrus–Pars Opercularis | 2.96 ± 0.22 | 2.96 ± 0.13 | 0.02 | −0.19 to 0.23 |
| Inferior Frontal Gyrus–Pars Orbitalis | 3.09 ± 0.12 | 3.14 ± 0.25 | −0.05 | −0.28 to 0.18 |
| Inferior Frontal Gyrus–Pars Triangularis | 3.00 ± 0.17 | 2.96 ± 0.12 | 0.05 | −0.12 to 0.22 |
| Precentral Gyrus | 2.60 ± 0.26 | 2.61 ± 0.20 | 0.02 | −0.24 to 0.28 |
| Postcentral Gyrus | 2.27 ± 0.22 | 2.32 ± 0.19 | −0.06 | −0.30 to 0.18 |
| Supramarginal Gyrus | 2.79 ± 0.22 | 2.68 ± 0.21 | −0.11 | −0.36 to 0.14 |
| Superior Temporal Gyrus | 3.06 ± 0.18 | 3.04 ± 0.20 | 0.03 | −0.19 to 0.24 |
| Middle Temporal Gyrus | 3.13 ± 0.17 | 3.10 ± 0.14 | 0.05 | −0.12 to 0.22 |
| Inferior Temporal gyrus | 3.13 ± 0.15 | 2.99 ± 0.18 | 0.16 | −0.02 to 0.35 |
| Fusiform Gyrus | 3.01 ± 0.09 | 3.0 ± 0.15 | 0.02 | −0.12 to 0.16 |
| Lateral Occipital Cortex | 2.59 ± 0.12 | 2.48 ± 0.13 | 0.13 | 0.005 to 0.26 * |
| Lingual Gyrus | 2.55 ± 0.11 | 2.40 ± 0.18 | 0.18 | 0.01 to 0.34 * |
| Cuneus | 2.38 ± 0.09 | 2.38 ± 0.14 | 0.02 | −0.12 to 0.15 |
| Insular Cortex 2 | 3.37 ± 0.19 | 3.4 ± 0.14 | −0.004 | −0.03 to 0.02 |
| Region of Interest | CBT (n = 8) | TAU (n = 8) | Regression Coefficients 1 | |
|---|---|---|---|---|
| Mean mm ± SD | Mean mm ± SD | B | 95% CI | |
| Superior Frontal Gyrus | 2.97 ± 0.17 | 3.06 ± 0.15 | −0.08 | −0.26 to 0.10 |
| Caudal Middle Frontal Cortex | 2.65 ± 0.26 | 2.81 ± 0.17 | −0.15 | −0.41 to 0.10 |
| Rostral Middle Frontal Cortex | 2.82 ± 0.17 | 2.83 ± 0.19 | 0.001 | −0.21 to 0.21 |
| Inferior Frontal Gyrus–Pars Opercularis | 3.06 ± 0.17 | 3.03 ± 0.18 | 0.05 | −0.15 to 0.25 |
| Inferior Frontal Gyrus–Pars Orbitalis 2 | 3.29 ± 0.25 | 3.15 ± 0.17 | 0.02 | −0.02 to 0.05 |
| Inferior Frontal Gyrus–Pars Triangularis | 3.05 ± 0.16 | 2.9 ± 0.19 | 0.14 | −0.05 to 0.34 |
| Precentral Gyrus | 2.67 ± 0.19 | 2.67 ± 0.13 | −0.002 | −0.19 to 0.18 |
| Postcentral Gyrus 2 | 2.36 ± 0.13 | 2.28 ± 0.13 | 0.11 | −0.01 to 0.24 |
| Supramarginal Gyrus | 2.90 ± 0.23 | 2.77 ± 0.23 | 0.18 | −0.07 to 0.42 |
| Superior Temporal Gyrus | 3.11 ± 0.25 | 3.01 ± 0.13 | 0.11 | −0.12 to 0.34 |
| Middle Temporal Gyrus 2 | 3.17 ± 0.08 | 3.08 ± 0.13 | 0.11 | −0.01 to 0.22 |
| Inferior Temporal Lobe | 3.19 ± 0.13 | 3.13 ± 0.19 | 0.11 | −0.05 to 0.26 |
| Fusiform Gyrus 2 | 3.02 ± 0.10 | 3.0 ± 0.13 | 0.007 | −0.01 to 0.02 |
| Lateral Occipital Cortex | 2.56 ± 0.11 | 2.46 ± 0.11 | 0.12 | −0.01 to 0.25 |
| Lingual Gyrus | 2.53 ± 0.20 | 2.43 ± 0.23 | 0.11 | −0.14 to 0.36 |
| Cuneus | 2.48 ± 0.16 | 2.43 ± 0.19 | 0.08 | −0.15 to 0.27 |
| Insular cortex | 3.43 ± 0.15 | 3.44 ± 0.21 | −0.02 | −0.23 to 0.19 |
| Subcortical Structure | CBT (n = 8) | TAU (n = 8) | Regression Coefficients 1 | |
|---|---|---|---|---|
| Mean mm3 ± SD | Mean mm3 ± SD | B | 95% CI | |
| Total Gray Matter | 804,176 ± 52,916 | 82,706 ± 74,533 | 4140 | −33,620 to 41,900 |
| Total White Matter | 404,846 ± 24,130 | 434,449 ± 55,768 | −13,482 | −44,932 to 17,969 |
| Amygdala | 3150 ± 257 | 3331 ± 331 | −98 | −378 to 182 |
| Cerebellum | 115,228 ± 11,175 | 122,146 ± 109,478 | −4667 | −16,290 to 6955 |
| Hippocampus | 8042 ± 794 | 8391 ± 652 | −110 | −728 to 509 |
© 2019 by the authors. Licensee MDPI, Basel, Switzerland. This article is an open access article distributed under the terms and conditions of the Creative Commons Attribution (CC BY) license (http://creativecommons.org/licenses/by/4.0/).
Share and Cite
Bleker, L.S.; Milgrom, J.; Parker, D.; Gemmill, A.W.; Holt, C.J.; Connelly, A.; Burger, H.; Roseboom, T.J.; de Rooij, S.R. Brain Magnetic Resonance Imaging Findings in Children after Antenatal Maternal Depression Treatment, a Longitudinal Study Built on a Pilot Randomized Controlled Trial. Int. J. Environ. Res. Public Health 2019, 16, 1816. https://0-doi-org.brum.beds.ac.uk/10.3390/ijerph16101816
Bleker LS, Milgrom J, Parker D, Gemmill AW, Holt CJ, Connelly A, Burger H, Roseboom TJ, de Rooij SR. Brain Magnetic Resonance Imaging Findings in Children after Antenatal Maternal Depression Treatment, a Longitudinal Study Built on a Pilot Randomized Controlled Trial. International Journal of Environmental Research and Public Health. 2019; 16(10):1816. https://0-doi-org.brum.beds.ac.uk/10.3390/ijerph16101816
Chicago/Turabian StyleBleker, Laura S., Jeannette Milgrom, Donna Parker, Alan W. Gemmill, Christopher J. Holt, Alan Connelly, Huibert Burger, Tessa J. Roseboom, and Susanne R. de Rooij. 2019. "Brain Magnetic Resonance Imaging Findings in Children after Antenatal Maternal Depression Treatment, a Longitudinal Study Built on a Pilot Randomized Controlled Trial" International Journal of Environmental Research and Public Health 16, no. 10: 1816. https://0-doi-org.brum.beds.ac.uk/10.3390/ijerph16101816