Article

Distribution, Source and Risk Assessment of Heavy Metal(oid)s in Water, Sediments, and Corbicula Fluminea of Xijiang River, China

1
School of Environmental Science and Engineering, Guangzhou University, Guangzhou 510006, China
2
Linköping University—Guangzhou University Research Center on Urban Sustainable Development, Guangzhou University, Guangzhou 510006, China
3
Guangdong Provincial Key Laboratory of Radionuclides Pollution Control and Resources, Guangzhou University, Guangzhou 510006, China
4
Key Laboratory for Water Quality and Conservation of the Pearl River Delta, Ministry of Education, Guangzhou University, Guangzhou 510006, China
5
Environmental Engineering Program, Department of Civil Engineering, Auburn University, Auburn, AL 36849, USA
6
Guangxi Zhuang Autonomous Region Environmental Monitoring Station, Nanning 530028, China
7
Ecological Environment Information System and Big Data Research Team, Guangdong University of Technology, Guangzhou 510006, China
*
Author to whom correspondence should be addressed.
Int. J. Environ. Res. Public Health 2019, 16(10), 1823; https://0-doi-org.brum.beds.ac.uk/10.3390/ijerph16101823
Submission received: 21 April 2019 / Revised: 19 May 2019 / Accepted: 20 May 2019 / Published: 23 May 2019
(This article belongs to the Collection Environmental Risk Assessment)

Abstract

:
A total of 43 water and sediment samples, and 34 Corbicula fluminea samples were collected in Xijiang River in southern China to determine the spatial distribution and sources of 12 metals/metalloids (V, Co, Cr, Ni, Cu, Mn, Zn, Cd, Pb, As, Sb, and Tl) and to assess the pollution levels and ecological risks of the pollutants. The results showed that the levels of the metals/metalloids (except for Tl) in the river water from almost all of the sampling sites met the Chinese national surface water quality standards. However, the concentrations of the metals/metalloids in the sediments exceeded the background values by a factor of 1.03–56.56 except for V, Co, and Mn, and the contents of Zn, Cd, and Pb in the Corbicula fluminea soft tissue exceeded the limits of the Chinese Category I food Quality Standards. The spatial distribution analysis showed that the concentrations of the contaminants in the lower reaches of Xijiang River were higher than in the upper reaches. The bioaccumulation factor (BAF), biota-sediment accumulation factor (BSF), geo-accumulation index (Igeo), and the potential ecological risk index (RI) were obtained to assess the pollution levels and ecological risks. The results indicated that Cu, Cd, and Zn were the most prone to bio-accumulation in the Corbicula fluminea soft tissue, and the lower reaches showed a much higher pollution level and risk than the upper reaches. The metals/metalloids in the sediments posed serious threat on the aquatic ecosystem, of which Cd, As, and Sb are the most risky contaminants. The results of principal component analysis (PCA) indicated Cr, Ni, Cu, Mn, Cd, Pb, and As in the sediments came from relevant industrial activities, and V and Co originated from natural sources, and Sb from mining activities, Zn and Tl came from industrial activities and mining activities.

1. Introduction

With the rapid development of economy and the continuous expansion of city size, the contamination of water, biotas, and sediments by metals and metalloids has become a serious environmental issue in many countries [1,2,3,4]. The released metals/metalloids can pose serious and long-lasting threats to the environment due to the associated adverse health effect, environmental persistence, and bioaccumulation in biotas and human body. While trace amounts of metals/metalloids can originate from natural sources, such as weathering of rocks and minerals and volcanic activities, human activities account for the most input into the aquatic systems, including mining and mineral processing [5,6], metal smelting [7,8], domestic and industrial effluents [9,10], urban surface runoff [11,12], agriculture and animal husbandry activities [13,14], fossil fuel combustion and atmospheric depositions [15,16], and ship dumping [17].
Typically, the majority of released metals/metalloids accumulate in the surficial sediment in aquatic systems via adsorption, chelation, and sedimentation processes [18], and about 10% of them exist in the water column in the dissolved form [19,20], or are associated with suspended particles. Yet, heavy metals/metalloids in the sediments may be released into the water column by physical, chemical, and biological remobilization processes [21]. As such, sediments are usually considered to be the major sink of heavy metals/metalloids in aquatic ecosystems. Furthermore, the sediments also play very important roles in the aquatic safety and in assessing the potential ecological risk of the pollutants in the aquatic environment.
Corbicula fluminea (C. fluminea) is a freshwater bivalve mollusk and it is widely distributed in freshwater lakes and rivers worldwide [22]. It has been used as a bio-indicator in the monitoring of contamination and bioavailability of heavy metals in aquatic ecosystems over the past 30 years [23]. Its ubiquitous distribution and sedentary habit ease the sampling. Moreover, C. fluminea lives in the water-sediment interface and it may act as a sedimentary filter feeder, with the ability to accumulate heavy metals that are dissolved in water or bound to fine sediments [24], which facilitates the chemical analysis [25].
Xijiang River is the major tributary of the Pearl River, ranking as the second largest river in China in terms of average streamflow next to the Yangtze River. It covers 78% of the Pearl River drainage basin and provides 64% of the water discharge. Xijiang River flows through Wuzhou, Zhaoqing, Yunfu, Foshan, Jiangmen, Zhongshan, Zhuhai City, and it finally enters into the South China Sea. It is a major source of drinking water for 86 counties with a total population of 28.7 million and it also supplies water for industries and agricultural purposes in the Guangxi and Guangdong Provinces [26]. Located in a region of rapid economic growth, Xijiang River has suffered from serious environmental degradation in recent decades, owing to the massive mining and industrial activities. Large amounts of wastewater containing heavy metals/metalloids without effective treatment were discharged from the mines, urban areas, and sewage systems into the river. It was reported that the discharge of mining wastes had caused serious Tl and Cd pollution of Xijiang River [27]. High concentrations of heavy metals, including Zn, Cd, Cr, Cu, and Pb, have been detected in the river surface sediments of upper reaches of the river basin [28]. However, to date, most studies regarding heavy metals in the Pearl River basin have been focused on Pearl River or Beijiang River, which is another major tributary of the Pearl River. Little information is available regarding the contents of heavy metals in the water and sediments of Xijiang River, especially on the relationship of heavy metals concentration in water, sediments, and C. fluminea.
Thus, the main objectives of this study were to: (1) determine total contents of V, Co, Cr, Ni, Cu, Mn, Zn, Cd, Pb, As, Sb, and Tl in the water, sediments, and C. fluminea of Xijiang River; (2) evaluate the major sources of the heavy metals/metalloids and, (3) assess the potential ecological risks that are posed by these heavy metals/metalloids.

2. Materials and Methods

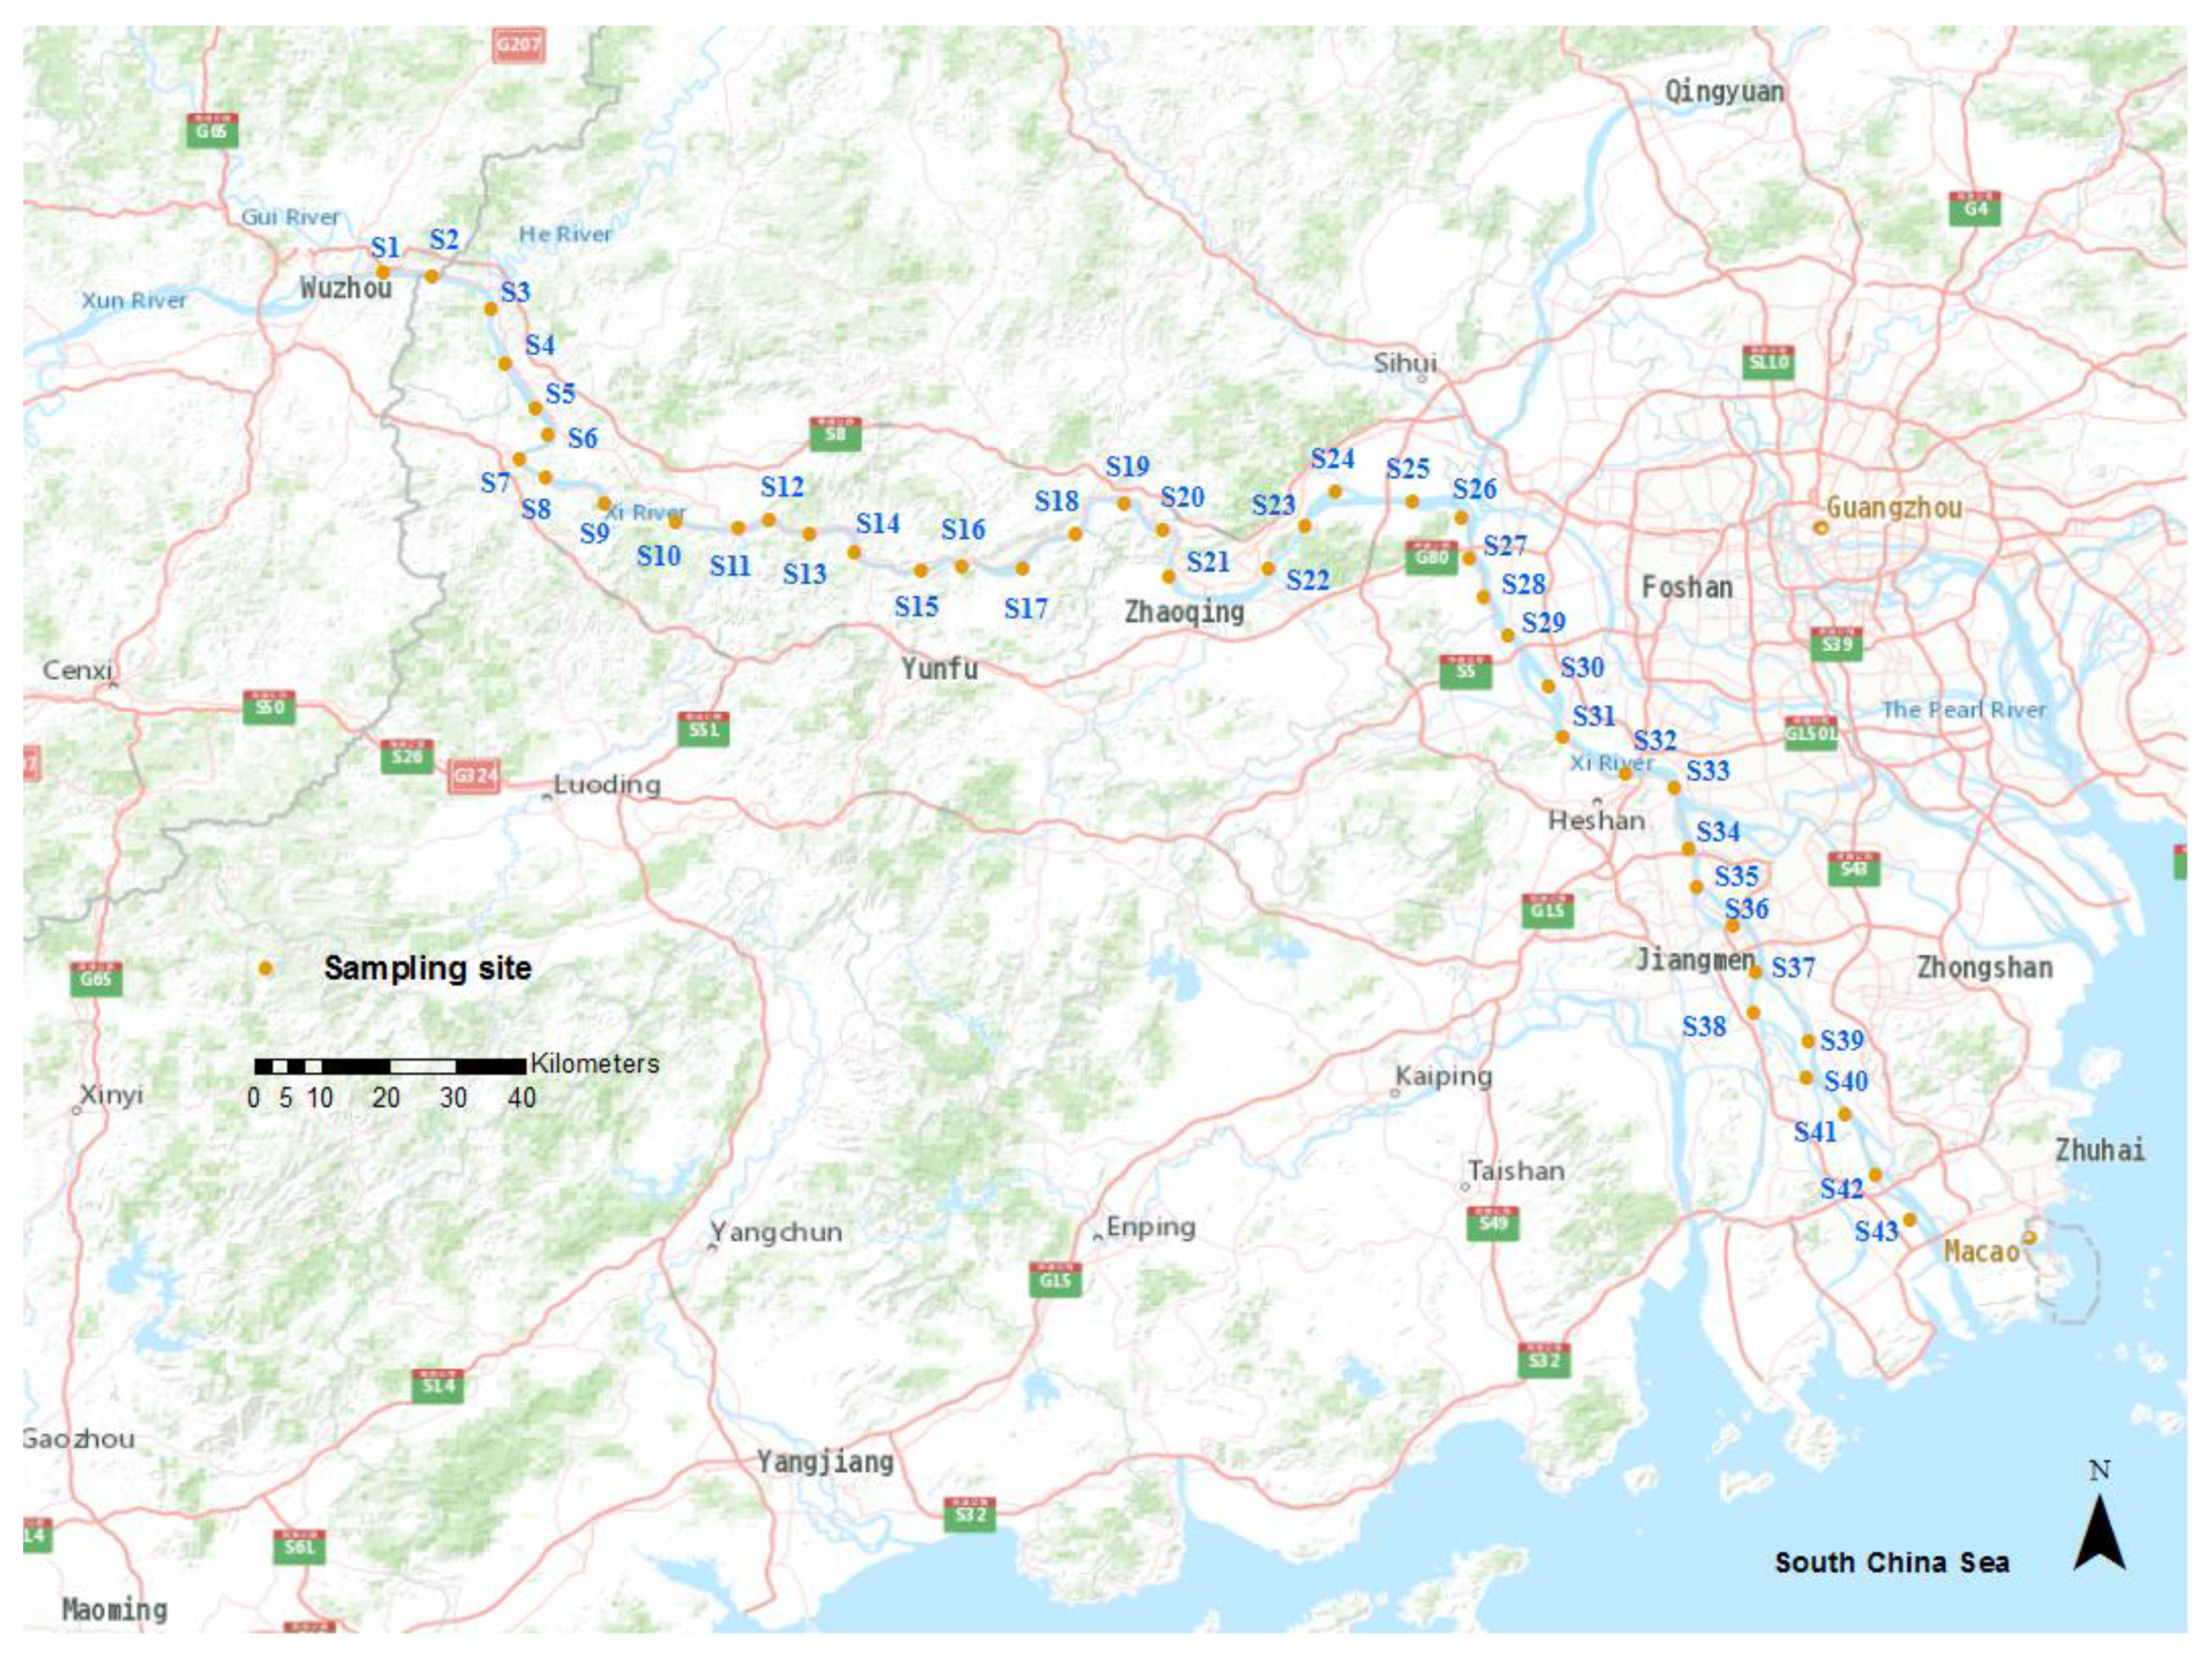
2.1. Description of the Sampling Area and Sample Collection

The Xijiang River basin is located in a region of subtropical-tropical monsoon climate (102°14′–113°33′ E, 21°31′–26°49′ N) in southern China. The annual mean temperature is 14–22 °C and the annual average precipitation is 1000–2000 mm, and about 80% of rain falls occur in the wet season (from April to September). The mainstream of Xijiang River originates from the Maxiong Mountains of Yunnan Province, and it flows through Guizhou, Guangxi, and Guangdong provinces from northwest to southeast. The study area belongs to the lower reaches of the mainstream, it covered a length of 350 km of Xijiang River, and the average annual runoff is 2.33 × 10¹¹ m3. The non-ferrous metal mineral resources in the Xijiang River basin are very abundant, especially the reserves of Pb, Zn, Tl, and Sb rank first in China.
Water, sediments, and C. fluminea samples were collected from 43 sites along Xijiang River on July 9 2015 (Figure 1 and Table S1 in the Supplementary Materials). At each sampling site, three subsamples of water or sediment were collected and combined as one representative sample. The water samples were collected with 100 mL syringes from about 0.15 m below the water surface and sealed in 500 mL polyethylene plastic bottles. The pH values of water samples were measured in the field with a portable pH meter. Meanwhile, sediment samples (top 10 cm) at each corresponding site were collected while using a stainless-steel grab sampler and kept in sealed polyethylene bags. C. fluminea samples (shell length between 20 and 25 mm) were separated from the collected sediments, with exception of the sampling sites S1, S7, S11, S15, S20, S30, S33, S37, and S41, and held in high-density polyethylene containers that were filled with the site water. As such, a total of 43 water, sediment, and 34 C. fluminea samples were collected from Xijiang River. All of the samples were kept in ice boxes and transported to the laboratory for further treatment and analysis.

2.2. Sample Preparation and Analysis

The water samples were filtered through 0.45 μm disposable filter membranes (Whatman GmbH, Dassel, Germany) and acidified (pH < 2) using analytical grade nitric acid and then stored in coolers at 4 °C for metal analysis.
The sediment samples were freeze-dried and sieved through a 2-mm nylon sieve to remove any stones and coarse debris. The sieved samples were ground and passed through a 0.149-mm nylon sieve. Subsequently, 0.1 g of each sediment sample was digested with 8 mL of 68% nitric acid (HNO3, v/v) and 3 mL of 40% hydrofluoric acid (HF, v/v).
For the C. fluminea samples, the soft tissues were taken out of the shells and then rinsed with Milli-Q water. The soft tissue was freeze-dried and measured to obtain the dry body weight. Afterwards, 0.5 g of the homogenized freeze-dried soft tissue was acid-digested with a mixture of HNO3 (68%, v/v) and hydrogen peroxide (H2O2, 30%, v/v).
The digestion process was conducted with an automatic digestion system (Polytech ST40, Polytech Instrument Ltd., Beijing, China). The digestant was then filtered through a 0.45 μm membrane filter. Consequently, the concentrations of V, Co, Cr, Ni, Cu, Mn, Zn, Cd, Pb, As, Sb, and Tl in the water and the digestant samples were analyzed using a Perkin-Elmer ELAN6100 inductively coupled plasma mass spectrometry (ICP-MS) (PerkinElmer Inc., Waltham, MA, USA).

2.3. Quality Assurance and Quality Control

Strict quality control measures were applied to all the analyses, including the uses of triplicate samples, reagent blanks, and certified reference materials, to control the quality of chemical analyses and assure the accuracy of the experimental data. The certified reference materials of GBW07446 (for Chinese soils) and GBW10024 (for scallops) were used to confirm the analytic methods. The recoveries of heavy metals extracted via the GBW-07446 and GBW-10024 procedures ranged from 93.4% to 107.5% and from 95.7% to 107.1%, respectively, with a relative standard deviation (RSD) of less than 4.5% and 5.8%. All of the polyethylene and glass bottles were soaked in HNO3 solution for 24 h and then thoroughly rinsed with deionized water before use.

2.4. Statistical Analysis

The Pearson correlation coefficients were calculated to determine the correlations among the heavy metal concentrations in the water, sediment, and biota samples. The criterion for significance in the correlation analysis was set at the level of p < 0.01 (significant). The method of principal components analysis (PCA) with varimax rotation of standardized component loadings was used to identify the possible distribution and sources of the heavy metals/metalloids. The number of principal components was determined based on the Kaiser criterion with an eigenvalue that is greater than 1 [29]. All of the statistical analyses were conducted with the SPSS 19 and the figures were produced using OriginPro 9.1 for Windows (OriginLab Corporation, Northampton, NC, USA). The geographic information system software ArcGIS 10.3 (Environmental Systems Research Institute Inc., Redlands, CA, USA) was used to draw the map of the sampling sites.

2.5. Risk Assessment

The bioaccumulation factor (BAF) [30], biota-sediment accumulation factor (BSF) [31], geo-accumulation index (Igeo) [32], the potential ecological risk factor for a single metal/metalloid (Eri), and the potential ecological risk index (RI) [33] were calculated based on the field data to assess the potential ecological risk associated with the heavy metals/metalloids.
BAF and BSF were calculated by the following equations:
B A F = E i D i
B S F = E i C i
where, Ei, Di, and Ci is the average concentrations of metal i in C. fluminea (mg kg−1), water (mg L−1), and sediment (mg kg−1), respectively. The values of BAF and BSF represent the relative ability of C. fluminea to bio-accumulate selected heavy metals from water and sediments. If BAF is much greater than 100, the aquatic organism has a strong potential to accumulate the metals/metalloids [34].
Igeo has been widely used to assess the heavy metals pollution levels in sediment and soil through comparing the differences between pre-industrial and present concentrations. Igeo was defined according to the following equation:
I geo = log 2 ( C n 1.5 × B n )
where, Cn (mg kg−1) is the average concentrations of metal n in sediment and Bn is the geochemical background of metal n in China’s continental crust (V = 99, Co = 32, Cr = 63, Ni = 57, Cu = 38, Mn = 780, Zn = 86, Cd = 0.055, Pb = 15, As = 1.9, Sb = 0.15, Tl = 0.61 mg kg−1). Igeo is categorized into the following seven classes: extremely polluted (Igeo > 5), strongly to extremely polluted (4 ≤ Igeo ≤ 5), strongly polluted (3 ≤ Igeo < 4), moderately to strongly polluted (2 ≤ Igeo < 3), moderately polluted (1 ≤ Igeo < 2), unpolluted to moderately polluted (0 < Igeo < 1), and unpolluted (Igeo ≤ 0).
Eri and RI were calculated to estimate the potential ecological risk of a single metal and mixtures of metals/metalloids in sediment via:
E r i = T r i × C i C n i
R I = i = 1 n E r i
where, T r i is the toxic factor of a metal/metalloid (V = 2, Co = 5, Cr = 2, Ni = 5, Cu = 5, Mn = 1, Zn = 1, Cd = 30, Pb = 5, As = 10, Sb = 7, Tl = 10) [35,36,37,38,39]. Ci is the measured concentration of metal i in sediment samples and Cni is the background value of heavy metal i. The background values of heavy metals in soils of China were used in this study [40]. Eri is the corresponding background value of the metal. Eri is categorized into the following five classes: very high risk (Eri > 320), high risk (160 ≤ Eri ≤ 320), considerable risk (80 ≤ Eri < 160), moderate risk (40 ≤ Eri < 80), and low risk (Eri < 40). RI is the sum of Eri and it is categorized into four classes: very high ecological risk (RI > 600), considerable ecological risk (300≤ RI ≤ 600), moderate ecological risk (150 ≤ RI < 300), and low ecological risk (RI < 150).

3. Results and Discussion

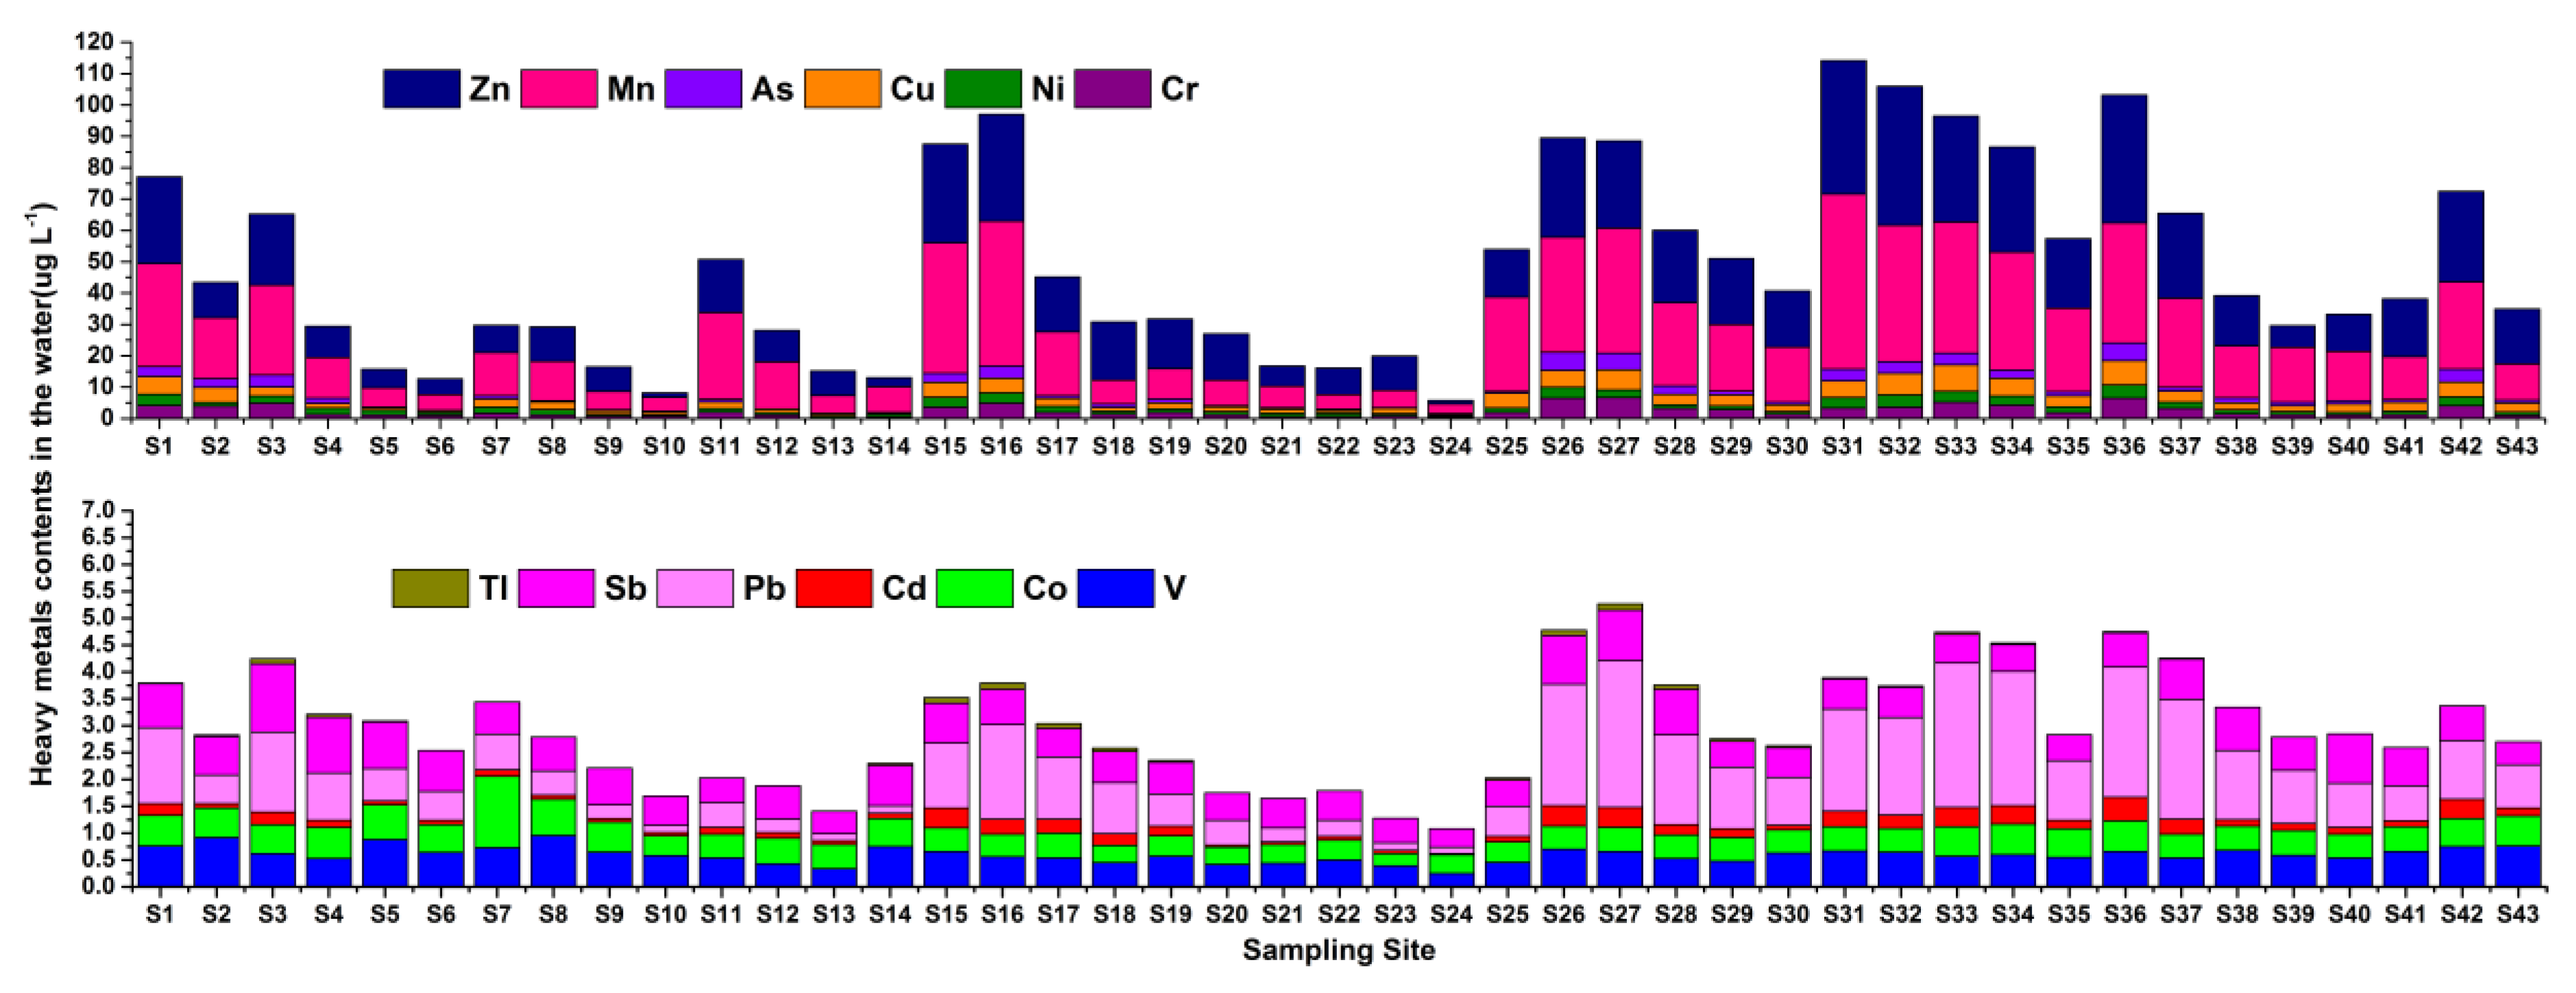
3.1. Levels of Metals/Metalloids in the River Water

The pH values of the river water from the 43 sampling sites varied from 6.3 to 7.9 with a mean of 7.2 ± 0.41, which met the national surface water environmental quality standards [41]. Table 1 presents the means, minimums, maximums, and standard deviations of the target metals/metalloids that are determined in the water, sediments, and C. fluminea from Xijiang River.
The mean contents of the pollutants in the river water followed the order of: Mn > Zn > Cu > Cr > Ni > As > Pb > Sb > V > Co > Cd > Tl. It is noteworthy that the values of Cr, As, Sb, and Pb in Xijiang River were lower than those in Beijiang River, which is another major tributary of the Pearl River. [42,43] (Table S2 in Supplementary Materials), while the concentrations of V, Mn, Cd, Ni, and Tl were higher than those in Beijiang River, (e.g., contents of V, Mn, and Tl were approximately two to three times higher) [44]. When compared with other rivers in China, the contents of the metals/metalloids in Xijiang River were much higher than those in Jingjiang River (about one to nine times) [45] and Xiangjiang River (about 1 to 20 times) [46], except for V and As. Yet, the contents of Cu, As, Ni, Cr, V, Cd, Pb, and Sb in part of Yangtze River [47] were about three to 100 times higher than those in Xijiang River, except for Zn and Mn, which were about two to four times lower than those in Xijiang River. The relatively higher levels of the metals/metalloids in Xijiang River might be ascribed to industrial discharges. According to the Water Resources Bulletin that ws issued by water resources department of Guangdong Province, from 2013 to 2015, the average annual discharge of wastewater into Xijiang River was 3.42 × 10⁸ tons, of which 51% was industrial wastewater.
Figure 2 shows the metals/metalloids contents in the water from different sampling sites. The spatial variation of the metals/metalloids contents along the river exhibited a remarkably increasing trend towards the lower reaches (S26–S43) in contrast with the upper reaches (S1–S25). The higher contents at sampling sites S1, S3, S11, and S15–S17 in the upper reaches were because these sites were located in urban areas (Wuzhou, Feikai, Deqing, and Yunfu City), which have higher population density and industrial discharges, such as metal smelting, electroplating, battery manufacture, printing and dyeing, mining and mineral processing, sulfuric acid manufacture, and wastewater treatment. In addition, high levels of Co, Cr, Mn, Zn, Cd, Pb, As, Sb, and Tl were observed at site S3, which was located at the junction of Xijiang River and Hejiang River. It was reported that a large amount of heavy metals were brought into Xijiang River from Hejiang River [48,49]. In addition, the acid mine drainage from the Yunfu pyrite mining area [50] also discharged a large amount of heavy metals into Xijiang River through Jiangshui River, which caused elevated contents of dissolved Mn, Zn, Cr, Ni, As, Cd, and especially Tl at sites S15–S17.
Sites S26 and S27 were located at the junction of Xijiang River and Beijiang River, and it was known that the latter carried out large amounts of metals/metalloids from a major mining area, the Dabaoshan polymetallic mines [51], into Xijiang [44]. This explains the higher contents of Cr, Pb, Zn, As, Cd, and Tl at these sites. Similarly, elevated contents of Cr, Ni, Cu, Mn, Zn, Cd, As, and Pb were observed at Sites S31–S34, S36, and S42. These sampling sites were located at urban areas (Foshan, Jiangmen, and Zhongshan City), which have been heavily impacted by various major industries involving heavy metals/metalloids, including: circuit board printing (Cu), electroplating and metal surface treating (Cr, Zn, Cu, Ni, Mn, Pb, and Cd), leather tanning and dyeing (Cr and As), building and sanitary ceramic production (Cd, Pb, Cr, Zn, Cu, Ni, and Co), and cadmium-nickel and lead acid battery manufacturing (Cd, Zn, Pb, Cr, Cu, Ni, As, and Mn). Some relevant factories were heavily fined or forced to close for non-compliance or illegal discharges, according to the local Environmental Protection Bureau. It should be noted that the contents of Tl in sampling sites S16 and S27 were slightly higher than the national surface water environmental quality standards [41].
Pearson correlation analysis revealed that the Cu, Mn, Zn, Cr, Ni, Pb, As, and Cd contents in the water were significantly (p < 0.01) and positively correlated (0.794 ≤ r ≤ 0.950) with each other (Table S3 in Supplementary Materials), which indicated that these heavy metals/metalloids have the same pollution sources. Overall, anthropogenic activities along Xijiang River have seriously impacted the heavy metal levels in the river water.

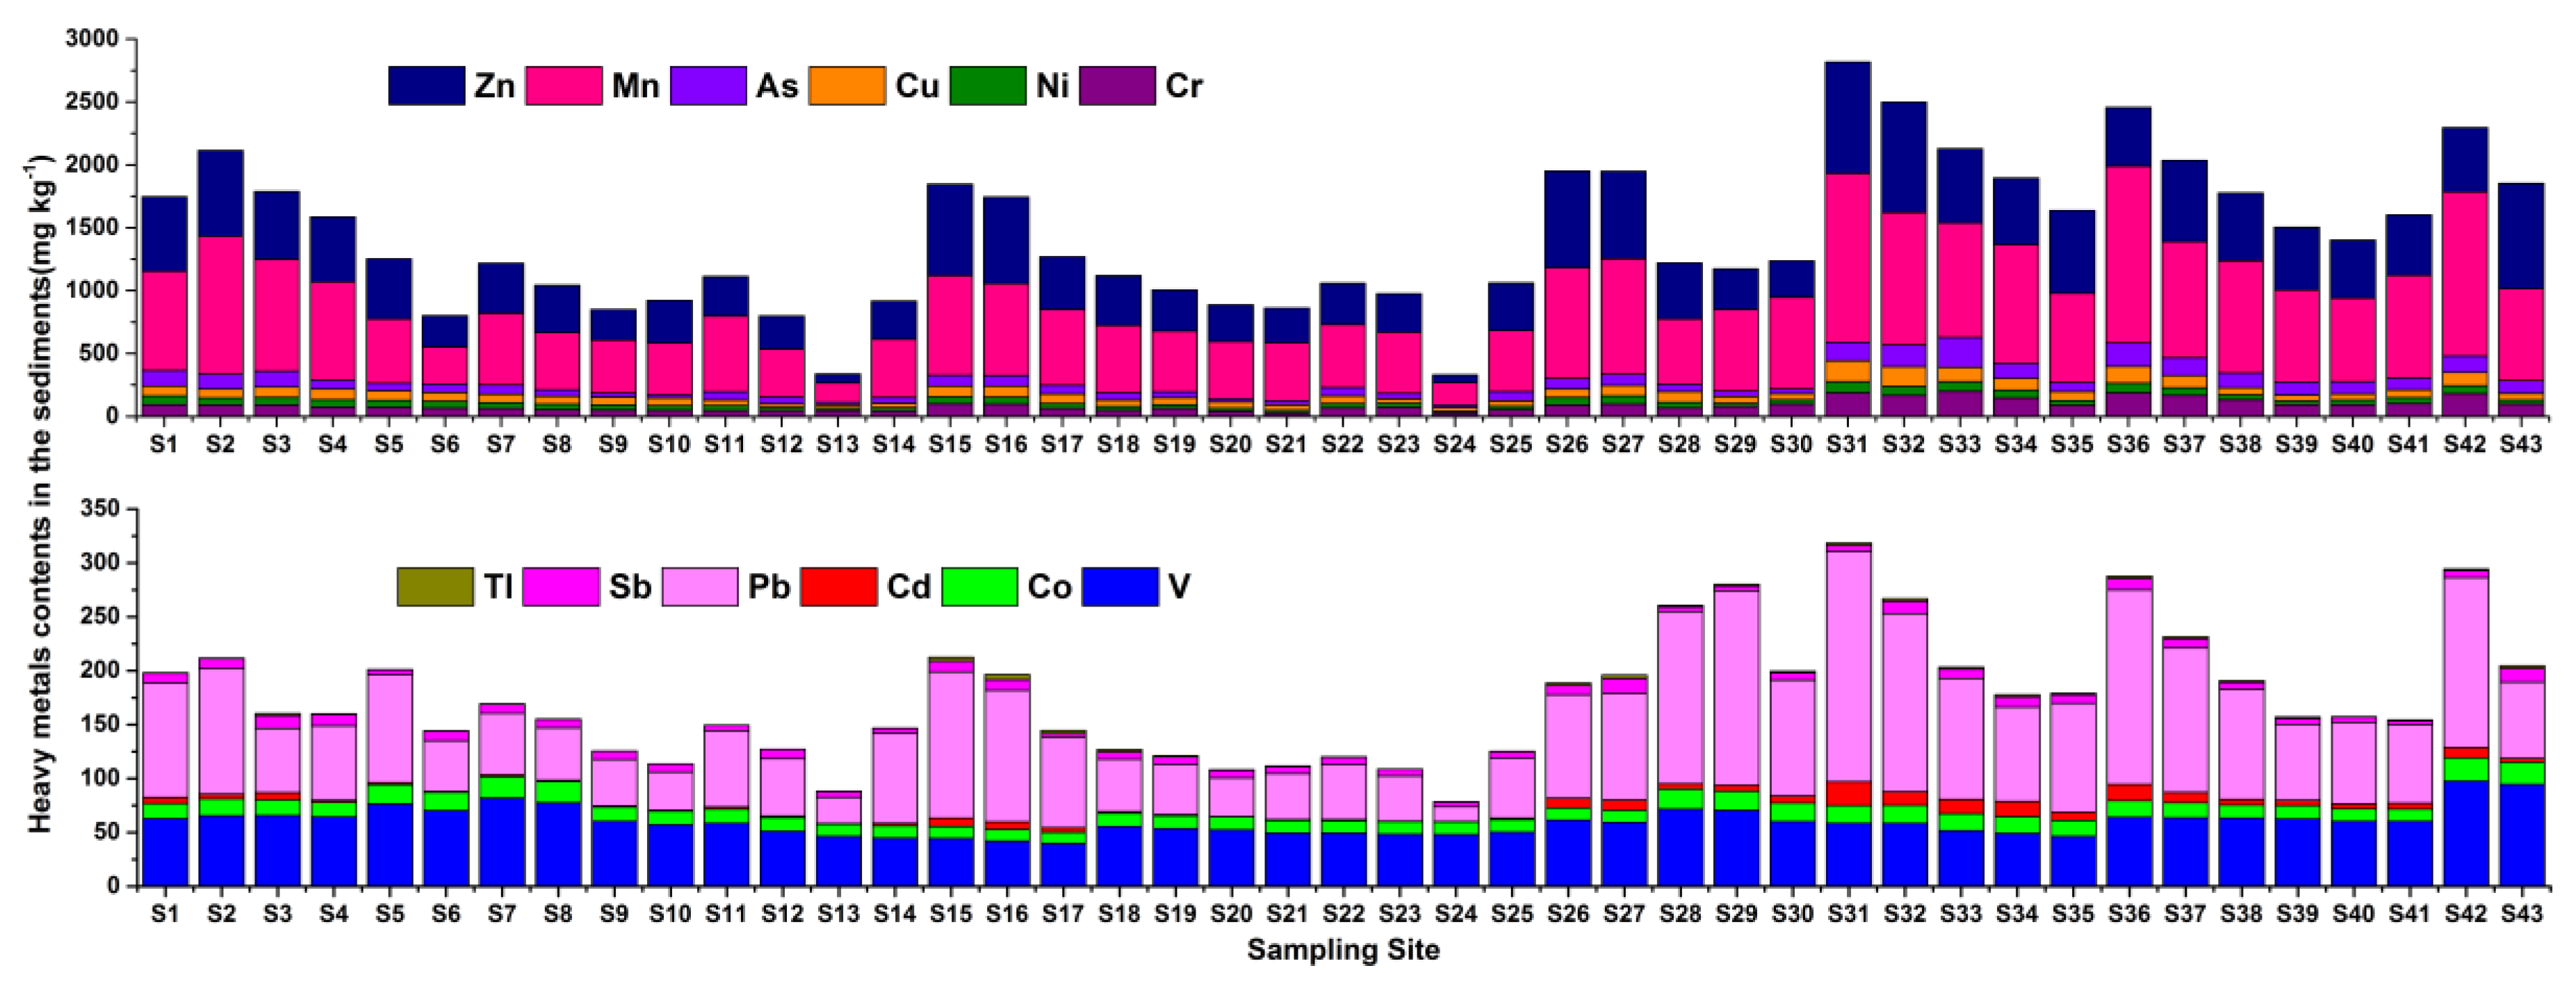
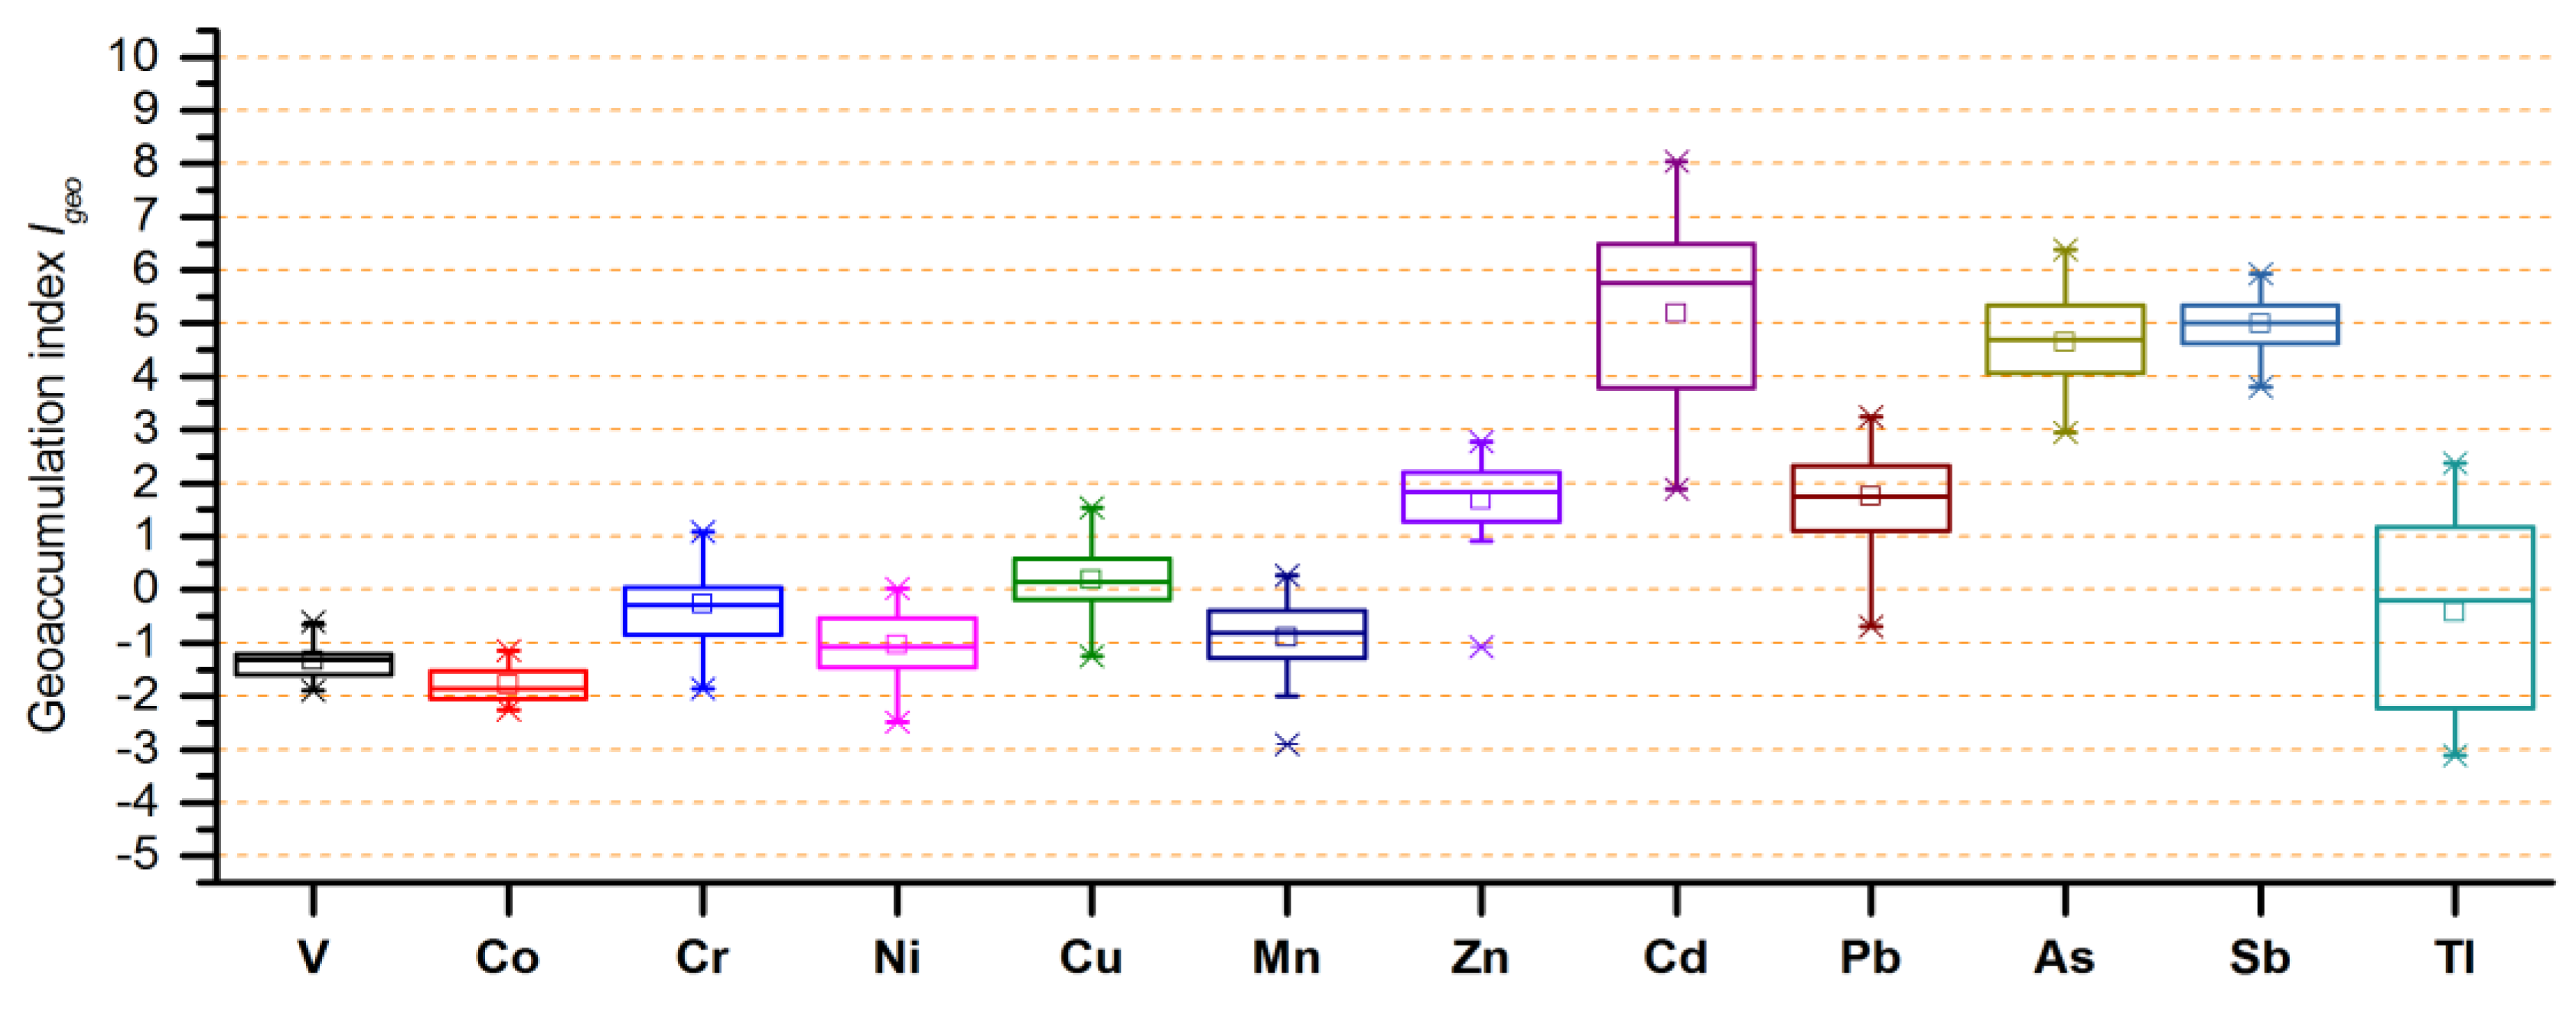
3.2. Heavy Metals/Metalloids in the Sediments

The average contents of the target metals/metalloids in the Xijiang River sediments followed the sequence: Mn > Zn > Cr > Pb > As > Cu > V > Ni > Co > Sb > Cd > Tl (Table 1 and Figure 3). Compared with the background values [40] of those in the sediments of Pearl River (Table S4 in Supplementary Materials), the contents of Ni, Cu, Tl, Pb, As, Sb, and Zn in the Xijiang River sediments were much higher, especially the content of Cd was more than 56 times higher, which indicated that these metals/metalloids pollution might be caused by human activities. The contents of V and Co were slightly lower than those of the background values, which suggested these metals perhaps came from earth crust. In contrast, the mean levels of heavy metals in the Xijiang River were lower than those in the Beijiang River [42,52,53,54] except for Cr, Zn, Ni and Co. This is consistent with a prior study that Beijiang River is the most polluted river by heavy metals among the main tributaries of the Pearl River [43]. However, the mean contents of Cr, Ni, Cu, Pb, Cd, Zn, and As in the Xijiang River sediments exceeded those in the Yangtze River [55], and were much higher than those in the Jinjiang River [45]. Moreover, the mean levels of heavy metals in the Xijiang River sediments were higher than those in the Hejiang River, except for V, Mn, and Sb [56].
As was the case for the river water, the metals/metalloids contents in the sediments of the lower reaches (S26–S43) were 1.1 to 3.9 times higher than in the upper reaches (S1–S25). This is because hundreds of factories involving heavy metals processing were located in the lower reaches (S26–S43), for example, the sampling sites S31 were located at urban areas of Foshan, which have a large number of building ceramic production factories (Zn, Pb, Cu, and Cr) and metal surface treating factories (Mn, Zn, Pb, Ni, and Cd), and these factories have directly or indirectly discharged large quantities of metals-bearing sewage into the river over the past decades. A large fraction of the metals accumulated in the sediments through adsorption, chelation, and sedimentation processes. Although, the local government has taken some measures to reduce the exogenous input of heavy metals, such as controlling the sewage discharge and shutting down some of the main polluters, the heavy metals pollution in the sediments of the Xijiang River is still very serious.
The correlation analysis revealed the contents of Cu, Mn, Zn, Cr, Ni, Pb, As, and Cd in the sediments were significantly (p < 0.01) correlated (0.602 ≤ r ≤ 0.904) with each other (Table S5 in Supplementary Materials). Meanwhile, a significant correlation between V and Co (r = 0.824, p < 0.01) was determined, which indicated that these two heavy metals may share common sources.

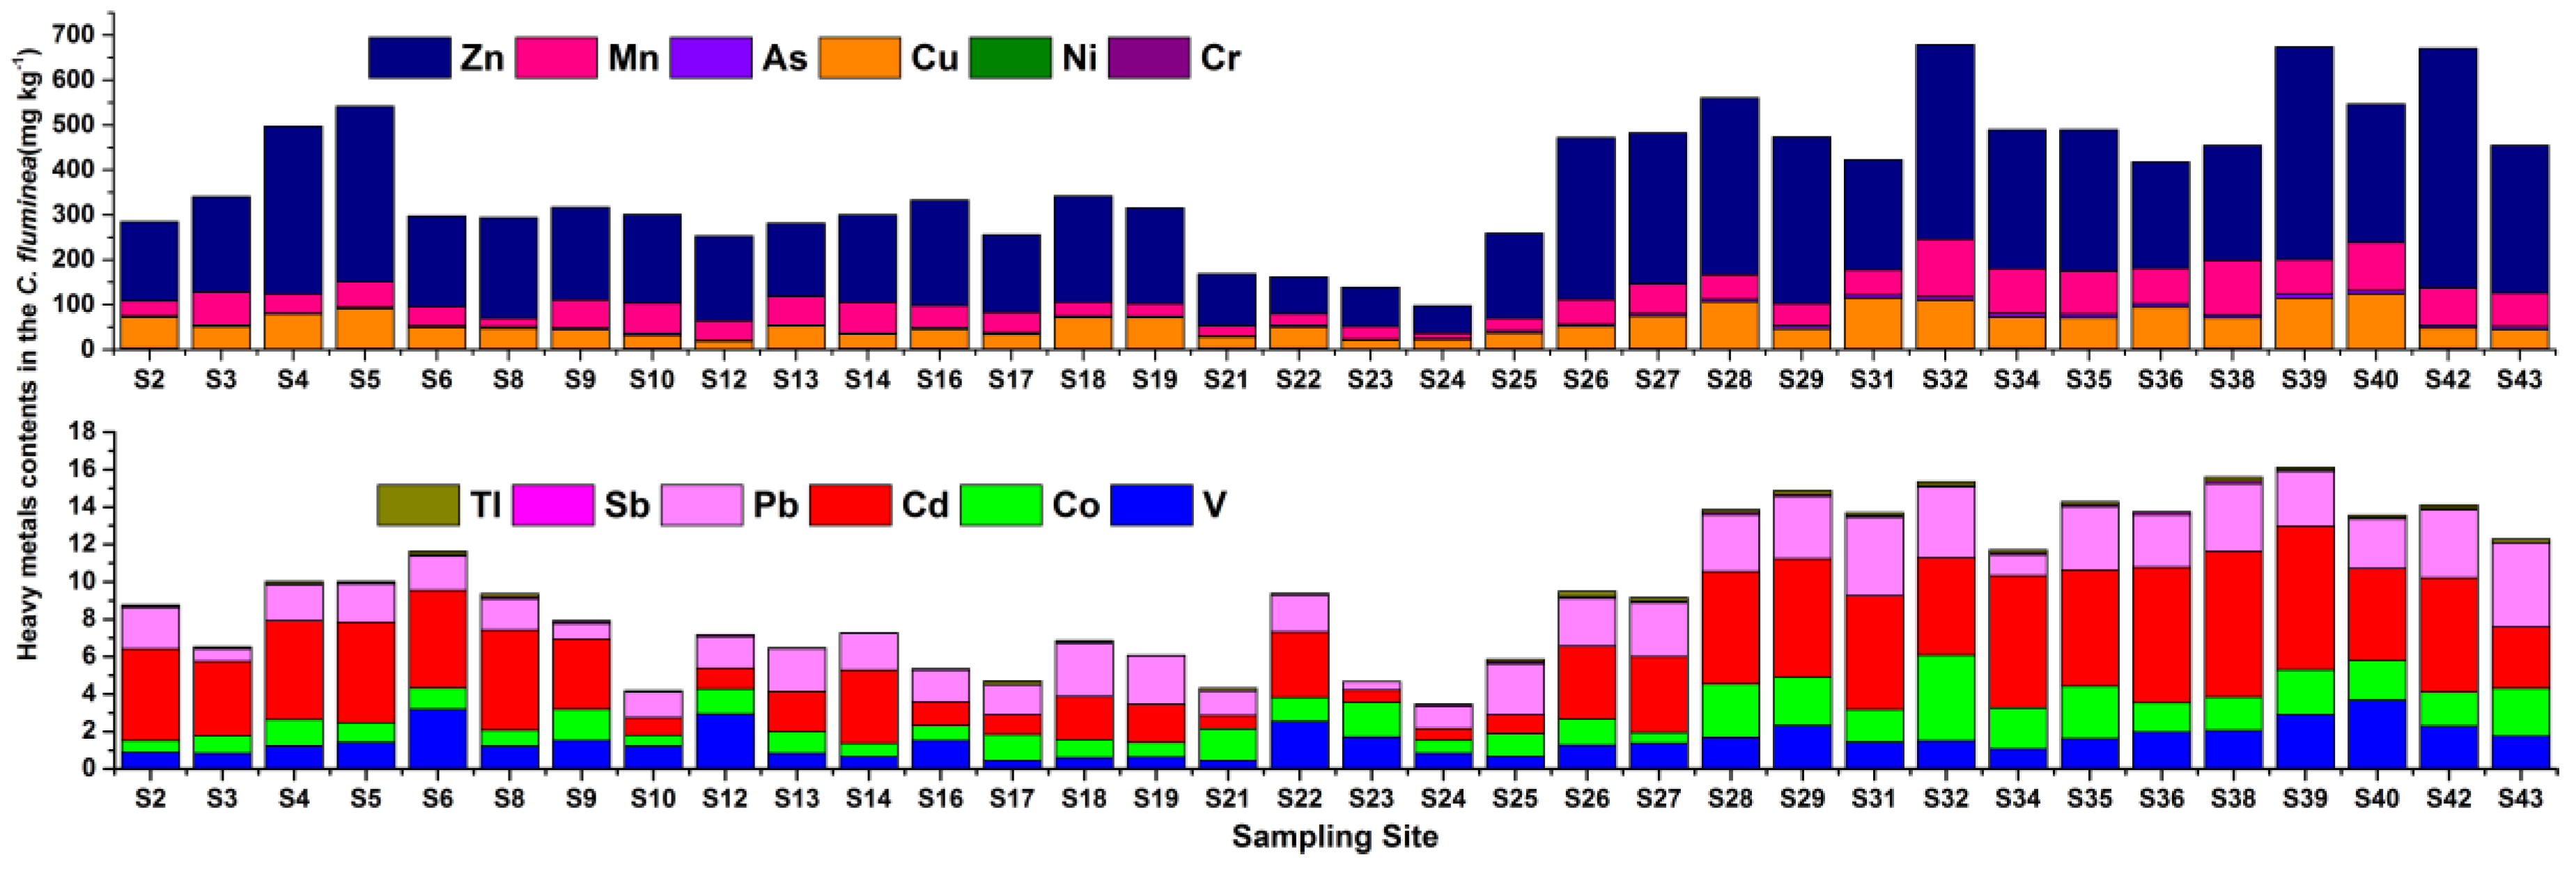
3.3. Heavy Metals/Metalloids in C. fluminea

Table 1 and Figure 4 give the levels of the heavy metals/metalloids in the C. fluminea soft tissue. The abundance of these metals/metalloids followed the order: Zn > Cu > Mn > As > Cd > Pb > Co > V > Ni > Cr > Tl > Sb. When compared to the Category I food quality standards of aquatic products by the China Food and Drug Administration, the average contents of Cr, As, and Cu in the C. fluminea soft tissue were lower than the maximum allowable limits (0.5, 1.0, and 10 mg kg−1 w.w., respectively) [57] (note: a conversion factor of 8 was used from wet weight to dry weight [58]). However, the Cu content in the C. fluminea soft tissue from 20% of sampling sites exceeded the maximum allowable limit. Furthermore, the average contents of Zn, Cd, and Pb were about one to two times higher than the limits (20, 0.2, and 0.1 mg kg−1 w.w., respectively), and Zn, Cd, and Pb at 88.2%, 76.5%, and 94.1% of the sampling sites exceeded the limits.
The average contents of As, Ni, Cu, Sb, Mn, Co, and Zn in C. fluminea from the Xijiang River were higher than that observed in the Odiel River (4.30, 0.99, 44.03, 4.30, 30.77, 0.80, and 128.67 mg kg−1 d.w.) of Spain [59], especially the content of Cd was more than five times higher (0.64 mg kg−1 d.w.), with the exception of Pb, for which the average concentration was slightly lower (2.98 mg kg−1 d.w.). When compared with Altamaha River of USA [60], the soft tissue concentrations of Mn, Cd, Zn, and Pb in C. fluminea from the Xijiang River were much higher (51.8, 2.57, 131, and 0.57 mg kg−1 d.w.); however, the As, Cu, and Ni were lower than those of the Altamaha River (4.74, 70.0, and 3.88 mg kg−1 d.w.).
Like in the river water or sediment, the concentrations of heavy metals/metalloids in the C. fluminea soft tissue from the lower reaches (S26–S43) were about 1.14 to 2.48 times higher than those from the upper reaches (S1–S25). This is in accord with the higher concentrations of the metals/metalloids in the water and sediments in the lower reaches (S26–S43), confirming that the contaminant partitioning in C. fluminea is associated with the concentrations in the surrounding water and sediments [61]. The content of Mn (1053 mg kg−1) in the sediment of sampling sites S32 was not the highest, but the content of Mn (128.7 mg kg−1) in C. fluminea soft tissue of this sampling site was the highest. This is because the environmental mobility and availability of heavy metals are not only related to the total amount of heavy metals, but, more importantly, they often depend on their chemical forms. Therefore, the contents in the biota may reflect partial bioavailability of the contaminants. Moreover, care needs to be taken, because difference biological species may filter out or resist different metals/metalloids to different extents [62,63].
Significant (p < 0.01) correlations were found between Mn and Co (r = 0.581), Zn and Cu (r = 0.574), Cd and Cu (r = 0.678), Pb and Zn (r = 0.588), and As and Cd (r = 0.713) in the C. fluminea soft tissue (Table S6 in Supplementary Materials), suggesting that these pairs of metals have similar bioaccumulation, common pollution source, and dispersion properties [64].

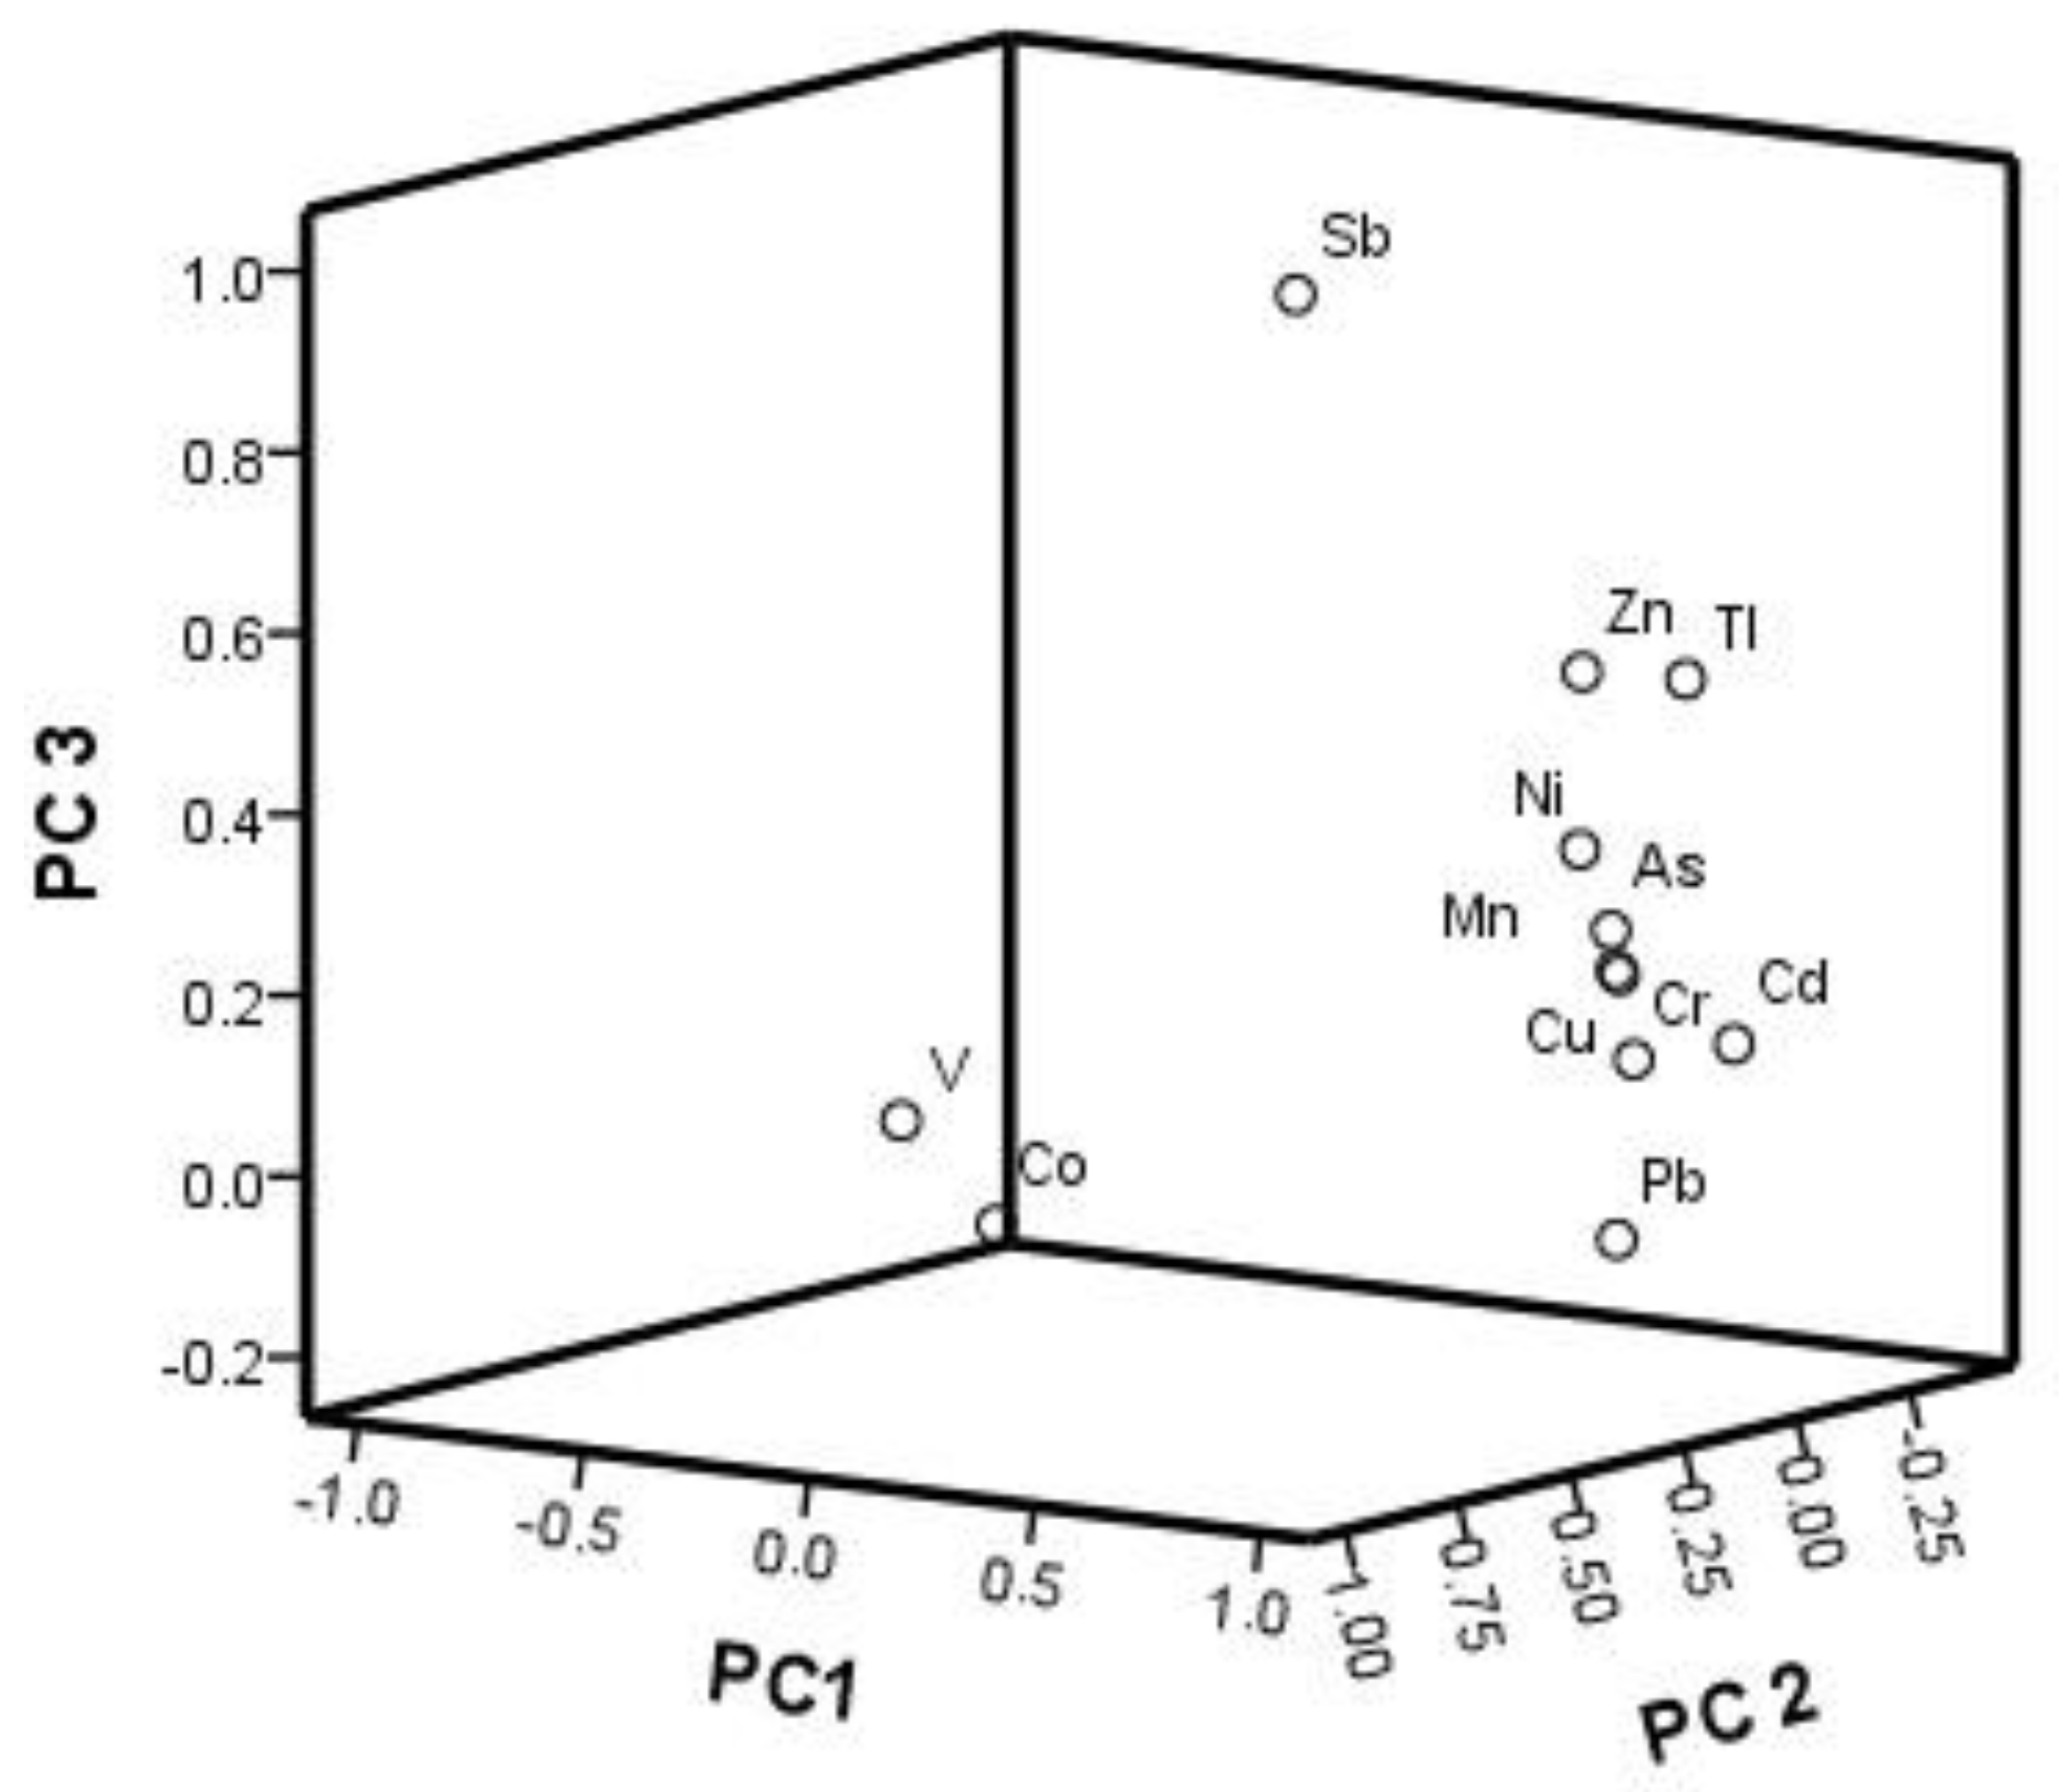
3.4. Correlation Analysis and Source Apportionment

The contents for most of the metals/metalloids in the river water were significantly (p < 0.01) correlated (0.566 ≤ r ≤ 0.830) with those in the sediments, regardless of the site locations (Table S7 in Supplementary Materials), which reflects a dynamic local quasi-equilibrium distribution between the two phases [65]. No significant correlations were observed between the metal contents measured in the C. fluminea soft tissue and those that were measured in water, which was consistent with a previous study [65]. In contrast, the concentrations of Cu (r = 0.557), Mn (r = 0.484), Zn (r = 0.532), Cd (r = 0.543), Pb (r = 0.615), and As (r = 0.599) in the C. fluminea soft tissue showed significant (p < 0.01) correlations with the concentrations in the sediments, which again agrees with those by Angelo et al. [65], who observed that the contents of Cd, Pb, and Zn in sediment samples were correlated with those in C. fluminea and mussels soft tissues. This is reasonable, because the contact time between C. fluminea and the flowing river water is much shorter that that between the biota and the sediments. The partitioning was governed by the sediment phase concentrations as a result.
Physical, chemical, and biological factors, such as organism size, fine sediment fraction, acidity, bioavailability, and the contents of dissolved organic matter, can influence the heavy metals bioaccumulation in C. fluminea [60], As such, further study should be conducted to investigate the allocation mechanisms of heavy metals between C. fluminea and environmental matrices.
Table 2 shows the results of the principle component analysis (PCA) for the metals/metalloids in the sediments. According to the Kaiser-Meyer-Olkin (KMO) measure of sampling adequacy, a high KMO value (close to 1.0) indicates that a PCA is very useful with a data set, whereas a value of less than 0.50 indicates the PCA may not be suitable. In this work, the calculated KMO value was 0.800 for the sediments data set, and the significance levels of Bartlett’s test of sphericity was 0, which confirms the suitability of the data set for PCA.
Three principal components of the metals/metalloids in the sediments had eigenvalues greater than 1, with a total variance of 83.310%. The PC1 accounted for 51.98% of the total variance and it had strong positive loadings on Cr, Ni, Cu, Mn, Zn, Cd, Pb, As, and Tl (Figure 5). The PC2 consisting of V and Co represented 16.61% of the total variance, and the PC3 consisting of Zn, Sb, and Tl made up 14.72% of the total variance.
In general, wastewater and sludge from cadmium-nickel and lead acid battery manufacturing plants usually contains Cd, Zn, Pb, Cr, Cu, Ni, As, and Mn [66], whereas Cu is the primary metal for printed circuit boards [67]. Wastewater residue and sludge from electroplating and metal surface treatment industries usually contain Cr, Zn, Cu, Ni, Mn, Pb, and Cd [68], whereas the effluents from leather tanning and dyeing industries usually contain Cr and As [69]. Moreover, the glazes, co-solvents, and colorants that are used in building and sanitary ceramic products often contain Cd, Pb, Cr, Zn, Cu, Ni, and Co [70,71], and the effluents of sulfuric acid plants sometimes contains thallium [72].
As all these relevant industries had been actively operating in the study area, the PC1 (Cr, Ni, Cu, Mn, Zn, Cd, Pb, As, and Tl) group seemed to be related to the discharge of industrial wastewater, such as battery manufacturing, electroplating and metal surface treatment, leather tanning and dyeing, ceramic production, and sulfuric acid manufacture. The PC2 (V and Co) seemed to be related to the earth’s crust for their lower contents when compared with the background value. The PC3 (Zn, Sb, and Tl) can be attributed to the Zn, Sb, and Tl mining activities, which is attributed to the active mining in the upper reaches of Xijiang River [56].

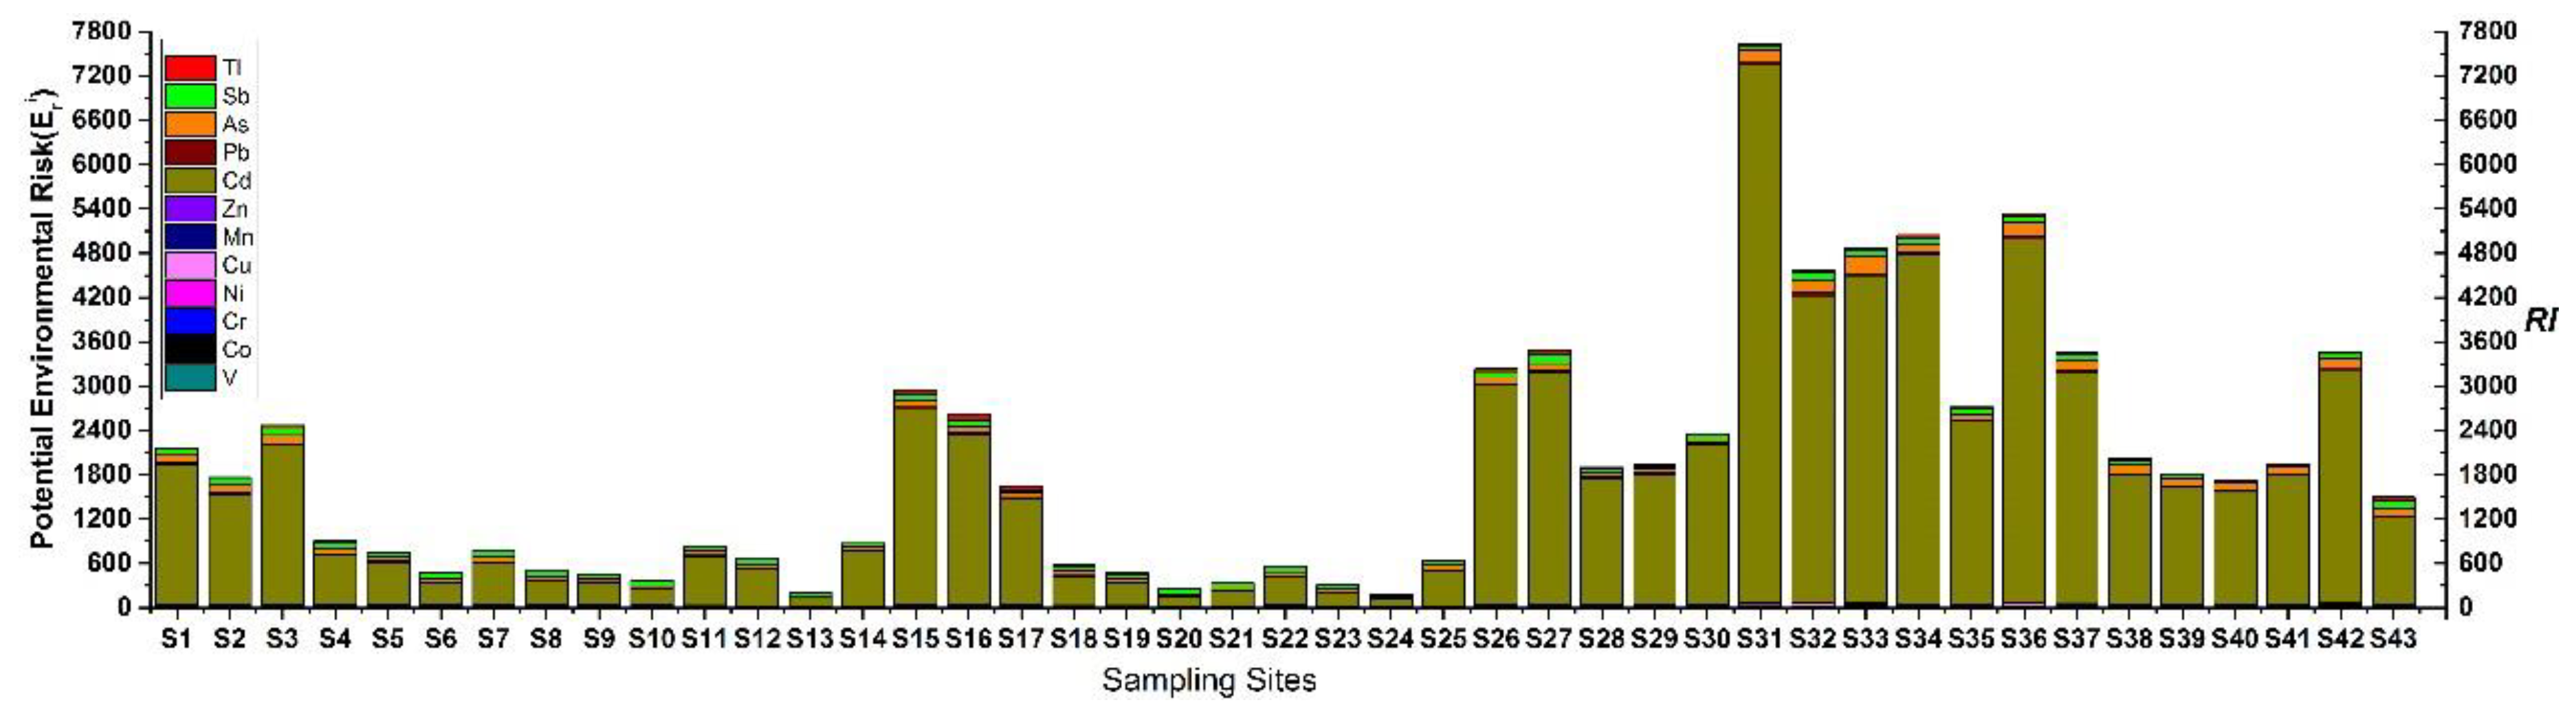
3.5. Potential Ecological Risk Assessment

Table S8 in Supplementary Materials lists the calculated values of BAF and BSF for the heavy metals/metalloids in the C. fluminea soft tissue. The BAF values showed the following sequence: Cd > Cu > Zn > Tl > Co > Mn > As > V > Pb > Sb > Cr > Ni. However, the BSF values followed a different sequence: Cu > Cd > Zn > Co > Tl > Mn > As > Pb > Ni > V > Cr > Sb. The BAF values of all heavy metals/metalloids were significantly larger than 100, which indicated that these metals/metalloids are bioaccumulative in the C. fluminea soft tissue. The BAF and BSF values of Cu, Cd, and Zn were much higher than those of other metals, suggesting that Cu, Cd, and Zn were much more prone to an accumulation by C. fluminea. The result is consistent with the previous studies on bioaccumulation of Cu, Cd, and Zn by C. fluminea [73,74]. It is remarkable that the BAF value of Tl was relatively high, which was probably because Tl+ has a similar radius as K+ (1.49 Å for Tl+ and 1.33 Å for K+) and Tl+ can easily substitute for K+ in the biochemical processes [75].
Figure S1 gives the geo-accumulation index (Igeo) of Cr, Cu, Zn, Cd, Pb, As, Sb, and Tl, and Figure 6 gives the Igeo values for all of the studied metals at all sampling sites. For nearly all of the sites, the Igeo values for V, Co, Ni, and Mn were ≤0, which suggested that the sites were not polluted by these metals. Likewise, Cr was not a pollutant at sampling sites S1–S29, S35, and S39, and only showed slight pollution at other sites. Cu showed moderate pollution at sampling sites S31, S32, and S36, and no pollution or slight pollution at other sampling sites. Tl showed moderate to strong pollution at site S16, and moderate pollution at 11 sampling sites. Notably, Zn and Pb showed moderate to strong pollution at almost all sites of the lower reaches (S26–S43), As and Sb showed strong or extreme pollution in all sampling sites, and Cd showed extreme pollution in all sites of the lower reaches.
The potential ecological risk was assessed by on the Er and RI values. Figure 7 presents the calculated Er and RI values for the target metals/metalloids in the sediments. Cd, As, and Sb are among the most risky contaminants, where Cd poses high to very high risk at 93% of the sampling sites, As poses moderate to high risk at 83.7% of the sites, and Sb poses moderate to considerable risk at 88.4% of the sites.
Moreover, based on the RI values, the lower reaches (S26–S43) and most sites at the upper reaches were under very high ecological risk (RI > 600), whereas some of the sites in the upper reaches showed moderate to considerable ecological risk (moderate for S13, S20, and S24; Considerable for S6, S8–S10, S18–S19, and S21–S23).

4. Conclusions

Concentrations of V, Co, Cr, Ni, Cu, Mn, Zn, Cd, Pb, As, Sb, and Tl were determined in the water, sediments, and C. fluminea from Xijiang River. For the river water, only Tl from two sampling sites exceeded the Chinese national surface water environmental quality standards, despite the heavy industrial impacts on the aquatic system, which suggests the rapid mass transfer of the metals/metalloids from water into the sediment phase and, is, to a certain extent, attributed to the recent government’s efforts in limiting the industrial discharge. However, concentrations of Ni, Cu, Tl, Pb, As, Sb, Zn, and Cd in the sediments were much higher than the background values, which indicated the severe impacts of the industrial activities and the strong sink effect of the sediments. The average contents of Zn, Cd, and Pb in the C. fluminea soft tissue were about one to two times higher than the maximum allowable limits of the Category I food quality standards of aquatic products, and Cu, Zn, Cd, and Pb at 20%, 88.2%, 76.5%, and 94.1% of the sampling sites exceeded the limits. The concentrations of Cu, Mn, Zn, Cd, Pb, and As in the C. fluminea showed significant correlations with the concentrations in the sediments and significant correlations were found between Mn and Co, Zn and Cu, Cd and Cu, Pb and Zn, and As and Cd in the C. fluminea, suggesting that these pairs of metals have a common pollution source (The component score coefficient matrix and scores of principal factors on samples were listed in Tables S9 and S10 in the Supplementary Materials.). Based on the accumulation factor analysis, Cu, Cd, and Zn were the most prone to bioaccumulation by C. fluminea. Based on the geo-accumulation index and potential ecological risk index analyses, all of the sites of the lower reaches and 88% sites at the upper reaches of Xijiang River were severely polluted and confronted with very high ecological risk. In particular, Cd, As, Sb, Zn, and Pb in the sediments posed the most serious threat to the aquatic ecosystem.
Based on information from this work, immediate remediation actions should be taken toward these key toxic metals/metalloids in the sediments to mitigate the associated ecological risk.

Supplementary Materials

The following are available online at https://0-www-mdpi-com.brum.beds.ac.uk/1660-4601/16/10/1823/s1, Figure S1: Box plots of geo-accumulation index of 8 metals/metalloids in the sediments from Xijiang River, Table S1: Longitudinal and latitudinal positions of the sampling sites, Table S2: Metals/metalloids concentrations in water from open publications (μg L−1), Table S3: Correlation analysis among different metals/metalloids in the water samples (n = 43), Table S4: Metals/metalloids concentrations in sediments from open publications (mg kg−1 d. w.), Table S5: Correlation analysis among different metals/metalloids in the sediment samples (n = 43), Table S6: Correlation analysis among different metals/metalloids in the Corbicula fluminea samples (n = 34), Table S7: Correlations between Corbicula fluminea soft tissue and single metal/metalloid in water and sediment (n = 34), Table S8: Geo-accumulation index, potential ecological risk, and average bioconcentration factors (BAF) and biota-sediment accumulation factors (BSF) for metals/metalloids in Corbicula fluminea soft tissue from the Xijiang River, Table S9: Component Score Coefficient Matrix, Table S10: Scores of principal factors on samples.

Author Contributions

All authors make significant contributions to this article. Conceptualization, X.H., D.L., and D.Z.; Methodology, X.H., D.L.,T.X., L.W., and Y.L.; Formal Analysis, X.H. and D.L.; Investigation, X.H.,J.L., N.L., G.L., and L.L.; Resources, L.W., Y.L. and T.X.; Data Curation, X.H., N.L., G.L., L.L and J.L.; Writing—Original Draft Preparation, X.H. and D.L.; Writing—Review & Editing, X.H., D.Z., and D.L.; Supervision, D.L. and D.Z.; Project Administration, D.L. and T.X.; Funding Acquisition, D.L., L.W.,Y.L., N.L., and T.X.

Funding

This work was partially supported by the National Natural Science Foundation of China (No. 41830753; No. 41673138; No. 41301348; No. 41372248; No.41573119; No.21467003; No. U161244), the Natural Science Foundation of Guangxi (2015GXNSFEA139001), and the Guangdong Innovative and Entrepreneurial Research Team Program (No.2016ZT06N569).

Conflicts of Interest

The authors declare no conflict of interest.

References

  1. Zeng, H.; Wu, J. Heavy Metal Pollution of Lakes along the Mid-Lower Reaches of the Yangtze River in China: Intensity, Sources and Spatial Patterns. Int. J. Environ. Res. Public Health 2013, 10, 793–807. [Google Scholar] [CrossRef] [PubMed] [Green Version]
  2. Mingkhwan, R.; Worakhunpiset, S. Heavy Metal Contamination Near Industrial Estate Areas in Phra Nakhon Si Ayutthaya Province, Thailand and Human Health Risk Assessment. Int. J. Environ. Res. Public Health 2018, 15, 1890. [Google Scholar] [CrossRef] [PubMed]
  3. Saleem, M.; Iqbal, J.; Akhter, G.; Shah, M.H. Fractionation, bioavailability, contamination and environmental risk of heavy metals in the sediments from a freshwater reservoir, Pakistan. J. Geochem. Explor. 2018, 184, 199–208. [Google Scholar] [CrossRef]
  4. Vongdala, N.; Hoang-Dung, T.; Tran Dang, X.; Teschke, R.; Tran Dang, K. Heavy Metal Accumulation in Water, Soil, and Plants of Municipal Solid Waste Landfill in Vientiane, Laos. Int. J. Environ. Res. Public Health 2019, 16, 22. [Google Scholar] [CrossRef]
  5. Resongles, E.; Casiot, C.; Freydier, R.; Dezileau, L.; Viers, J.; Elbaz-Poulichet, F. Persisting impact of historical mining activity to metal (Pb, Zn, Cd, Tl, Hg) and metalloid (As, Sb) enrichment in sediments of the Gardon River, Southern France. Sci. Total Environ. 2014, 481, 509–521. [Google Scholar] [CrossRef] [PubMed]
  6. Perner, K.; Leipe, T.; Dellwig, O.; Kuijpers, A.; Mikkelsen, N.; Andersen, T.J.; Harff, J. Contamination of arctic Fjord sediments by Pb-Zn mining at Maarmorilik in central West Greenland. Mar. Pollut. Bull. 2010, 60, 1065–1073. [Google Scholar] [CrossRef] [PubMed]
  7. Ettler, V.; Mihaljevic, M.; Sebek, O.; Molek, M.; Grygar, T.; Zeman, J. Geochemical and Pb isotopic evidence for sources and dispersal of metal contamination in stream sediments from the mining and smelting district of Pribram, Czech Republic. Environ. Pollut. 2006, 142, 409–417. [Google Scholar] [CrossRef]
  8. Zhang, C.; Qiao, Q.; Piper, J.D.A.; Huang, B. Assessment of heavy metal pollution from a Fe-smelting plant in urban river sediments using environmental magnetic and geochemical methods. Environ. Pollut. 2011, 159, 3057–3070. [Google Scholar] [CrossRef] [PubMed]
  9. Matos, M.d.F.; Rispoli Botta, C.M.; Fonseca, A.L. Toxicity Identification Evaluation (Phase I) of water and sediment samples from a tropical reservoir contaminated with industrial and domestic effluents. Environ. Monit. Assess. 2014, 186, 7999–8006. [Google Scholar] [CrossRef] [PubMed]
  10. Houda, B.; Dorra, G.; Chafai, A.; Emna, A.; Khaled, M. Impact of a Mixed “Industrial and Domestic” Wastewater Effluent on the Southern Coastal Sediments of Sfax (Tunisia) in the Mediterranean Sea. Int. J. Environ. Res. 2011, 5, 691–704. [Google Scholar]
  11. Walker, W.J.; McNutt, R.P.; Maslanka, C.K. The potential contribution of urban runoff to surface sediments of the Passaic River: Sources and chemical characteristics. Chemosphere 1999, 38, 363–377. [Google Scholar] [CrossRef]
  12. Jartun, M.; Ottesen, R.T.; Steinnes, E.; Volden, T. Runoff of particle bound pollutants from urban impervious surfaces studied by analysis of sediments from stormwater traps. Sci. Total Environ. 2008, 396, 147–163. [Google Scholar] [CrossRef] [PubMed]
  13. Jara-Marini, M.E.; Tapia-Alcaraz, J.N.; Dumer-Gutierrez, J.A.; Garcia-Rico, L.; Garcia-Hernandez, J.; Paez-Osuna, F. Distribution and accumulation of Cd, Cu, Hg, Pb and Zn in the surface sediments of El Tobari Lagoon, central-East Gulf of California: An ecosystem associated with agriculture and aquaculture activities. J. Environ. Sci. Health Part A Toxic/Hazard. Subst. Environ. Eng. 2013, 48, 1842–1851. [Google Scholar] [CrossRef] [PubMed]
  14. Rimoldi, F.; Peluso, L.; Bulus Rossini, G.; Ronco, A.E.; Demetrio, P.M. Multidisciplinary approach to a study of water and bottom sediment quality of streams associated with mixed land uses: Case study Del Gato Stream, La Plata (Argentina). Ecol. Indic. 2018, 89, 188–198. [Google Scholar] [CrossRef]
  15. Goldberg, E.D.; Hodge, V.F.; Griffin, J.J.; Koide, M.; Edgington, D.N. Impact of fossil fuel combustion on the sediments of Lake Michigan. Environ. Sci. Technol. 1981, 15, 466–471. [Google Scholar] [CrossRef] [PubMed]
  16. Yang, H.; Engstrom, D.R.; Rose, N.L. Recent Changes in Atmospheric Mercury Deposition Recorded in the Sediments of Remote Equatorial Lakes in the Rwenzori Mountains, Uganda. Environ. Sci. Technol. 2010, 44, 6570–6575. [Google Scholar] [CrossRef]
  17. Duodu, G.O.; Goonetilleke, A.; Ayoko, G.A. Potential bioavailability assessment, source apportionment and ecological risk of heavy metals in the sediment of Brisbane River estuary, Australia. Mar. Pollut. Bull. 2017, 117, 523–531. [Google Scholar] [CrossRef]
  18. Alam, M.G.M.; Tanaka, A.; Stagnitti, F.; Allinson, G.; Maekawa, T. Observations on the effects of caged carp culture on water and sediment metal concentrations in Lake Kasumigaura, Japan. Ecotoxicol. Environ. Saf. 2001, 48, 107–115. [Google Scholar] [CrossRef]
  19. Bing, H.; Wu, Y.; Zhou, J.; Sun, H.; Wang, X.; Zhu, H. Spatial variation of heavy metal contamination in the riparian sediments after two-year flow regulation in the Three Gorges Reservoir, China. Sci. Total Environ. 2019, 649, 1004–1016. [Google Scholar] [CrossRef]
  20. Zahra, A.; Hashmi, M.Z.; Malik, R.N.; Ahmed, Z. Enrichment and geo-accumulation of heavy metals and risk assessment of sediments of the Kurang Nallah-Feeding tributary of the Rawal Lake Reservoir, Pakistan. Sci. Total Environ. 2014, 470, 925–933. [Google Scholar] [CrossRef]
  21. Superville, P.-J.; Prygiel, E.; Magnier, A.; Lesven, L.; Gao, Y.; Baeyens, W.; Ouddane, B.; Dumoulin, D.; Billon, G. Daily variations of Zn and Pb concentrations in the Defile River in relation to the resuspension of heavily polluted sediments. Sci. Total Environ. 2014, 470, 600–607. [Google Scholar] [CrossRef]
  22. Inza, B.; Ribeyre, F.; Maury-Brachet, R.; Boudou, A. Tissue distribution of inorganic mercury, methylmercury and cadmium in the Asiatic clam (Corbicula fluminea) in relation to the contamination levels of the water column and sediment. Chemosphere 1997, 35, 2817–2836. [Google Scholar] [CrossRef]
  23. Soucek, D.J.; Schmidt, T.S.; Cherry, D.S. In situ studies with Asian clams (Corbicula fluminea) detect acid mine drainage and nutrient inputs in low-order streams. Can. J. Fish. Aquat. Sci. 2001, 58, 602–608. [Google Scholar] [CrossRef]
  24. Dabney, B.L.; Clements, W.H.; Williamson, J.L.; Ranville, J.F. Influence of Metal Contamination and Sediment Deposition on Benthic Invertebrate Colonization at the North Fork Clear Creek Superfund Site, Colorado, USA. Environ. Sci. Technol. 2018, 52, 7072–7080. [Google Scholar] [CrossRef]
  25. Doherty, F.G. The Asiatic clam, Corbicula spp. as a biological monitor in freshwater environments. Environ. Monit. Assess. 1990, 15, 143–181. [Google Scholar] [CrossRef]
  26. Liu, Y.; Peng, P.A.; Li, X.; Zhang, S.; Ren, M. Polychlorinated dibenzo-p-dioxins and dibenzofurans (PCDD/Fs) in water and suspended particulate matter from the Xijiang River, China. J. Hazard. Mater. 2008, 152, 40–47. [Google Scholar] [CrossRef]
  27. Huang, X.; Li, N.; Wu, Q.; Long, J.; Luo, D.; Huang, X.; Li, D.; Zhao, D. Fractional distribution of thallium in paddy soil and its bioavailability to rice. Ecotoxicol. Environ. Saf. 2018, 148, 311–317. [Google Scholar] [CrossRef]
  28. Liu, J.; Li, S.-L.; Chen, J.-B.; Zhong, J.; Yue, F.-J.; Lang, Y.; Ding, H. Temporal transport of major and trace elements in the upper reaches of the Xijiang River, SW China. Environ. Earth Sci. 2017, 76, 299. [Google Scholar] [CrossRef]
  29. Kaiser, H.F. The Application of Electronic Computers to Factor Analysis. Educ. Psychol. Meas. 1960, 20, 141–151. [Google Scholar] [CrossRef]
  30. Srichandan, S.; Panigrahy, R.C.; Baliarsingh, S.K.; Rao, S.B.; Pati, P.; Sahu, B.K.; Sahu, K.C. Distribution of trace metals in surface seawater and zooplankton of the Bay of Bengal, off Rushikulya estuary, East Coast of India. Mar. Pollut. Bull. 2016, 111, 468–475. [Google Scholar] [CrossRef]
  31. El Nemr, A.; El-Said, G.F.; Ragab, S.; Khaled, A.; El-Sikaily, A. The distribution, contamination and risk assessment of heavy metals in sediment and shellfish from the Red Sea coast, Egypt. Chemosphere 2016, 165, 369–380. [Google Scholar] [CrossRef]
  32. Müller, G. Index of geo-accumulation in sediments of Rhine River. J. Geol. 1979, 2, 108–118. [Google Scholar]
  33. Håkanson, L. An ecological risk index for aquatic pollution control. a sedimentological approach. Water Res. 1980, 14, 975–1001. [Google Scholar] [CrossRef]
  34. Achary, M.S.; Satpathy, K.K.; Panigrahi, S.; Mohanty, A.K.; Padhi, R.K.; Biswas, S.; Prabhu, R.K.; Vijayalakshmi, S.; Panigrahy, R.C. Concentration of heavy metals in the food chain components of the nearshore coastal waters of Kalpakkam, southeast coast of India. Food Control 2017, 72, 232–243. [Google Scholar] [CrossRef]
  35. Ahmed, I.; Mostefa, B.; Bernard, A.; Olivier, R. Levels and ecological risk assessment of heavy metals in surface sediments of fishing grounds along Algerian coast. Mar. Pollut. Bull. 2018, 136, 322–333. [Google Scholar] [CrossRef]
  36. Bi, B.; Liu, X.; Guo, X.; Lu, S. Occurrence and risk assessment of heavy metals in water, sediment, and fish from Dongting Lake, China. Environ. Sci. Pollut. Res. Int. 2018, 25, 34076–34090. [Google Scholar] [CrossRef]
  37. Liu, Y.; Wang, Q.; Zhuang, W.; Yuan, Y.; Yuan, Y.; Jiao, K.; Wang, M.; Chen, Q. Calculation of Thallium’s toxicity coefficient in the evaluation of potential ecological risk index: A case study. Chemosphere 2018, 194, 562–569. [Google Scholar] [CrossRef]
  38. Rodriguez Espinosa, P.F.; Shruti, V.C.; Jonathan, M.P.; Martinez Tavera, E. Metal concentrations and their potential ecological risks in fluvial sediments of Atoyac River basin, Central Mexico: Volcanic and anthropogenic influences. Ecotoxicol. Environ. Saf. 2018, 148, 1020–1033. [Google Scholar] [CrossRef]
  39. Wang, N.; Wang, A.; Kong, L.; He, M. Calculation and application of Sb toxicity coefficient for potential ecological risk assessment. Sci. Total Environ. 2018, 610, 167–174. [Google Scholar] [CrossRef]
  40. Chi, Q.; Yan, M. Handbook of Elemental Abundance for Applied Geochemistry; Geological Publishing House: Beijing, China, 2007. (In Chinese) [Google Scholar]
  41. Ministry of Ecology and Environment of the People’s Republic of China. GB3838-2002 Environmental Quality Standards for Surface Water; Ministry of Ecology and Environment of the People’s Republic of China, Ed.; Environmental Science Press: Beijing, China, 2002. (In Chinese)
  42. Li, R.; Tang, C.; Cao, Y.; Jiang, T.; Chen, J. The distribution and partitioning of trace metals (Pb, Cd, Cu, and Zn) and metalloid (As) in the Beijiang River. Environ. Monit. Assess. 2018, 190, 399. [Google Scholar] [CrossRef]
  43. Song, M.W.; Huang, P.; Li, F.; Zhang, H.; Xie, K.Z.; Wang, X.H.; He, G.X. Water quality of a tributary of the Pearl River, the Beijiang, Southern China: Implications from multivariate statistical analyses. Environ. Monit. Assess. 2011, 172, 589–603. [Google Scholar] [CrossRef]
  44. Zhou, K.; Pan, T.; Dong, Y. Investigation and Analysis on Water Quality of Beijiang River in 2016. City Town Water Supply 2017, 6, 22–25. (In Chinese) [Google Scholar]
  45. Liu, X.; Jiang, J.; Yan, Y.; Dai, Y.; Deng, B.; Ding, S.; Su, S.; Sun, W.; Li, Z.; Gan, Z. Distribution and risk assessment of metals in water, sediments, and wild fish from Jinjiang River in Chengdu, China. Chemosphere 2018, 196, 45–52. [Google Scholar] [CrossRef]
  46. Li, D.; Pi, J.; Zhang, T.; Tan, X.; Fraser, D.J. Evaluating a 5-year metal contamination remediation and the biomonitoring potential of a freshwater gastropod along the Xiangjiang River, China. Environ. Sci. Pollut. Res. 2018, 25, 21127–21137. [Google Scholar] [CrossRef]
  47. Wu, B.; Zhao, D.Y.; Jia, H.Y.; Zhang, Y.; Zhang, X.X.; Cheng, S.P. Preliminary Risk Assessment of Trace Metal Pollution in Surface Water from Yangtze River in Nanjing Section, China. Bull. Environ. Contam. Toxicol. 2009, 82, 405–409. [Google Scholar] [CrossRef]
  48. Wang, S.; Wang, Y.; Zhang, R.; Wang, W.; Xu, D.; Guo, J.; Li, P.; Yu, K. Historical levels of heavy metals reconstructed from sedimentary record in the Hejiang River, located in a typical mining region of Southern China. Sci. Total Environ. 2015, 532, 645–654. [Google Scholar] [CrossRef]
  49. Lan, Y.; Liang, R.; Zhao, X.; Ma, Q.; Xu, Z.; Gou, T.; Wang, L.; Zhou, Q. Impacts of environmental pollution incident of cadmium and thallium and their emergency disposal on ecological risk of Hejiang River. Acta Sci. Circumstantiae 2017, 37, 3602–3612. (In Chinese) [Google Scholar]
  50. Li, X.; Qi, J.; Wang, C.; Chen, Y. Distribution of heavy metals in waters and pollution assessment in thallium contaminated area of Yunfu, Guangdong. Chin. J. Environ. Sci. 2011, 32, 1321–1328. (In Chinese) [Google Scholar]
  51. Zhao, H.; Xia, B.; Qin, J.; Zhang, J. Hydrogeochemical and mineralogical characteristics related to heavy metal attenuation in a stream polluted by acid mine drainage: A case study in Dabaoshan Mine, China. J. Environ. Sci. 2012, 24, 979–989. [Google Scholar] [CrossRef]
  52. Gao, B.; Lu, J.; Zhou, H.-D.; Yin, S.-H.; Hao, H. The distribution, accumulation and potential source of seldom monitored trace elements in sediments of Beijiang River, South China. Water Sci. Technol. 2012, 65, 2118–2124. [Google Scholar] [CrossRef]
  53. Gao, B.; Sun, K.; Ren, M.Z.; Liang, X.R.; Peng, P.A.; Sheng, G.Y.; Fu, J.M. Ecological risk assessment of thallium pollution in the surface sediment of Beijiang River. Ecol. Environ. Sci. 2008, 17, 528–532. (In Chinese) [Google Scholar]
  54. Li, R.; Tang, C.; Li, X.; Jiang, T.; Shi, Y.; Cao, Y. Reconstructing the historical pollution levels and ecological risks over the past sixty years in sediments of the Beijiang River, South China. Sci. Total Environ. 2019, 649, 448–460. [Google Scholar] [CrossRef]
  55. Yang, Z.; Wang, Y.; Shen, Z.; Niu, J.; Tang, Z. Distribution and speciation of heavy metals in sediments from the mainstream, tributaries, and lakes of the Yangtze River catchment of Wuhan, China. J. Hazard. Mater. 2009, 166, 1186–1194. [Google Scholar] [CrossRef] [PubMed]
  56. Ning, Z.; Lan, X.; Huang, Z.; Chen, H.; Liu, Y.; Xiao, T.; Zhao, Y. Spatial distribution characteristics, sources and potential ecological risk of heavy metals in sediments of the Hejiang River. China Environ. Sci. 2017, 37, 3036–3047. (In Chinese) [Google Scholar]
  57. CFDA, GB 18421-2001 Marine Biological Quality; China Food and Drug Administration: Beijing, China, 2001; pp. 1–3. (In Chinese)
  58. Liu, H.; Yang, J. Determination and correlation analysis of six mineral element contents in soft parts of Corbicula fluminea. Food Sci. 2012, 33, 142–145. (In Chinese) [Google Scholar]
  59. Bonnail, E.; Sarmiento, A.M.; Angel DelValls, T. The use of a Weight-of-Evidence approach to address sediment quality in the Odiel River basin (SW, Spain). Ecotoxicol. Environ. Saf. 2016, 133, 243–251. [Google Scholar] [CrossRef] [PubMed]
  60. Shoults Wilson, A.W.; Unrine, J.M.; Rickard, J.; Black, M.C. Comparison of metal concentrations in Corbicula fluminea and elliptio hopetonensis in the Altamaha River system, Georgia, USA. Environ. Toxicol. Chem. 2010, 29, 2026–2033. [Google Scholar]
  61. Hakenkamp, C.C.; Ribblett, S.G.; Palmer, M.A.; Swan, C.M.; Reid, J.W.; Goodison, M.R. The impact of an introduced bivalve (Corbicula fluminea) on the benthos of a sandy stream. Freshw. Biol. 2001, 46, 491–501. [Google Scholar] [CrossRef]
  62. Bonnail, E.; Macias, F.; Osta, V. Ecological improvement assessment of a passive remediation technology for acid mine drainage: Water quality biomonitoring using bivalves. Chemosphere 2019, 219, 695–703. [Google Scholar] [CrossRef] [PubMed]
  63. Peltier, G.L.; Meyer, J.L.; Jagoe, C.H.; Hopkins, W.A. Using trace element concentrations in Corbicula fluminea to identify potential sources of contamination in an urban river. Environ. Pollut. 2008, 154, 283–290. [Google Scholar] [CrossRef]
  64. Rahman, M.S.; Molla, A.H.; Saha, N.; Rahman, A. Study on heavy metals levels and its risk assessment in some edible fishes from Bangshi River, Savar, Dhaka, Bangladesh. Food Chem. 2012, 134, 1847–1854. [Google Scholar] [CrossRef] [PubMed]
  65. Angelo, R.T.; Cringan, M.S.; Chamberlain, D.L.; Stahl, A.J.; Haslouer, S.G.; Goodrich, C.A. Residual effects of lead and zinc mining on freshwater mussels in the Spring River Basin (Kansas, Missouri, and Oklahoma, USA). Sci. Total Environ. 2007, 384, 467–496. [Google Scholar] [CrossRef]
  66. Ribeiro, C.; Scheufele, F.B.; Espinoza-Quinones, F.R.; Modenes, A.N.; Adeodato Vieira, M.G.; Kroumov, A.D.; Borba, C.E. A comprehensive evaluation of heavy metals removal from battery industry wastewaters by applying bio-residue, mineral and commercial adsorbent materials. J. Mater. Sci. 2018, 53, 7976–7995. [Google Scholar] [CrossRef]
  67. Sharma, N.; Chauhan, G.; Kumar, A.; Sharma, S.K. Statistical Optimization of Heavy Metal (Cu2+ and Co2+) Extraction from Printed Circuit Boards and Mobile Batteries Using Chelation Technology. Ind. Eng. Chem. Res. 2017, 56, 6805–6819. [Google Scholar] [CrossRef]
  68. Venkateswaran, P.; Vellaichamy, S.; Palanivelu, K. Speciation of heavy metals in electroplating industry sludge and wastewater residue using inductively coupled plasma. Int. J. Environ. Sci. Technol. 2007, 4, 497–504. [Google Scholar] [CrossRef] [Green Version]
  69. Dixit, S.; Yadav, A.; Dwivedi, P.D.; Das, M. Toxic hazards of leather industry and technologies to combat threat: A review. J. Clean. Prod. 2015, 87, 39–49. [Google Scholar] [CrossRef]
  70. Lin, L.Q.; Cong, L.; Yun, W.H.; Yang, J.; Ming, H.; Wan, Z.B.; Kai, C.; Lei, H. Association of soil cadmium contamination with ceramic industry: A case study in a Chinese town. Sci. Total Environ. 2015, 514, 26–32. [Google Scholar]
  71. Elias, S.H.; Mohamed, M.; Nor-Anuar, A.; Muda, K.; Hassan, M.A.H.M.; Othman, M.N.; Chelliapan, S. Water Hyacinth Bioremediation for Ceramic Industry Wastewater Treatment-Application of Rhizofiltration System. Sains Malays. 2014, 43, 1397–1403. [Google Scholar]
  72. Wang, C.; Chen, Y.; Liu, J.; Wang, J.; Li, X.; Zhang, Y.; Liu, Y. Health risks of thallium in contaminated arable soils and food crops irrigated with wastewater from a sulfuric acid plant in western Guangdong province, China. Ecotoxicol. Environ. Saf. 2013, 90, 76–81. [Google Scholar] [CrossRef]
  73. Graney, R.L.; Cherry, D.S.; Cairns, J. Heavy metal indicator potential of the Asiatic clam (Corbicula fluminea) in artificial stream systems. Hydrobiologia 1983, 102, 81–88. [Google Scholar] [CrossRef]
  74. Bonnail, E.; Buruaem, L.M.; Araujo, G.S.; Abessa, D.M.S.; Angel DelValls, T. Multiple Biomarker Responses in Corbicula fluminea Exposed to Copper in Laboratory Toxicity Tests. Arch. Environ. Contam. Toxicol. 2016, 71, 278–285. [Google Scholar] [CrossRef] [PubMed]
  75. Belowitz, R.; O’Donnell, M.J. Ion-selective microelectrode measurements of Tl+ and K+ transport by the gut and associated epithelia in Chironomus riparius. Aquat. Toxicol. 2013, 138, 70–80. [Google Scholar] [CrossRef] [PubMed]
Figure 1. Map of the sampling sites.
Ijerph 16 01823 g001
Figure 2. The contents of various metals/metalloids from different sampling sites of Xijiang River.
Ijerph 16 01823 g002
Figure 3. The concentrations of heavy metals/metalloids in the sediments of Xijiang River.
Ijerph 16 01823 g003
Figure 4. The contents of heavy metals/metalloids in the C. fluminea soft tissue from Xijiang River.
Ijerph 16 01823 g004
Figure 5. Loading plots of principal component analysis for the three rotated components.
Ijerph 16 01823 g005
Figure 6. Geo-accumulation index of the studied metals/metalloids in the sediments from Xijiang River.
Ijerph 16 01823 g006
Figure 7. The potential ecological risk (Eri and risk index (RI)) values calculated for various metals/metalloids in the sediments of Xijiang River.
Ijerph 16 01823 g007
Table 1. Total metal/metalloids contents in water, sediments, and C. fluminea of Xijiang River.
MetalWater
(µg L−1, n = 43)
Sediments
(Dry Weight, mg kg−1, n = 43)
C. fluminea
(Dry Weight, mg kg−1, n = 34)
MeanMinMaxS.DMeanMinMaxS.DMeanMinMaxS.D
V0.600.250.960.1459.839.997.712.51.540.463.690.80
Co0.480.231.330.1614.1410.1221.582.971.560.564.580.83
Cr2.370.296.671.7988.4326.19200.1345.231.030.251.970.46
Ni1.730.444.201.0545.2415.2587.3717.471.160.242.240.52
Cu3.080.458.422.0670.4324.22166.1030.8159.518.1121.928.6
Mn20.93.155.913.8689.5155.91405.0282.958.511.8128.728.5
Zn18.341.1144.3111.29466.061.0884.9195.8259.461.7533.3110.7
Cd0.170.020.440.115.090.3121.834.774.020.627.792.22
Pb1.030.122.730.7587.8214.00213.6646.232.330.454.500.99
As1.720.115.731.6383.3022.09237.046.174.661.149.872.41
Sb0.650.341.270.187.543.1613.732.480.070.000.140.04
Tl0.030.000.110.031.210.114.751.130.110.010.290.07
Table 2. Total variance explained, rotated component matrix and principal component loadings for the sediments samples of Xijiang River.
Initial EigenvalueRotation Sums of Squared Loadings Principal Component
Total% of VarianceCumulative%Total%of VarianceCumulative% PC1PC2PC3
17.15259.59759.5976.23851.98251.982V0.0700.9430.116
21.78814.89874.4941.99316.60568.587Co0.2500.9120.009
31.0588.81683.3101.76714.72383.310Cr0.9140.1650.139
40.6715.58888.897 Ni0.8020.1720.365
50.3743.11692.014 Cu0.8750.1580.229
60.2912.42594.439 Mn0.8780.1690.236
70.2061.71496.153 Zn0.6930.0580.540
80.1701.42197.573 Cd0.947−0.0240.135
90.1251.04498.617 Pb0.8810.169−0.062
100.0740.61399.230 As0.8170.1190.270
110.0560.46399.693 Sb0.1490.1480.936
120.0370.307100.000 Tl0.559−0.3050.479

