Article

Nitrogen along the Hydrological Gradient of Marsh Sediments in a Subtropical Estuary: Pools, Processes, and Fluxes

1
State Key Laboratory for Subtropical Mountain Ecology of the Ministry of Science and Technology and Fujian Province, Fujian Normal University, Fuzhou 350007, China
2
College of Geographical Science, Fujian Normal University, Fuzhou 350007, China
*
Authors to whom correspondence should be addressed.
Int. J. Environ. Res. Public Health 2019, 16(11), 2043; https://0-doi-org.brum.beds.ac.uk/10.3390/ijerph16112043
Submission received: 5 May 2019 / Revised: 6 June 2019 / Accepted: 7 June 2019 / Published: 9 June 2019

Abstract

:
Knowledge on the distribution of nitrogen (N) pools, processes, and fluxes along hydrological gradients provides a comprehensive perspective to understand the underlying causal mechanisms in intertidal flats, and thus improve predictions and climate adaptation strategies. We used a space-for-time substitution method to quantify N pools, processes, and fluxes along a hydrological gradient. Further, we linked N pools and processes and investigated not only surface but also subsurface sediments. Our results showed a gradual decrease in total N (TN) and mineralization rates (PNmin), but an increase in potential rates of nitrification (PNR) and denitrification (PDNR) under an elevated hydrological gradient, except for TN and PNmin in the subsurface sediment, which accumulated on the interaction zone between the high and middle tidal flats. Most sedimentary ammonium N (NH4+) and nitrate N (NO3) concentrations were similar; however, NH4+ accumulated on the subsurface of the middle tidal flat. NO3 fluxes (from −0.54 to −0.35 mmol m−2 h−1) were uptake fluxes in the intertidal flats, but NH4+ fluxes (−2.48–3.54 mmol m−2 h−1) changed from uptake to efflux in the seaward direction. Structural equation modeling of the effects of inundation frequency, underground biomass, total carbon (TC), electrical conductivity (EC), and clay proportion on the N processes revealed that these accounted for 67%, 82%, and 17% of the variance of PDNR, PNmin, and PNR, respectively. Inundation frequency, underground biomass, TC, EC, and PNmin effects on N pools accounted for 53%, 69%, and 98% of the variance of NH4+, NO3, and TN, respectively. This suggests that future sea level rise may decrease N storage due to increase in coupled nitrification–denitrification and decrease in N mineralization, and the NH4+ flux may change from sink to source in intertidal ecosystems.

1. Introduction

Intertidal flats constitute major portions of estuaries and are simultaneously some of the most economically important and vulnerable ecosystems on Earth [1,2]. These intertidal flats have particular characteristics, such as being alternately exposed and submerged owing to the periodic ebb and flood tides [1]. These periodic tides usually form an increasing hydrological gradient from upland areas to the shore along the intertidal flats. It is well established that this spatial distribution of hydrological gradients toward the sea reflects not only an increased inundation potential but also a decrease in plant growth and a series of interrelated biotic and abiotic factors [3,4,5]. Nitrogen (N) is a key limiting nutrient in marine and estuarine environments, although N load and incidence of eutrophication increase in the estuaries [6,7,8,9,10]. A key factor mediating the N cycle in intertidal flats is the water regime due to periodic tidewater fluctuations [1]. Furthermore, changing water regimes and succession affects sediment bulk density (BD), salinity, oxidation–reduction condition, pH, organic carbon, nutrient input, sediment delivery, plant growth, etc. [2,11,12,13,14], which may further affect the N cycle.
Global climate change is predicted to affect the water regimes in intertidal flats as a consequence of the heightened occurrence of drought or flooding events [15,16]. Given the changes in hydrological gradients that occur along elevational gradients, estuarine wetlands provide a natural setting for gaining insights into the N cycle under projected climate change scenarios. For two decades, sediment N cycling along hydrological gradients have raised global concerns, including the N pools and processes, and inorganic N fluxes across the sediment–water interface (Table 1); however, previous results have been unclear. For instance, sediment total N (TN), nitrate N (NO3), rates of nitrification, denitrification, and mineralization increased as inundation increased [1,14,17,18,19,20,21,22,23,24,25]. Nevertheless, no significant spatial variation in NH4+ concentration and denitrification rates [23,26,27], and decreasing mineralization rates, TN, NH4+, and NO3 concentration [28,29,30,31] have also been found along an increasing hydrological gradient. Moreover, NH4+ and NO3 fluxes across the sediment–water interface were uncertain because both efflux and uptake can be found [11,28,32,33]. However, since these studies focused on N pools, processes, or fluxes independently, the N pools and processes in the subsurface sediment and the links among N pools, processes, and fluxes along hydrological gradients remain poorly known.
A conceptual scheme for the fate of N pools, processes, and fluxes along hydrological gradients can provide a comprehensive perspective to understand the underlying causal mechanisms in intertidal flats, and thus improve predictions and climate adaptation strategies. Episodic events, such as floods, storms, or droughts, lead to a high amount of nutrients entering subtropical estuaries [34,35], and contributes substantially to severe eutrophication [7]. To better understand the mechanisms that control the fate of N in subtropical estuarine wetlands experiencing climate change, we used a space-for-time substitution method to predict the effects of the alternative scenarios of drought or sea level rise in the Min River estuary. To the best of our knowledge, this is the first study to investigate the links and among N pools, processes, and fluxes along hydrological gradients.
Min River estuary located in the subtropical zone is a typical subtropical estuarine habitat. Periodic hydrological dynamics are characteristic in this estuarine wetland due to the tide–surge interaction intensified by the Taiwan Strait [36]. Simultaneously, this wetland receives high levels of N input because of tidal action and human activities [37]. The present study aimed to (1) investigate the spatial distribution of N pools (TN, NH4+, and NO3), processes (nitrification, denitrification, and mineralization) and the sediment–water interface inorganic N fluxes along a hydrologic gradient; (2) understand the mechanisms underlying N pools’ establishment, transformation, fluxes, and environmental parameters; and (3) propose a conceptual scheme for the fate of N pools, processes, and fluxes along hydrological gradients and predict the implications of long-term N storage in estuarine coastal wetlands under conditions of drought or sea level rise conditions.

2. Materials and Methods
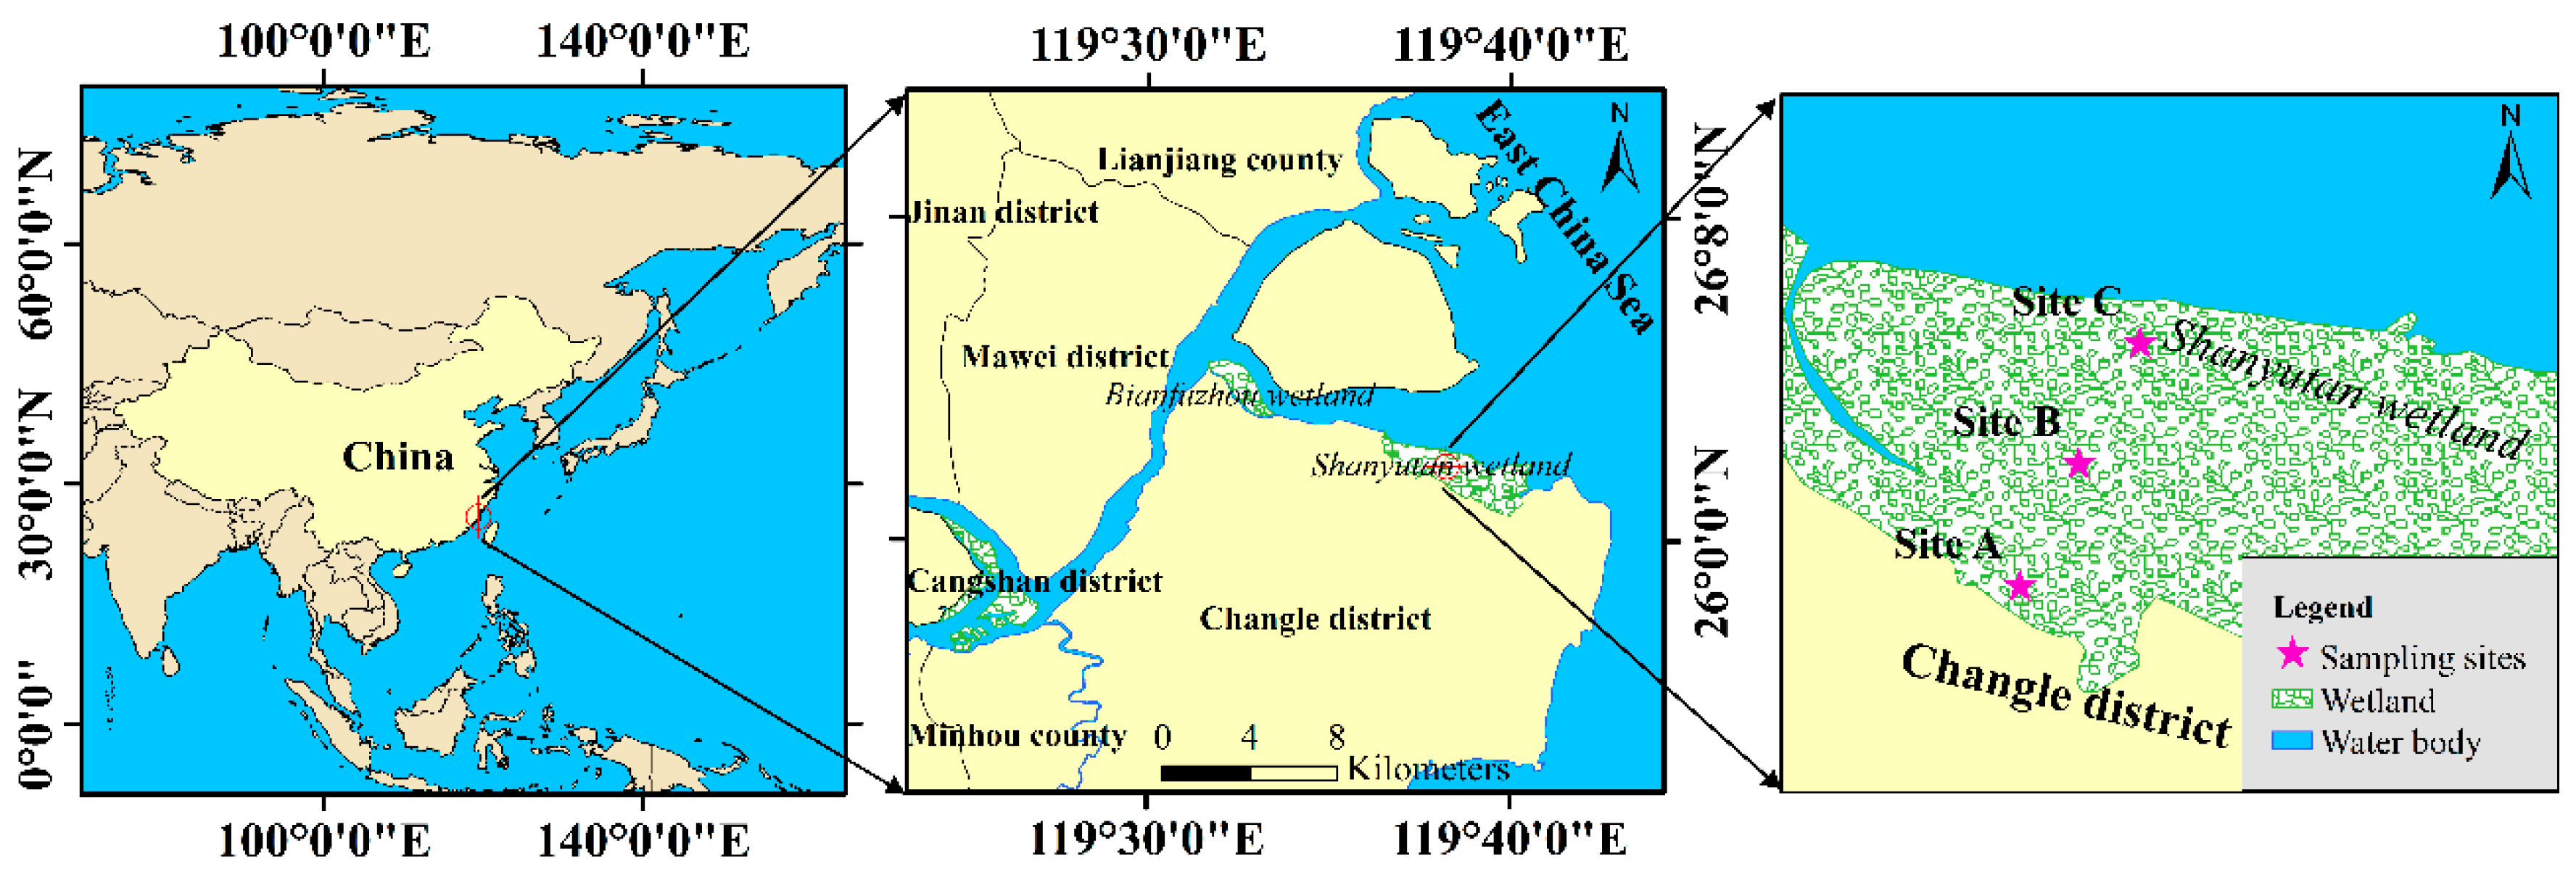
2.1. Study Site

The present study was conducted on the Shanyutan tidal marsh of the Min River estuary National Nature Reserve, China (26°0′36″~26°3′42″ N, 119°34′12″~119°40′40″ E) (Figure 1), covering an area of 4.42 km2. It represents a typical estuarine habitat of the East China Sea [5]. It is dominated by an East Asian monsoon climate (annual mean temperature: 19.7 °C; annual mean precipitation: 1200–1740 mm) [39]. Cyperus malaccensis Lam. var. brevifolius Bocklr., Phragmites australis (Cav.) Trin. ex Steud., and Spartina alterniflora Lois. are the dominant species of vegetation.
The sampling sites were located at an intertidal flat of Shanyutan tidal marsh, which has a typical hydrological gradient. Three sites, located at 120 m intervals, were sampled: a high tidal flat (site A), an interaction zone between high and middle tidal flats (site B), and a middle tidal flat (site C) (Figure 1). The total inundation periods of sites A, B, and C were approximately 4.15%, 12.06%, and 37.11% of a year, respectively. These sampling sites were all colonized by C. malaccensis. More detailed information about the study area can be found in Luo et al. [5] and Zhang et al. [3].

2.2. Sampling and Analysis

Sediment samples were collected in August 2013, from sites A, B, and C, during the ebb tide (Figure 1). At each site, three sediment cores (three replicates) were collected using a steel adobe (10 cm diameter; 50 cm depth) and then sectioned into 10 cm samples. All samples were carefully placed in sealed plastic bags, stored in a portable cooler, and transported to the laboratory for analysis. Simultaneously, for later determination of the dissolved inorganic N flux, sediment cores 0–15 cm from the surface were collected from all sites by opaque PVC tubes (30 cm height; 7 cm internal diameter). In a preliminary survey conducted in May 2013, we observed that tidal TN, NH4+, and NO3 were relatively consistent along the creek in the study area; thus, we collected 25 L tidewater from the creek in the same sites for later slurry incubations and sediment–water interface inorganic N flux assay. All samples were transported to the laboratory within 1 h 30 min. The aboveground and underground biomasses were surveyed, and their biomasses were reported on a dry weight mass basis (g dry weight m−2).
In the laboratory, the sediment BD was determined using the syringe technique after oven-drying sediment samples at 105 °C until constant weight [39]. Sediment pH was measured with a pH meter (IQScientific Instruments, USA) and electrical conductivity (EC) was measured with a 2265FS EC meter (Spectrum Technologies Inc., USA) using a soil:water ratio of 1:5 [40]. Grain size fractions were determined using laser diffraction (Mastersizer 2000, Malvern Instruments, UK), reported on a volume basis using the Malvern software (version 5.6), and classified as clay (<4 μm), silt (4–63 μm), or sand (63–125 μm) according to the Wentworth scale [41]. Sediment TN and total carbon (TC) were determined using a Vario EL Elemental Analyzer (Elementar, Germany). Sediment NH4+ and NO3 were extracted from 5 g of air-dried sediment with 2 M KCl solution at a liquid:soil ratio of 5:1 [42], and then determined using a flow injection analyzer (Skalar Analytical SAN++, Lachat, The Netherlands). All TC, TN, NH4+, and NO3 values are reported on a dry weight mass basis.

2.3. Slurry Incubations

Potential rates of nitrification (PNR)—Assays were performed in duplicate using 10 g of homogenized fresh sediment placed into 250 mL glass incubation bottles, to which 20 mL of in situ tidewater with or without the nitrification inhibitor allylthiourea (10 mg L–1) was added. All samples were incubated in the dark for 6 h at the in situ temperature, with stirring (120 rpm). Following incubation, 10 mL of the overlying water was collected for later analysis of ammonia [43]. The NH4+ and NO3 concentrations in the extracted water samples were determined by flow injection analysis.
Potential rates of denitrification (PDNR)—Assays were performed in duplicate using 10 g of homogenized fresh sediment placed into 140 mL glass incubation bottles, to which 50 mL of in situ tidewater was added. The incubation bottles were tightly sealed with silicone rubber stoppers. Samples were assayed in duplicate, either with or without the addition of 20% (v:v) acetylene. A separate set of time-zero samples were assayed immediately after acetylene addition. All samples were incubated in the dark for 6 h at the in situ temperature, with stirring (120 rpm). Prior to the end of the incubation, the oscillator frequency was adjusted to vigorous oscillation for 10 min and 15 mL of the evolved gases was collected from each bottle and stored in 50 mL gas sampling bags [44]. The extracted gas samples were tested using a gas chromatograph (GC-2014, Shimadzu, Japan) to determine the N2O concentration.
Potential net soil N mineralization rates (PNmin)—Assays were performed during 14 d soil incubations. For the laboratory incubation, homogenized fresh sediment (10 g) were placed into 140 mL glass incubation bottles and then preincubated in a dark incubator for 2 days at 25 °C. Bottles were sealed using cling wrap to prevent moisture loss, and water content was checked by weighing and adjusted as needed. After incubation, samples were extracted on days 1 and 14 by using 50 mL of 2 M KCl (shaken at 250 rpm for 1 h [45]. The extracts were filtered (0.45 μm) and then frozen at −20 °C for later analysis of NH4+ and NO3 by flow injection.
The PNR (nmol g−1 h−1) was calculated as the change in an incubated sample with and without the nitrification inhibitor allylthiourea [Equation (1)], while PDNR (nmol g−1 h−1) was calculated as the change in an incubated sample with and without acetylene [Equation (2)]. The PNmin (mg kg−1 d−1) was calculated after 14 d sediment incubations as the change in NH4+ and NO3 between the initial and incubated samples [Equation (3)].
P N R =   Δ N 1   × ( 20   +   10   ×   M )   ×   1000 T   ×   W   ×   ( 100     M )
P D N R =   Δ N 2   ×   V   ×   1000 T   ×   W   ×   ( 100     M )
P N m i n =   Δ N 3 T
where ΔN1 (mmol L−1) is the change in NH4+ concentrations with and without the nitrification inhibitor allylthiourea, ΔN2 (mmol L−1) is the change in N2O concentrations with and without acetylene, and ΔN3 (mg kg−1) is the change in inorganic N (NH4+ and NO3) concentrations before and after incubation; T is the incubation time. W (g) is the fresh weight, M (%) is the moisture content, and V (mL) is the air volume of the incubated bottle.

2.4. Dissolved Inorganic Nitrogen Flux Measurements

Nine cores (three sampling sites × three replicates) in opaque PVC tubes were installed into a continuous-flow system, placed within a flow-through system. This system was hermetically sealed and opaque and consisted of a square incubation box (height 50 cm; length 20 cm), a carboy to contain the in situ and unfiltered tidewater, a multichannel peristaltic pump, polyether-ether-ketone transmission tubing, and an acetol plunger with a Viton O-Ring (DuPont, Wilmington, USA). Tidewater was poured into the incubation box until the water level was 4 cm higher than that of the PVC tube. The pump transferred water from the carboy to continuously displace the water overlying the core at a flow rate of 4.5 L min−1 (through the whole system, including the nine cores). Each core was pre-incubated for 24 h to establish steady-state exchange conditions. Then each core was cultivated at the time of in situ flooding; the inflow and outflow water samples at time 0 and time of the end of cultivation (40 mL) were collected using a syringe (100 mL), respectively, then filtered through 0.45 μm pore size filters for NH4+ and NO3 analysis. The exchange fluxes of NH4+ and NO3 across the sediment–water interface were calculated according to the following equation (Equation (4)) [46].
F =   V   ×   Δ C S   × T
where F (mmol m−2 h−1) is the NH4+ or NO3 flux, ΔC (mmol L−1) is the change of NH4+ or NO3 concentration, V (L) is the volume of overlying water running above the surface of the core sediment, S (m2) is the surface area of the core sediment, and T (day) is the incubation time.

2.5. Statistical Analyses

Differences among the different sites were analyzed using a one-way analysis of variance (ANOVA) and repeated measure analysis of covariance (ANCOVA) in SPSS 22.0 (SPSS Inc., Chicago, IL, USA) for Windows 10.0 (MI, Beijing, China). All data were tested for normality and homogeneity of variance prior to ANOVA using the Shapiro–Wilk test and the Brown–Forsythe test, respectively. If these assumptions were not met, then the raw data were log transformed before any further statistical analysis. The F-values from the main tests and the t-statistic from the pairwise comparisons were evaluated in terms of the significance of the tested factor among different groups at p < 0.05. Structural equation modeling (SEM) was performed to analyze the causal mechanisms underlying N pools’ establishment, processes, and environmental parameters. The SEMs were implemented using SPSS Amos 21.0 (IBM, Armonk, New York, NY, USA). The best-fit SEM was derived by maximum likelihood and the model fit was determined using P-values, chi-square tests (χ2), root mean square errors of approximation (RMSEA), goodness-of-fit index (GFI), and Akaike information criteria [47]. Plots of N pools, processes, and fluxes were generated using Origin 9.3 (OriginLab Corporation, Northampton, MA, USA), and SEM outputs and a conceptual framework were created using Microsoft Office Visio 2016 (Microsoft Corporation, Redmond, Washington, DC, USA).

3. Results

3.1. Plant Biomass and Sediment Geochemistry along a Hydrological Gradient

We found relatively high sedimentary BD in site B at 0–10 and 20–30 cm, but in site A at 10–20 and 30–50 cm (Table 2). At 0–20 cm, TC concentration (15.37–39.36 mg g−1) decreased with elevated inundation frequencies (p < 0.05), and there were no significant differences for EC (p > 0.05). However, an accumulation of TC and high levels of EC were observed in the subsurface of site B (10–50 cm) (Table 2). Furthermore, sedimentary pH ranged from acidic (pH = 5.88–6.81) to neutral, or slightly alkaline (pH = 7.17–7.66) with elevated inundation frequencies (Table 2). A predominance of silt was observed within the study area (63–75% of all particles). The sand content was significantly lower in the surface sediment of site B than at sites A and C (p < 0.05) (Table 2). In the subsurface sediments, higher clay content and lower silt content were observed at site A compared to that at site C (p < 0.05) (Table 2). In addition, the biomasses in site A (aboveground: 1188 ± 162 g m−2, underground: 1906 ± 196 g m−2) were much higher than in site C (aboveground: 888 ± 55 g m−2, underground: 586 ± 45 g m−2), but similar to that in site B (aboveground: 1008 ± 93 g m−2, underground: 1727 ± 280 g m−2).

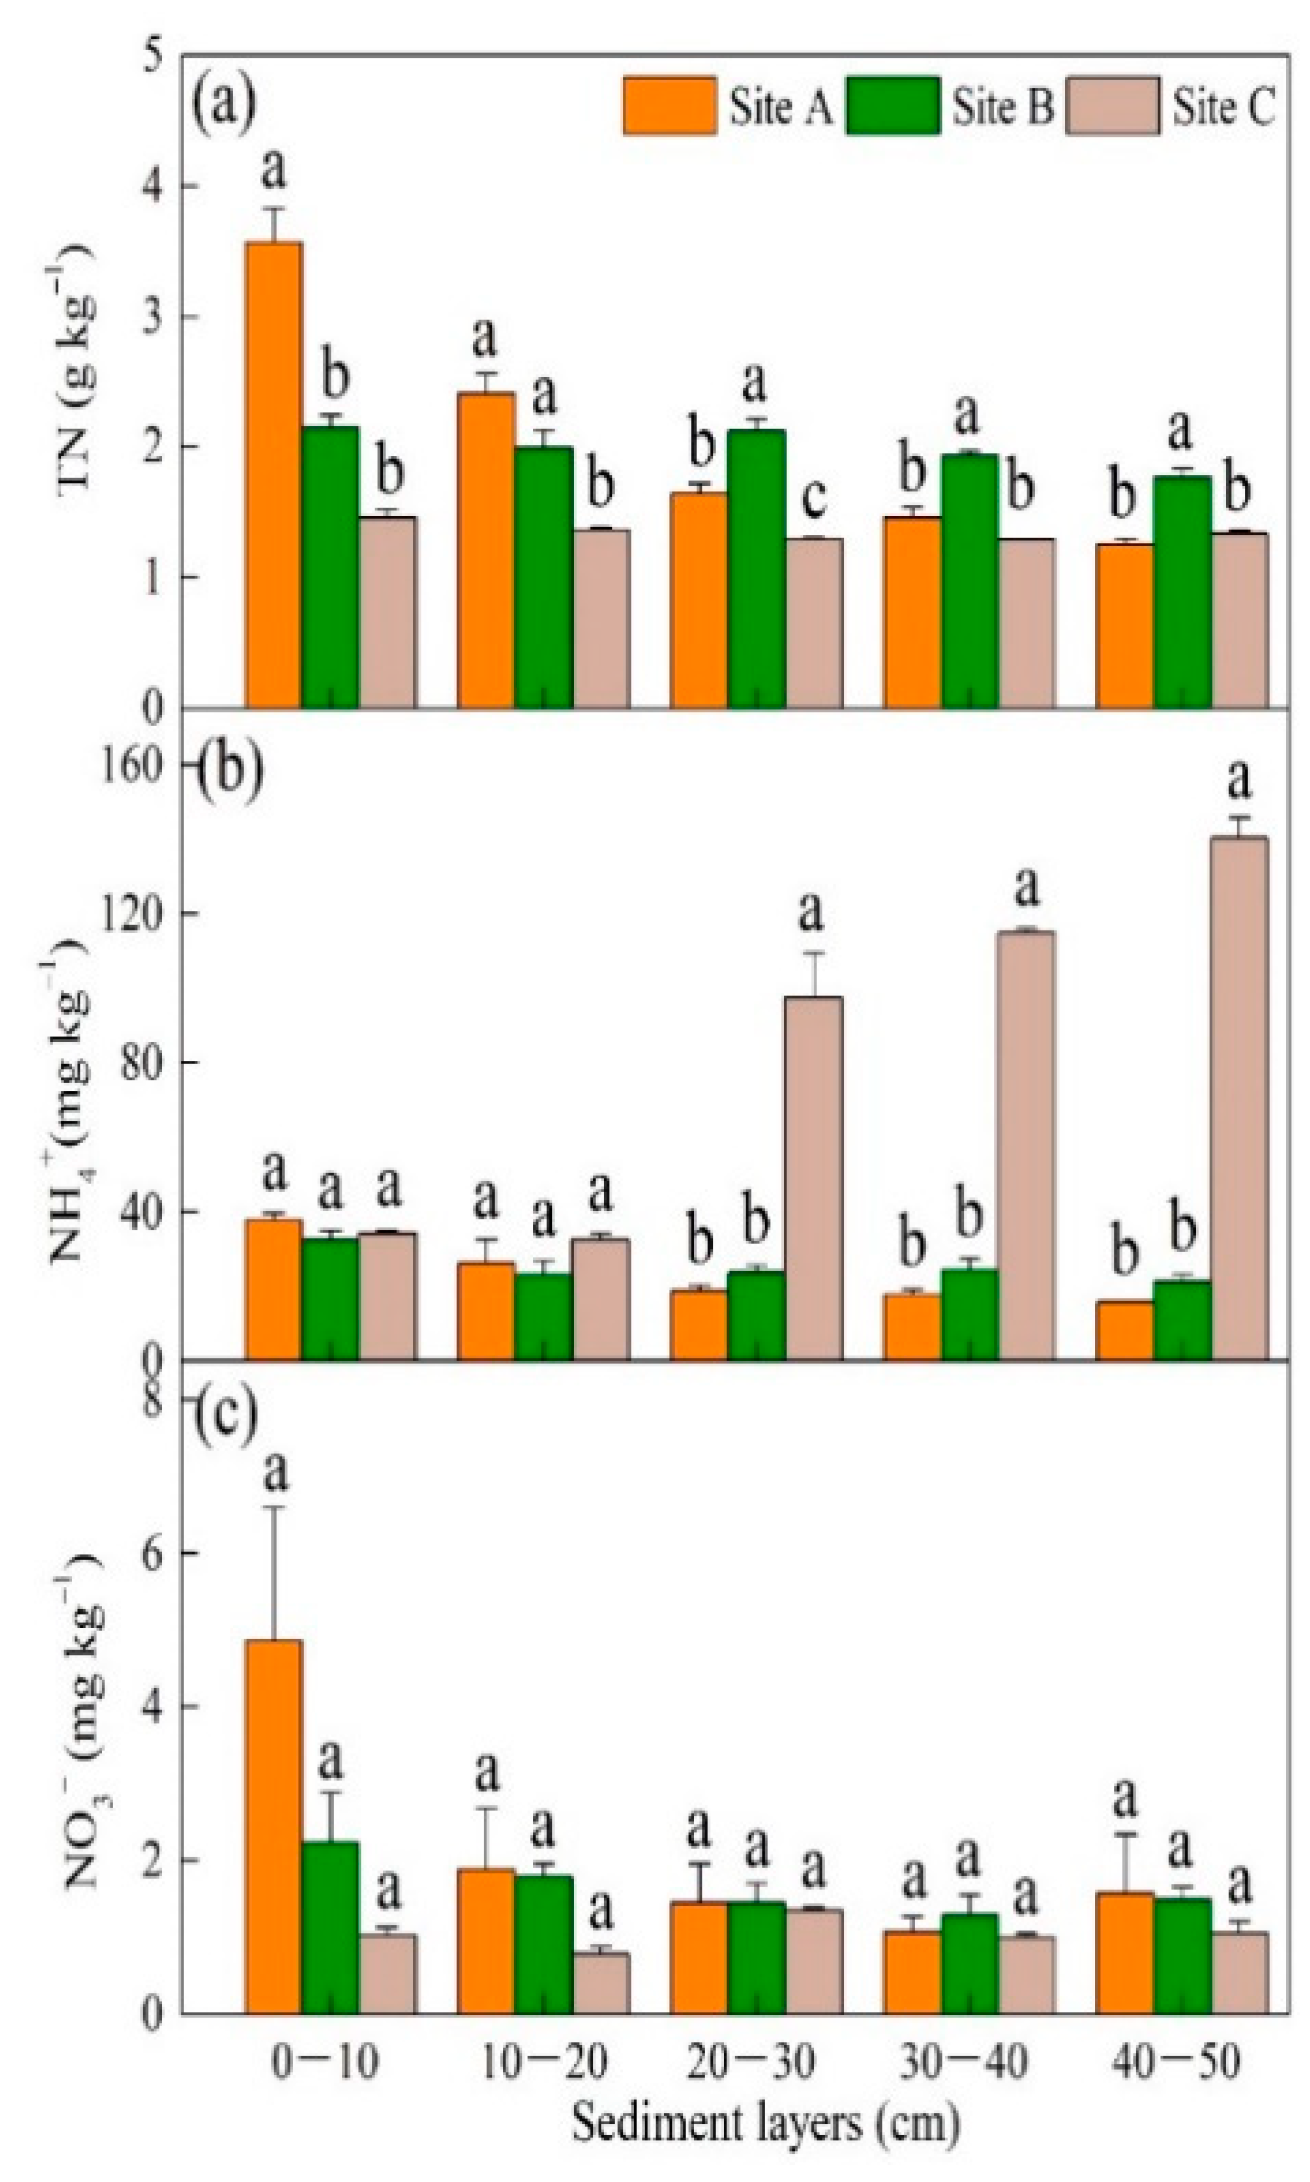
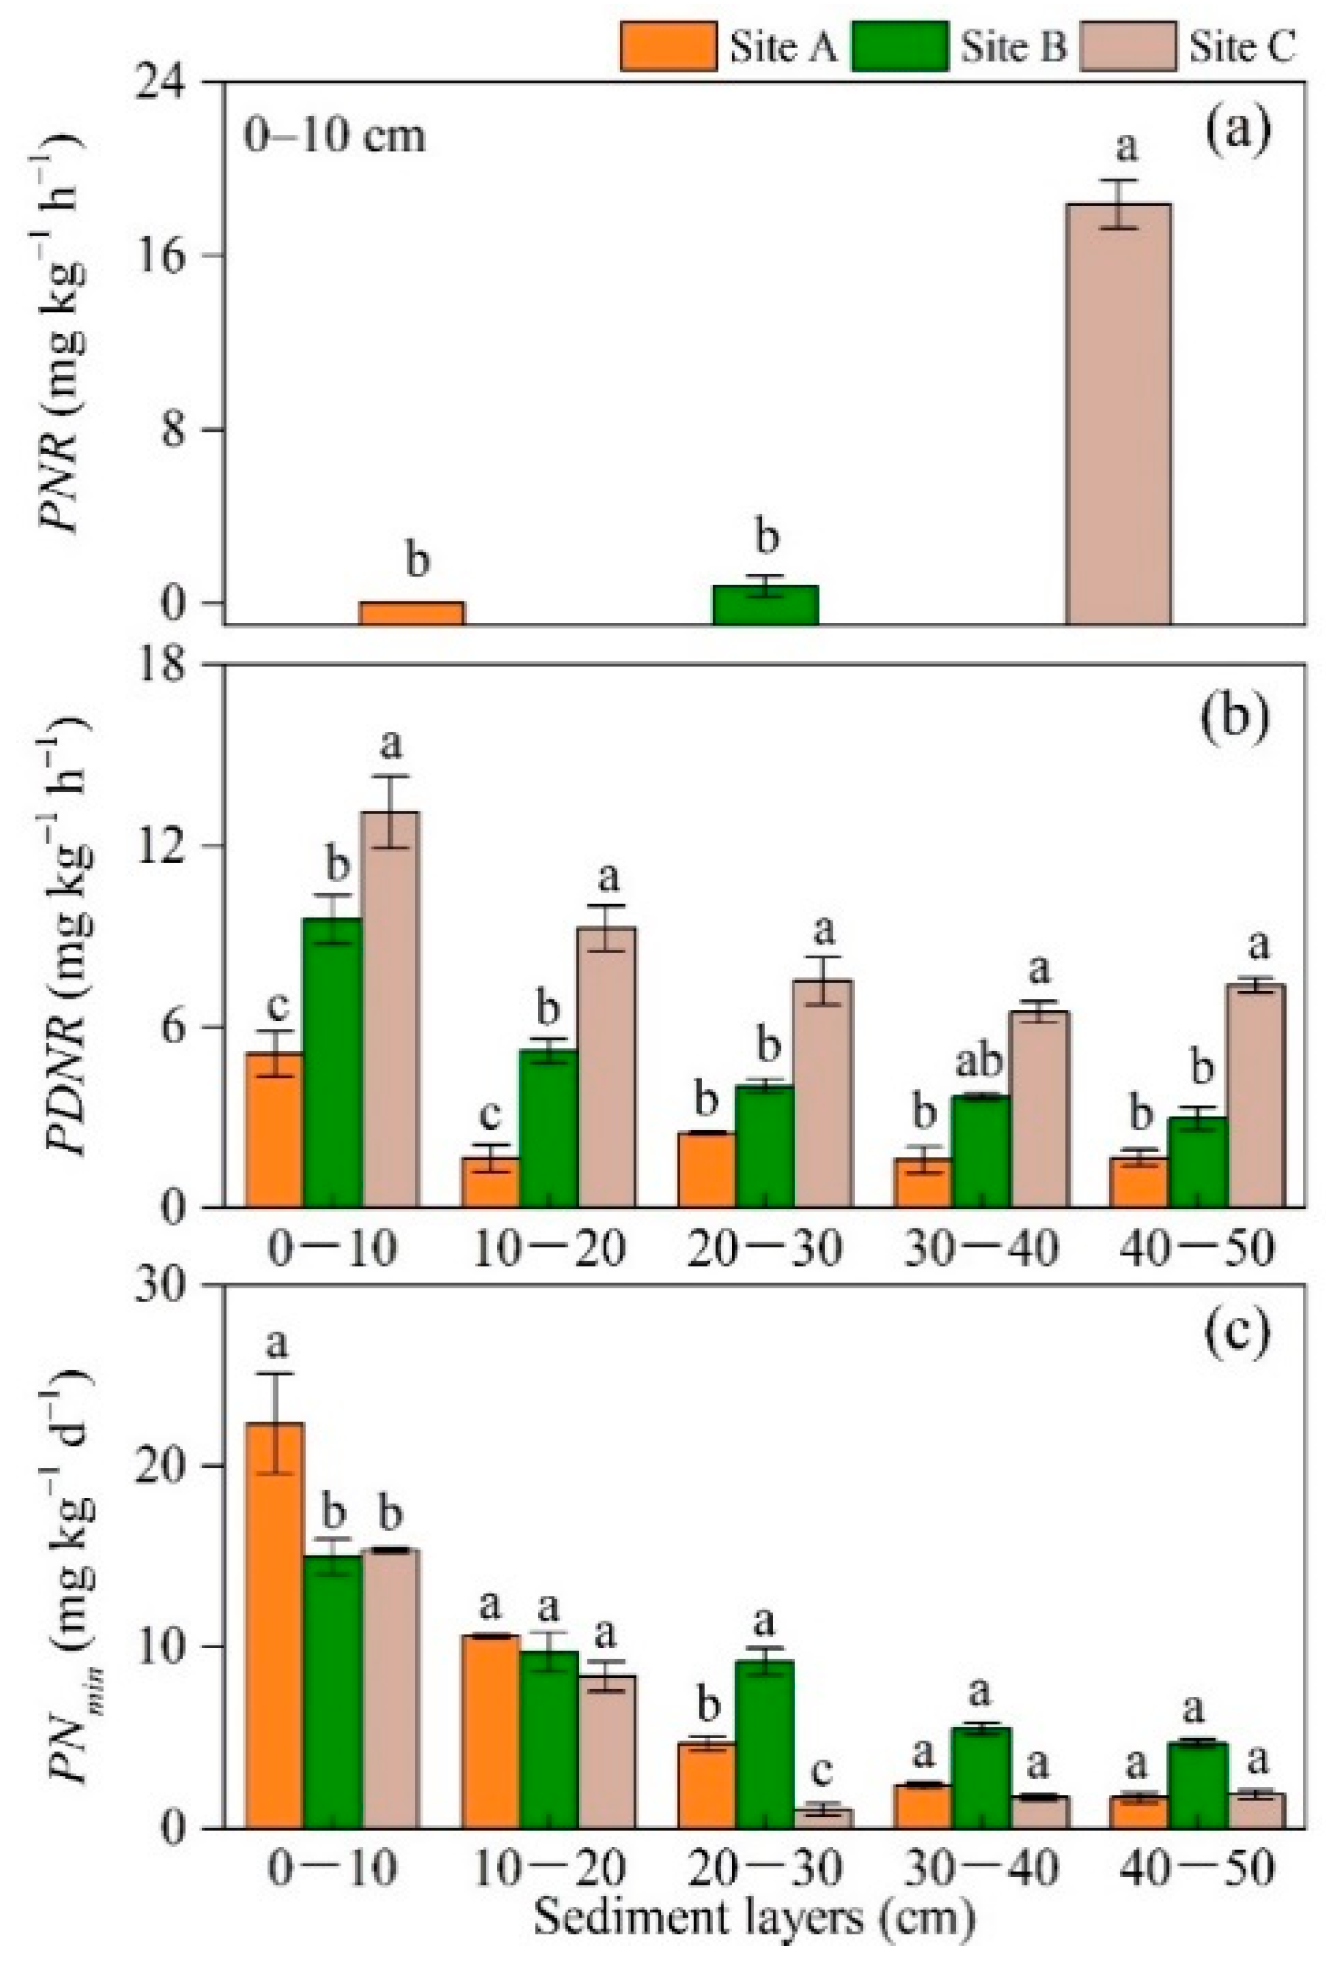
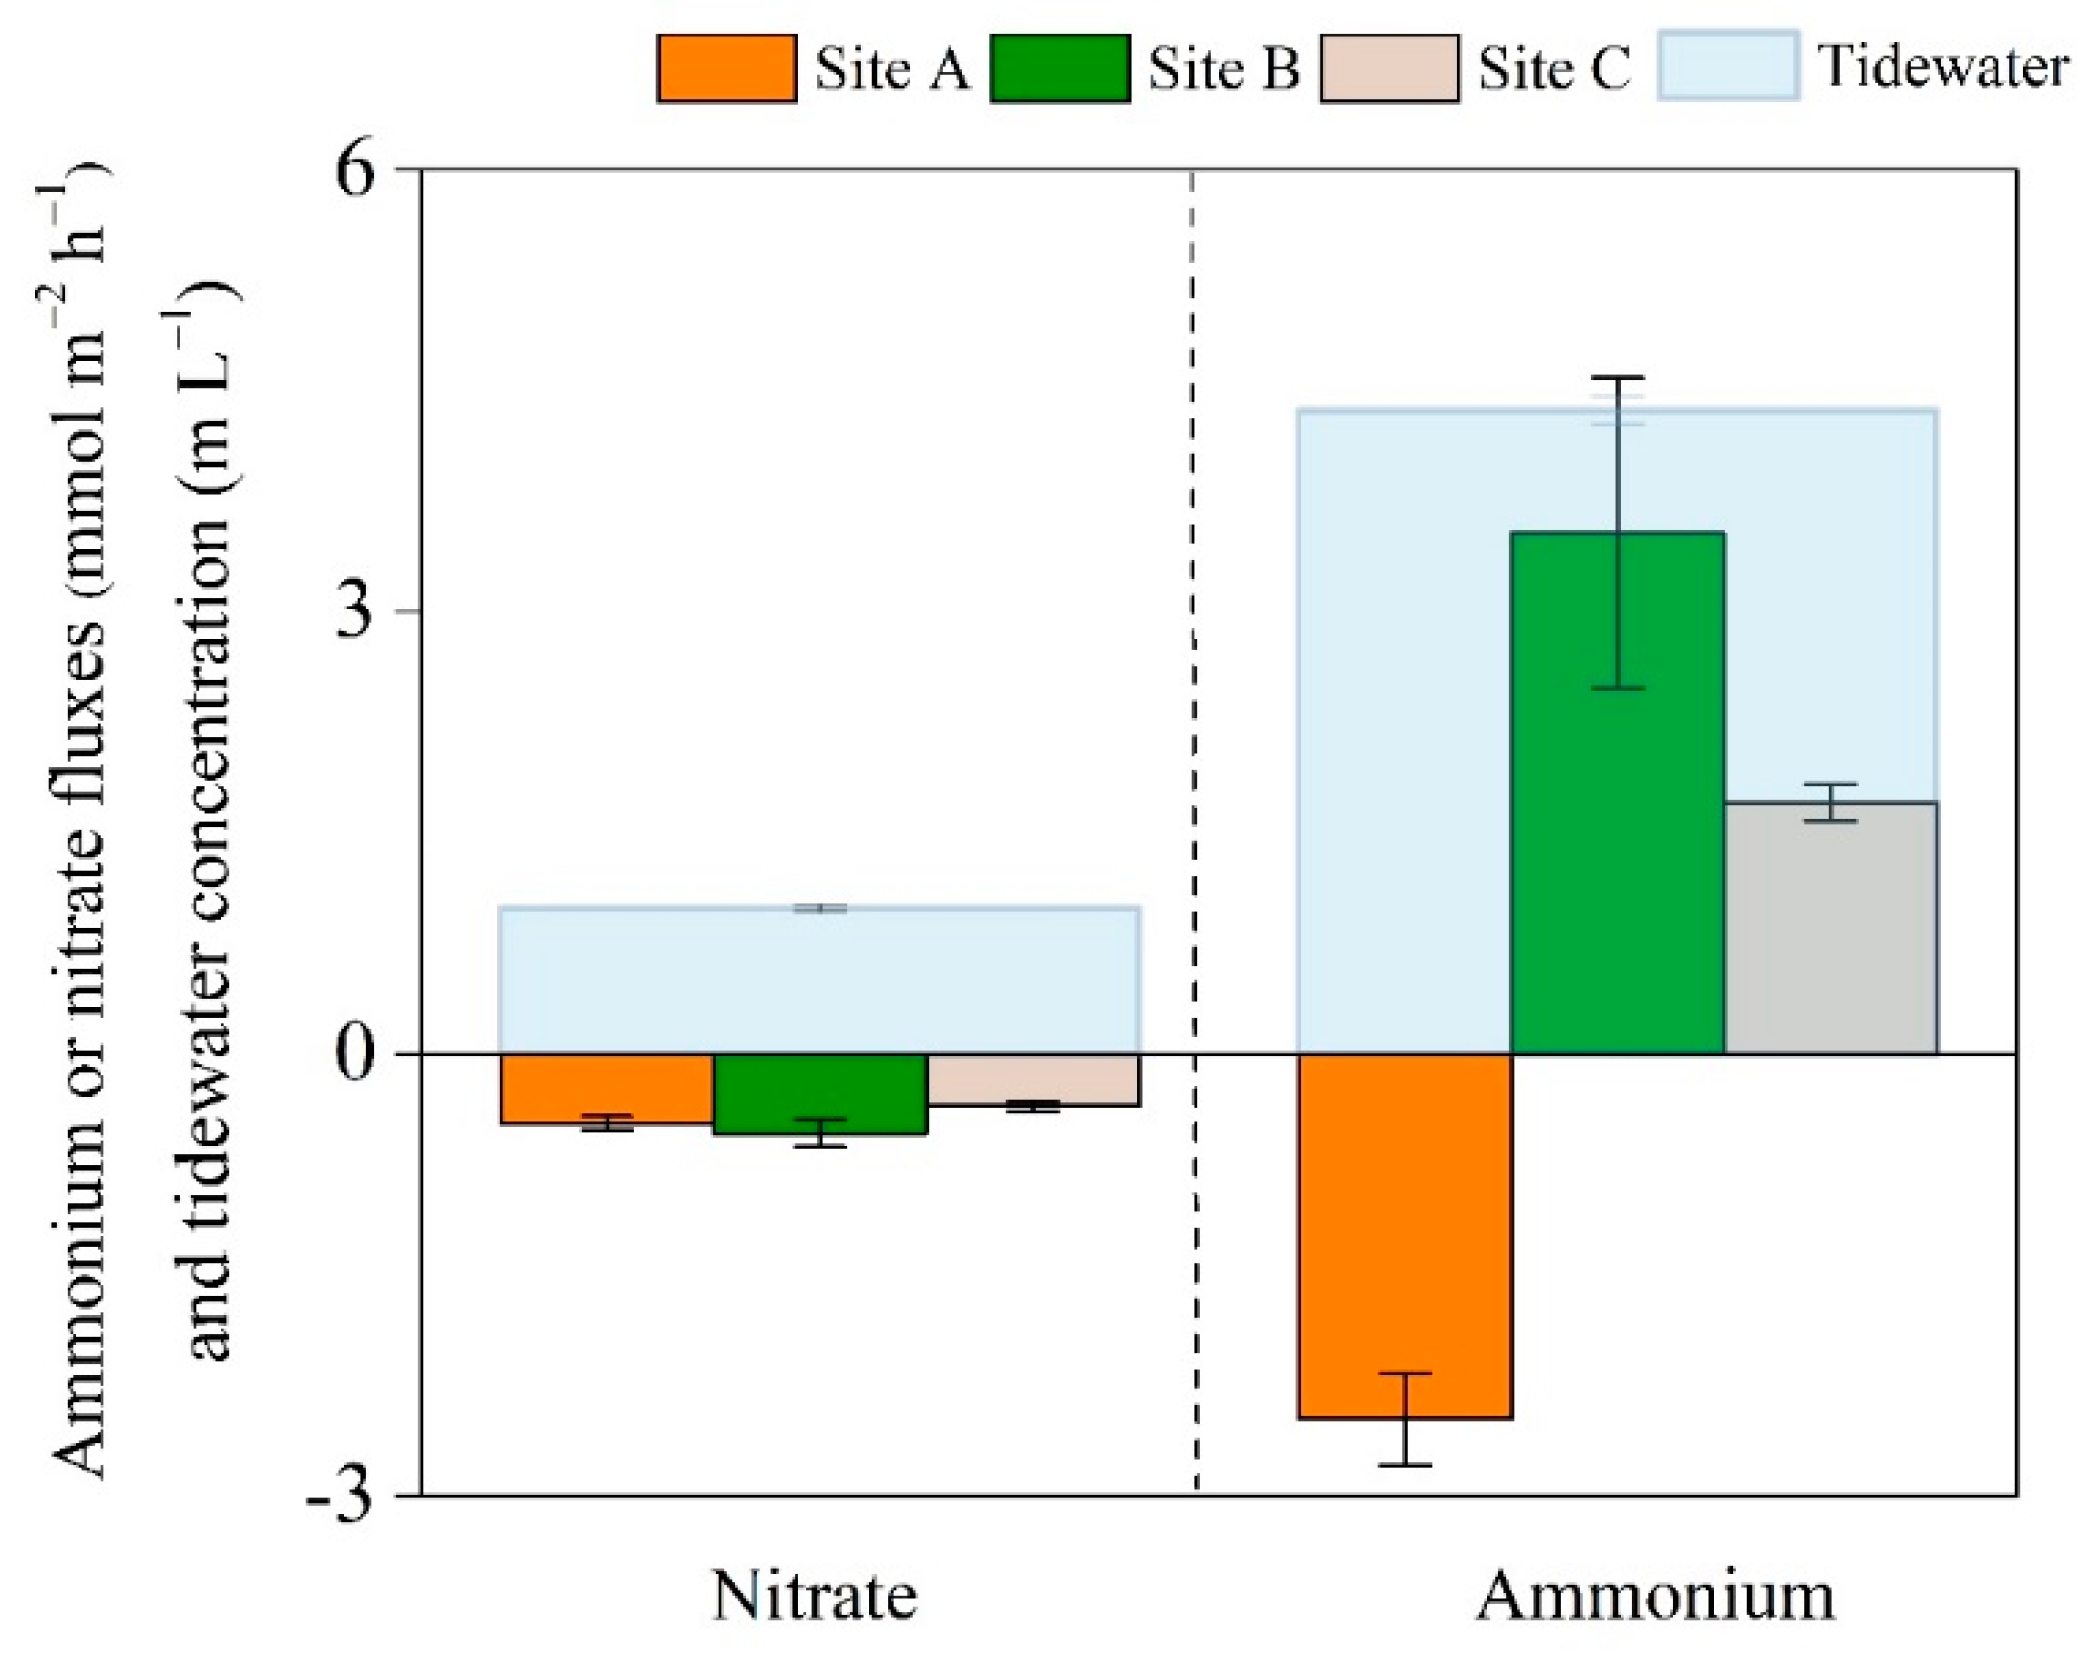
3.2. Distribution of Nitrogen Pools, Processes, and Fluxes

TN concentration (1.25–3.57 g kg−1) decreased with elevated inundation frequencies and decreased elevation except for the accumulation on the subsurface sediment of site B (Figure 2a). Most NH4+ (15.83–140.15 mg kg−1) and NO3 (0.78–4.85 mg kg−1) concentrations were similar (p > 0.05) (Figure 2b,c), but NH4+ concentration was highest on the subsurface of site C (p < 0.05) (Figure 2b).
The PNR ranged from 0.03 to 18.38 nmol g−1 h−1 with a crest value in the surface sediment of site C (Figure 3a), but there was no evidence of PNR in the subsurface sediments. The distribution of PDNR (0.51–16.17 nmol g−1 h−1) was relatively consistent, and increased with elevated inundation frequencies and decreased with depth (Figure 3b). The PNmin (1.04–22.34 mg kg−1 d−1) decreased with depth, and relatively high values were found on the surface sediment of site A and subsurface sediment of site B (p < 0.05) (Figure 3c).
Exchange fluxes of NH4+ and NO3 across the sediment–water interface are shown in Figure 4. Uptake of NO3 was detected at all three zones, varying from −0.54 to −0.35 mmol m−2 h−1 (Figure 4), whereas NH4+ fluxes (approximately −2.48 to 3.54 mmol m−2 h−1) changed from uptake at site A to efflux at sites B and C (Figure 4).

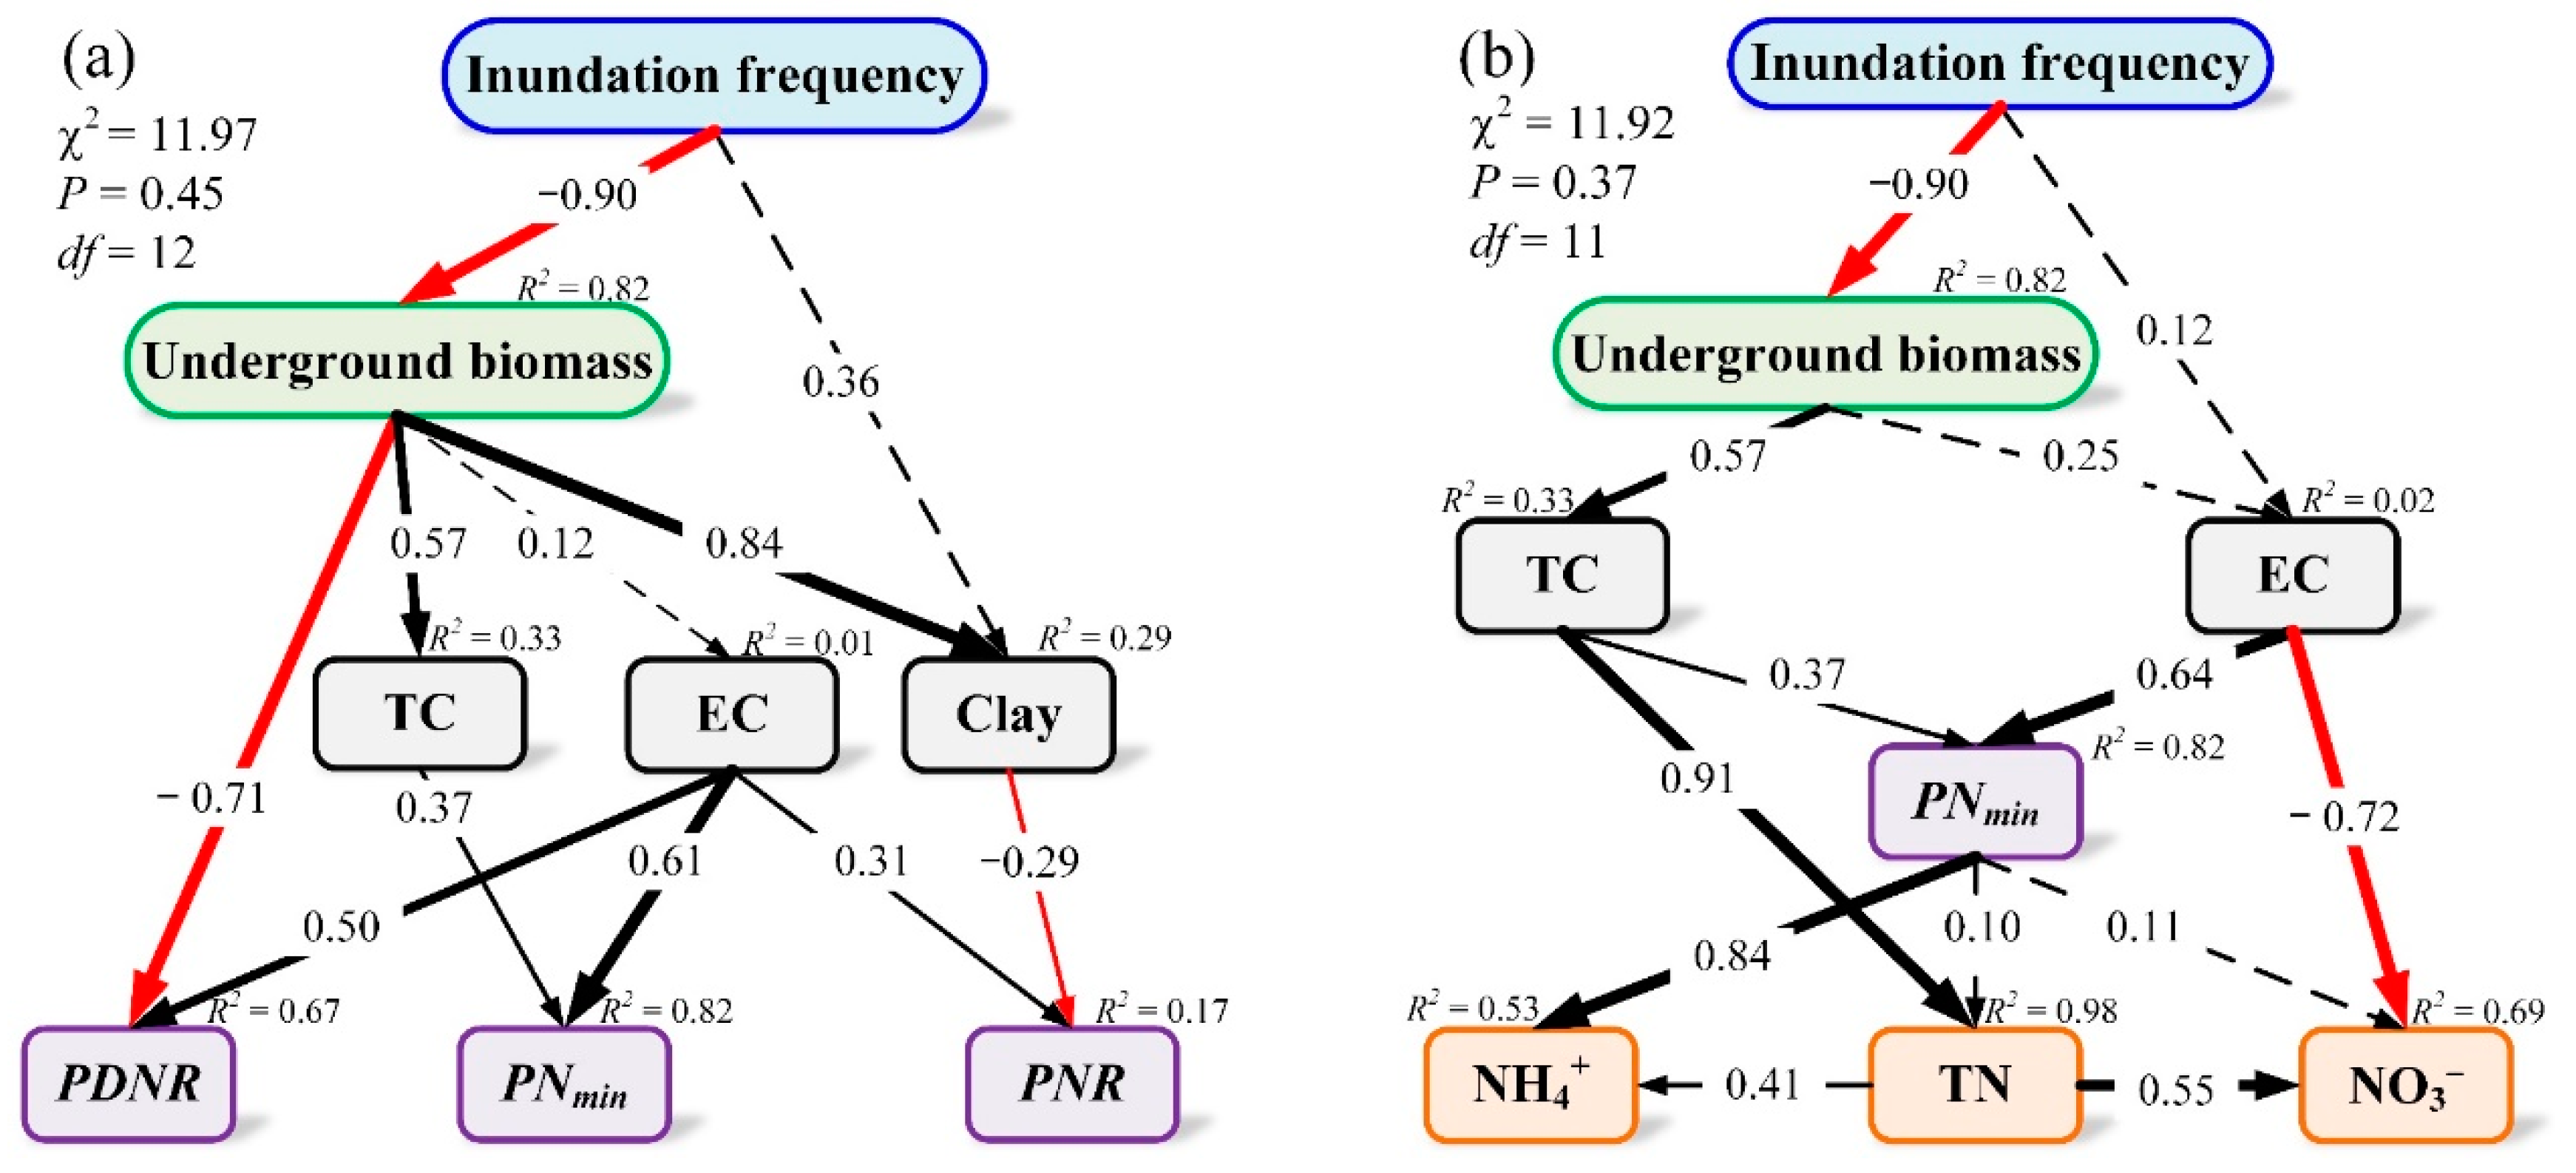
3.3. Structural Equation Modeling Analysis of the Drivers, Causal Links, and Contribution to the Priming Effect

To quantify the relative importance of the different factors determining N pools and processes, two SEMs were constructed (Figure 5). The SEM of the effects of environmental parameters on N processes and of the coupling of environmental parameters and N processes on N pools showed reasonable fits (χ2 = 11.97, P = 0.45, GFI = 0.94, RMSEA < 0.001 and χ2 = 11.92, P = 0.37, GFI = 0.95, RMSEA < 0.05, respectively, Figure 5). The models accounted for 67%, 82%, and 17% in the variance of PDNR, PNmin, and PNR, respectively (Figure 5a), and for 53%, 69%, and 98% of the variance in NH4+, NO3, and TN, respectively (Figure 5b). We found a direct negative effect of inundation frequency on underground biomass, and this underground biomass had a positive effect on sedimentary TC and a negative effect on PDNR (Figure 5a). Furthermore, sedimentary TC has positively correlated to PNmin and TN concentration, and EC was positively correlated to PDNR, PNmin, and PNR (Figure 5a). In addition, a positive correlation was noted between PNmin and NH4+, and TN was positively correlated with both NH4+ and NO3 (Figure 5b).

4. Discussion

4.1. Spatial Distribution of Nitrogen Processes

In the present study, both PDNR and PNR increased with an elevated hydrologic gradient, corroborating the results of some previous studies [14,19,20,21,32,33], but were contrary to the results of some other previous studies [23,38]. We found no evidence of PNR in the subsurface sediments, which suggested that the nitrification process is not ubiquitous throughout the subsurface. Our measurements of PDNR were similar to those of Daya Bay, China (1.8–9.2 nmol N g−1 h−1) [48], but NR increased by a factor of 1–16 more than was found in the Yangtze estuary, China (0.02–1.12 nmol g−1 h−1) [1]. Both PDNR and PNR increased in a seaward direction, which might be explained by coupled nitrification–denitrification. Nitrification leads the biological oxidation of NH4+ to NO2 followed by the oxidation of NO2 to NO3, which fuels denitrification by providing an additional source of NO3 [49]. The magnitude of coupled denitrification might be greater than the magnitude of direct denitrification and is estimated to support ~60–100% of total denitrification in the coastal zone [32,50,51,52].
The increase in PDNR with elevated inundation frequency might be explained by three reasons. First, the increase in inundation may originate an anaerobic environment. Denitrification processes are carried out by denitrifiers, and the predominant heterotrophic microorganisms associated with denitrification are facultative anaerobes under low-oxygen or anaerobic conditions [53]. Second, the SEM indicated a direct negative effect of inundation frequency on underground biomass (Figure 5a), similar to that found in previous studies [4,54]. A decrease in the underground biomass of C. malaccensis from the high tidal flat to the middle tidal flat further negatively affected PDNR (Table 2; Figure 5a). Root-mediated oxygen supply to the rhizosphere has profound effects on microbial processes in the sediments [55] and denitrifiers are known to follow the patterns of plant diversity and belowground shifts [13]. Third, EC, generally representing salinity, was positively correlated to PDNR (Figure 5a). A recent study found that a novel halophilic bacterium capable of heterotrophic nitrification–aerobic denitrification (Vibrio diabolicus SF16) and isolated from marine sediments can remove 91.82% of NH4+ and 99.71% of NO3 [56].
Relatively high PNmin, however, was found in the high tidal flat, which does not agree with the previous research in the Yellow River delta, China [23]. The most important factors in N mineralization processes might be sedimentary TC and EC. Previous studies suggested that the decreases in the underground biomass production of S. alterniflora negatively affected SOM accumulation as inundation frequency increased [54], and our SEM results support such conclusions (Figure 5a). The increased C availability and EC would also favor N mineralization in the high tidal flat [57]. Indeed, the predominant N fixers were heterotrophic bacteria associated with litter and detritus carbon availability [58]. Mineralization in the deeper strata is almost certainly limited by the supply of labile SOM from above [59].
Furthermore, EC and clay might be two factors influencing the nitrification process, but accounted for only 17% of the variance of PNR (Figure 5a). A small increase in soil EC of ~0.51 mS/cm, which can be attributed to an increased flux of electron acceptors, pore water mixing, and flushing of salt, promotes an increase in nitrification rates [44,59]. These results indicated that PDNR and PNR would decrease but the PNmin would increase under a drought scenario. Conversely, the sea level rise scenario may lead to an increase in PDNR and PNR but a decrease in PNmin.

4.2. Spatial Distribution of Nitrogen Pools

In the present study, TN concentrations decreased with elevated inundation frequencies at the surface, corroborating the results of previous studies (Table 1), although, in some studies, TN values were two- or three-fold higher in estuarine marshes in China (1.4–10.1 g kg−1) [17,18,30] and coastal marshes in Germany (2.6–6.8 g kg−1) [29]. At the subsurface sediment, an elevated TN concentration was found on the interaction zone between high and middle tidal flats. However, in contrast to earlier findings [28], NH4+ and NO3 concentrations were similar along the hydrological gradient except for the accumulation of NH4+ concentration on the subsurface sediment of the middle tidal flat. These results suggested that the drought scenario may lead to an increase N storage, whereas N storage would decrease but NH4+ would increase under the sea level rise scenario.
The SEM results indicated that high TC has contributed to the increase in TN concentration at both surface and subsurface sediment (Table 2; Figure 5b), consistent with the results of Ye et al. [30]. The toposequence along a gradient of inundation frequency represents a chronosequence since the soils have developed associated with TC and TN accumulation [2,29,60]. The most indicative of peat development has the lowest BD, highest SOM, highest mass-based TC, and highest mass-based TN, whereas the least indicative of peat development is the opposite [60].
The SEM results suggested that TN and PNmin were positively correlated to both NH4+ and NO3 (Figure 5b). This was mainly caused by N mineralization, which converts N from organic into inorganic forms, including NH4+ and NO3 immobilization [61]. Thus, NH4+ concentration accumulated on the subsurface sediment of the middle tidal flat, coupled with high PNmin (Figure 2b). However, this process did not significantly change NO3 concentration along the hydrological gradient or NH4+ at the surface sediment. These results are similar to those reported by Jia et al. [23]. This pattern may be caused by inorganic N production, ionic exchange, and plant uptake. Electrical conductivity directly affected PNmin, PDNR, PNR, and NO3 concentration and indirectly affected NH4+ concentration (Figure 5b). High salinity could enhance NH4+ and TN, through a balance between production and remineralization [39,62,63,64], and accelerate ionic displacements, such as NH4+ exchange and adsorption [11,62,65,66,67]. Additionally, immobilization of plant inorganic N uptake and/or microbial inorganic N immobilization decreased due to increased toxicity and ion stress [39,62,68].

4.3. Spatial Distribution of Nitrogen Fluxes

Our measurements of dissolved inorganic N flux were close to those typically reported for coastal zones (NO3 flux: approximately −0.8 to 1.8 mmol m−2 h−1; NH4+ flux: −0.2 to 0.6 mmol m−2 h−1) [11,28]. The NH4+ flux changed from uptake to efflux with elevated inundation frequencies (Figure 4). This result is consistent with the literature that diffusion of NH4+ from the overlying water to the sediment might change so that it is being released from the sediment to the overlying water instead [69]. NH4+ flux across the sediment–water interface varied from the sink to source along the elevated inundation frequencies that coincided with the sediment pH from acid soil to slightly alkaline (Table 2). Indeed, pH determined the relative proportion of inorganic N that was nitrified when NH4+ was sufficiently high [70]. The alkaline sedimentary environment was beneficial to acidic amino acids that were resistant to degradation and dissolution, and NH4+ might be released into the overlying water in slightly alkaline sediments [71].
The NO3 fluxes, however, were similar along the in situ hydrological gradients, and this pattern was similar to the sedimentary NO3 concentration. The sediment sink or source function for dissolved inorganic N greatly changed both spatially and temporally due to the complex transportation and transformation of dissolved inorganic N near the sediment–water interface [11,72]. The NO3 flux across the sediment–water interface was controlled by NO3 concentration in the water column [28]. These results revealed that NH4+ diffuses from the overlying water into the sediment under the drought scenario, whereas NH4+ would be released from the sediment into the overlying water under the sea level rise scenario.

4.4. Implications, Uncertainties, and Future Study

Herein, we proposed a conceptual scheme for the fate of N pools, processes, and fluxes on a tidal flat based on our results (Figure 6). This conceptual scheme can provide a comprehensive perspective to understanding the underlying causal mechanisms in intertidal flats, and it can help improve predictions and climate adaptation strategies. Our data clearly show that PDNR and PNR increased but PNmin and TN decreased along an elevated hydrological gradient in the surface sediment. However, in the subsurface sediment, we found elevated PNmin and TN concentration in the interaction zone between the high and middle tidal flats, as well as elevated NH4+ concentration in the middle tidal flat. Additionally, our findings show that N storage may increase owing to increasing drought events. Conversely, under conditions of continuous sea level rise, a decrease in N storage could cause a change from NH4+ sink to NH4+ source.
Due to the inherent limitations of the study region, we selected sampling sites that were all covered by C. malaccensis. Since plant functional composition is crucial for sediment N pools and processes [17,45], we suggest further investigation of different vegetation-covered areas. We acknowledge that our study lacks a large number of sampling sites, as we sampled only three sites—the high and middle tidal flats and their interaction zone. Further studies with a large number of sampling sites are needed to investigate the N cycle in estuarine wetlands.

5. Conclusions

Our data indicated that PDNR and PNR increased but PNmin and TN decreased along an elevated hydrological gradient in the surface sediment. However, in the subsurface sediment, we found elevated PNmin and TN concentration in the interaction zone between the high and middle tidal flats, as well as elevated NH4+ concentration in the middle tidal flat. These distribution patterns of N pools and processes may be explained by the decrease in inundation frequency, underground biomass, carbon availability, and the increase in salinity. In addition, NH4+ flux changed from uptake to efflux with elevated inundation frequencies, which coincided with the change in sediment pH from acid to slightly alkaline soil. However, sedimentary NO3 concentrations and NO3 fluxes were similar along the hydrological gradients.
In response to possible future scenarios of climate change, N storage and PNmin may increase, but PDNR and PNR are likely to decrease, and NH4+ would diffuse from the overlying water into the sediment under a drought scenario. Conversely, the sea level rise scenario may not only lead to an increase in coupled nitrification–denitrification and N removal but also to a decrease in mineralization and immobilization, consequently decreasing N storage and leading to a change from NH4+ sink to NH4+ source.

Author Contributions

Conceptualization: W.H. and W.Z.; Data curation: W.Z.; Formal analysis: W.H.; Methodology: W.Z., L.Z., C.Z. and C.T.; Resources: W.Z.; C.Z., Z.S. and C.T.; Software: W.H.; Supervision: Y.C. and C.Z.; Visualization: W.H.; Writing—original draft: W.H.; Writing—review & editing: Y.C. and C.Z.

Funding

The study was partly supported by the Public Service Foundation of Science and Technology Department of Fujian Province (Grant No: 2017R1034-6), the National Science Foundation of China (41877335), and the Program for Innovative Research Teams of Fujian Normal University (No. IRTL1205).

Acknowledgments

This work was financially supported by the Public Service Foundation of Science and Technology Department of Fujian Province (Grant No: 2017R1034-6), the National Science Foundation of China (41877335), and the Program for Innovative Research Teams of Fujian Normal University (No. IRTL1205). Thanks are due to Yiu Wai Hong and Yeung Hoi Lam Rachel, who collected the samples. We also thank Wetland Ecosystem Research Station of Minjiang Estuary, State Forestry and Grassland Administration, China, for logistical support and laboratory assistance.

Conflicts of Interest

The authors declare no conflicts of interest.

References

  1. Hou, L.; Liu, M.; Xu, S.; Ou, D.; Yu, J.; Cheng, S.; Lin, X.; Yang, Y. The effects of semi-lunar spring and neap tidal change on nitrification, denitrification and N2O vertical distribution in the intertidal sediments of the Yangtze estuary, China. Estuar. Coast. Shelf Sci. 2007, 73, 607–616. [Google Scholar] [CrossRef]
  2. Kirwan, M.L.; Megonigal, J.P. Tidal wetland stability in the face of human impacts and sea-level rise. Nature 2013, 504, 53–60. [Google Scholar] [CrossRef] [PubMed]
  3. Zhang, W.; Zeng, C.; Tong, C.; Zhai, S.; Lin, X.; Gao, D. Spatial distribution of phosphorus speciation in marsh sediments along a hydrologic gradient in a subtropical estuarine wetland, China. Estuar. Coast. Shelf Sci. 2015, 154, 30–38. [Google Scholar] [CrossRef]
  4. Wong, J.X.; Van Colen, C.; Airoldi, L. Nutrient levels modify saltmarsh responses to increased inundation in different soil types. Mar. Environ. Res. 2015, 104, 37–46. [Google Scholar] [CrossRef] [PubMed]
  5. Luo, M.; Zeng, C.S.; Tong, C.; Huang, J.F.; Yu, Q.; Guo, Y.B.; Wang, S.-H. Abundance and speciation of iron across a subtropical tidal marsh of the Min River Estuary in the East China Sea. Appl. Geochem. 2014, 45, 1–13. [Google Scholar] [CrossRef]
  6. Aelion, C.M.; Warttinger, U. Sulfide inhibition of nitrate removal in coastal sediments. Estuar. Coasts 2010, 33, 798–803. [Google Scholar] [CrossRef]
  7. Deng, F.; Hou, L.; Liu, M.; Zheng, Y.; Yin, G.; Li, X.; Lin, X.; Chen, F.; Gao, J.; Jiang, X. Dissimilatory nitrate reduction processes and associated contribution to nitrogen removal in sediments of the Yangtze Estuary. J. Geophys. Res.-Biogeosci. 2015, 120, 1521–1531. [Google Scholar] [CrossRef]
  8. Jicha, T.M.; Johnson, L.; Hill, B.; Regal, R.; Elonen, C.; Pearson, M. Spatial and temporal patterns of nitrification rates in forested floodplain wetland soils of upper Mississippi River Pool 8. River Res. Appl. 2013, 30, 650–662. [Google Scholar] [CrossRef]
  9. Roberts, K.L.; Kessler, A.J.; Grace, M.R.; Cook, P.L. Increased rates of dissimilatory nitrate reduction to ammonium (DNRA) under oxic conditions in a periodically hypoxic estuary. Geochim. Cosmochim. Acta 2014, 133, 313–324. [Google Scholar] [CrossRef]
  10. Wigand, C.; McKinney, R.A.; Chintala, M.M.; Charpentier, M.A.; Groffman, P.M. Denitrification enzyme activity of fringe salt marshes in New England (USA). J. Environ. Qual. 2004, 33, 1144–1151. [Google Scholar] [CrossRef]
  11. Cheng, X.; Hou, L.; Liu, M.; Zheng, Y.; Yin, G.; Li, X.; Li, X.; Gao, J.; Deng, F.; Jiang, X. Inorganic nitrogen exchange across the sediment-water interface in the eastern Chongming tidal flat of the Yangtze Estuary. Environ. Earth Sci. 2015, 74, 2173–2184. [Google Scholar] [CrossRef]
  12. Gao, H.; Bai, J.; Deng, X.; Lu, Q.; Ye, X. Short-term effects of tidal flooding on soil nitrogen mineralization in a Chinese tidal salt marsh. Phys. Chem. Earth 2018, 103, 3–10. [Google Scholar] [CrossRef]
  13. Salles, J.F.; e Silva, M.C.P.; Dini-Andreote, F.; Dias, A.C.; Guillaumaud, N.; Poly, F.; Van Elsas, J.D. Successional patterns of key genes and processes involved in the microbial nitrogen cycle in a salt marsh chronosequence. Biogeochemistry 2017, 132, 185–201. [Google Scholar] [CrossRef]
  14. Zhang, L.; Yao, X.; Tang, C.; Xu, H.; Jiang, X.; Zhang, Y. Influence of long-term inundation and nutrient addition on denitrification in sandy wetland sediments from Poyang Lake, a large shallow subtropical lake in China. Environ. Pollut. 2016, 219, 440–449. [Google Scholar] [CrossRef] [PubMed]
  15. IPCC. Working Group I Contribution to the IPCC Fifth Assessment Report Climate 2013: The Physical Science Basis; IPCC: Cambridge, UK; New York, NY, USA, 2013. [Google Scholar]
  16. Siddiqui, Z.A. Storm surge forecasting for the Arabian Sea. Mar. Geod. 2009, 32, 199–217. [Google Scholar] [CrossRef]
  17. Quan, W.; Shi, L.; Han, J.; Ping, X.; Shen, A.; Chen, Y. Spatial and temporal distributions of nitrogen, phosphorus and heavy metals in the intertidal sediment of the Chang jiang River Estuary in China. Acta Oceanol. Sin. 2010, 29, 108–115. [Google Scholar] [CrossRef]
  18. Zhou, J.; Wu, Y.; Kang, Q.; Zhang, J. Spatial variations of carbon, nitrogen, phosphorous and sulfur in the salt marsh sediments of the Yangtze Estuary in China. Estuar. Coast. Shelf Sci. 2007, 71, 47–59. [Google Scholar] [CrossRef]
  19. Hernandez, M.E.; Mitsch, W.J. Denitrification in created riverine wetlands: Influence of hydrology and season. Ecol. Eng. 2007, 30, 78–88. [Google Scholar] [CrossRef]
  20. Mchergui, C.; Besaury, L.; Langlois, E.; Aubert, M.; Akpa-Vinceslas, M.; Buatois, B.; Quillet, L.; Bureau, F. A comparison of permanent and fluctuating flooding on microbial properties in an ex-situ estuarine riparian system. Appl. Soil Ecol. 2014, 78, 1–10. [Google Scholar] [CrossRef]
  21. Song, K.; Lee, S.H.; Mitsch, W.J.; Kang, H. Different responses of denitrification rates and denitrifying bacterial communities to hydrologic pulsing in created wetlands. Soil Biol. Biochem. 2010, 42, 1721–1727. [Google Scholar] [CrossRef]
  22. Chen, Q.H.; Feng, Y.; Zhang, Y.; Zhang, Q.C.; Shamsi, I.H.; Zhang, Y.; Lin, X. Short-term responses of nitrogen mineralization and microbial community to moisture regimes in greenhouse vegetable soils. Pedosphere 2012, 22, 263–272. [Google Scholar] [CrossRef]
  23. Jia, J.; Bai, J.; Gao, H.; Wen, X.; Zhang, G.; Cui, B.; Liu, X. In situ soil net nitrogen mineralization in coastal salt marshes (Suaeda salsa) with different flooding periods in a Chinese estuary. Ecol. Indic. 2017, 73, 559–565. [Google Scholar] [CrossRef]
  24. Lewis, D.B.; Brown, J.A.; Jimenez, K. Effects of flooding and warming on soil organic matter mineralization in Avicennia germinans mangrove forests and Juncus roemerianus salt marshes. Estuar. Coast. Shelf Sci. 2014, 139, 11–19. [Google Scholar] [CrossRef]
  25. Hansen, J.I.; Henriksen, K.; Blackburn, T.H. Seasonal distribution of nitrifying bacteria and rates of nitrification in coastal marine sediments. Microb. Ecol. 1981, 7, 297–304. [Google Scholar] [CrossRef] [PubMed]
  26. Domangue, R.J.; Mortazavi, B. Nitrate reduction pathways in the presence of excess nitrogen in a shallow eutrophic estuary. Environ. Pollut. 2018, 238, 599–606. [Google Scholar] [CrossRef] [PubMed]
  27. Dong, L.; Thornton, D.; Nedwell, D.; Underwood, G. Denitrification in sediments of the River Colne estuary, England. Mar. Ecol. Prog. Ser. 2000, 203, 109–122. [Google Scholar] [CrossRef] [Green Version]
  28. Cabrita, M.T.; Brotas, V. Seasonal variation in denitrification and dissolved nitrogen fluxes in intertidal sediments of the Tagus estuary, Portugal. Mar. Ecol. Prog. Ser. 2000, 202, 51–65. [Google Scholar] [CrossRef] [Green Version]
  29. Spohn, M.; Babka, B.; Giani, L. Changes in soil organic matter quality during sea-influenced marsh soil development at the North Sea coast. Catena 2013, 107, 110–117. [Google Scholar] [CrossRef]
  30. Ye, X.; Wang, A.; Chen, J. Distribution and deposition characteristics of carbon and nitrogen in sediments in a semi-closed bay area, southeast China. Cont. Shelf Res. 2014, 90, 133–141. [Google Scholar] [CrossRef]
  31. Huang, L.; Bai, J.; Xiao, R.; Shi, J.; Gao, H. The soil nitrogen dynamics in an inland salt marsh as affected by various experimental water levels. Hydrol. Process. 2014, 28, 4708–4717. [Google Scholar] [CrossRef]
  32. Laursen, A.E.; Seitzinger, S.P. The role of denitrification in nitrogen removal and carbon mineralization in Mid-Atlantic Bight sediments. Cont. Shelf Res. 2002, 22, 1397–1416. [Google Scholar] [CrossRef]
  33. Risgaard-Petersen, N.; Meyer, R.L.; Schmid, M.; Jetten, M.S.; Enrich-Prast, A.; Rysgaard, S.; Revsbech, N.P. Anaerobic ammonium oxidation in an estuarine sediment. Aquat. Microb. Ecol. 2004, 36, 293–304. [Google Scholar] [CrossRef] [Green Version]
  34. Eyre, B.D.; Pont, D. Intra- and inter-annual variability in the different forms of diffuse nitrogen and phosphorus delivered to seven sub-tropical east Australian estuaries. Estuar. Coast. Shelf Sci. 2003, 57, 137–148. [Google Scholar] [CrossRef]
  35. Eyre, B.D. Regional evaluation of nutrient transformation and phytoplankton growth in nine river-dominated sub-tropical east Australian estuaries. Mar. Ecol. Prog. Ser. 2000, 205, 61–83. [Google Scholar] [CrossRef]
  36. Zhang, W.; Shi, F.; Hong, H.; Shang, S.; Kirby, J.T. Tide-surge interaction intensified by the Taiwan Strait. J. Geophys. Res.-Oceans 2010, 115, 1–17. [Google Scholar] [CrossRef]
  37. Hu, M.; Wilson, B.J.; Sun, Z.; Ren, P.; Tong, C. Effects of the addition of nitrogen and sulfate on CH4 and CO2 emissions, soil, and pore water chemistry in a high marsh of the Min River estuary in southeastern China. Sci. Total Environ. 2016, 579, 292–304. [Google Scholar] [CrossRef] [PubMed]
  38. Dong, L.F.; Nedwell, D.B.; Stott, A. Sources of nitrogen used for denitrification and nitrous oxide formation in sediments of the hypernutrified Colne, the nutrified Humber, and the oligotrophic Conwy estuaries, United Kingdom. Limnol. Oceanogr. 2006, 51, 545–557. [Google Scholar] [CrossRef]
  39. Luo, M.; Zhu, W.; Huang, J.; Liu, Y.; Duan, X.; Wu, J.; Tong, C. Anaerobic organic carbon mineralization in tidal wetlands along a low-level salinity gradient of a subtropical estuary: Rates, pathways, and controls. Geoderma 2019, 337, 1245–1257. [Google Scholar] [CrossRef]
  40. Bai, J.; Wang, Q.; Deng, W.; Gao, H.; Tao, W.; Xiao, R. Spatial and seasonal distribution of nitrogen in marsh soils of a typical floodplain wetland in Northeast China. Environ. Monit. Assess. 2012, 184, 1253–1263. [Google Scholar] [CrossRef]
  41. Wentworth, C.K. A scale of grade and class terms for clastic sediments. J. Geol. 1922, 30, 377–392. [Google Scholar] [CrossRef]
  42. Burger, M.; Jackson, L.E. Microbial immobilization of ammonium and nitrate in relation to ammonification and nitrification rates in organic and conventional cropping systems. Soil Biol. Biochem. 2003, 35, 29–36. [Google Scholar] [CrossRef]
  43. Barnes, J.; Owens, N. Denitrification and nitrous oxide concentrations in the Humber estuary, UK, and adjacent coastal zones. Mar. Pollut. Bull. 1999, 37, 247–260. [Google Scholar] [CrossRef]
  44. Magalhães, C.M.; Joye, S.B.; Moreira, R.M.; Wiebe, W.J.; Bordalo, A.A. Effect of salinity and inorganic nitrogen concentrations on nitrification and denitrification rates in intertidal sediments and rocky biofilms of the Douro River estuary, Portugal. Water Res. 2005, 39, 1783–1794. [Google Scholar] [CrossRef] [PubMed]
  45. Fornara, D.A.; Tilman, D.; Hobbie, S.E. Linkages between plant functional composition, fine root processes and potential soil N mineralization rates. J. Ecol. 2009, 97, 48–56. [Google Scholar] [CrossRef]
  46. Clavero, V.; Izquierdo, J.J.; Fernandez, J.A.; Niell, F.X. Influence of bacterial density on the exchange of phosphate between sediment and overlying water. Hydrobiologia 1999, 392, 55–63. [Google Scholar] [CrossRef] [Green Version]
  47. Zhu, Z.; Ge, T.; Luo, Y.; Liu, S.; Xu, X.; Tong, C.; Shibistova, O.; Guggenberger, G.; Wu, J. Microbial stoichiometric flexibility regulates rice straw mineralization and its priming effect in paddy soil. Soil Biol. Biochem. 2018, 121, 67–76. [Google Scholar] [CrossRef]
  48. Xiao, K.; Wu, J.; Li, H.; Hong, Y.; Wilson, A.M.; Jiao, J.J.; Shananan, M. Nitrogen fate in a subtropical mangrove swamp: Potential association with seawater-groundwater exchange. Sci. Total Environ. 2018, 635, 586–597. [Google Scholar] [CrossRef]
  49. Marchant, H.K.; Holtappels, M.; Lavik, G.; Ahmerkamp, S.; Winter, C.; Kuypers, M.M. Coupled nitrification-denitrification leads to extensive N loss in subtidal permeable sediments. Limnol. Oceanogr. 2016, 61, 1033–1048. [Google Scholar] [CrossRef] [Green Version]
  50. Devol, A.H.; Christensen, J.P. Benthic fluxes and nitrogen cycling in sediments of the continental margin of the eastern North Pacific. J. Mar. Res. 1993, 51, 345–372. [Google Scholar] [CrossRef]
  51. Devol, A.H.; Codispoti, L.A.; Christensen, J.P. Summer and winter denitrification rates in western Arctic shelf sediments. Cont. Shelf Res. 1997, 17, 1029–1050. [Google Scholar] [CrossRef]
  52. Rysgaard, S.; Thamdrup, B.; Risgaard-Petersen, N.; Fossing, H.; Berg, P.; Christensen, P.B.; Dalsgaard, T. Seasonal carbon and nutrient mineralization in a high-Arctic coastal marine sediment, Young Sound, Northeast Greenland. Mar. Ecol. Prog. Ser. 1998, 175, 261–276. [Google Scholar] [CrossRef] [Green Version]
  53. Wrage, N.; Velthof, G.; Van Beusichem, M.; Oenema, O. Role of nitrifier denitrification in the production of nitrous oxide. Soil Biol. Biochem. 2001, 33, 1723–1732. [Google Scholar] [CrossRef]
  54. Watson, E.B.; Wigand, C.; Davey, E.W.; Andrews, H.M.; Bishop, J.; Raposa, K.B. Wetland loss patterns and inundation-productivity relationships prognosticate widespread salt marsh loss for southern New England. Estuar. Coasts 2017, 40, 662–681. [Google Scholar] [CrossRef] [PubMed]
  55. Holmer, M.; Gribsholt, B.; Kristensen, E. Effects of sea level rise on growth of Spartina anglica and oxygen dynamics in rhizosphere and salt marsh sediments. Mar. Ecol. Prog. Ser. 2002, 225, 197–204. [Google Scholar] [CrossRef]
  56. Duan, J.; Fang, H.; Su, B.; Chen, J.; Lin, J. Characterization of a halophilic heterotrophic nitrification-aerobic denitrification bacterium and its application on treatment of saline wastewater. Bioresour. Technol. 2015, 179, 421–428. [Google Scholar] [CrossRef]
  57. Sánchez-García, M.; Alburquerque, J.A.; Sánchez-Monedero, M.A.; Roig, A.; Cayuela, M.L. Biochar accelerates organic matter degradation and enhances N mineralisation during composting of poultry manure without a relevant impact on gas emissions. Bioresour. Technol. 2015, 192, 272–279. [Google Scholar] [CrossRef]
  58. Crews, T.E.; Kurina, L.M.; Vitousek, P.M. Organic matter and nitrogen accumulation and nitrogen fixation during early ecosystem development in Hawaii. Biogeochemistry 2001, 52, 259–279. [Google Scholar] [CrossRef]
  59. Tobias, C.R.; Anderson, I.C.; Canuel, E.A.; Macko, S.A. Nitrogen cycling through a fringing marsh-aquifer ecotone. Mar. Ecol. Prog. Ser. 2001, 210, 25–39. [Google Scholar] [CrossRef] [Green Version]
  60. Yando, E.S.; Osland, M.J.; Willis, J.M.; Day, R.H.; Krauss, K.W.; Hester, M.W. Salt marsh-mangrove ecotones: Using structural gradients to investigate the effects of woody plant encroachment on plant-soil interactions and ecosystem carbon pools. J. Ecol. 2016, 104, 1020–1031. [Google Scholar] [CrossRef]
  61. Lin, X.; Hou, L.; Liu, M.; Li, X.; Zheng, Y.; Yin, G.; Gao, J.; Jiang, X. Nitrogen mineralization and immobilization in sediments of the East China Sea: Spatiotemporal variations and environmental implications. J. Geophys. Res.-Biogeosci. 2016, 121, 2842–2855. [Google Scholar] [CrossRef]
  62. Ardón, M.; Morse, J.L.; Colman, B.P.; Bernhardt, E.S. Drought-induced saltwater incursion leads to increased wetland nitrogen export. Glob. Chang. Biol. 2013, 19, 2976–2985. [Google Scholar] [CrossRef] [PubMed]
  63. Lamers, L.P.; Tomassen, H.B.; Roelofs, J.G. Sulfate-induced eutrophication and phytotoxicity in freshwater wetlands. Environ. Sci. Technol. 1998, 32, 199–205. [Google Scholar]
  64. Kroeger, K.; Charette, M. Nitrogen biogeochemistry of submarine groundwater discharge. Limnol. Oceanogr. 2008, 53, 1025–1039. [Google Scholar] [CrossRef]
  65. Weston, N.B.; Giblin, A.E.; Banta, G.T.; Hopkinson, C.S.; Tucker, J. The effects of varying salinity on ammonium exchange in estuarine sediments of the Parker River, Massachusetts. Estuar. Coasts 2010, 33, 985–1003. [Google Scholar]
  66. Hou, L.; Liu, M.; Jiang, H.; Xu, S.; Ou, D.; Liu, Q.; Zhang, B. Ammonium adsorption by tidal flat surface sediments from the Yangtze Estuary. Environ. Geol. 2003, 45, 72–78. [Google Scholar]
  67. Zhou, M.; Butterbach-Bahl, K.; Vereecken, H.; Brüggemann, N. A meta-analysis of soil salinization effects on nitrogen pools, cycles and fluxes in coastal ecosystems. Glob. Chang. Biol. 2017, 23, 1338–1352. [Google Scholar] [CrossRef]
  68. Cormier, N.; Krauss, K.W.; Conner, W.H. Periodicity in stem growth and litterfall in tidal freshwater forested wetlands: Influence of salinity and drought on nitrogen recycling. Estuar. Coasts 2013, 36, 533–546. [Google Scholar] [CrossRef]
  69. Helali, M.A.; Zaaboub, N.; Oueslati, W.; Added, A.; Aleya, L. Nutrient exchange and oxygen demand at the sediment-water interface during dry and wet seasons off the Medjerda River Delta (Tunis Gulf, Tunisia). Environ. Earth Sci. 2016, 75, 1–25. [Google Scholar] [CrossRef]
  70. Hanan, E.J.; Schimel, J.P.; Dowdy, K.; D’Antonio, C.M. Effects of substrate supply, pH, and char on net nitrogen mineralization and nitrification along a wildfire-structured age gradient in chaparral. Soil Biol. Biochem. 2016, 95, 87–99. [Google Scholar] [CrossRef]
  71. Zhao, Y.; Shan, B.; Tang, W.; Zhang, H. Nitrogen mineralization and geochemical characteristics of amino acids in surface sediments of a typical polluted area in the Haihe River Basin, China. Environ. Sci. Pollut. Res. 2015, 22, 17975–17986. [Google Scholar] [CrossRef]
  72. Lin, X.; McCarthy, M.J.; Carini, S.A.; Gardner, W.S. Net, actual, and potential sediment-water interface NH4+ fluxes in the northern Gulf of Mexico (NGOMEX): Evidence for NH4+ limitation of microbial dynamics. Cont. Shelf Res. 2011, 31, 120–128. [Google Scholar] [CrossRef]
Figure 1. Study area and sampling sites.
Ijerph 16 02043 g001
Figure 2. Sedimentary concentrations along the inundation gradient for (a) total nitrogen (TN), (b) ammonium N (NH4+), and (c) nitrate N (NO3) concentrations along the hydrological gradient (mean ± SE). Different letters above bars denote significant difference among sites (p < 0.05). Sites A, B, and C refer to the high tidal flat, interaction zone between high and middle tidal flats, and middle tidal flat, respectively.
Ijerph 16 02043 g002
Figure 3. Measured (a) potential rates of nitrification (PNR), (b) potential rates of denitrification (PDNR), and (c) potential rates of mineralization (PNmin) along the hydrological gradient (mean ± SE). Different letters above bars denote significant differences among sites (p < 0.05). Sites A, B, and C refer to the high tidal flat, interaction zone between high and middle tidal flats, and middle tidal flat, respectively.
Ijerph 16 02043 g003
Figure 4. Fluxes of ammonium and nitrate at the sediment–water interface along the hydrological gradient. A positive flux means that ammonium or nitrate are released from the sediment to the overlying water, whereas a negative flux means that ammonium or nitrate are diffused from the overlying water to the sediment. Blue areas represent the ammonium or nitrate concentration of tidewater. Vertical bars represent standard errors (n = 3). Sites A, B, and C refer to the high tidal flat, interaction zone between high and middle tidal flats, and middle tidal flat, respectively.
Ijerph 16 02043 g004
Figure 5. A structural equation model (SEM) used to assess causal mechanisms among N pools, processes, and environmental parameters. (a) Effects of inundation frequency, underground biomass, total carbon (TC), electrical conductivity (EC), and clay on N processes (potential rates of nitrification (PNR), denitrification (PDNR), and mineralization (PNmin)) and (b) effects of inundation frequency, underground biomass, TC, EC, and PNmin on N pool (total N (TN), ammonium N (NH4+), and nitrate N (NO3)). The width of arrows indicates the strength of the standardized path coefficient. Black lines indicate positive path coefficients, and red lines indicate negative path coefficients. The solid lines indicate significant (p < 0.05), and dashed arrows indicate no significant difference (p > 0.05). R2 values associated with response variables indicate the proportion of variation explained by relationships with other variables.
Ijerph 16 02043 g005
Figure 6. A conceptual schematic for the fate of nitrogen pools, processes, and fluxes in a tidal flat of a coastal wetland ecosystem.
Ijerph 16 02043 g006
Table 1. Nitrogen pool, process, and flux along the gradient of different intertidal flats.
Nitrogen ProcessLocationDepth (cm)ValueDistributionReferences
N poolTN (g kg−1)Yangtze Estuary, China0–10, 40–1001.4–7.8H > M ≈ L[18]
10–40H ≈ M > L
Yangtze Estuary, China0–15H ≥ M ≈ L[17]
Petersgroden, Cäciliengroden, and Neβmersiel Germany0–152.6–6.8H > M > L[29]
Nordschweiburg and Dangast, Germany0–153.1–4.2M > L ≥ H[29]
Luoyuan Bay, China0–405.4–10.1H > M > L[30]
40–131M ≈ L > H[30]
NH4+ (mg kg−1)Tagus Estuary, Portugal0–50.004–4.1L > H[28]
Yellow River Delta, China0–101.0–6.5H ≈ M ≈ L[23]
NO3 (mg kg−1)Tagus Estuary, Portugal0–50.03–2.5L > H[28]
Yellow River Delta, China0–100.7–8.4H ≥ M ≈ L[23]
N processPNREast coast of Jutland, Denmark0–8H > L[25]
PNmin (mg kg−1 d−1)Yellow River Delta, China0–10−0.23–0.24L ≥ M ≥ H[23]
PDNR (μmol N m−2 h−1)Colne Estuary, UK0–101.1–98.2H ≈ L[27]
Mid-Atlantic Bight, North Atlantic Ocean0–80.006–0.2W17m > W15m ≈ W11m[32]
Randers Fjord and Norsminde Fjord, Denmark0–0.5W1m > W0.5m[33]
Colne Estuary and Humber Estuary, UK0–20.1–421.7H > M > L[38]
Conwy Estuary, UK0–20–108M > H > L[38]
Weeks Bay Estuarine, USA0–1921.6–33.6M ≈ L[26]
Inorganic N fluxes at the sediment–water interface.Flux of NO3 (mmol m−2 h−1)Tagus Estuary, Portugal−0.8–1.8H (–), L (+)[28]
Mid-Atlantic Bight, North Atlantic Ocean−0.01–0.02W11m (±), W15m (±), W17m (–)[32]
Randers Fjord and Norsminde Fjord, Denmark−120.0–47.0W1m (–) > W0.5m (–)[33]
Yangtze Estuary, China−0.8–0.4H (±), I (±), M (±)[11]
Flux of NH4+ (mmol m−2 h−1)Tagus Estuary, Portugal0.02–0.09H (+), L (+)[28]
Mid-Atlantic Bight, North Atlantic Ocean−0.02–0.12W11m (±), W15m (+), W17m (+)[32]
Yangtze Estuary, China −0.2–0.6H (±), I (±), M (±)[11]
Note: NH4+, NO3, TN, PNR, PDNR, and PNmin represent ammonium, nitrate, total nitrogen, nitrification, denitrification, and mineralization, respectively. The flux of NH4+ and flux of NO3 represent flux of ammonium and nitrate at the sediment–water interface. H, M, L, and I represent the high, middle, and low tidal flats and the interaction zone of high and medium tidal flat, respectively. Wxm = water deep at x m. “+” represents efflux, “−” represents uptake, and “±” represents alternation of efflux and uptake.
Table 2. Bulk density (BD), pH, electrical conductivity (EC), total carbon (TC), and grain size at each site along the in situ hydrological gradients.
Depth (cm)SitesBD (g cm−3)pH (1:5, Soil:H2O)EC (mS cm−1)TC (mg g−1)Grain Size (%)
ClaySiltSand
0–10Site A0.71 ab5.88 c3.58 a39.36 a26.94 a68.54 a4.53 a
Site B0.75 a6.45 b3.35 a24.56 b29.51 a69.59 a0.90 b
Site C0.63 b7.32 a3.29 a15.70 c20.40 a75.28 a4.32 a
10–20Site A0.89 a6.24 a2.48 a27.89 a34.51 a63.61 b1.88 a
Site B0.70 b6.50 a3.08 a21.34 b31.52 ab66.73 ab1.75 a
Site C0.75 ab7.17 a3.04 a15.37 c26.08 b71.12 a2.81 a
20–30Site A0.95 b6.60 ab2.13 b18.49 b34.98 a63.55 b1.46 a
Site B0.81 a6.41 b2.96 a22.56 a34.54 ab64.18 ab1.28 a
Site C0.85 ab7.46 a2.07 b15.01 c26.66 b70.59 a2.76 a
30–40Site A1.01 a6.81 b1.89 b17.74 b30.98 a65.99 b3.04 a
Site B0.73 b6.44 b2.65 a20.81 a32.14 ab66.48 ab1.38 a
Site C0.84 ab7.66 a1.90 b14.69 c26.96 b70.52 a2.52 a
40–50Site A1.03 a6.58 b2.00 b16.29 b25.92 a67.01 b7.08 a
Site B0.80 b6.65 b2.54 a20.93 a27.39 a69.88 ab2.73 a
Site C0.82 b7.66 a2.00 b14.58 b23.95 a72.93 a3.12 a
Note: Values are means of three replicates. Different letters denote significant differences among sites (p < 0.05). Sites A, B, and C refer to the high tidal flat, interaction zone between high and middle tidal flats, and middle tidal flat, respectively.

