Trajectory of Smoking and Incidence of Atherosclerotic Cardiovascular Disease among Korean Young Adult Men


Abstract
:1. Introduction
2. Materials and Methods
2.1. Study Design and Participants
2.2. Smoking History and Other Covariate Data
2.3. Outcome
2.4. Statistical Analysis
3. Results
4. Discussion
5. Conclusions
Supplementary Materials
Author Contributions
Funding
Conflicts of Interest
References
- Mazur, J.; Dzielska, A.; Kowalewska, A.; Fijałkowska, A. Current trends in tobacco smoking among 15-year-old adolescents in Poland in the background of 30 countries. Przegl. Lek. 2016, 73, 685–689. [Google Scholar] [PubMed]
- Jee, S.H.; Samet, J.M.; Ohrr, H.; Kim, J.H.; Kim, I.S. Smoking and cancer risk in Korean men and women. Cancer Causes Control 2004, 15, 341–348. [Google Scholar] [CrossRef] [PubMed]
- Korea Health Statistics 2017: Korea National Health and Nutrition Examination Survey (KNHANES Ⅶ-2). Available online: http://knhanes.cdc.go.kr/ (accessed on 7 October 2018).
- Lenk, K.M.; Erickson, D.J.; Forster, J.L. Trajectories of Cigarette Smoking From Teens to Young Adulthood: 2000 to 2013. Am. J. Health Promot. 2018, 32, 1214–1220. [Google Scholar] [CrossRef] [PubMed]
- Selya, A.S.; Dierker, L.; Rose, J.S.; Hedeker, D.; Mermelstein, R.J. Early-Emerging Nicotine Dependence Has Lasting and Time-Varying Effects on Adolescent Smoking Behavior. Prev. Sci. 2016, 17, 743–750. [Google Scholar] [CrossRef] [PubMed] [Green Version]
- Dziak, J.J.; Li, R.; Tan, X.; Shiffman, S.; Shiyko, M.P. Modeling intensive longitudinal data with mixtures of nonparametric trajectories and time-varying effects. Psychol. Methods 2015, 20, 444–469. [Google Scholar] [CrossRef] [PubMed]
- Thut, A.B.; Blizzard, L.; Schmidt, M.D.; Luc, P.H.; Granger, R.H.; Dwyer, T. The association Between smoking and hypertension in a population-based sample of Vietnamese men. J. Hypertens. 2010, 28, 245–250. [Google Scholar]
- Kim, B.J.; Seo, D.C.; Kim, B.S.; Kang, J.H. Relationship between cotinine-verified smoking status and incidence of hypertension in 74,743 Korean adults. Circ. J. 2018, 821, 659–1665. [Google Scholar] [CrossRef] [PubMed]
- Morotti, E.; Battaglia, B.; Fabbri, R.; Paradisi, R.; Venturoli, S.; Battaglia, C. Cigarette smoking and cardiovascular risk in young women with polycystic ovary syndrome. Int. J. Fertil. Steril. 2014, 7, 301–312. [Google Scholar]
- Bucholz, E.M.; Gooding, H.C.; de Ferranti, S.D. Awareness of Cardiovascular Risk Factors in U.S. Young Adults Aged 18–39 Years. Am. J. Prev. Med. 2018, 54, e67–e77. [Google Scholar] [CrossRef]
- Jee, S.H.; Suh, I.; Kim, I.S.; Appel, L.J. Smoking and atherosclerotic cardiovascular disease in men with low levels of serum cholesterol: The Korea Medical Insurance Corporation Study. JAMA 1999, 282, 2149–2155. [Google Scholar] [CrossRef]
- Kimm, H.; Yun, J.E.; Lee, S.H.; Jang, Y.; Jee, S.H. Validity of the diagnosis of acute myocardial infarction in Korean national medical health insurance claims data: The Korean Heart Study (1). Korean Circ. J. 2012, 42, 10–15. [Google Scholar] [CrossRef] [PubMed]
- Conklin, C.A.; Perkins, K.A.; Sheidow, A.J.; Jones, B.L.; Levine, M.D.; Marcus, M.D. The return to smoking: 1-year relapse trajectories among female smokers. Nicotine Tob. Res. 2005, 7, 533–540. [Google Scholar] [CrossRef] [PubMed]
- Nagin, D.S.; Odgers, C.L. Group-based trajectory modeling in clinical research. Annu. Rev. Clin. Psychol. 2010, 6, 109–138. [Google Scholar] [CrossRef] [PubMed]
- Raftery, A.E. Bayesian model selection in social research. Sociol. Methodol. 1995, 25, 111–164. [Google Scholar] [CrossRef]
- Schwartz, G. Estimating the dimension of a model. Ann. Stat. 1978, 6, 461–466. [Google Scholar] [CrossRef]
- Stokes, A.; Preston, S.H. Smoking and reverse causation create an obesity paradox in cardiovascular disease. Obesity 2015, 23, 2485–2490. [Google Scholar] [CrossRef] [PubMed] [Green Version]
- Shields, M.; Wilkins, K. Smoking, smoking cessation and heart disease risk: A 16-year follow-up study. Health Rep. 2013, 24, 12–22. [Google Scholar]
- Kawachi, I.; Colditz, G.A.; Stampfer, M.J.; Willett, W.C.; Manson, J.E.; Rosner, B.; Speizer, F.E.; Hennekens, C.H. Smoking cessation and time course of decreased risks of coronary heart disease in middle-aged women. Arch. Intern. Med. 1994, 154, 169–175. [Google Scholar] [CrossRef]
- Weuve, J.; Tchetgen, E.J.T.; Glymour, M.M.; Beck, T.L.; Aggarwal, N.T.; Wilson, R.S.; Evans, D.A.; Mendes de Leon, C.F. Accounting for bias due to selective attrition: The example of smoking and cognitive decline. Epidemiology 2012, 23, 119–128. [Google Scholar] [CrossRef]
- Kamimura, A.; Ahmmad, Z.; Pye, M.; Gull, B. Peer Smoking and Smoking-related Beliefs Among College Students in Bangladesh. J. Prev. Med. Public Health 2018, 51, 51–58. [Google Scholar] [CrossRef] [Green Version]
- Roh, S. Scientific Evidence for the Addictiveness of Tobacco and Smoking Cessation in Tobacco Litigation. J. Prev. Med. Public Health 2018, 51, 1–5. [Google Scholar] [CrossRef] [PubMed] [Green Version]
- Nemeth, J.M.; Thomson, T.L.; Lu, B.; Peng, J.; Krebs, V.; Doogan, N.J.; Ferketich, A.K.; Post, D.M.; Browning, C.R.; Paskett, E.D.; et al. A social-contextual investigation of smoking among rural women: Multi-level factors associated with smoking status and considerations for cessation. Rural Remote Health 2018, 18, 4338. [Google Scholar] [CrossRef] [PubMed]
- Kim, B.J.; Cho, Y.J.; Hong, K.S.; Lee, J.; Kim, J.T.; Choi, K.H.; Park, T.H.; Park, S.S.; Park, J.M.; Kang, K.; et al. Trajectory Groups of 24-Hour Systolic Blood Pressure After Acute Ischemic Stroke and Recurrent Vascular Events. Stroke 2018, 49, 1836–1842. [Google Scholar] [CrossRef] [PubMed]


| Trajectory Group | |||||
|---|---|---|---|---|---|
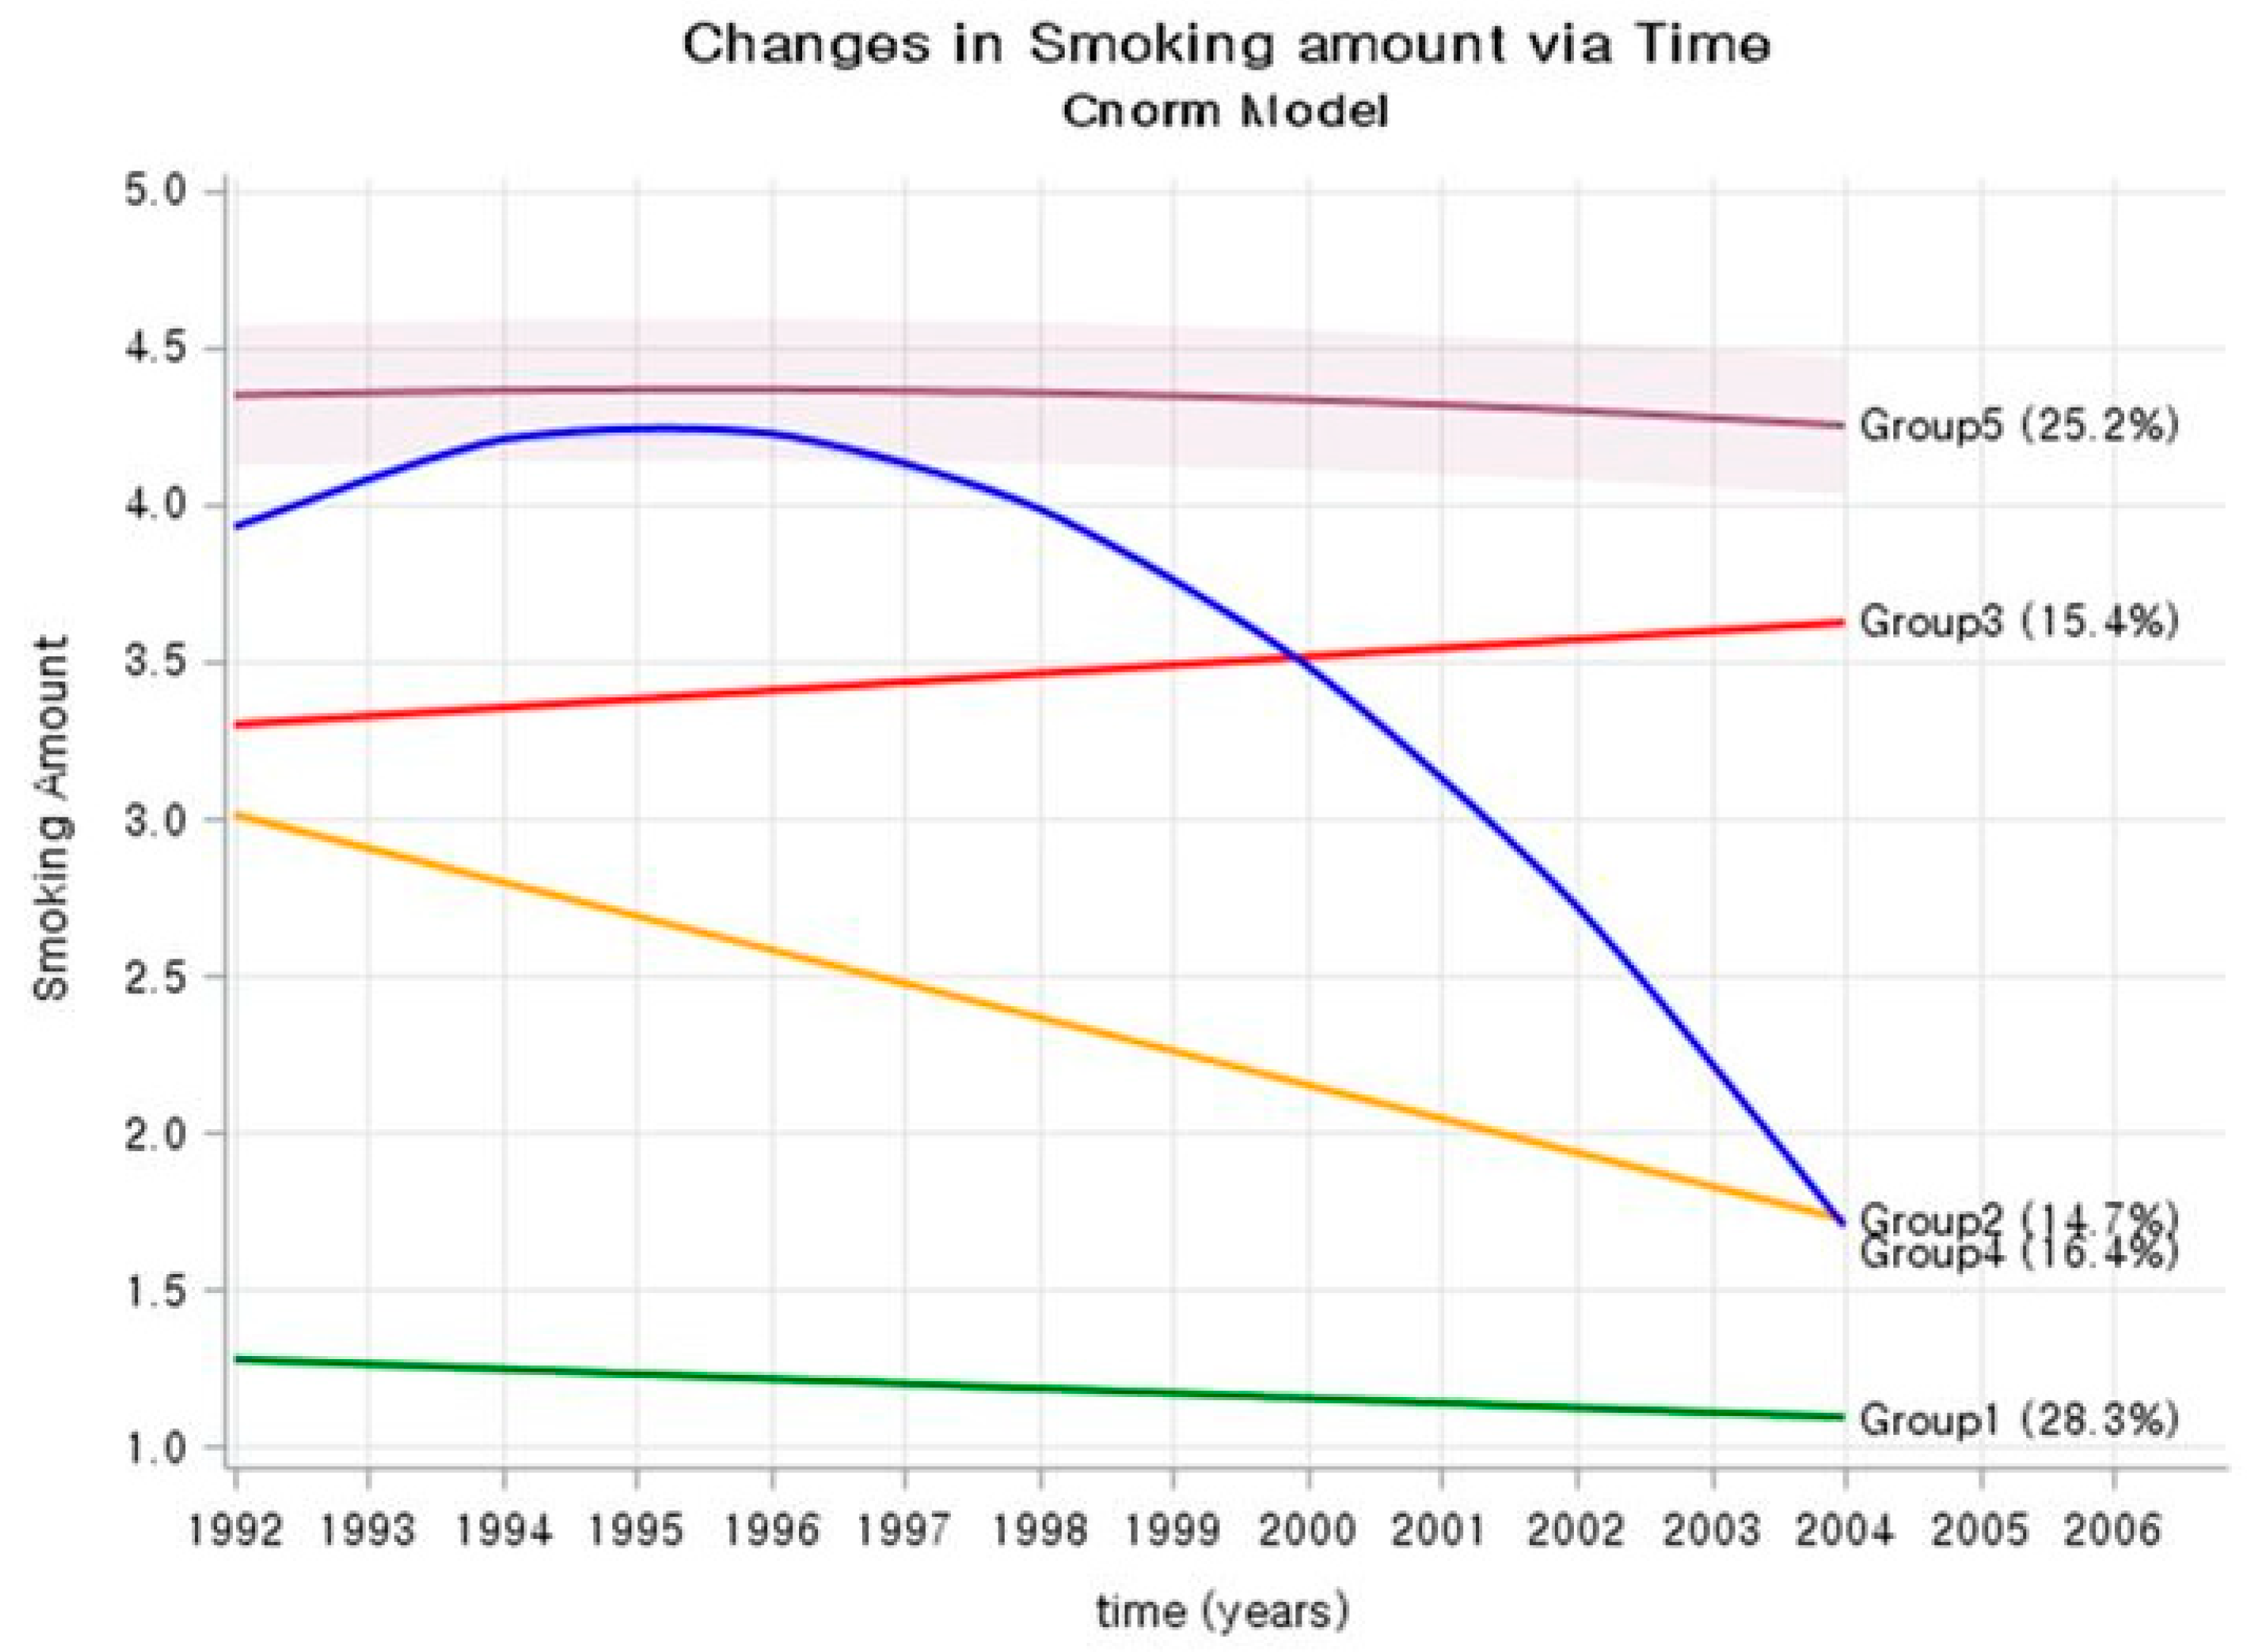
| Group 1 Low Steady | Group 2 Lowering | Group 3 High Steady | Group 4 Rise and Fall | Group 5 Very high Steady | |
| Number (%) | 17,158 (28.3) | 8934 (14.7) | 10,479 (17.3) | 9461 (15.6) | 14,679 (24.2) |
| Age, mean, (1992–1994) | 26.9 | 27.0 | 26.9 | 27.1 | 26.9 |
| BMI, kg/m2 (1992–1994) | 22.3 | 22.3 | 22.2 | 22.6 | 22.7 |
| BMI, kg/m2 (2002–2004) | 24.1 | 24.2 | 24.1 | 24.7 | 24.5 |
| SBP, mmHg (1992–1994) | 120.2 | 119.4 | 119.2 | 120.1 | 120.0 |
| SBP, mmHg (2002–2004) | 122.6 | 122.6 | 122.5 | 124.2 | 123.7 |
| FBG, mg/dL (1992–1994) | 86.5 | 86.1 | 85.8 | 86.3 | 86.2 |
| FBG, mg/dL (2002–2004) | 90.7 | 91.4 | 91.8 | 93.1 | 93.3 |
| TC, mg/dL (1992–1994) | 174.0 | 173.5 | 174.0 | 176.1 | 176.4 |
| TC, mg/dL (2002–2004) | 192.7 | 193.8 | 194.7 | 199.2 | 197.7 |
| Alcohol drinking (%) | 67.5 | 83.8 | 83.6 | 84.5 | 85.3 |
| Exercise (%) | 22.1 | 19.1 | 20.0 | 15.1 | 13.4 |
| Smoking status (1992) | |||||
| Non-smoker | 72.6 | 2.4 | 3.8 | 0.7 | 0.3 |
| Ex-smoker | 24.7 | 24.8 | 8.5 | 2.7 | 0.7 |
| 1–9 cig/day | 2.3 | 43.1 | 46.3 | 16.6 | 4.9 |
| 10–19 cig/day | 0.3 | 23.8 | 36.2 | 50.1 | 49.5 |
| ≥20 cig/day | 0.1 | 6.1 | 5.3 | 29.9 | 44.7 |
| Smoking status (2004) | |||||
| Non-smoker | 91.6 | 38.3 | 0.2 | 43.8 | 0.0 |
| Ex-smoker | 6.2 | 47.5 | 6.5 | 51.6 | 2.1 |
| 1–9 cig/day | 1.7 | 11.9 | 28.5 | 3.5 | 2.6 |
| 10–19 cig/day | 0.4 | 2.2 | 59.4 | 1.1 | 55.2 |
| ≥20 cig/day | 0.1 | 0.1 | 5.3 | 0.0 | 40.1 |
| HR (95% CI) in Model 1 | HR (95% CI) in Model 2 | |
|---|---|---|
| Baseline variables (1992–1994) | ||
| Age, year | 1.03 (1.01–1.06) | 1.03 (1.01–1.06) |
| Body mass index, kg/m2 | 1.09 (1.07–1.11) | 1.09 (1.07–1.11) |
| Smoking status | ||
| Non-smoker | 1.00 | 1.00 |
| Former smokers | 1.13 (0.97–1.31) | 1.12 (0.97–1.30) |
| Current smokers | 1.22 (1.09–1.36) | - |
| 1–9 cig/day | - | 1.07 (0.94–1.23) |
| 10–19 cig/day | - | 1.12 (0.99–1.27) |
| ≥20 cig/day | 1.52 (1.34–1.73) | |
| Alcohol drinking (yes) | 1.00 (0.90–1.11) | 1.01 (0.91–1.12) |
| Exercise (yes) | 0.93 (0.83–1.03) | 0.95 (0.85–1.05) |
| Systolic BP, per 10 mmHg | 1.17 (1.13–1.21) | 1.17 (1.13–1.21) |
| Serum glucose, per 10 mg/dL | 0.99 (0.96–1.02) | 0.99 (0.96–1.02) |
| Total cholesterol, per 10 mg/dL | 1.06 (1.04–1.07) | 1.05 (1.04–1.07) |
| Number of participants | 60,709 | 60,709 |
| Number ASCVD event | 2392 | 2392 |
| AIC | 51,880.44 (DF = 9) | 51846.84 (DF = 11) |
| Difference in AIC | 33.6 (DF = 2); p < 0.0001 |
| HR (95% CI) in Model 1 | HR (95% CI) in Model 2 | |
|---|---|---|
| Trajectory group (1992–2004) | ||
| Group 1 (Low steady) | 1.0 | 1.0 |
| Group 2 (Lowering) | 1.05 (0.92–1.20) | 1.05 (0.92–1.20) |
| Group 3 (High steady) | 1.11 (0.98–1.25) | 1.09 (0.97–1.23) |
| Group 4 (Rise and fall) | 1.13 (0.99–1.29) | 1.10 (0.96–1.25) |
| Group 5 (Very high steady) | 1.49 (1.33–1.68) | 1.46 (1.30–1.64) |
| Baseline variables (1992–1994) | ||
| Age, year | 1.04 (1.02–1.06) | 1.04 (1.02–1.06) |
| Body mass index, kg/m2 | 1.09 (1.07–1.11) | 1.07 (1.05–1.08) |
| Alcohol drinking | 1.01 (0.91–1.12) | 0.98 (0.88–1.09) |
| Exercise | 0.94 (0.85–1.05) | 0.96 (0.86–1.07) |
| Systolic BP, per 10 mmHg | 1.17 (1.13–1.21) | 1.10 (1.06–1.14) |
| Serum glucose, per 10 mg/dL | 0.99 (0.96–1.02) | 0.98 (0.95–1.01) |
| Total cholesterol, per 10 mg/dL | 1.05 (1.04–1.07) | 1.04 (1.02–1.05) |
| Mediators (2002–2004) | ||
| Systolic BP, per 10 mmHg | 1.19 (1.15–1.22) | |
| Serum glucose, per 10 mg/dL | 1.03 (1.01–1.04) | |
| Total cholesterol, per 10 mg/dL | 1.05 (1.02–1.04) | |
| Number of participants | 60,709 | 60,709 |
| Number ASCVD event | 2392 | 2392 |
| AIC | 51,847.85 (DF = 11) | 51670.78 (DF = 14) |
| Difference in AIC | 177.07 (DF = 3); p < 0.0001 |
| Ischemic Heart Disease | Total Stroke | Ischemic Stroke | Hemorrhagic Stroke | |
|---|---|---|---|---|
| HR (95% CI) | HR (95% CI) | HR (95% CI) | HR (95% CI) | |
| Trajectory group (1992–2004) | ||||
| Group 1 (Low steady) | 1.0 | 1.0 | 1.0 | 1.0 |
| Group 2 (Lowering) | 1.18 (0.99–1.39) | 0.99 (0.81–1.22) | 1.03 (0.74–1.44) | 0.79 (0.54–1.16) |
| Group 3 (High steady) | 1.14 (0.94–1.38) | 0.95 (0.75–1.21) | 0.96 (0.66–1.42) | 0.68 (0.43–1.09) |
| Group 4 (Rise and fall) | 1.31 (1.09–1.57) | 1.01 (0.81–1.26) | 1.00 (0.69–1.44) | 1.05 (0.71–1.56) |
| Group 5 (Very high steady) | 1.63 (1.39–1.92) | 1.36 (1.11–1.66) | 1.58 (1.16–2.16) | 1.07 (0.75–1.59) |
| Baseline variables (1992–1994) | ||||
| Age, year | 1.05 (1.02–1.09) | 1.05 (1.01–1.09) | 1.07 (1.01–1.14) | 1.02 (0.95–1.09) |
| Body mass index, kg/m2 | 1.07 (1.05–1.10) | 1.03 (1.00–1.06) | 1.07 (1.02–1.11) | 0.96 (0.91–1.02) |
| Alcohol drinking | 0.89 (0.77–1.02) | 1.10 (0.91–1.32) | 1.03 (0.77–1.38) | 1.39 (0.95–2.02) |
| Exercise | 0.92 (0.79–1.02) | 0.96 (0.80–1.16) | 0.94 (0.70–1.27) | 1.19 (0.85–1.66) |
| Systolic BP, per 10 mmHg | 1.09 (1.06–1.14) | 1.10 (1.03–1.16) | 1.09 (0.99–1.20) | 1.11 (1.00–1.25) |
| Serum glucose, per 10 mg/dL | 0.98 (0.94–1.02) | 0.95 (0.91–1.01) | 0.90 (0.83–0.96) | 1.05 (0.96–1.14) |
| Total cholesterol, per 10 mg/dL | 1.04 (1.02–1.06) | 1.03 (1.01–1.06) | 1.06 (1.02–1.10) | 1.00 (0.96–1.05) |
| Mediators (2002–2004) | ||||
| Systolic BP, per 10 mmHg | 1.10 (1.05–1.14) | 1.29 (1.23–1.36) | 1.20 (1.20–1.39) | 1.45 (1.33–1.58) |
| Serum glucose, per 10 mg/dL | 1.04 (1.02–1.06) | 1.03 (1.00–1.06) | 1.04 (1.01–1.06) | 1.01 (0.96–1.07) |
| Total cholesterol, per 10 mg/dL | 1.04 (1.02–1.06) | 1.01 (0.96–1.04) | 1.04 (1.01–1.07) | 0.98 (0.94–1.02) |
| Number of participants | 60,709 | 60,709 | 60,709 | 60,709 |
| Number event | 1246 | 795 | 316 | 222 |
| AIC | 26,970.28 (DF = 14) | 17,156.18 (DF = 14) | 6773.87 (DF = 14) | 4789.69 (DF = 14) |
© 2019 by the authors. Licensee MDPI, Basel, Switzerland. This article is an open access article distributed under the terms and conditions of the Creative Commons Attribution (CC BY) license (http://creativecommons.org/licenses/by/4.0/).
Share and Cite
Jee, Y.; Jeon, J.; Back, J.H.; Ryu, M.; Cho, S.-i. Trajectory of Smoking and Incidence of Atherosclerotic Cardiovascular Disease among Korean Young Adult Men. Int. J. Environ. Res. Public Health 2019, 16, 2219. https://0-doi-org.brum.beds.ac.uk/10.3390/ijerph16122219
Jee Y, Jeon J, Back JH, Ryu M, Cho S-i. Trajectory of Smoking and Incidence of Atherosclerotic Cardiovascular Disease among Korean Young Adult Men. International Journal of Environmental Research and Public Health. 2019; 16(12):2219. https://0-doi-org.brum.beds.ac.uk/10.3390/ijerph16122219
Chicago/Turabian StyleJee, Yongho, Jooeun Jeon, Joung Hwan Back, Mikyung Ryu, and Sung-il Cho. 2019. "Trajectory of Smoking and Incidence of Atherosclerotic Cardiovascular Disease among Korean Young Adult Men" International Journal of Environmental Research and Public Health 16, no. 12: 2219. https://0-doi-org.brum.beds.ac.uk/10.3390/ijerph16122219