Sustainability Indicators Concerning Waste Management for Implementation of the Circular Economy Model on the University of Lome (Togo) Campus


Abstract
:
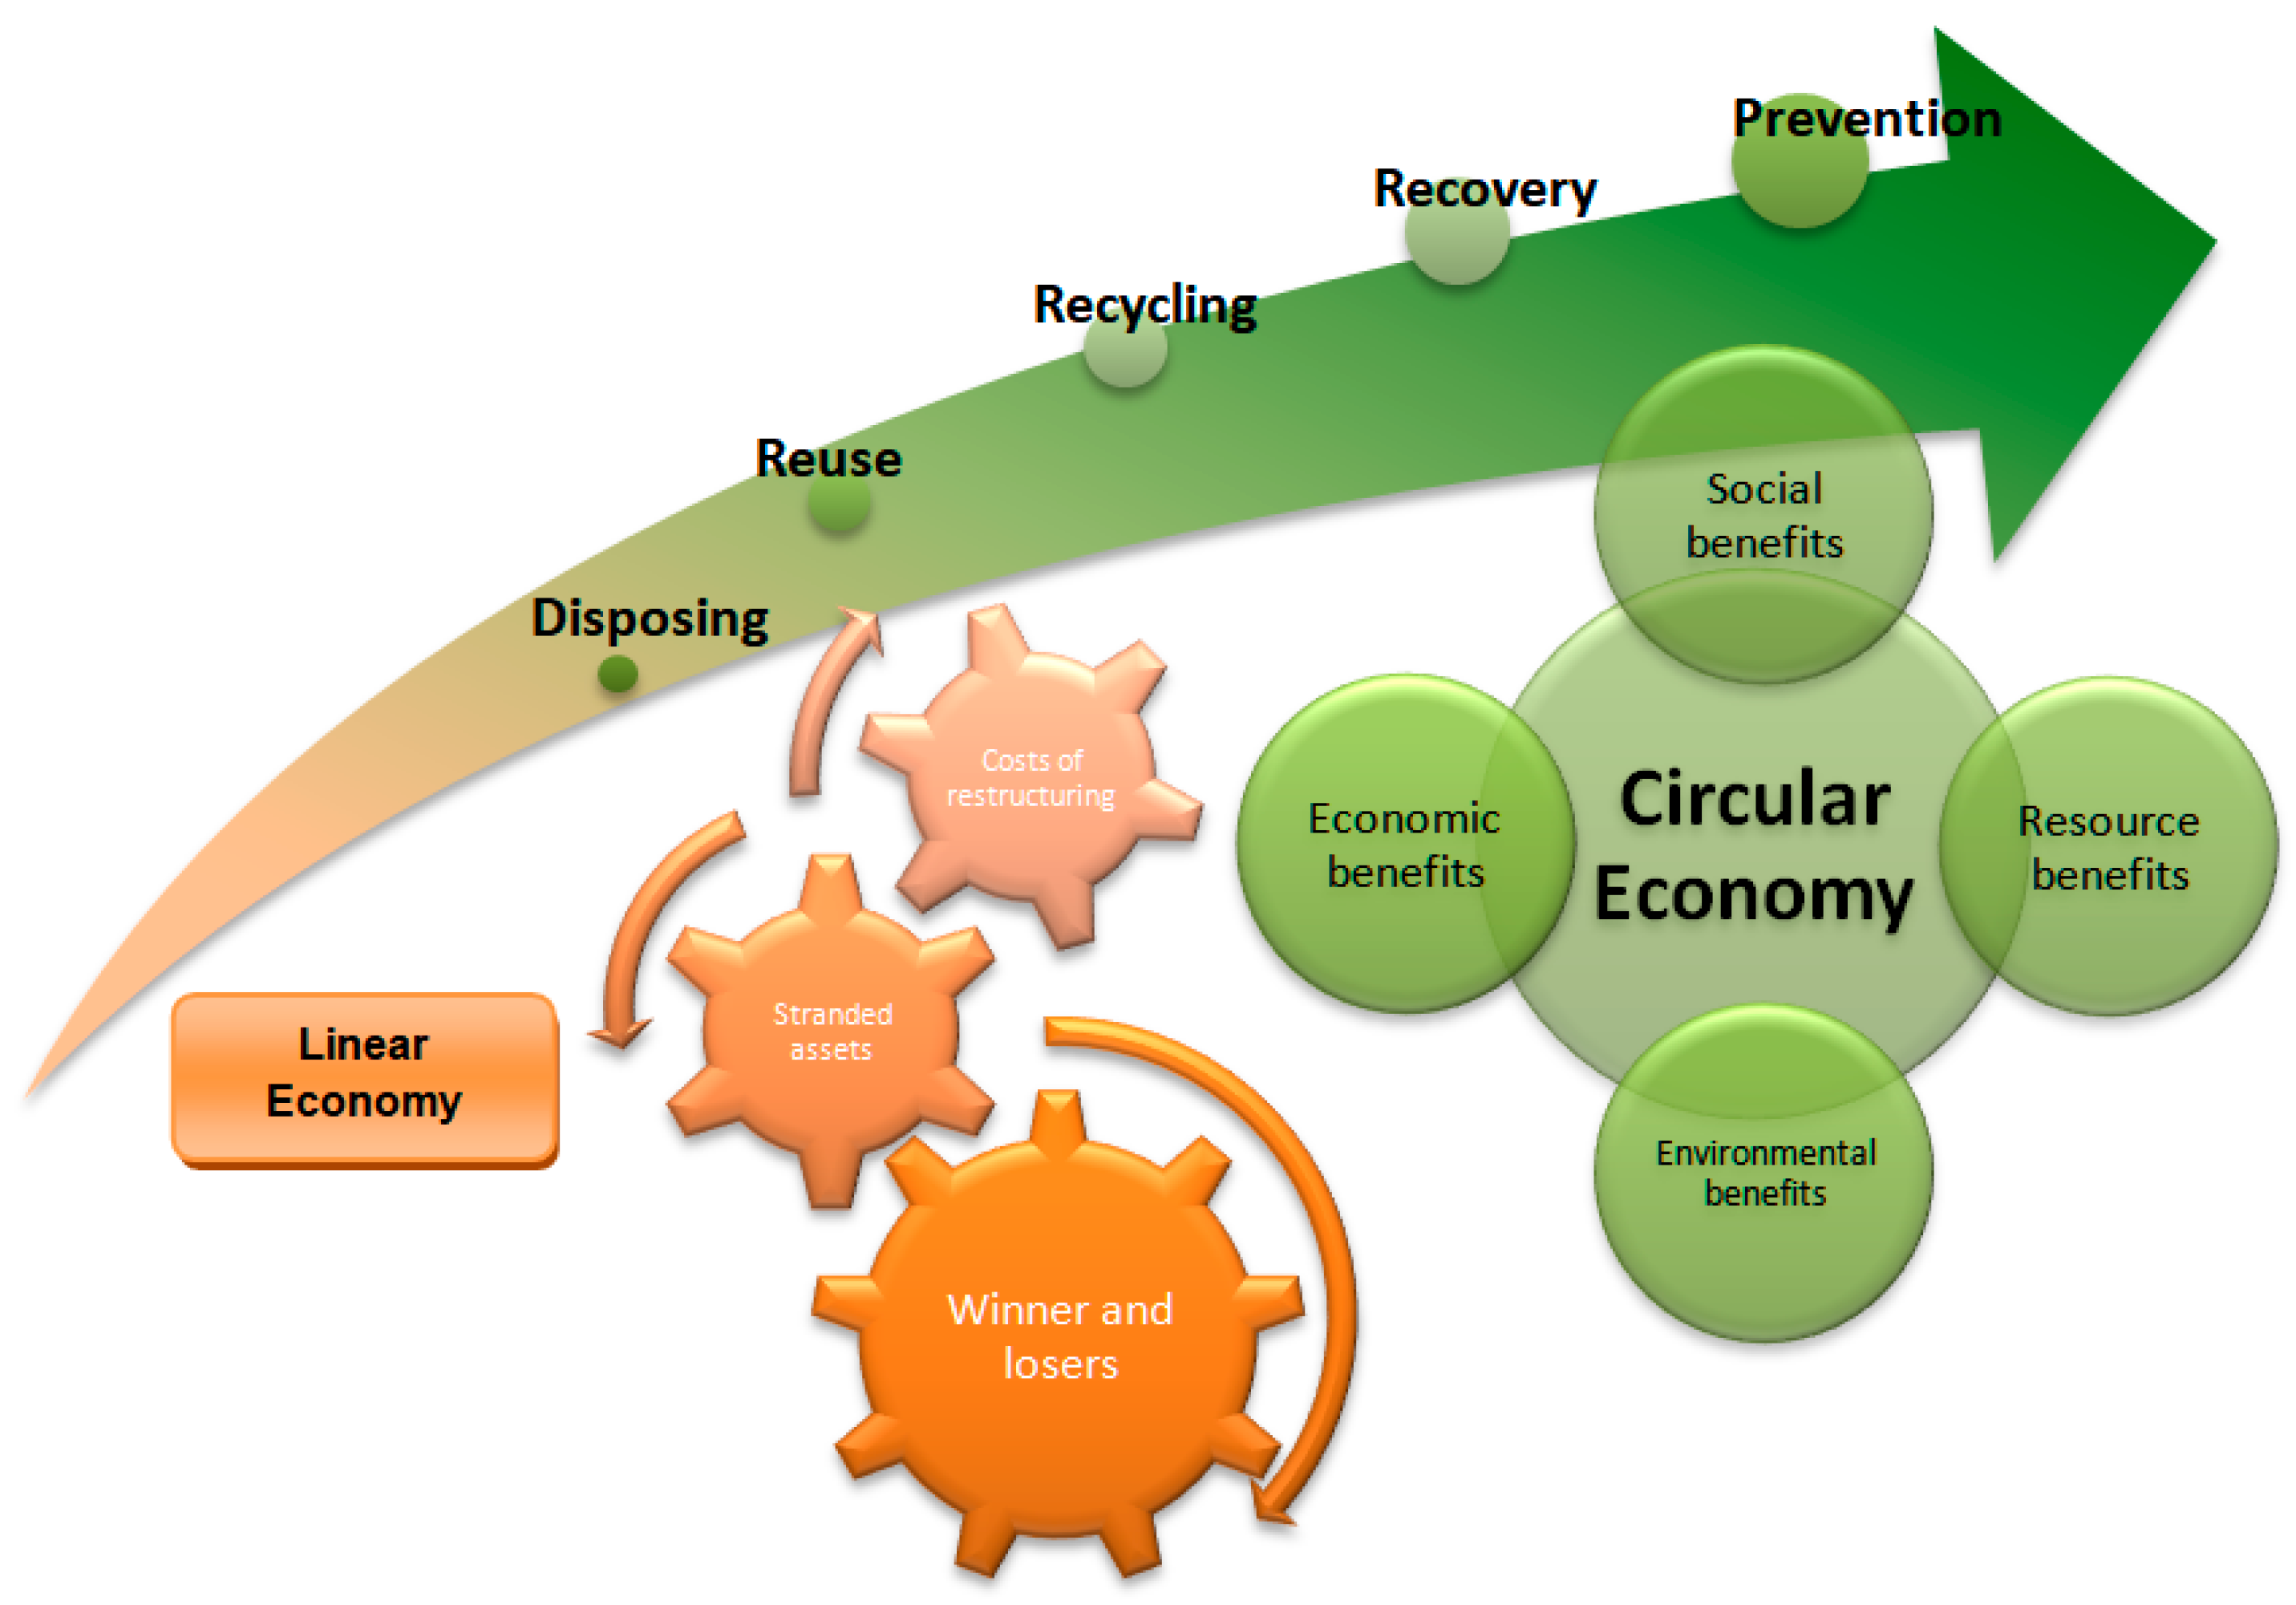
1. Introduction
2. Materials and Methods
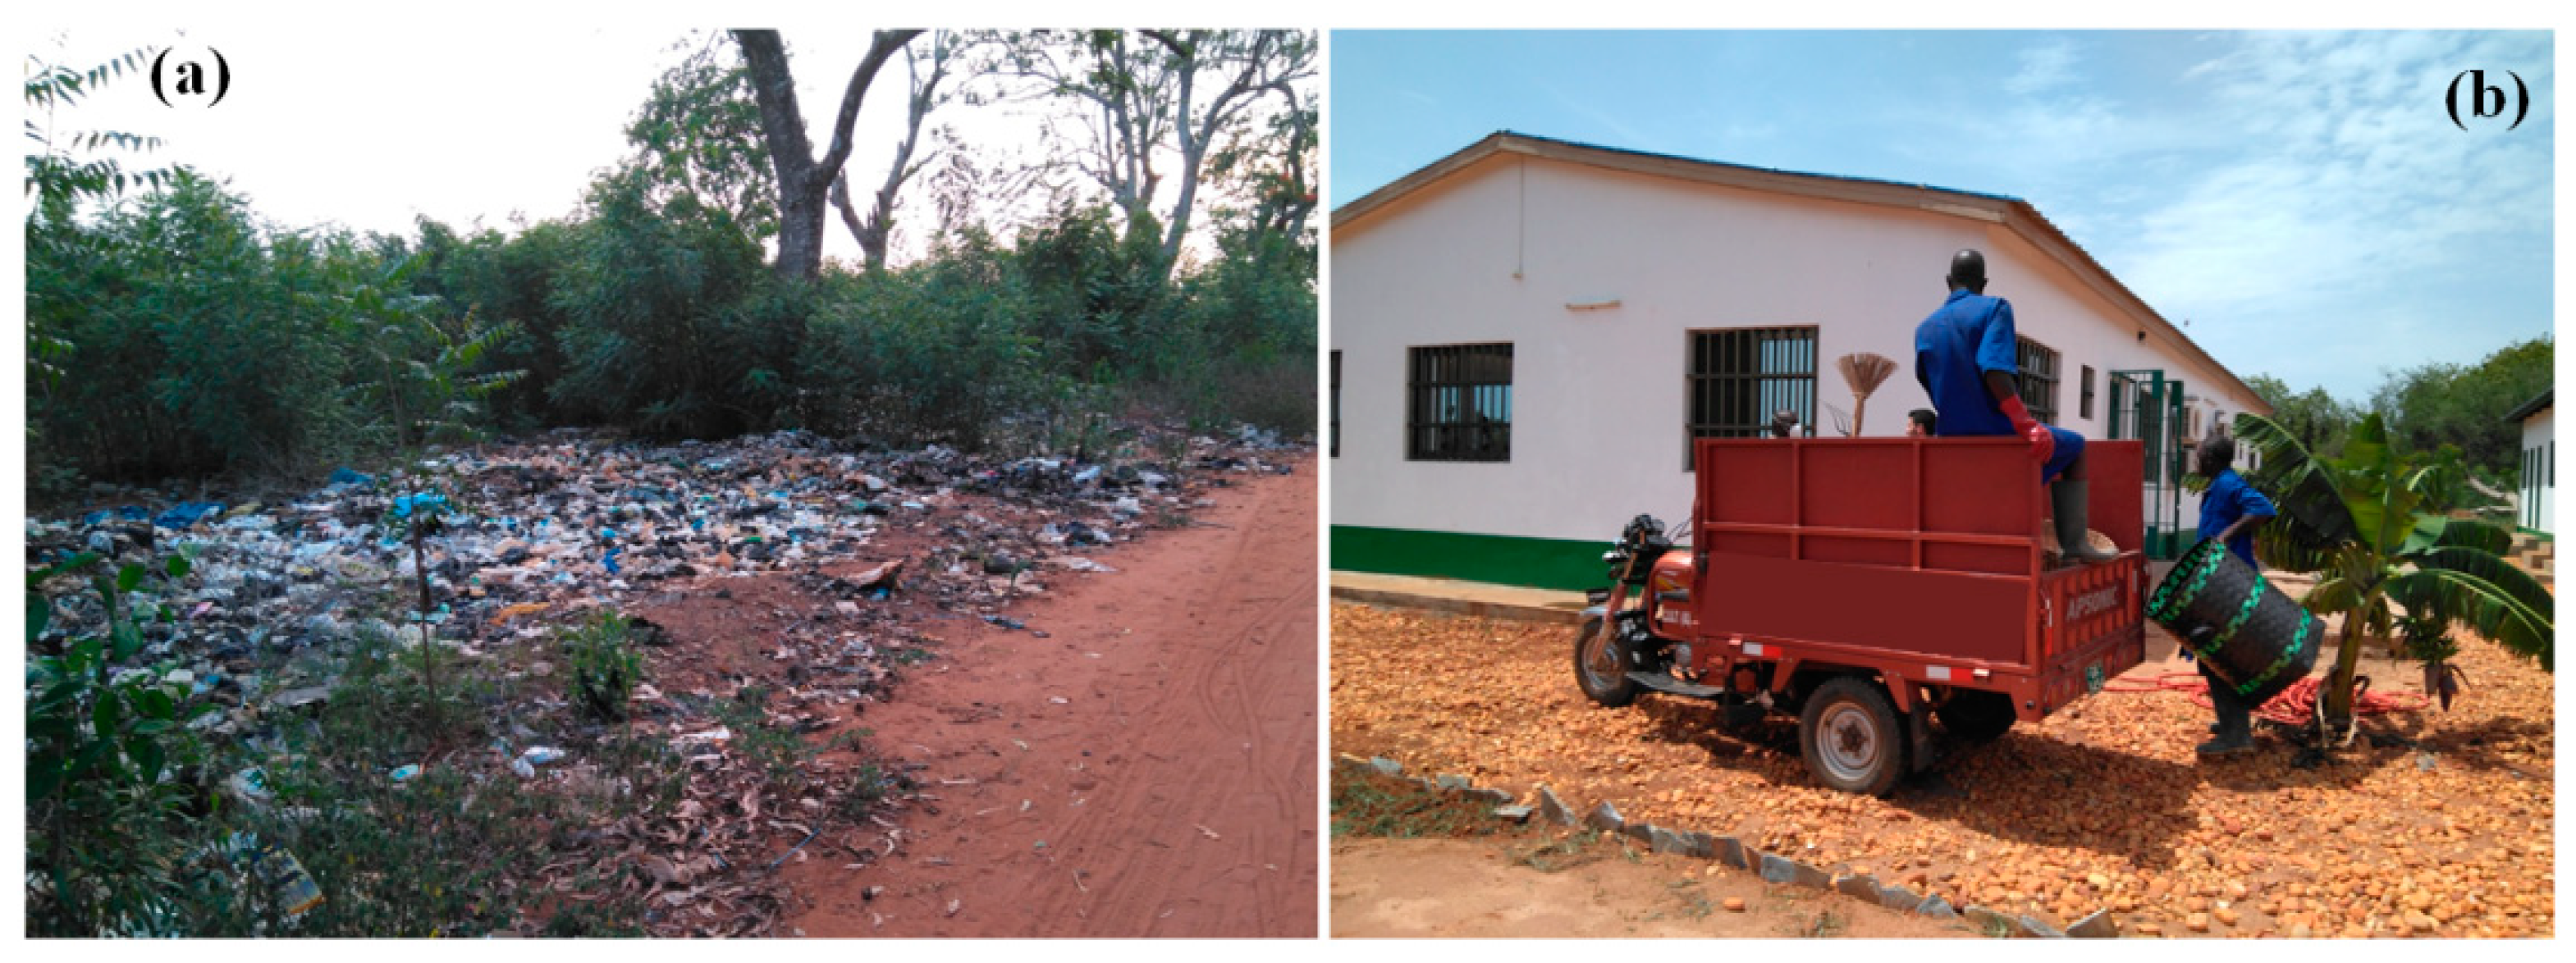
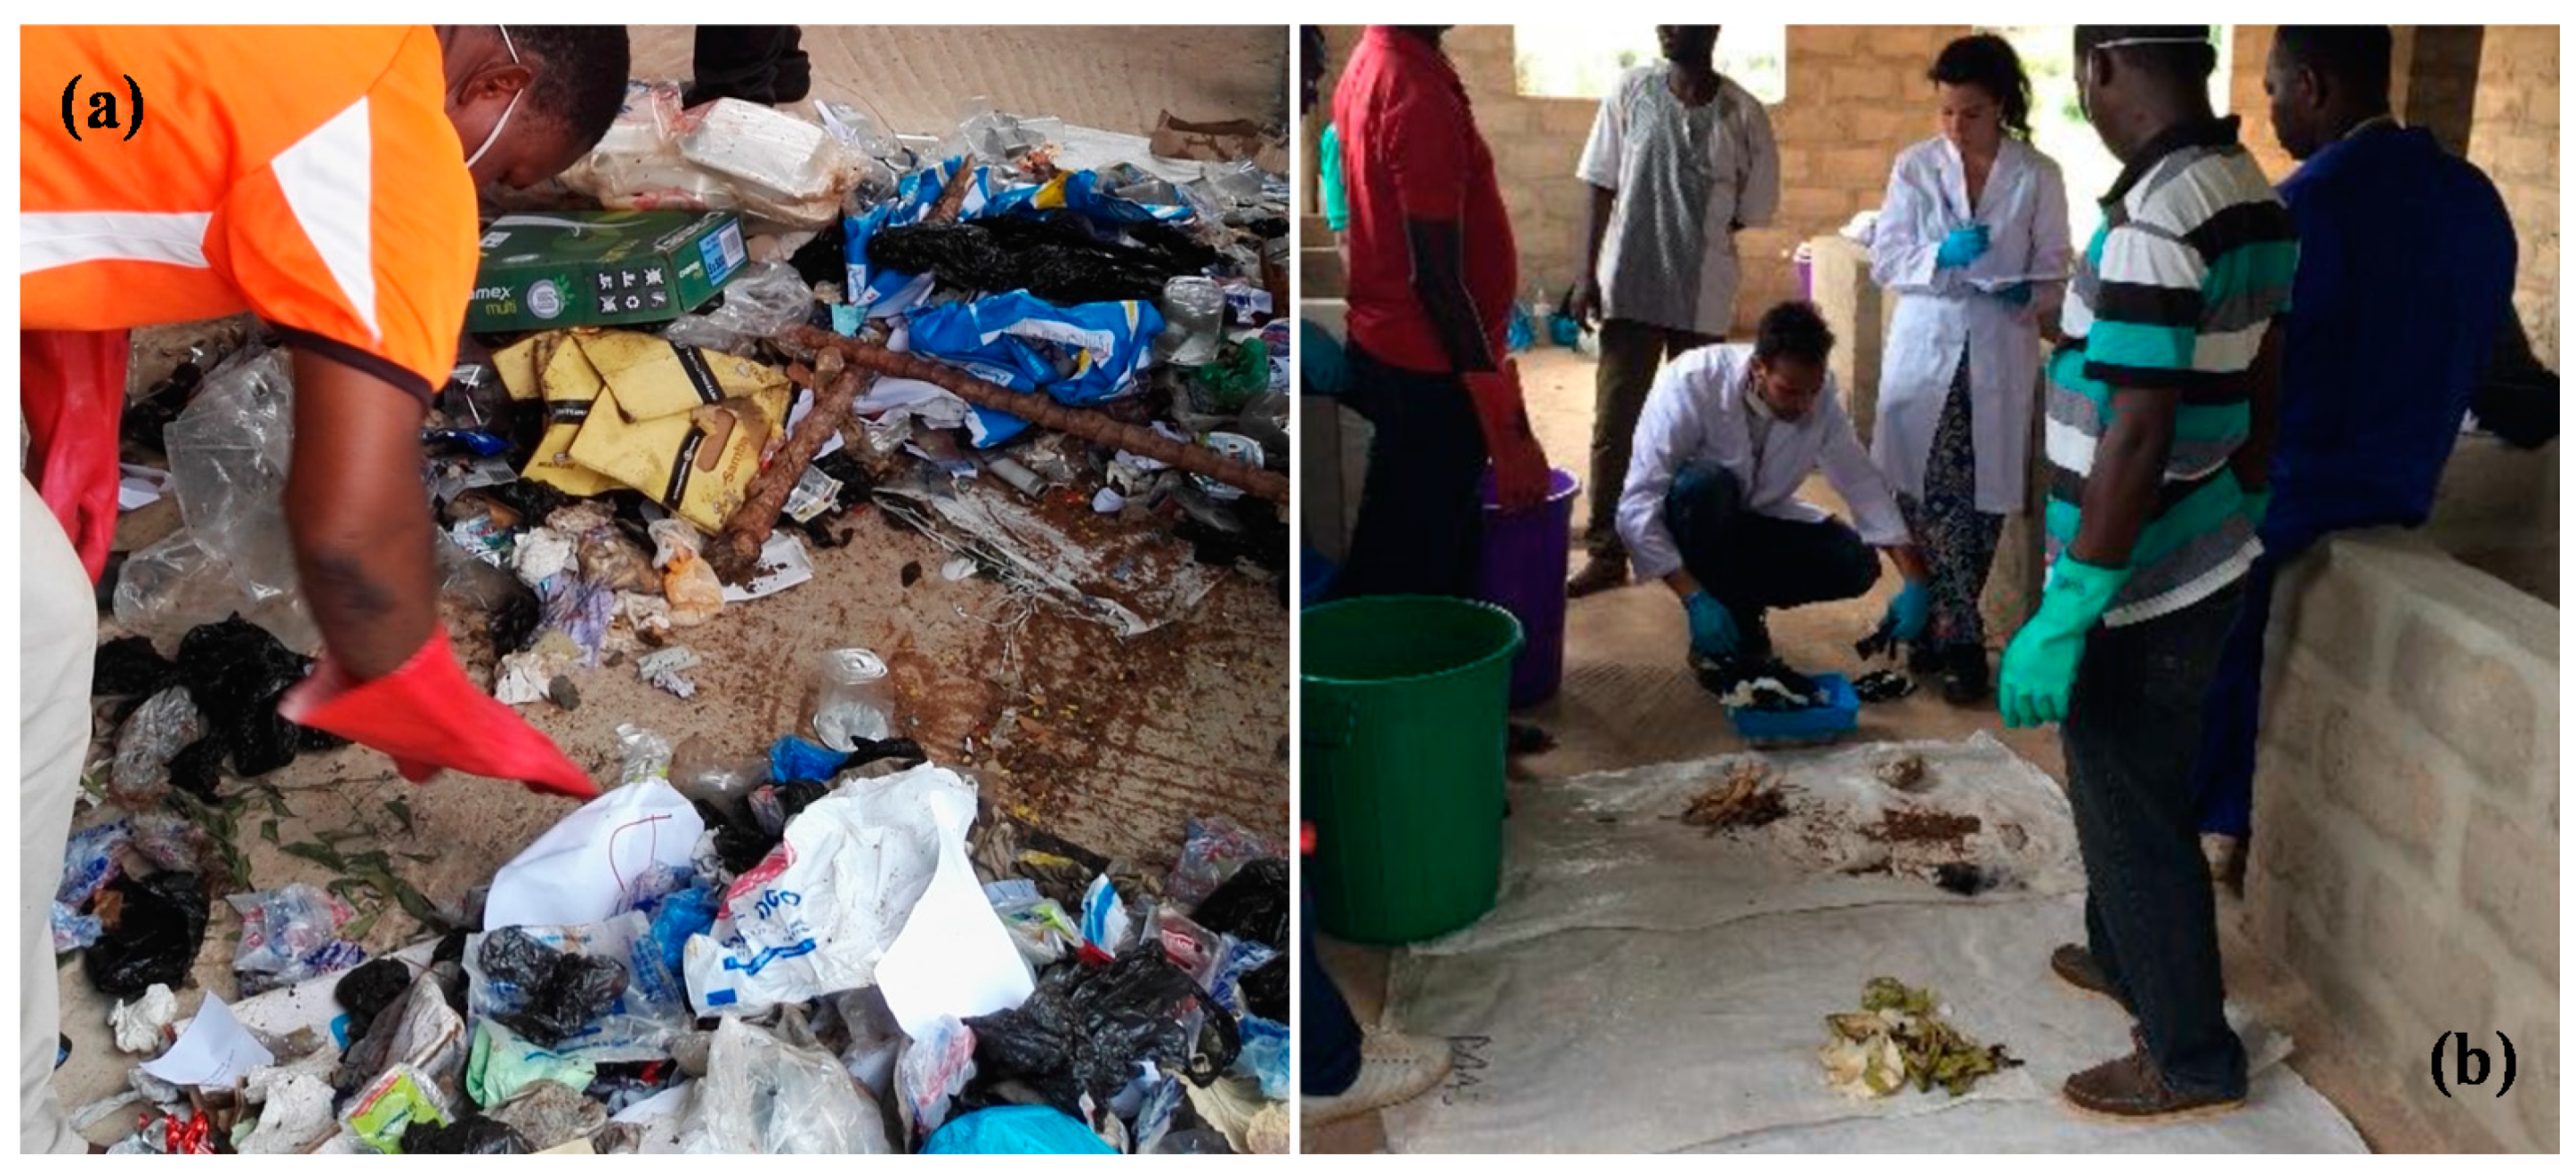
2.1. Urban Solid Waste Generation at the University of Lome
- ➢
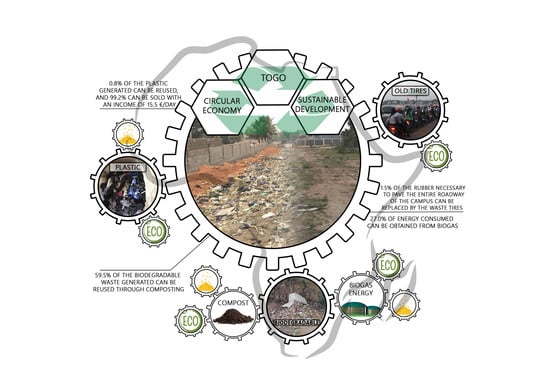
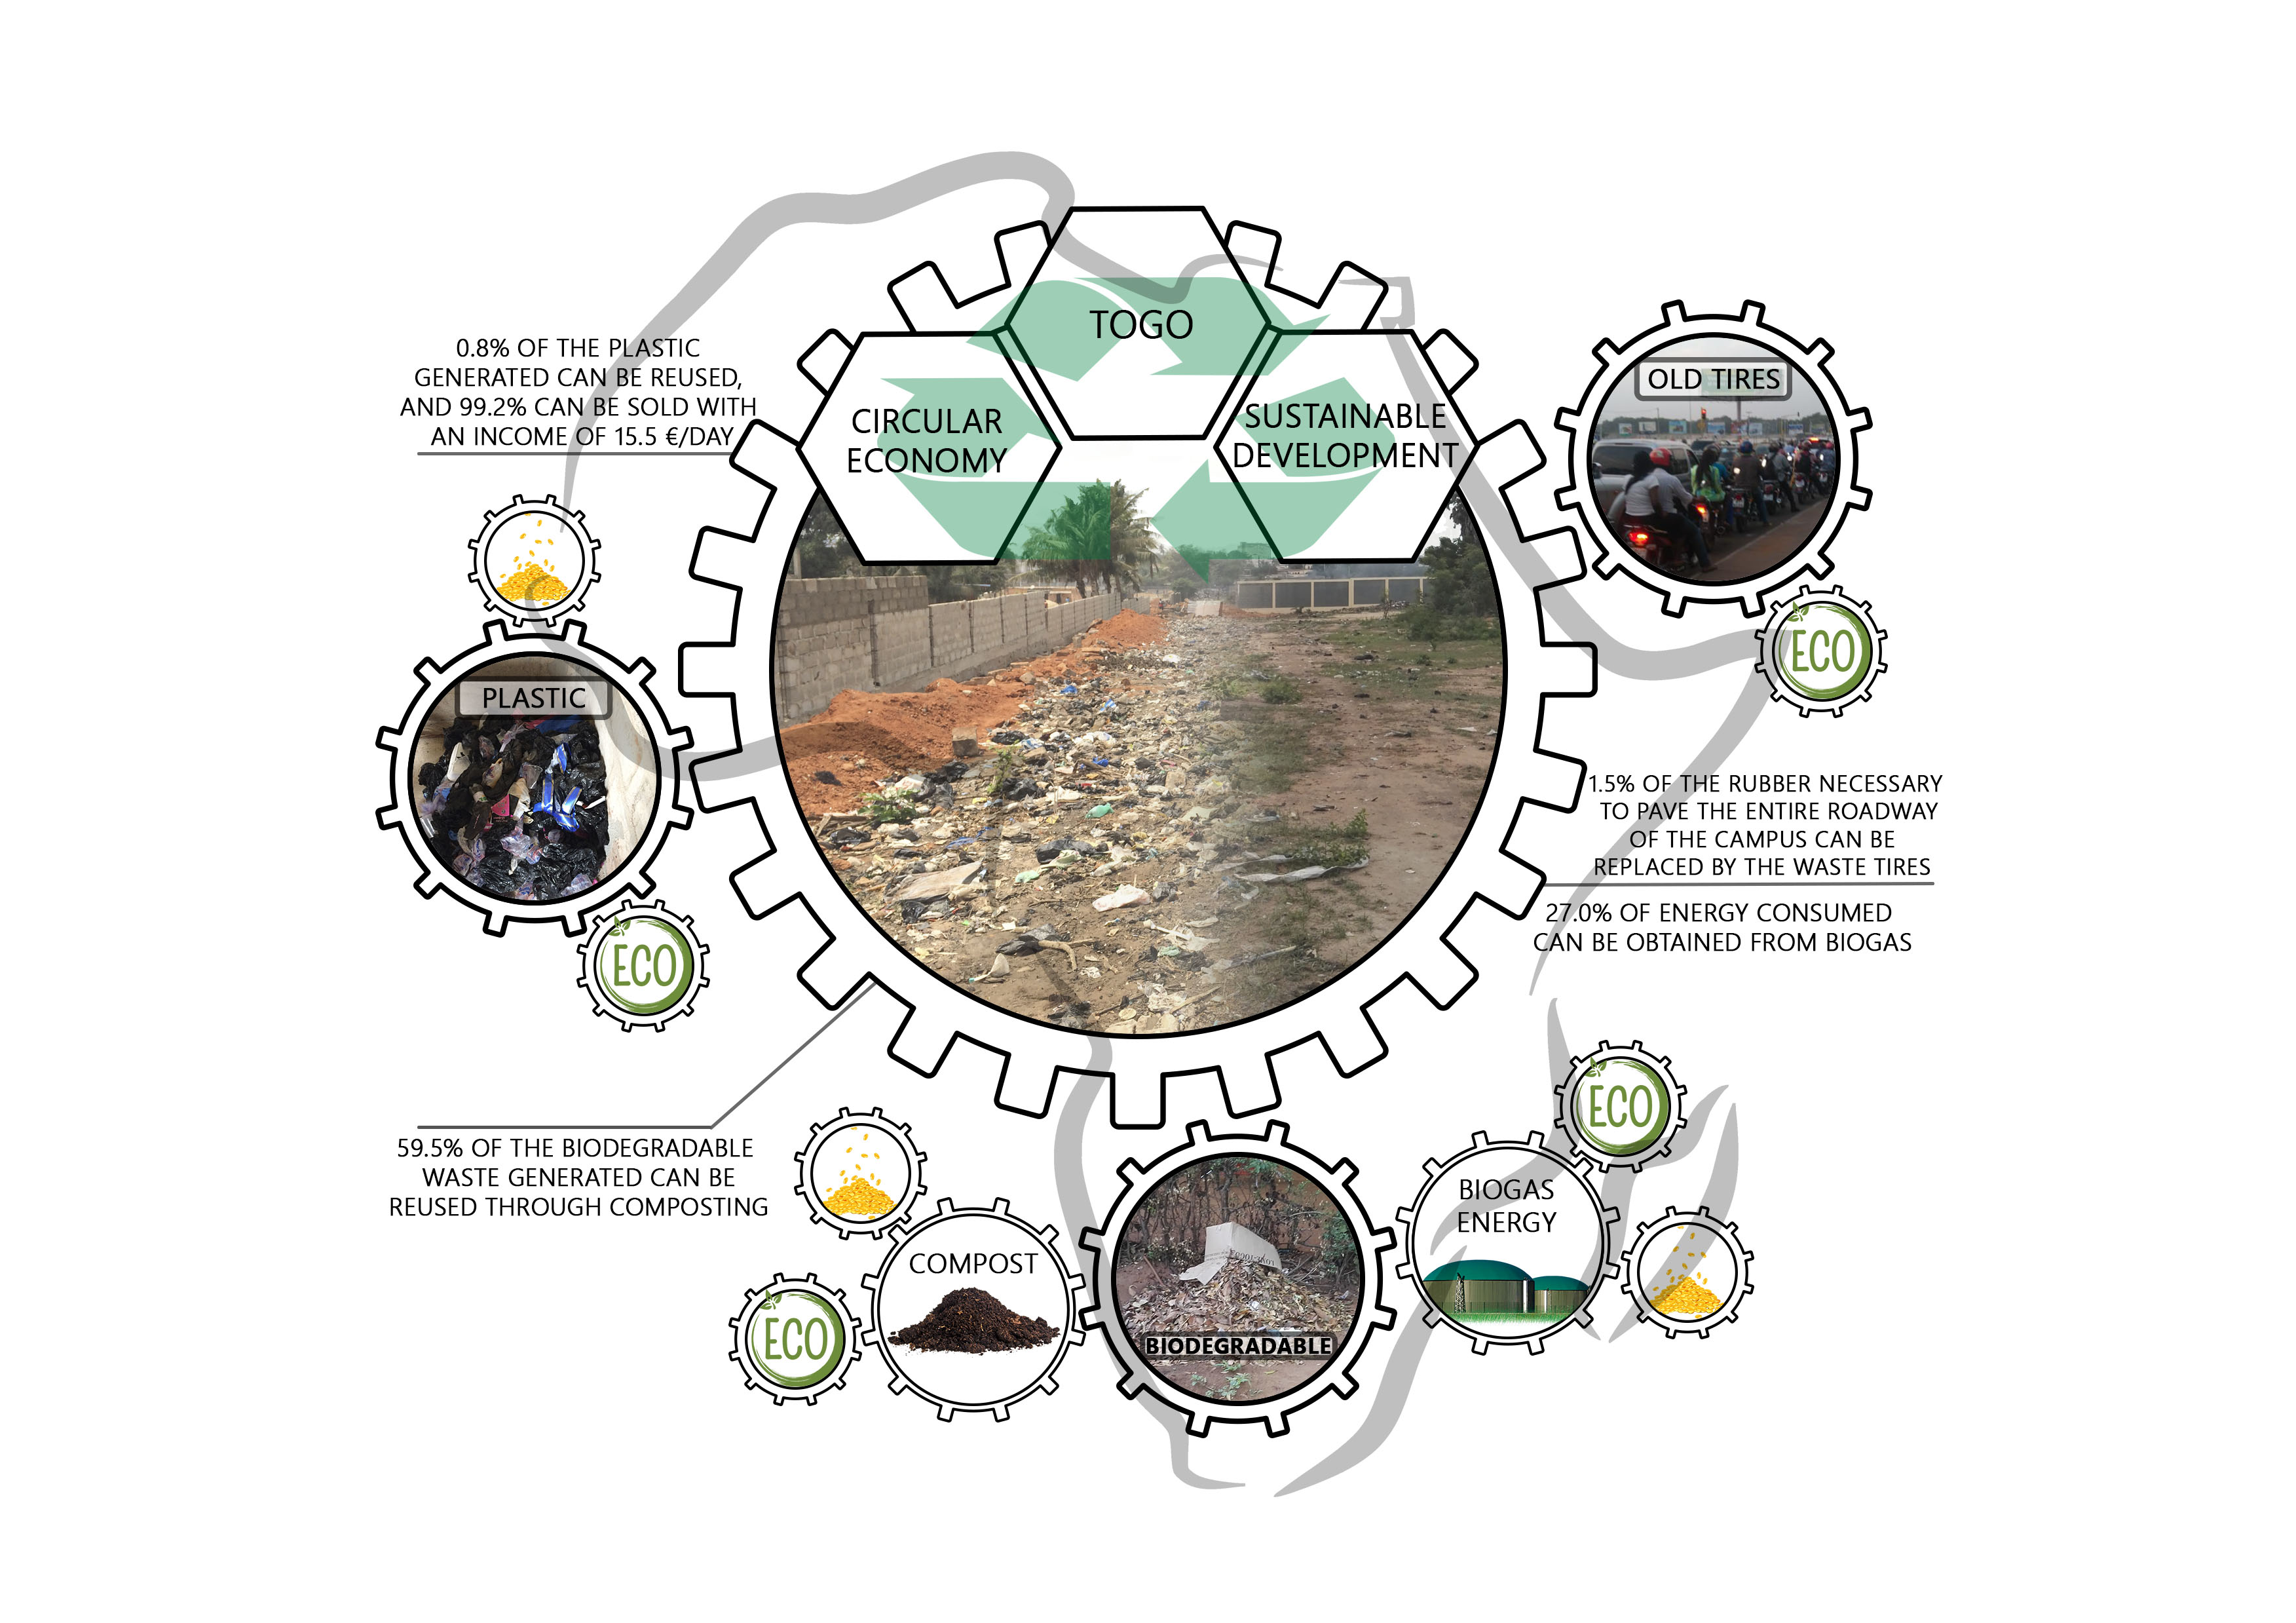
- Organic matter generates bad odors and disease vectors, such as malaria. Composting and biogas can generate income for the university [28].
- ➢
- Textile, paper, and cardboard are mostly from administrative and teaching centers. This fraction can be revalorized energetically [27].
- ➢
- Plastic represents one of the highest fractions of global waste by mass nowadays. This trend goes along with the increasing environmental concern for post-consumer plastic waste [23]. Its sale and reuse can increase the income for the university.
- ➢
- Old tires: the number of vehicles is increasing, resulting in an increase in tire waste at the end of their useful life [29]. The mixture of old crushed tires and sand can be used for road construction projects [30]. This can be particularly useful in order to carry out the next project of the university: to pave the streets of the campus.
2.1.1. Organic
2.1.2. Paper
2.1.3. Textile
2.1.4. Plastic
- ➢
- Reusing bottles in good condition for the sale of soap and nuts.
- ➢
- Selling the rest of the plastic in the port of Lome, where it can be used as energy fuel.
2.1.5. Old Tires
2.2. Indicators of Circular Economy
- ➢
- Indicators proposed here must serve as basic tools in the provision of information about the state of the environment, so that they contribute to awareness among public authorities and the population in general.
- ➢
- They must be used in both the preparation and evaluation of environmental policies.
2.2.1. Organic, Paper, and Textile
Composting
Biogas
2.2.2. Plastic
2.2.3. Old Tires
2.3. Time Horizons 2022 and 2027
3. Results
3.1. Organic, Paper, and Textile
3.1.1. Composting
3.1.2. Biogas
3.2. Plastic
3.3. Old Tires
3.4. Temporal Evolution: Time Horizons 2022 and 2027
3.4.1. Composting
3.4.2. Biogas
3.4.3. Plastic
4. Conclusions
Author Contributions
Funding
Acknowledgments
Conflicts of Interest
Nomenclature
| Ic,ce | Compost (%) |
| Ib,ce | Biogas (m3 biogas/kg waste) |
| IE,b,ce | Energy use of biogas (%) |
| Ipb,ce | Reusable plastic (%) |
| Ips,ce | Sold plastic (%) |
| Iot,ce | Old tires (%) |
References
- Directive 2008/98/EC of the European Parliament and of the Council of 19 November 2008 on waste and repealing certain Directives. 2008. Available online: http://data.europa.eu/eli/dir/2008/98/oj (accessed on 21 December 2018).
- Zamarriego, L. Viaje al centro del ecodiseño. Circle 2017, 2. Available online: https://www.revistacircle.com/2017/03/08/ecodiseno-michael-braungart/ (accessed on 21 December 2018).
- Morató, J.; Tollin, N.; Jiménez, L.; Villanueva, B.; Plà, M.; Betancourth, C.; de la Cruz, J.L.; Pérez, E. Situación y Evolución de la Economía Circular en España; Fundación COTEC para la Innovación: Madrid, Spain, 2017. [Google Scholar]
- Stafford, K.; Duncan, K.A.; Danes, S.; Winter, M. A research model of sustainable family business. Fam. Bus. Rev. 1999, 12, 197–208. [Google Scholar] [CrossRef]
- European Environment Agency. Circular economy in Europe. Developing the knowledge base. EEA Report 2. 2016. Available online: https://publications.europa.eu/en/publication-detail/-/publication/0cc8128f-d6d3-11e5-8fea-01aa75ed71a1/language-en (accessed on 21 December 2018).
- Braungart, M.; McDonough, W. Cradle to Cradle: Remaking the Way We Make Things; North Point Press: New York, NY, USA, 2002. [Google Scholar]
- Molina-Moreno, V.; Leyva-Díaz, J.C.; Sánchez-Molina, J.; Peña-García, A. Proposal to foster sustainability through circular economy-based engineering: A profitable chain from waste management to tunnel lighting. Sustainability 2017, 9, 2229. [Google Scholar] [CrossRef]
- Argudo-García, J.J.; Molina-Moreno, V.; Leyva-Díaz, J.C. Valoración de lodos procedentes de plantas de tratamiento de agua potable. Una apuesta por la economía circular y sostenibilidad. Dyna 2017, 92, 71–75. [Google Scholar] [CrossRef]
- Reike, D.; Vermeulen, W.J.V.; Witjes, S. The circular economy: New or Refurbished as CE 3.0?—Exploring Controversies in the conceptualization of circular economy through a focus on history and resource value retention option. Resour. Conserv. Recy. 2018, 135, 246–264. [Google Scholar] [CrossRef]
- Quartey, E.T.; Tosefa, H.; Danquah, K.A.B.; Obrsalova, I. Theoretical framework for plastic waste management in Ghana through extended producer responsibility: Case of sachet water waste. Int. J. Environ. Res. Public Health 2015, 12, 9907–9919. [Google Scholar] [CrossRef]
- Yukalang, N.; Clarke, B.; Ross, K. Solid waste management solutions for a rapidly urbanizing area in Thailand: Recommendations based on stakeholder input. Int. J. Environ. Res. Public Health 2018, 15, 1302. [Google Scholar] [CrossRef]
- Preston, F.; Lehne, J. A wider circle? The circular economy in developing countries. Energy, Environment and Resources Department. 2017. Available online: https://www.chathamhouse.org/sites/default/files/publications/research/2017-12-05-circular-economy-preston-lehne.pdf (accessed on 21 December 2018).
- Hassan, A.A.; Tudor, T.; Vaccari, M. Healthcare waste management: A case study from Sudan. Environment 2018, 5, 89. [Google Scholar] [CrossRef]
- Kouamé, P.K.; Dongo, K.; Nguyen-Viet, H.; Zurbrügg, C.; Lüthi, C.; Hattendorf, J.; Utzinger, J.; Biémi, J.; Bonfoh, B. Ecohealth approach to urban waste management: Exposire to environmental pollutants and health risks in Yamoussoukro Côte d’Ivoire. Int. J. Environ. Res. Public Health 2014, 11, 10292–10309. [Google Scholar] [CrossRef]
- Matete, N.; Trois, C. Towards Zero Waste in emerging countries—A South African experience. Waste Manag. 2008, 28, 1480–1492. [Google Scholar] [CrossRef]
- Munguía, N.E.; Díaz, Á.M.; Velazquez, L.E.; Perez, R.; Esquer, J.; Zepeda, D.S. Valorization of solid waste recovery in an institution of higher education. Green Sustain. Chem. 2018, 8, 180–189. [Google Scholar] [CrossRef]
- Douti, N.B.; Abanyie, S.K.; Ampofo, S. Solid waste management challenges in urban areas of Ghana: A case study of Bawku Municipality. Int. J. Geosci. 2017, 8, 494–513. [Google Scholar] [CrossRef]
- Tan, R.B.H.; Khoo, H.H. Impact assessment of waste management options in Singapore. J. Air Waste Manage. Assoc. 2006, 56, 244–254. [Google Scholar] [CrossRef]
- Ackerman, F. Waste management and climate change. Local Environ. Int. J. Justice Sustain. 2000, 5, 223–229. [Google Scholar] [CrossRef]
- Hoornweg, D.; Bhada-Tata, P. What a Waste. A Global Review of Solid Waste Management; Urban Development & Local Government Unit: Washington, DC, USA, 2012. [Google Scholar]
- Molina-Moreno, V.; Leyva-Díaz, J.C.; Sánchez-Molina, J. Pellet as a technological nutrient within the circular economy model: Comparative analysis of combustion efficiency and CO and NOx emissions for pellets from olive and almond trees. Energies 2016, 9, 777. [Google Scholar] [CrossRef]
- Ayodele, T.R.; Alao, M.A.; Ogunjuvigbe, A.S.O. Recyclable resources from municipal solid waste: Assessment of its energy, economic and environmental benefits in Nigeria. Resour. Conserv. Recy. 2018, 134, 165–173. [Google Scholar] [CrossRef]
- Liu, Z.; Adams, M.; Cote, R.P.; Chen, Q.; Wu, R.; Wen, Z.; Liu, W.; Dong, L. How does circular economy respond to greenhouse gas emissions reduction: An analysis of Chinese plastic recycling industries. Renew. Sustain. Energy Rev. 2018, 91, 1162–1169. [Google Scholar] [CrossRef]
- Kazuva, E.; Zhang, J.; Tong, Z.; Si, A.; Na, Li. The DPSIR model for environmental risk assessment of municipal solid waste in dar es Salaam City, Tanzania. Int. J. Environ. Res. Public Health 2018, 15, 1692. [Google Scholar] [CrossRef]
- DEPRO Group. Informe II: Aplicación de Indicadores Ambientales del Área de Residuos. Punto focal de residuos del Observatorio de Sostenibilidad de Cantabria. 2005. Available online: https://puntofocalderesiduos.cantabria.es/documents/4493807/4494407/informeii_aplicacion_indicadores_area_residuos.pdf (accessed on 21 December 2018).
- Molina-Moreno, V.; Leyva-Díaz, J.C.; Llorens-Montes, F.J.; Cortés-García, F.J. Design of indicators of circular economy as instruments for the evaluation of sustainability and efficiency in wastewater from pig farming industry. Water 2017, 9, 653. [Google Scholar] [CrossRef]
- Molina-Sánchez, E.; Leyva-Díaz, J.C.; Cortés-García, F.J.; Molina-Moreno, V. Proposal of sustainability indicators for the waste management from the paper industry within the circular economy model. Water 2018, 10, 1014. [Google Scholar] [CrossRef]
- Czekala, W.; Dach, J.; Dong, R.; Janczak, D.; Malinska, K.; Józwiakowski, K.; Smurzynska, A.; Cieslik, M. Composting potential of the solid fraction of digested pulp produced by a biogas plant. Biosyst. Eng. 2017, 160, 25–29. [Google Scholar] [CrossRef]
- Sebola, M.R.; Mativenga, P.T.; Pretorius, J. A Benchmark study of waste tyre recycling in South Africa to European Union Practice. Proc. CIRP 2018, 69, 950–955. [Google Scholar] [CrossRef]
- Piacente, J. Los neumáticos usados sirven para construir carreteras. Tendencias de la Ingeniería. 2010. Available online: https://www.tendencias21.net/Los-neumaticos-usados-sirven-para-construir-carreteras_a5213.html (accessed on 21 December 2018).
- Tchakpa, C.; Guedenon, P.; Edorh, P.A.; Boko, M. Collection and characterization of domestic solid waste in cotonou. J. Int. Environ. Appl. Sci. 2014, 9, 37–43. [Google Scholar]
- ASPAPEL. Economía circular del papel. 2015. Available online: http://www.aspapel.es/sites/default/files/publicaciones/doc_348.pdf (accessed on 21 December 2018).
- Intergovernmental Panel on Climate Change. Waste generation, composition and management data. In Guidelines for National Greenhouse Gas Inventories; Eggleston, H.S., Buendia, L., Miwa, K., Ngara, T., Tanabe, K., Eds.; Institute for Global Environmental Strategies (IGES): Hayama, Kanagawa, Japan, 2006. [Google Scholar]
- Salguero, L. Proyecto de infraestructuras para el sistema de gestión y tratamiento de residuos sólidos urbanos del Campus Universitario de Lomé (Togo) en el marco de Cooperación Internacional al Desarrollo. Ph.D. Thesis, University of Granada, Baobab Foundation, Granada, Spain, 2018. [Google Scholar]
- Gallego, J.; De los Santos, L. Mezclas bituminosas fabricadas con betunes de alto contenido de caucho. Aplicación al recrecimiento de un pacimento rígido en la A-7. Revista de Obras Públicas 2003, 3439, 7–26. [Google Scholar]
- Fraile-Garcia, E.; Ferreiro-Cabello, J.; Defez, B.; Peris-Fajanes, G. Acoustic behavior of hollow blocks and bricks made of concrete doped with waste-tire rubber. Materials 2016, 9, 962. [Google Scholar] [CrossRef]
- Sodupe-Ortega, E.; Fraile-Garcia, E.; Ferreiro-Cabello, J.; Sanz-Garcia, A. Evaluation of crumb rubber as aggregate for automated manufacturing of rubberized long hollow blocks and bricks. Constr. Build. Mater. 2016, 106, 305–316. [Google Scholar] [CrossRef] [Green Version]
- Nuñez-Cacho, P.; Górecki, J.; Molina-Moreno, V.; Corpas-Iglesias, F.A. What gets measured, gets done: Development of a circular economy measurement scale for building industry. Sustainability 2018, 10, 2340. [Google Scholar] [CrossRef]
- Hu, Y.; He, X.; Poustie, M. Can legislation promote a circular economy? a material flow-based evaluation of the circular degree of the chinese economy. Sustainability 2018, 10, 990. [Google Scholar] [CrossRef]
- Ranieri, L.; Mossa, G.; Pellegrino, R.; Digiesi, S. Energy recovery from the organic fraction of municipal solid waste: A real options-based facility assessment. Sustainability 2018, 10, 368. [Google Scholar] [CrossRef]
- Jouhara, H.; Czajczynska, D.; Ghazal, H.; Krzyzynska, R.; Anguilano, L.; Reynolds, A.J.; Spencer, N. Municipal waste management systems for domestic use. Energy 2017, 139, 485–506. [Google Scholar] [CrossRef]
- Consejería de Medio Ambiente y Ordenación del Territorio. Guía de apoyo para la notificación de las emisiones a las actividades de gestión de residuos. 2017. Available online: http://www.juntadeandalucia.es/medioambiente/portal_web/administracion_electronica/Tramites/Vigilancia_Prevencion/Modelos/EPRTR/Modelos/Guias_apoyo/Guia_Ep5_Actividades_Gestion_Residuos.pdf (accessed on 21 December 2018).
- Quirosa-Martín, A.; Delgado-Ramos, F. Sanitation plan, wastewater treatment and waste management for the University Campus of Lome (Togo). Ph.D. Thesis, University of Granada, Baobab Foundation, Granada, Spain, 2017. [Google Scholar]
- Centro de Estudios y Experimentación de Obras Públicas. Manual de empleo de caucho de NFU en mezclas bituminosas. 2007. Available online: http://www.cedex.es/NR/rdonlyres/27EDCC96-7C3A-42B5-96B7-F6B87D0BD3DF/116371/Manual_NFU.pdf (accessed on 21 December 2018).
- Castro, G. Materiales y Compuestos Para la Industria del Neumático; Departamento de Ingeniería Mecánica FIUBA: Buenos Aires, Argentina, 2008. [Google Scholar]
- Toura, Y. Proyecto de la red de saneamiento de aguas residuales y pluviales en el Campus Universitario de Lome (Togo) en el Marco de Cooperación Internacional al Desarrollo. Ph.D. Thesis, University of Granada, Baobab Foundation, Granada, Spain, 2017. [Google Scholar]
- Ministerio de Fomento. Norma 6.1 IC Secciones de firme. Instrucción de carreteras, Orden FOM/3460/2003, BOE de 12 de diciembre de 2003. 2003. Available online: https://www.fomento.gob.es/recursos_mfom/1010100.pdf (accessed on 21 December 2018).
- Sol-Sánchez, G. Reutilización de Polvo de Neumático en la fabricación de mezclas bituminosas mediante la técnica de la vía seca. Ph.D. Thesis, University of Granada, Granada, Spain, 2011. [Google Scholar]
- Tortosa, G. El compost reduce la erosión y pérdida de nutrientes en suelos. Compostando Ciencia Lab. 2015. Available online: http://www.compostandociencia.com/2015/03/el-compost-reduce-la-erosion-en-suelos/ (accessed on 21 December 2018).
- Green Area. La composta ayuda en afrontar el calentamiento global. 2015. Available online: http://greenarea.me/es/93397/la-composta-ayuda-en-afrontar-el-calentamiento-global/ (accessed on 21 December 2018).
- Danso, G.K.; Otoo, M.; Ekere, W.; Ddungu, S.; Madurangi, G. Market feasibility of faecal sludge and municipal solid waste-based compost as measured by farmers’ willingness-to pay for product attributes: Evidence from Kampala, Uganda. Resources 2017, 6, 31. [Google Scholar] [CrossRef]
- Manyi-Loh, C.E.; Mamphweli, S.N.; Meyer, E.L.; Okoh, A.I.; Makaka, G.; Simon, M. Microbial anaerobic digestion (bio-digesters) as an approach to the decontamination of animal wastes in pollution control and the generation of renewable energy. Int. J. Environ. Res. Public Health 2013, 10, 4390–4417. [Google Scholar] [CrossRef] [PubMed]
- Vila-Cortavitarte, M.; Lastra-González, P.; Calzada-Pérez, M.A.; Indacoechea-Vega, I. Analysis of the influence of using recycled polystyrene as a substitute for bitumen in the behaviour of asphalt concrete mixtures. J. Clean Prod. 2018, 170, 1279–1287. [Google Scholar] [CrossRef]
- California Department of Transportation. Asphalt Rubber Usage Guide; Division of Engineering Services, Materials Engineering and Testing Services: Sacramento, USA, 2006. Available online: http://www.asphaltrubber.org/ari/California_AR_Design_Guide/Caltrans_Asphalt_Rubber_Usage_Guide.pdf (accessed on 21 December 2018).
- Hicks, R.G.; Epps, J.A. Life Cycle Costs for Asphalt-Rubber Paving Materials; Australian Asphalt Pavement Association: Port Melbourne, Australia, 1998. [Google Scholar]


| Parameter | Value |
|---|---|
| Organic matter | 695.5 kg/day |
| Paper | 79.5 kg/day |
| Textiles | 58 kg/day |
| Total biodegradable waste (mBW) | 833 kg/day |
| Total urban solid waste (mT) | 1400 kg/day |
| Ic,ce | 59.5% |
| Parameter | Value |
|---|---|
| DOC | 0.18 |
| L0 | 91.46 m³ CH4/t waste |
| Biogas generated (Qb) | 152.38 m³ biogas/day |
| Total urban solid waste (mT) | 1400 kg/day |
| Ib,ce | 0.109 m³ biogas/kg waste |
| Energy obtained (Eb) | 346.66 kWh/day |
| Energy consumed (Ec) | 1283.48 kWh/day |
| IE,b,ce | 27.0% |
| Parameter | Value |
|---|---|
| Mass of plastic waste (mp) | 390 kg/day |
| Number of reusable plastic bottles (nb) | 100 bottles/day |
| Medium bottle mass (mam) | 32 g/bottle |
| Mass of reusable plastic (mrp) | 3.2 kg/day |
| Mass of sold plastic (msp) | 386.8 kg/day |
| Ipb,ce | 0.8% |
| Ips,ce | 99.2% |
| Parameter | Value | Reference |
|---|---|---|
| Number of tires | 2080 units | - |
| Tire mass | 8.6 kg | Castro (2008) |
| Rubber in a tire | 45 % | Castro (2008) |
| Mass of rubber contained in all existing tires on campus (mrot) | 8049.6 kg | - |
| Surface to be paved | 121,200 m² | Toura (2017) |
| Thickness of asphalt layer | 15 cm | Ministerio de Fomento (2003) |
| Rubber in bituminous mixture | 2 % | Sol-Sánchez (2011) |
| Bituminous mixture density | 1500 kg/m³ | - |
| Total mass of rubber necessary to pave campus roads (mrn) | 545,400 kg | - |
| Iot,ce | 1.5% |
© 2019 by the authors. Licensee MDPI, Basel, Switzerland. This article is an open access article distributed under the terms and conditions of the Creative Commons Attribution (CC BY) license (http://creativecommons.org/licenses/by/4.0/).
Share and Cite
Salguero-Puerta, L.; Leyva-Díaz, J.C.; Cortés-García, F.J.; Molina-Moreno, V. Sustainability Indicators Concerning Waste Management for Implementation of the Circular Economy Model on the University of Lome (Togo) Campus. Int. J. Environ. Res. Public Health 2019, 16, 2234. https://0-doi-org.brum.beds.ac.uk/10.3390/ijerph16122234
Salguero-Puerta L, Leyva-Díaz JC, Cortés-García FJ, Molina-Moreno V. Sustainability Indicators Concerning Waste Management for Implementation of the Circular Economy Model on the University of Lome (Togo) Campus. International Journal of Environmental Research and Public Health. 2019; 16(12):2234. https://0-doi-org.brum.beds.ac.uk/10.3390/ijerph16122234
Chicago/Turabian StyleSalguero-Puerta, Lucía, Juan Carlos Leyva-Díaz, Francisco Joaquín Cortés-García, and Valentín Molina-Moreno. 2019. "Sustainability Indicators Concerning Waste Management for Implementation of the Circular Economy Model on the University of Lome (Togo) Campus" International Journal of Environmental Research and Public Health 16, no. 12: 2234. https://0-doi-org.brum.beds.ac.uk/10.3390/ijerph16122234