Health Risk and Resilience Assessment with Respect to the Main Air Pollutants in Sichuan


Abstract
:1. Introduction
2. Data and Methods
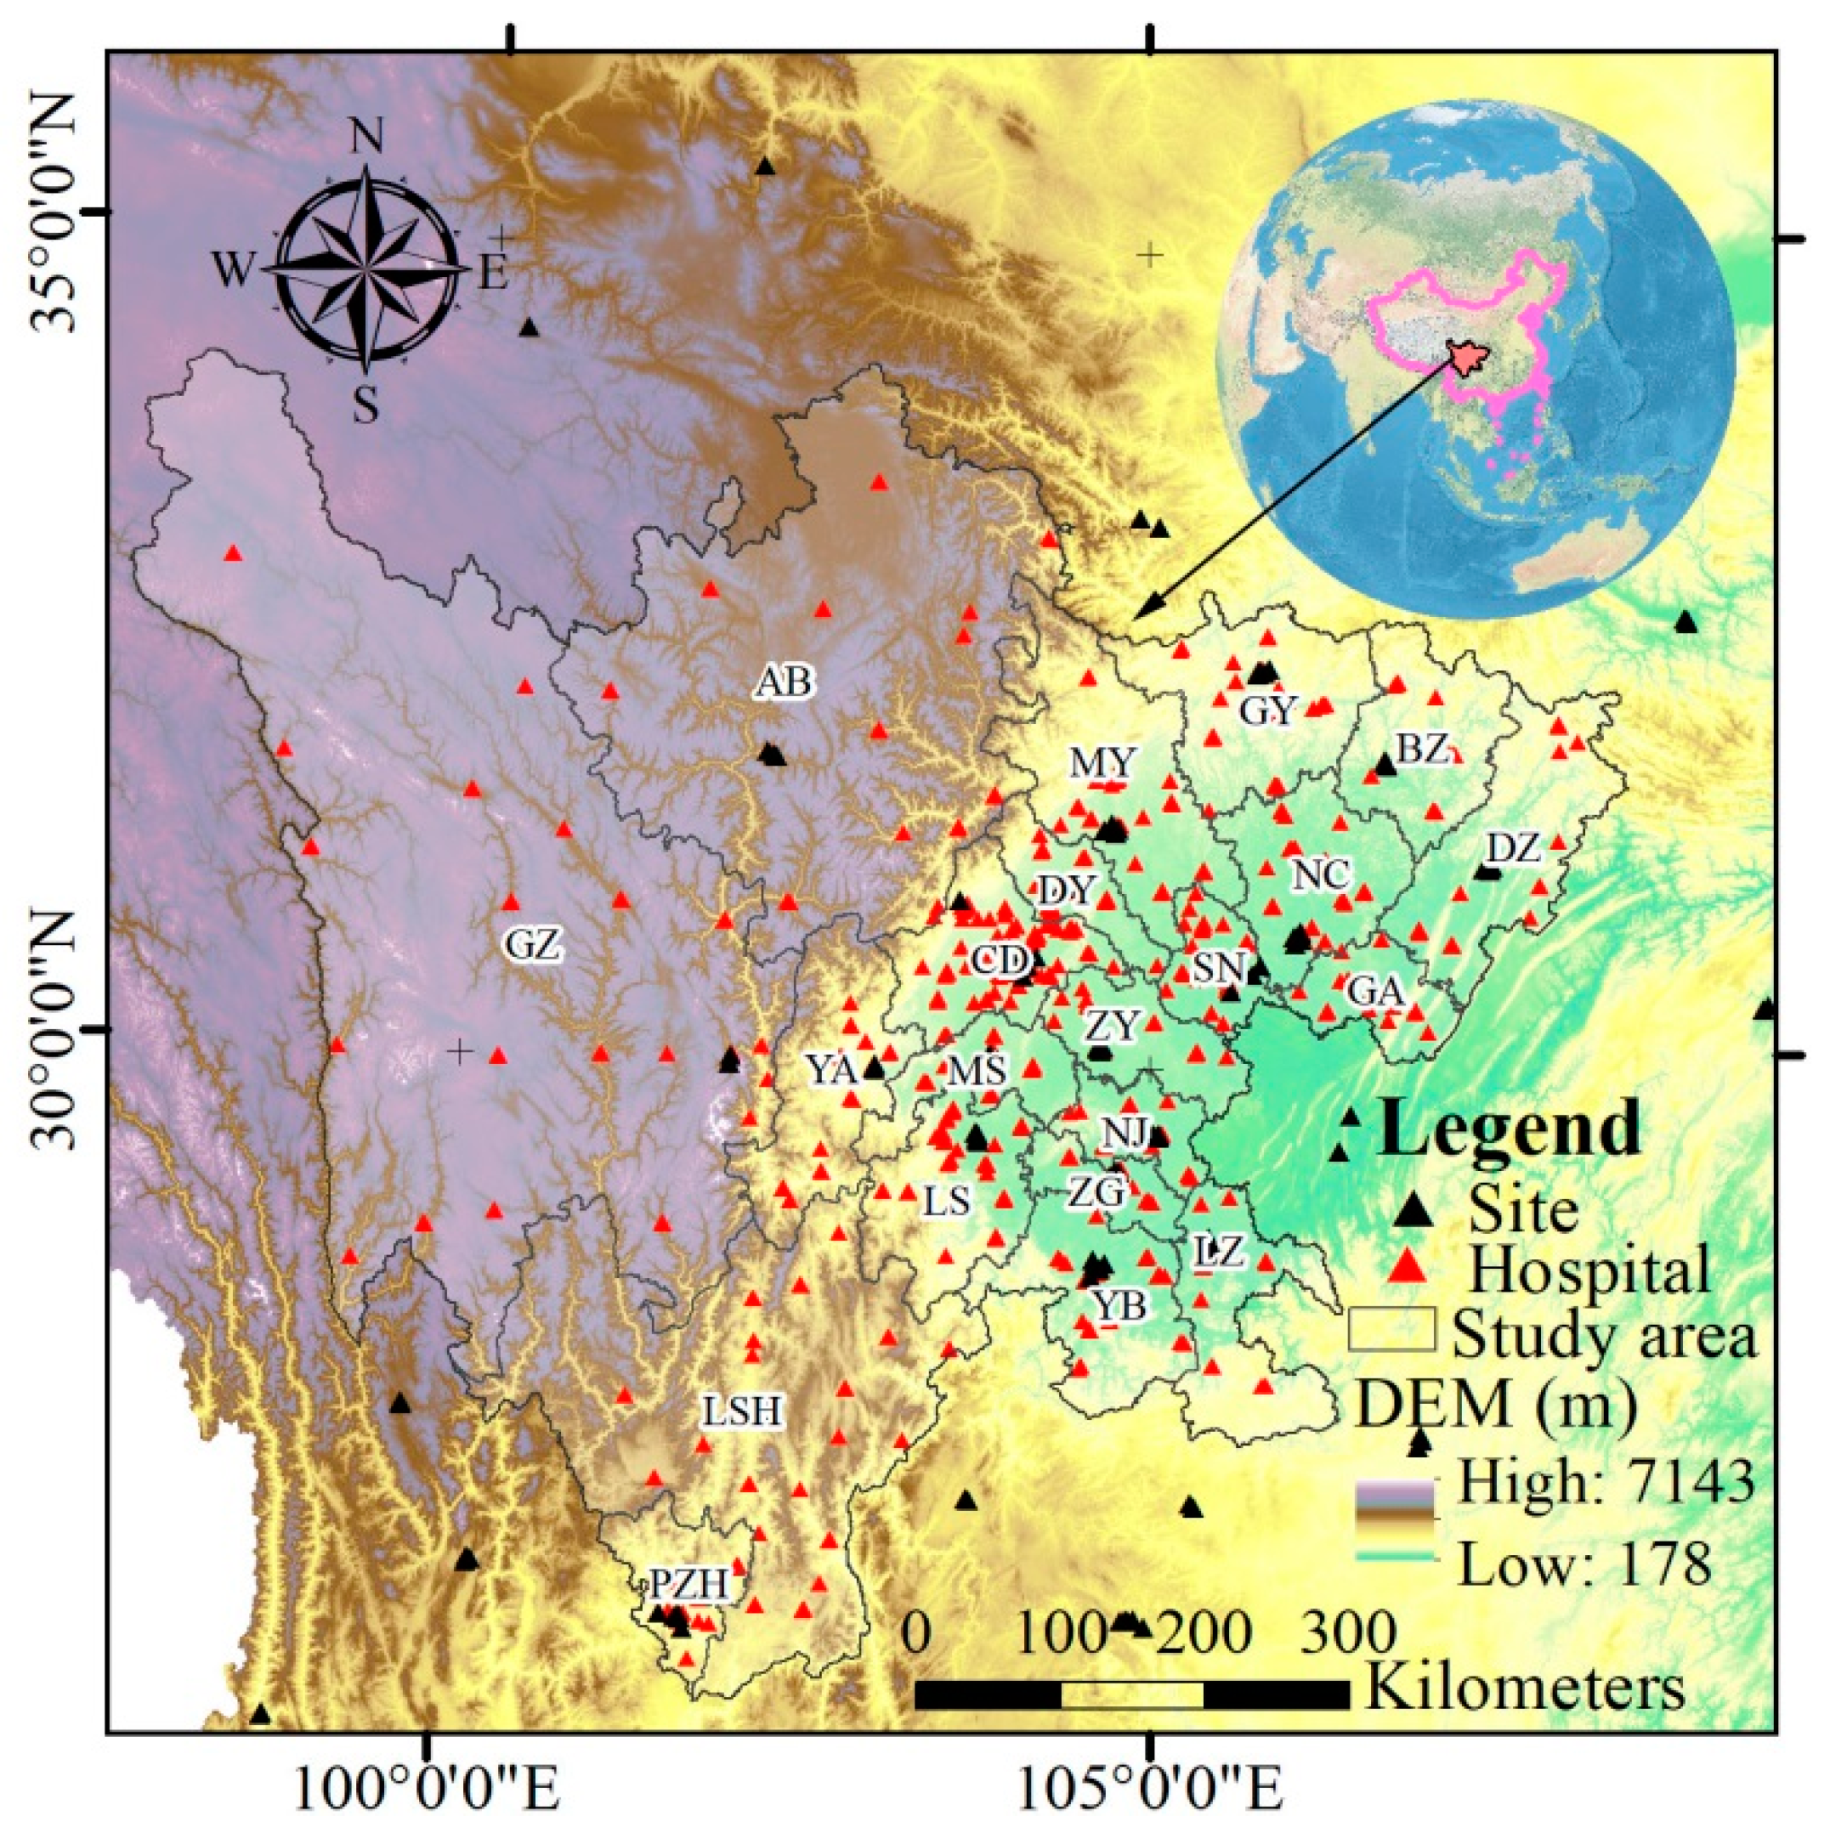
2.1. Study Area
2.2. Data
2.2.1. Air Quality Data
2.2.2. Resilience Assessment Data
2.3. Methods
2.3.1. Health Risk Assessment of Main Air Pollutants
2.3.2. Health Resilience Assessment
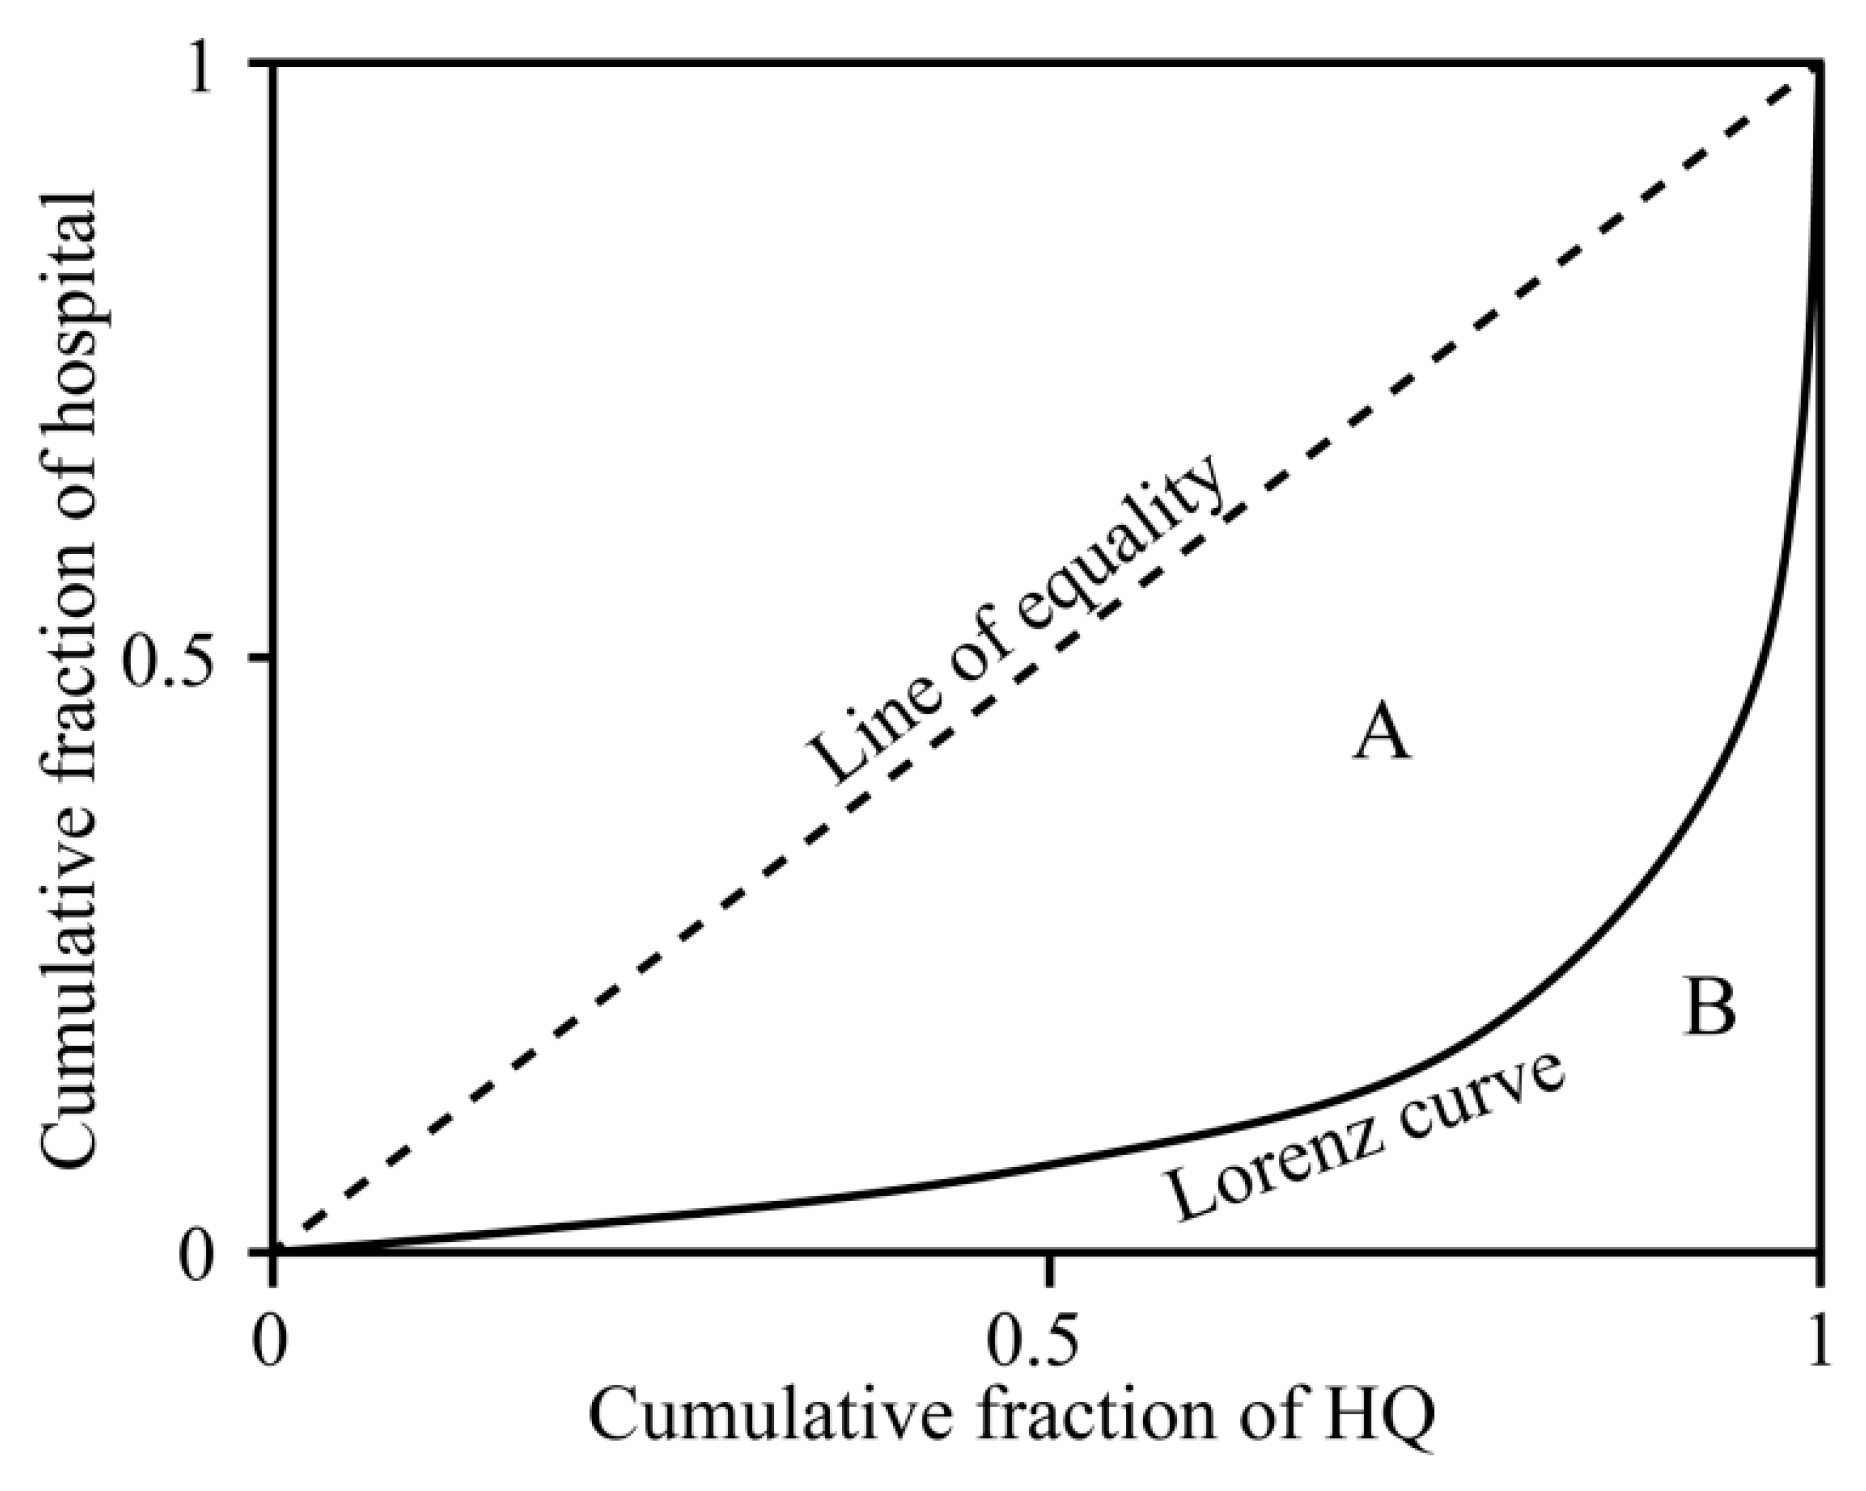
2.3.3. Lorenz Curve and Gini Coefficient
3. Results
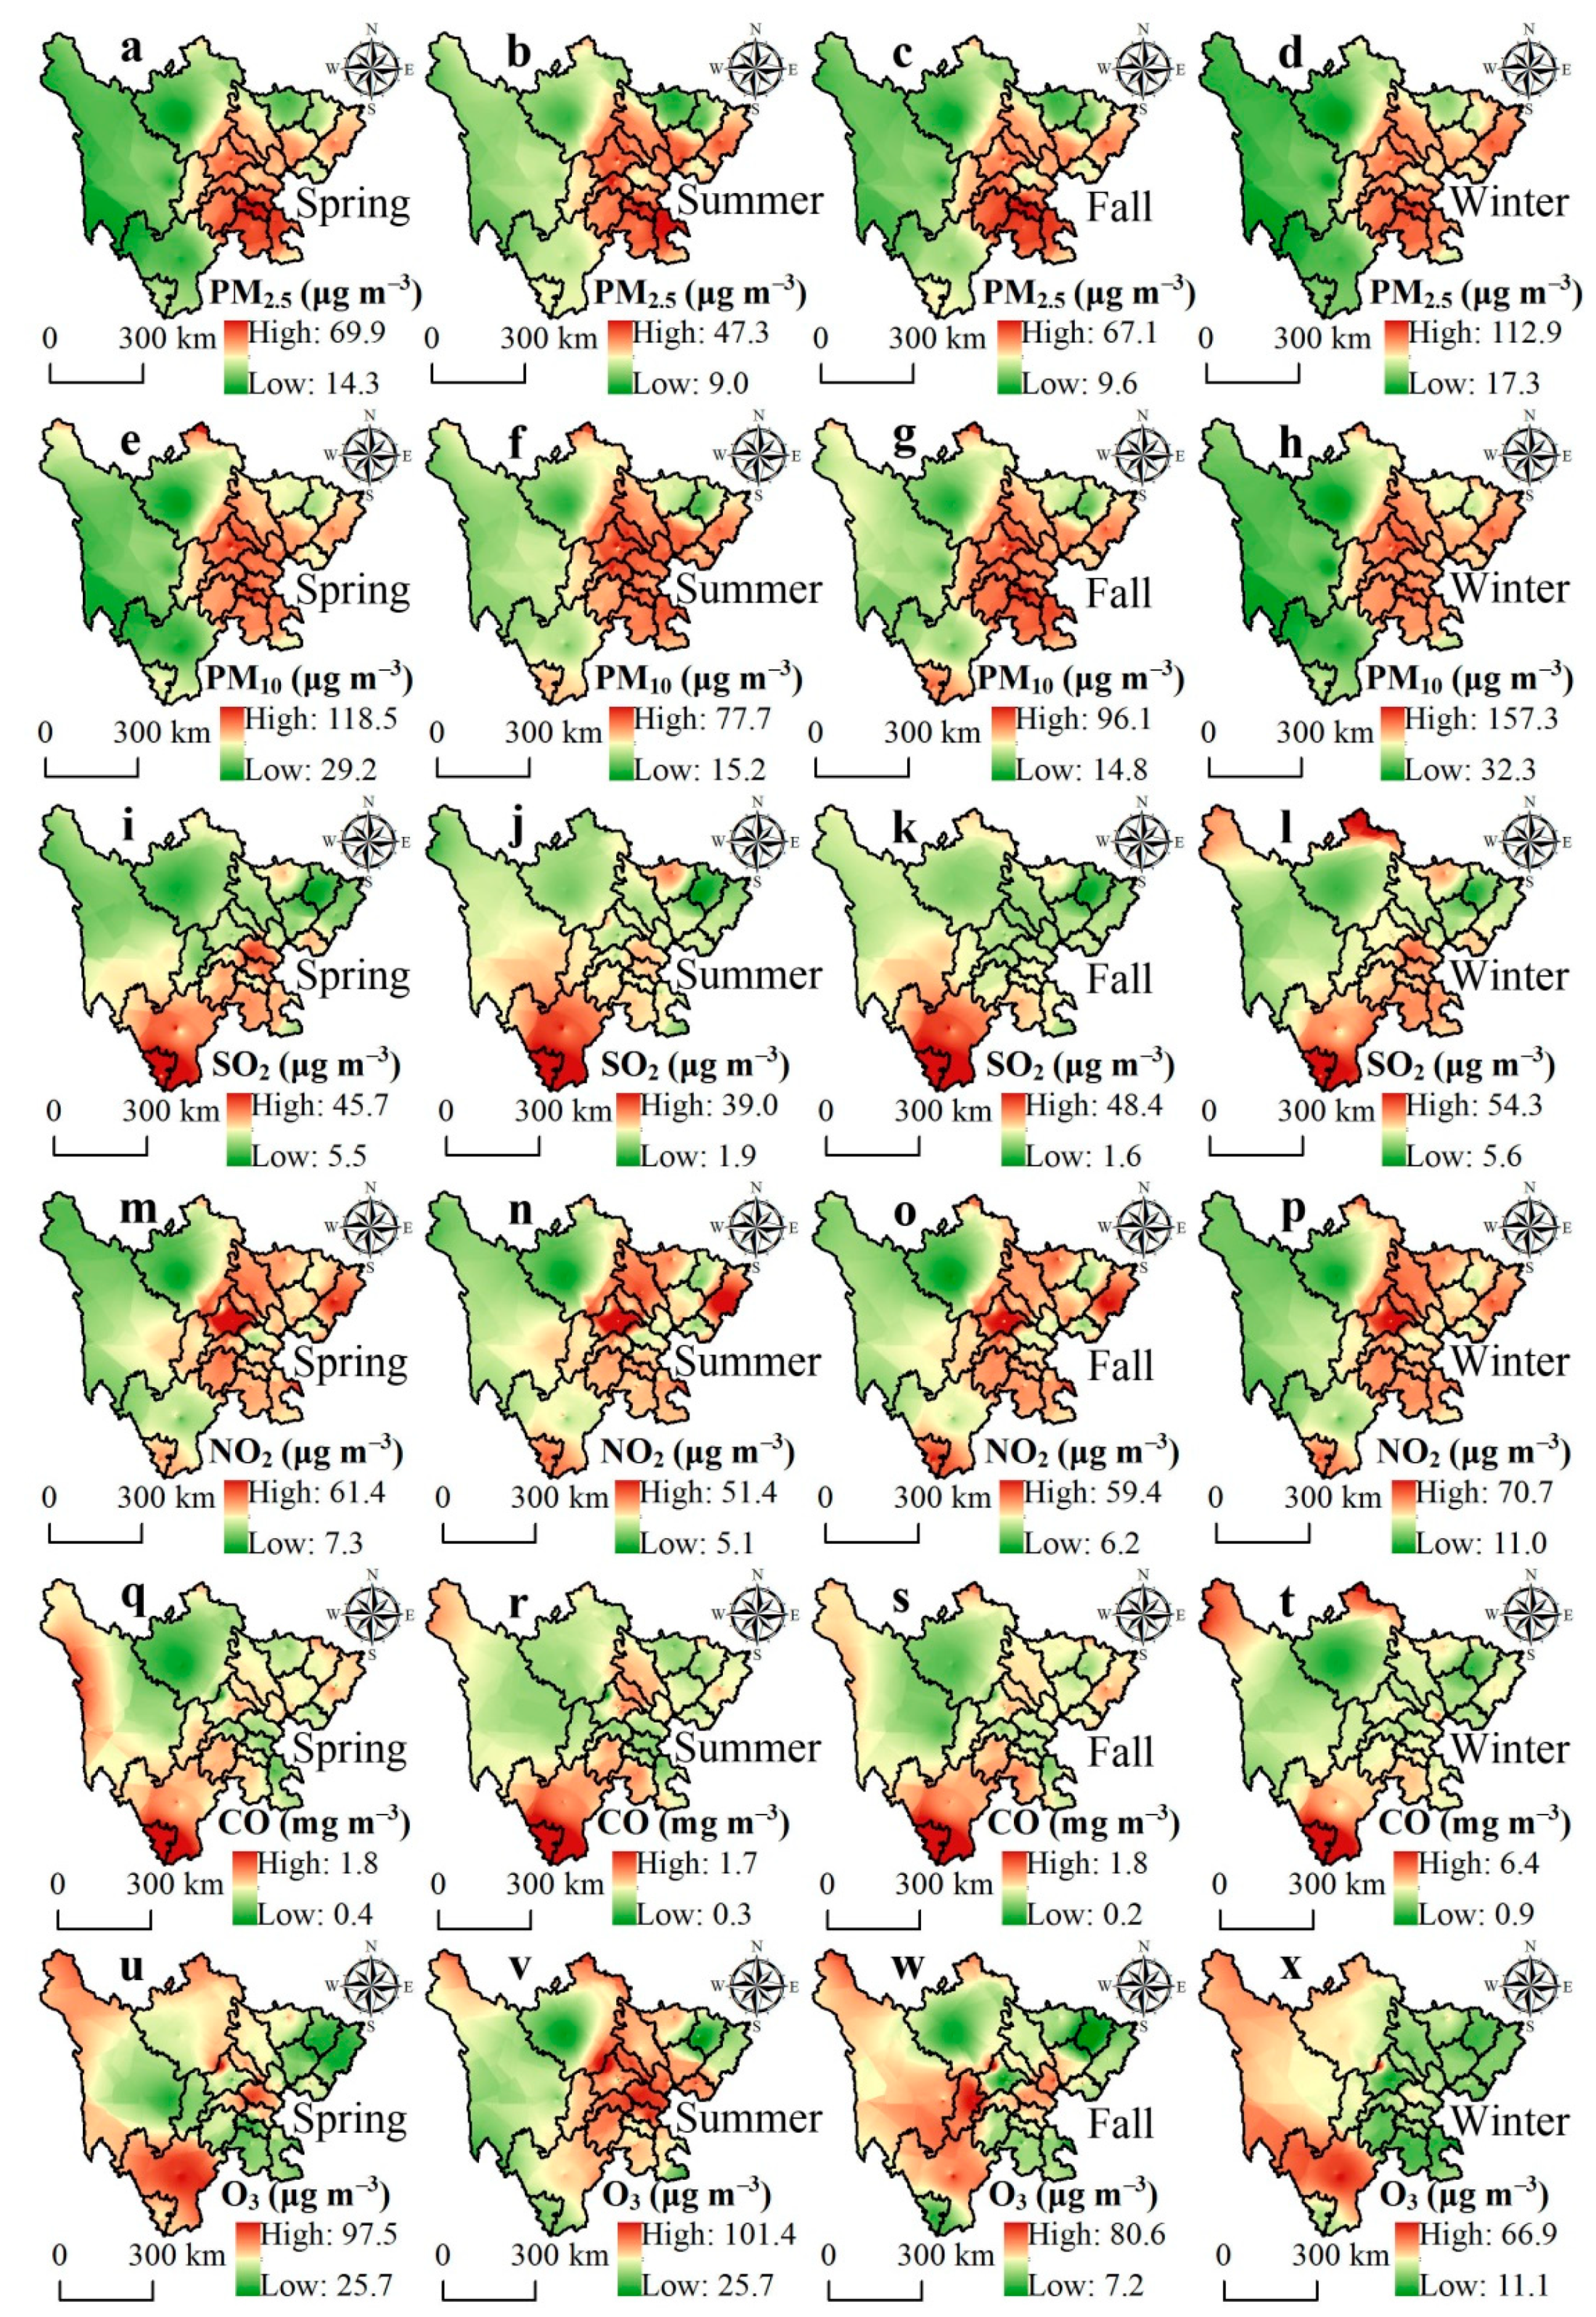
3.1. Spatial and Temporal Patterns of Six Criteria Air Pollutants
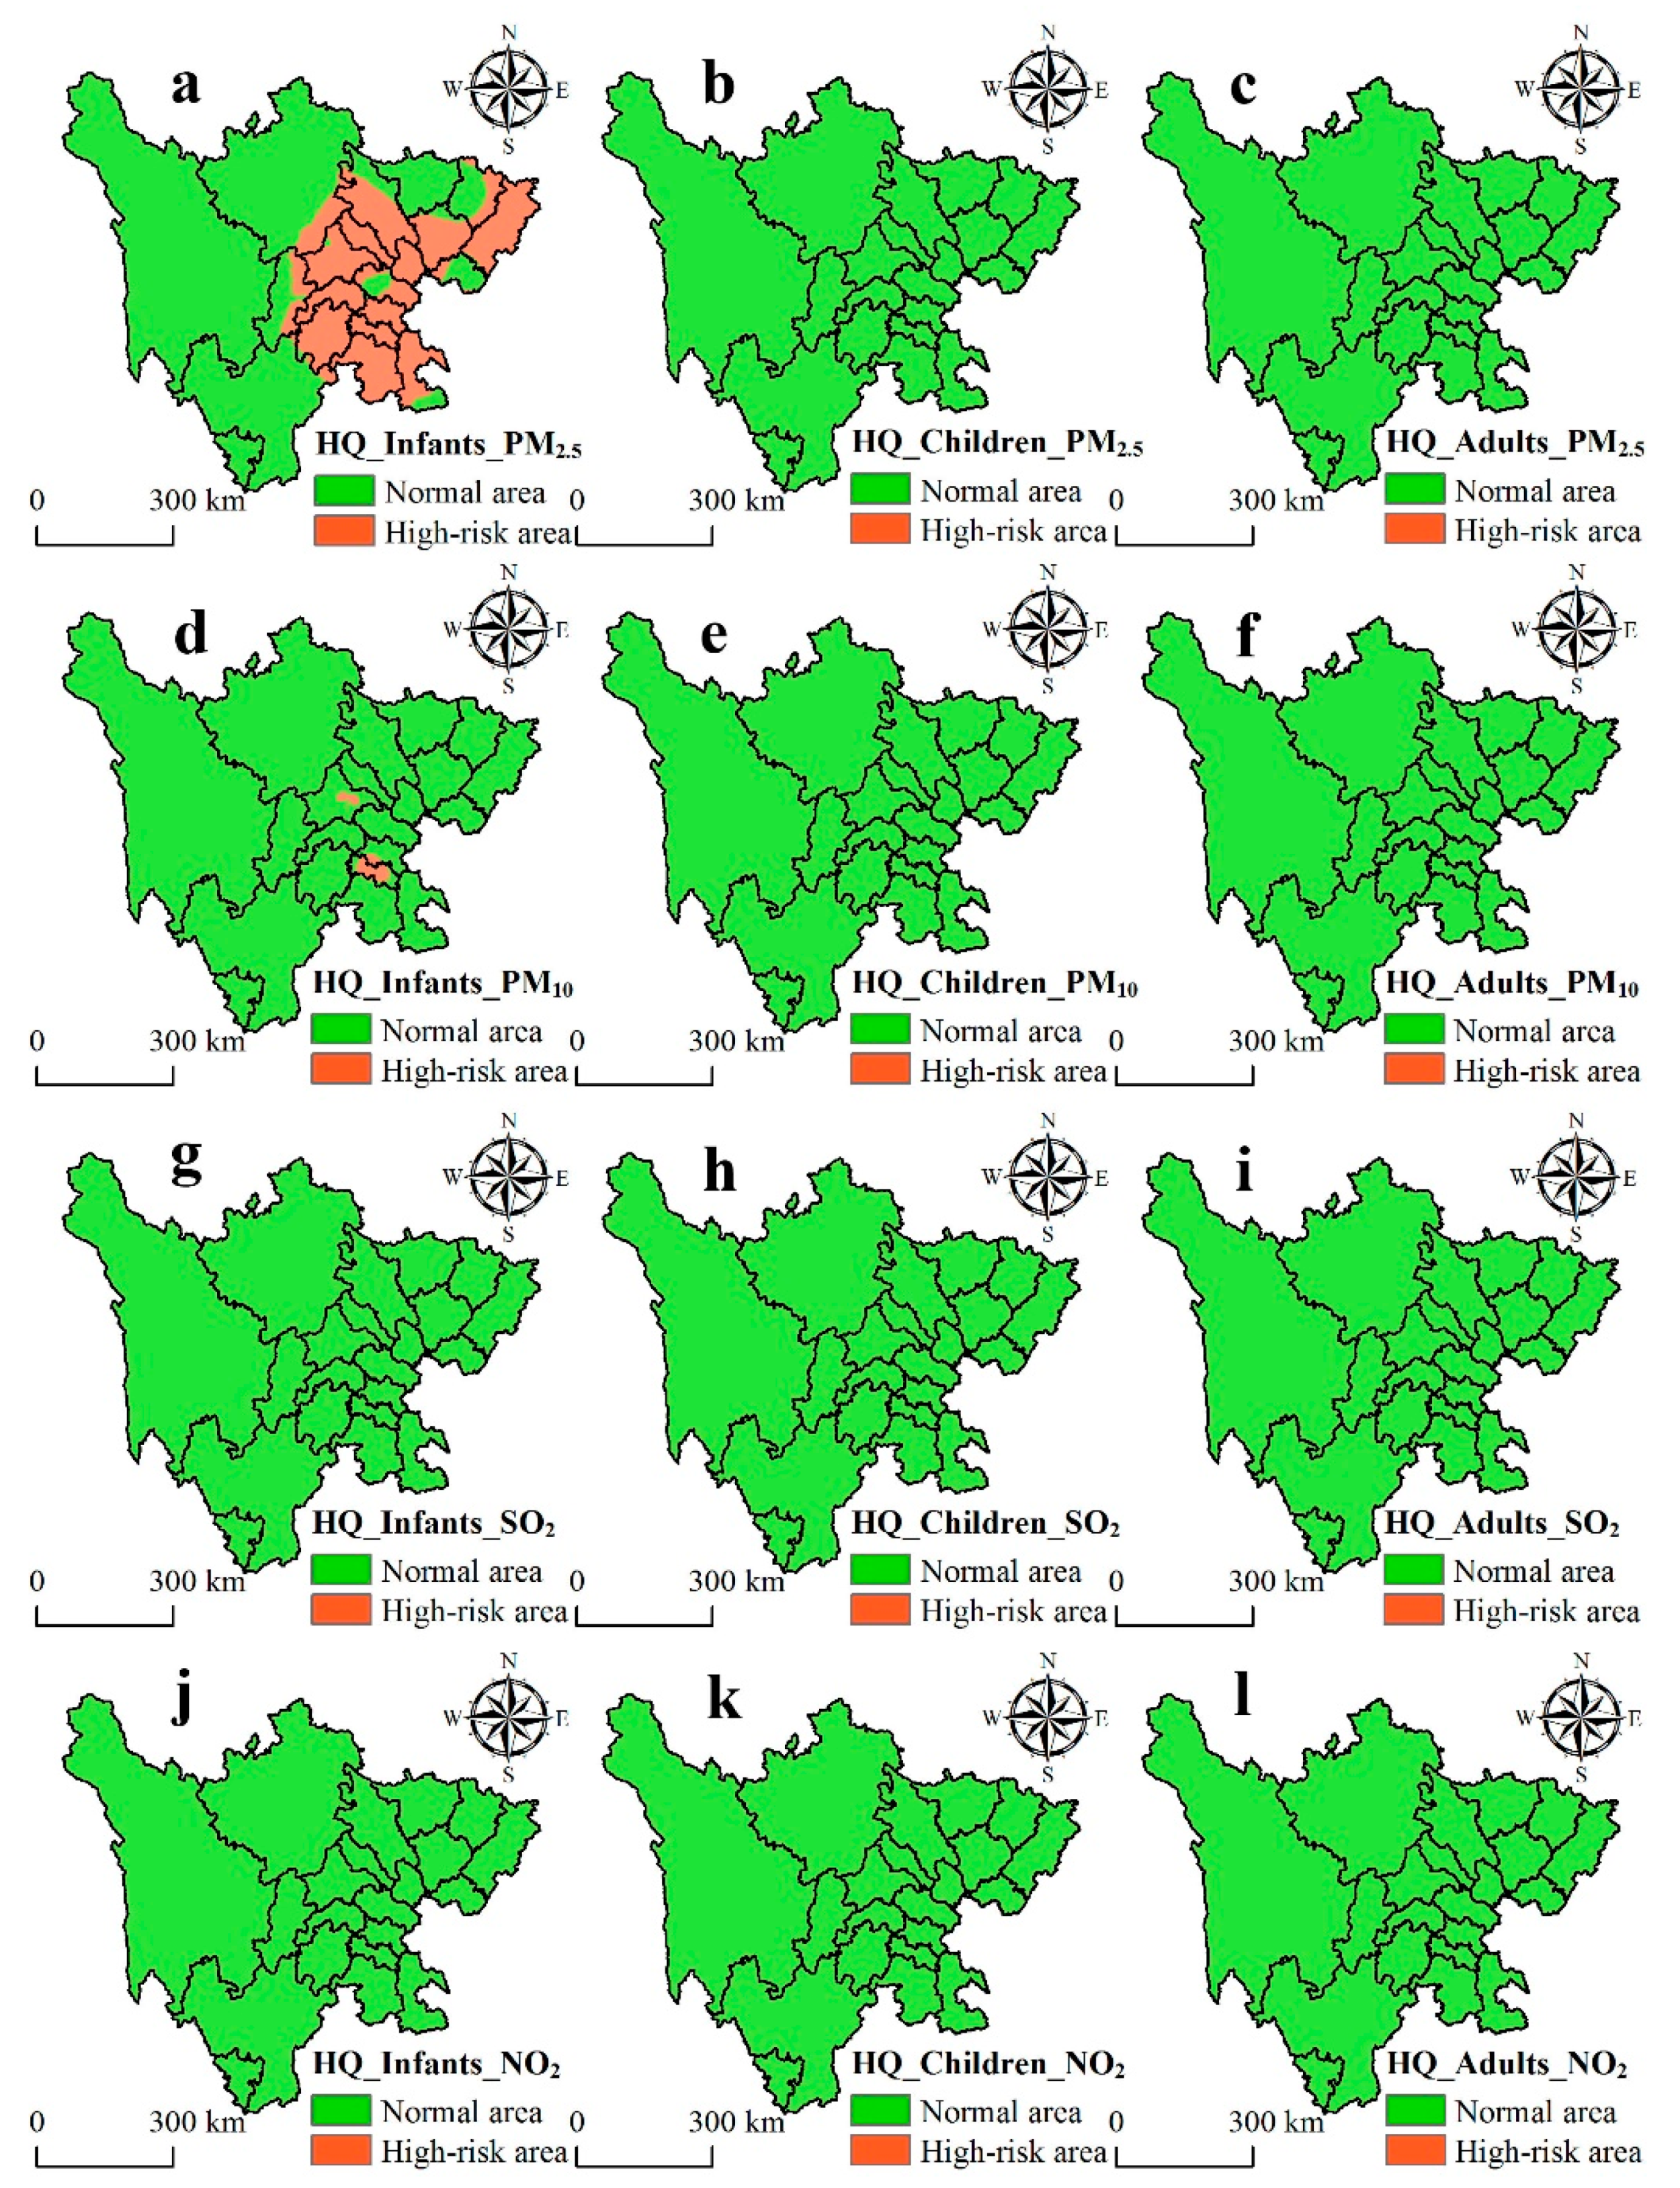
3.2. Health Risk Assessment of Chronic Exposure Across the Population
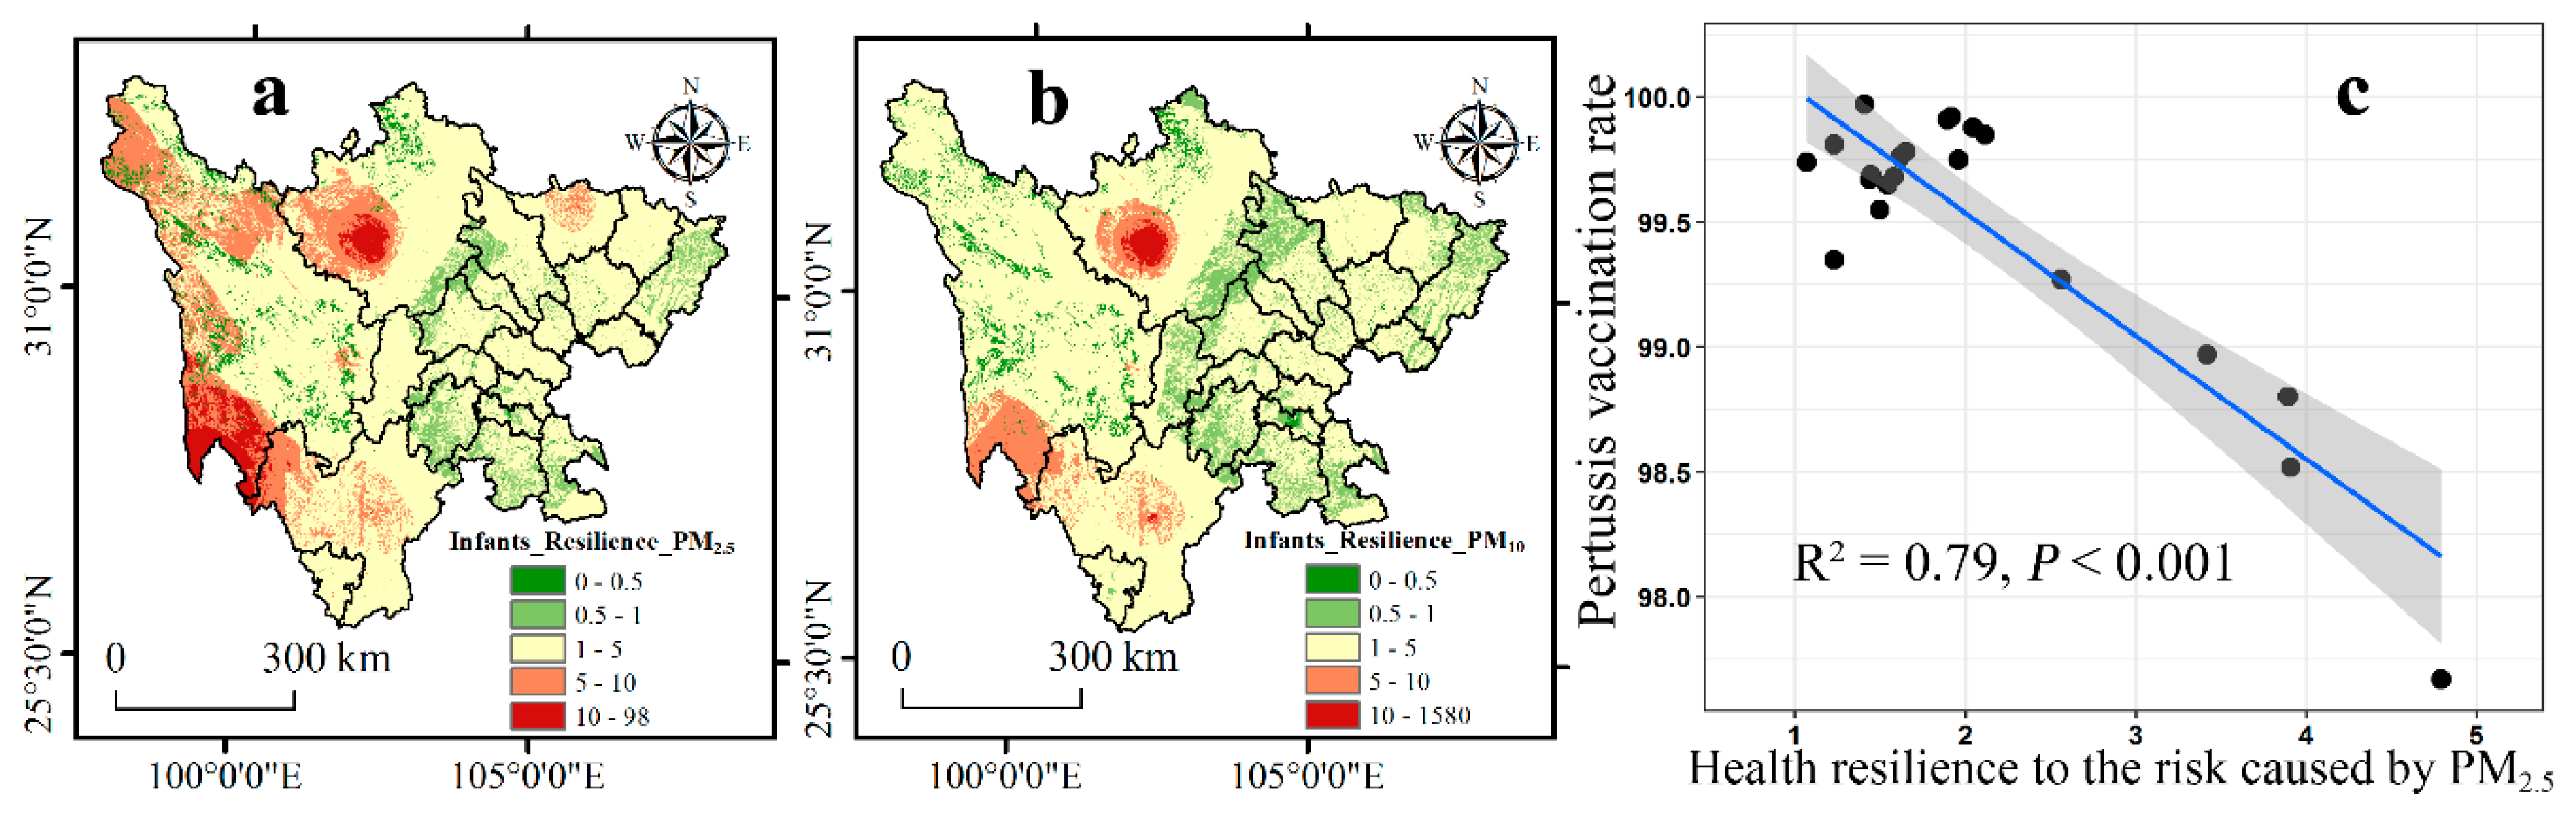
3.3. Health Resilience Assessment of Infants for the Risk Caused by PM2.5 and PM10
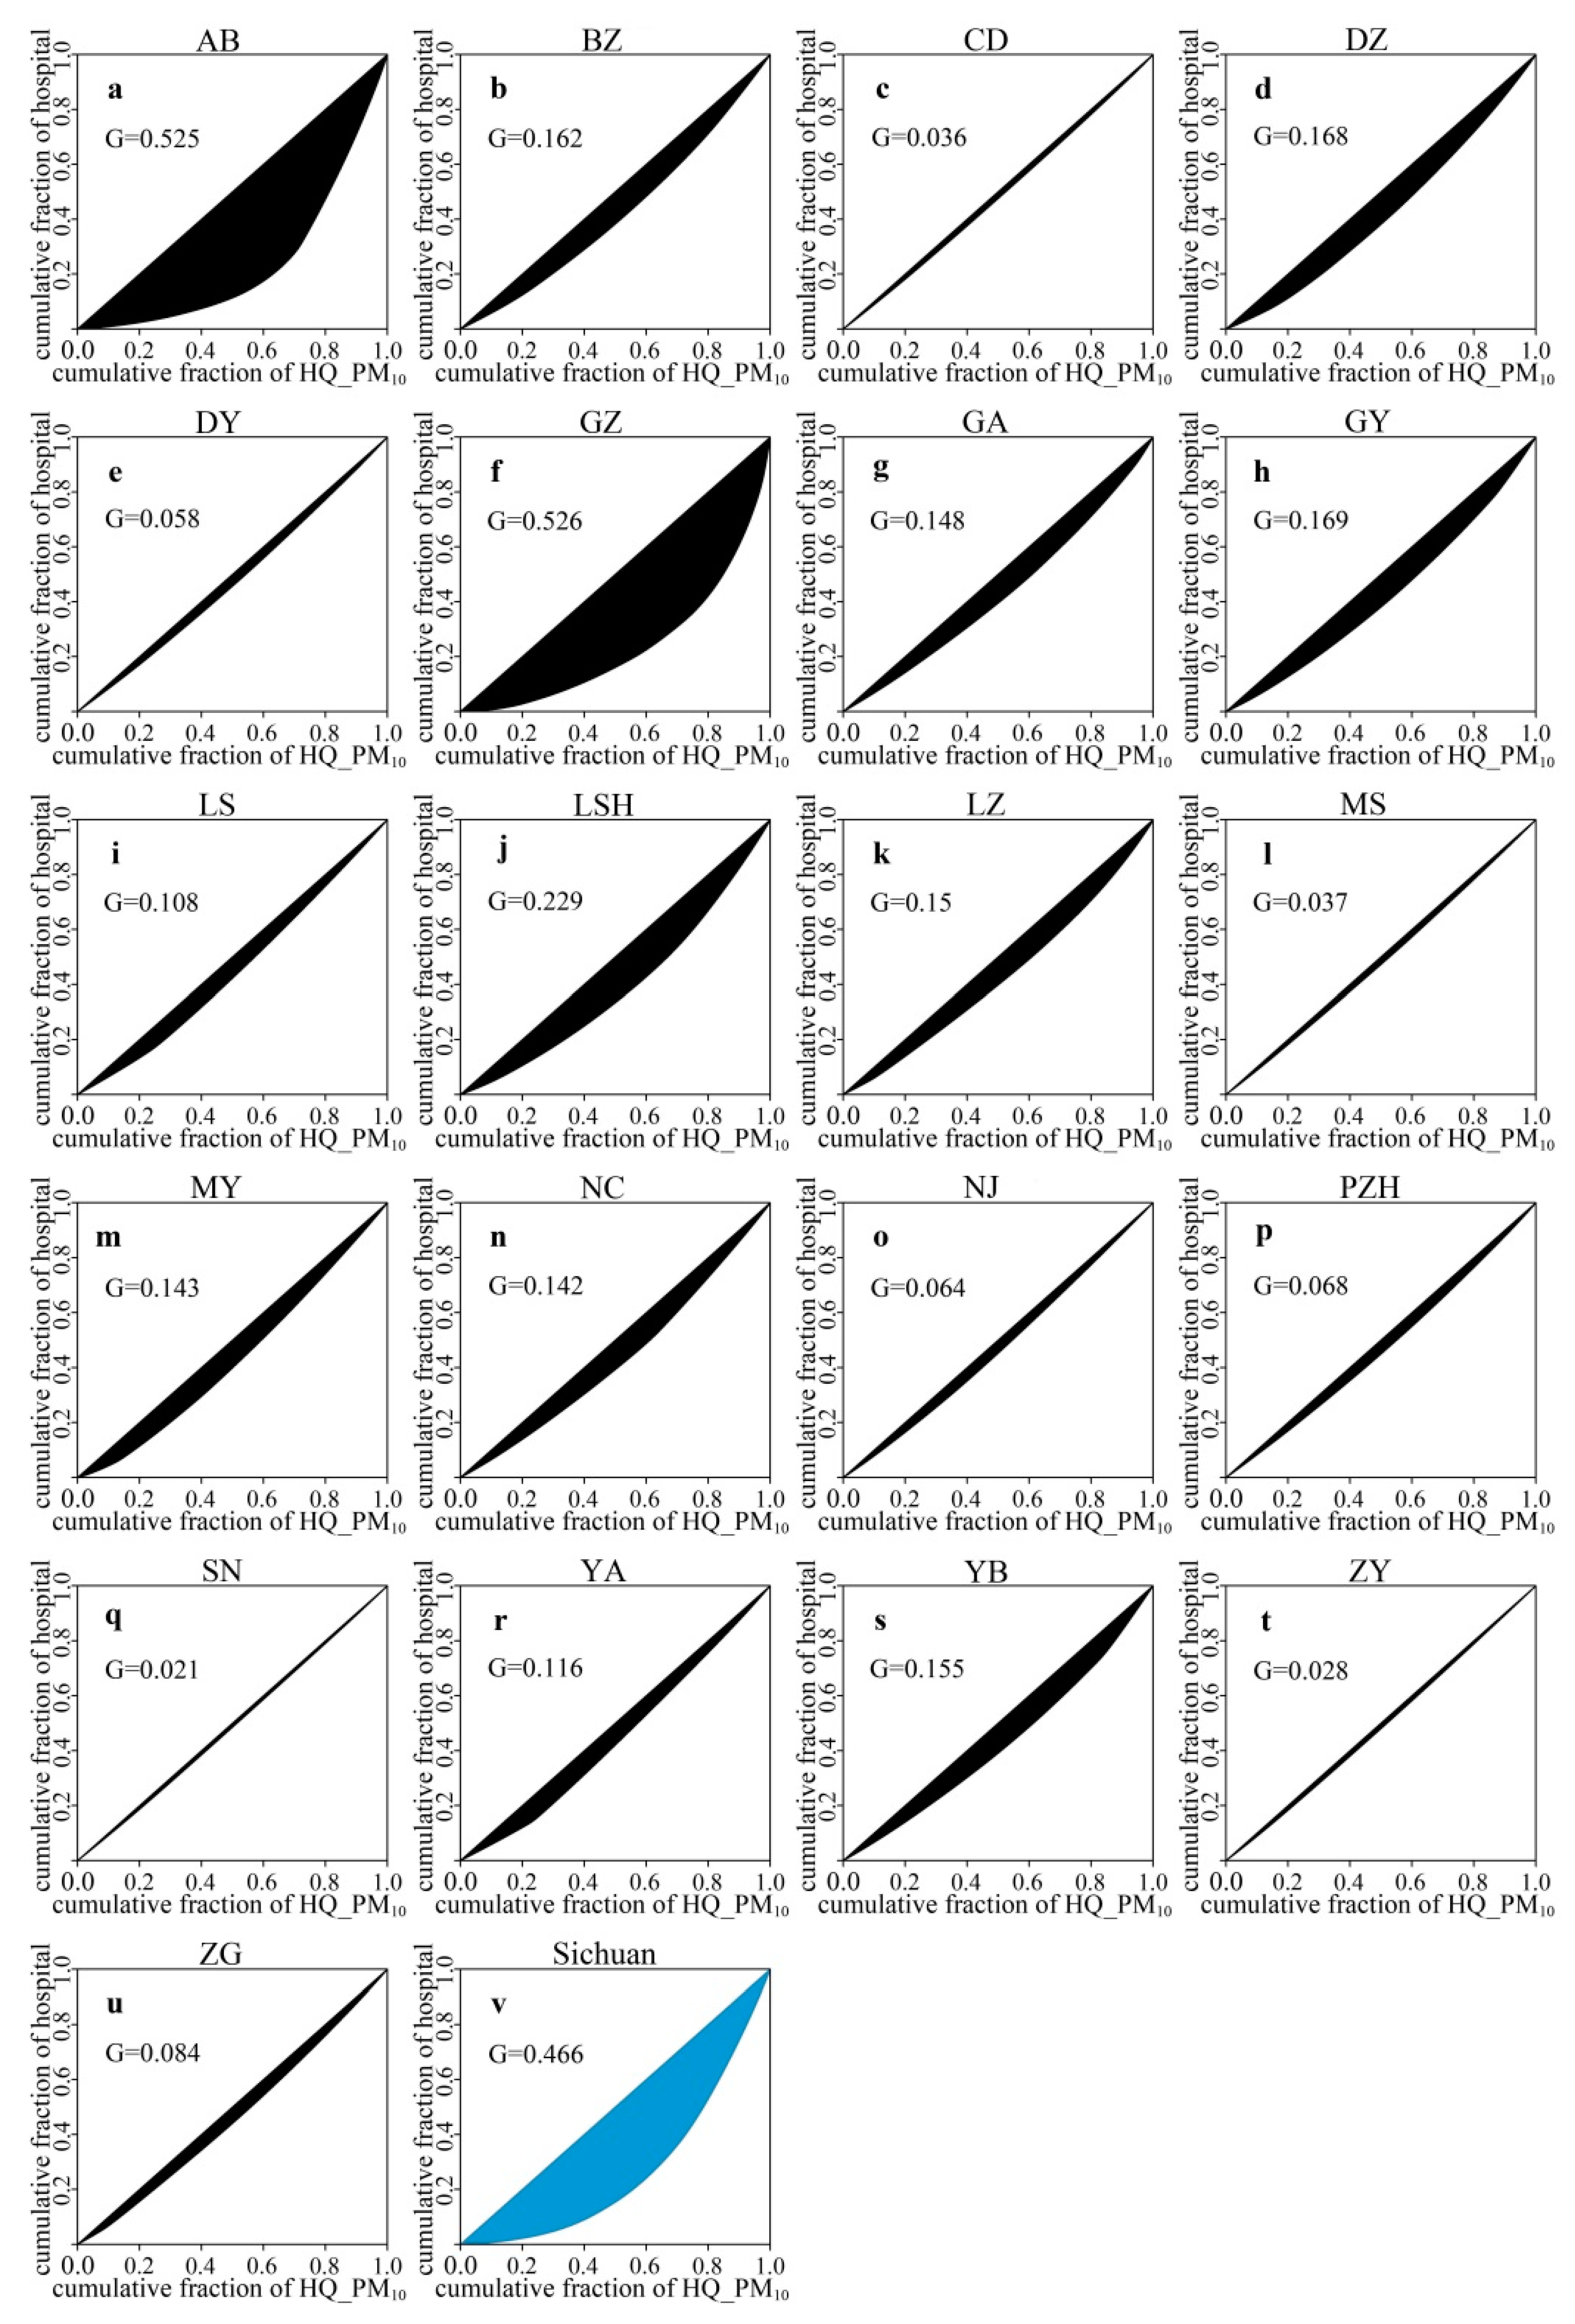
3.4. Spatial Inequality Analysis between Risk Caused by Air Pollutants and Hospital Density
4. Discussion
4.1. Spatial and Temporal Patterns of Air Pollutants
4.2. Health Risk Assessment of the Population
4.3. The Health Resilience Assessment and Spatial Inequality Analysis
4.4. Uncertainties and Limitations
5. Conclusions
Author Contributions
Funding
Conflicts of Interest
References
- Stockman, J.A. Main air pollutants and myocardial infarction: A systematic review and meta-analysis. JAMA 2013, 307, 713–721. [Google Scholar] [CrossRef]
- Cariolet, J.M.; Colombert, M.; Vuillet, M.; Diab, Y. Assessing the resilience of urban areas to traffic-related air pollution: Application in Greater Paris. Sci. Total Environ. 2018, 615, 588–596. [Google Scholar] [CrossRef] [PubMed]
- Kumar, A.; Mishra, R.K. Human health risk assessment of major air pollutants at transport corridors of Delhi, India. J. Trans. Health 2018, 10, 132–143. [Google Scholar] [CrossRef]
- Huang, R.J.; Zhang, Y.; Bozzetti, C.; Ho, K.F.; Cao, J.J.; Han, Y.; Daellenbach, K.R.; Slowik, J.G.; Platt, S.M.; Canonaco, F.; et al. High secondary aerosol contribution to particulate pollution during haze events in China. Nature 2014, 514, 218–222. [Google Scholar] [CrossRef] [PubMed] [Green Version]
- Betha, R.; Behera, S.N.; Balasubramanian, R. 2013 Southeast Asian smoke haze: Fractionation of particulate-bound elements and associated health risk. Environ. Sci. Technol. 2014, 48, 4327–4335. [Google Scholar] [CrossRef]
- Yu, G.; Wang, F.; Hu, J.; Liao, Y.; Liu, X. Value assessment of health losses caused by PM2.5 in Changsha City, China. Int. J. Environ. Res. Public Health 2019, 16, 2063. [Google Scholar] [CrossRef] [PubMed]
- Yun, G.; He, Y.; Jiang, Y.; Dou, P.; Dai, S. PM2.5 spatiotemporal evolution and drivers in the Yangtze River Delta between 2005 and 2015. Atmosphere 2019, 10, 55. [Google Scholar] [CrossRef]
- Lim, S.S.; Vos, T.; Flaxman, A.D.; Danaei, G.; Shibuya, K.; Adair-Rohani, H.; AlMazroa, M.A.; Amann, M.; Anderson, H.R.; Andrews, K.G.; et al. A comparative risk assessment of burden of disease and injury attributable to 67 risk factors and risk factor clusters in 21 regions, 1990–2010: A systematic analysis for the Global Burden of Disease Study 2010. Lancet 2012, 380, 2224–2260. [Google Scholar] [CrossRef]
- Zhang, Z.; Wang, J.; Chen, L.; Chen, X.; Sun, G.; Zhong, N.; Kan, H.; Lu, W. Impact of haze and air pollution-related hazards on hospital admissions in Guangzhou, China. Environ. Sci. Pollut. Res. Int. 2014, 21, 4236–4244. [Google Scholar] [CrossRef]
- Liu, T.; Zhang, Y.H.; Xu, Y.J.; Lin, H.L.; Xu, X.J.; Luo, Y.; Xiao, J.; Zeng, W.L.; Zhang, W.F.; Chu, C.; et al. The effects of dust-haze on mortality are modified by seasons and individual characteristics in Guangzhou, China. Environ. Pollut. 2014, 187, 116–123. [Google Scholar] [CrossRef]
- Ghozikali, M.G.; Mosaferi, M.; Safari, G.H.; Jaafari, J. Effect of exposure to O3, NO2, and SO2 on chronic obstructive pulmonary disease hospitalizations in Tabriz, Iran. Environ. Sci. Pollut. Res. 2014, 22, 2817–2823. [Google Scholar] [CrossRef] [PubMed]
- Zanobetti, A.; Schwartz, J.; Dockery, D.W. Airborne particles are a risk factor for hospital admissions for heart and lung disease. Environ. Health Perspect. 2000, 108, 1071–1077. [Google Scholar] [CrossRef] [PubMed]
- Thabethe, N.D.; Engelbrecht, J.C.; Wright, C.Y.; Oosthuizen, M.A. Human health risks posed by exposure to PM10 for four life stages in a low socio-economic community in South Africa. Pan Afr. Med. J. 2014, 18, 206. [Google Scholar] [PubMed]
- Matooane, M.; Diab, R. Health risk assessment for sulfur dioxide pollution in South Durban, South Africa. Arch. Environ. Health Int. J. 2003, 58, 763–770. [Google Scholar] [CrossRef] [PubMed]
- Morakinyo, O.M.; Adebowale, A.S.; Mokgobu, M.I.; Mukhola, M.S. Health risk of inhalation exposure to sub-10 μm particulate matter and gaseous pollutants in an urban-industrial area in South Africa: An ecological study. BMJ Open 2017, 7, e013941. [Google Scholar] [CrossRef] [PubMed]
- Ding, M.; Heiser, M.; Hübl, J.; Fuchs, S. Regional vulnerability assessment for debris flows in China—A CWS approach. Landslides 2015, 13, 537–550. [Google Scholar] [CrossRef]
- Duh, J.D.; Shandas, V.; Chang, H.; George, L.A. Rates of urbanisation and the resiliency of air and water quality. Sci. Total Environ. 2008, 400, 238–256. [Google Scholar] [CrossRef] [PubMed]
- Wulff, K.; Donato, D.; Lurie, N. What is health resilience and how can we build it? Annu. Rev. Public Health 2015, 36, 361–374. [Google Scholar] [CrossRef]
- Chai, F.; Gao, J.; Chen, Z.; Wang, S.; Zhang, Y.; Zhang, J.; Zhang, H.; Yun, Y.; Ren, C. Spatial and temporal variation of particulate matter and gaseous pollutants in 26 cities in China. J. Environ. Sci. 2014, 26, 75–82. [Google Scholar] [CrossRef]
- Chen, Y.; Xie, S. Characteristics and formation mechanism of a heavy air pollution episode caused by biomass burning in Chengdu, Southwest China. Sci. Total Environ. 2014, 473–474, 507–517. [Google Scholar] [CrossRef]
- Coates, J.; Mar, K.A.; Ojha, N.; Butler, T.M. The influence of temperature on ozone production under varying NOx conditions–A modelling study. Atmos. Chem. Phys. 2016, 16, 11601–11615. [Google Scholar] [CrossRef]
- Dimitriou, K.; Kassomenos, P. Three year study of tropospheric ozone with back trajectories at a metropolitan and a medium scale urban area in Greece. Sci. Total Environ. 2015, 502, 493–501. [Google Scholar] [CrossRef] [PubMed]
- Gao, J.; Zhu, B.; Xiao, H.; Kang, H.; Hou, X.; Shao, P. A case study of surface ozone source apportionment during a high concentration episode, under frequent shifting wind conditions over the Yangtze River Delta, China. Sci. Total Environ. 2016, 544, 853–863. [Google Scholar] [CrossRef] [PubMed]
- Guan, Q.; Cai, A.; Wang, F.; Yang, L.; Xu, C.; Liu, Z. Spatio-temporal variability of particulate matter in the key part of Gansu Province, Western China. Environ. Pollut. 2017, 230, 189–198. [Google Scholar] [CrossRef] [PubMed]
- Wang, H.; Tian, C.; Wang, W.; Luo, X. Temporal cross-correlations between ambient air pollutants and seasonality of tuberculosis: A time-series Analysis. Int. J. Environ. Res. Public Health 2019, 16, 1585. [Google Scholar] [CrossRef] [PubMed]
- Cai, K.; Li, C.; Na, S. Spatial distribution, pollution source, and health risk assessment of heavy metals in atmospheric depositions: A case study from the sustainable city of Shijiazhuang, China. Atmosphere 2019, 10, 222. [Google Scholar] [CrossRef]
- Sichuan Bureau of Statistics. Available online: http://tjj.sc.gov.cn/ (accessed on 5 May 2019).
- China National Environmental Monitoring Center. Available online: http://113.108.142.147:20035/emcpublish/ (accessed on 5 October 2018).
- Zhao, S.; Yu, Y.; Yin, D.; Qin, D.; He, J.; Dong, L. Spatial patterns and temporal variations of six criteria air pollutants during 2015 to 2017 in the city clusters of Sichuan Basin, China. Sci. Total Environ. 2018, 624, 540–557. [Google Scholar] [CrossRef]
- Hu, J.; Wang, Y.; Ying, Q.; Zhang, H. Spatial and temporal variability of PM2.5 and PM10 over the North China Plain and the Yangtze River Delta, China. Atmos. Environ. 2014, 95, 598–609. [Google Scholar] [CrossRef]
- Yao Zhi Data. Available online: https://db.yaozh.com/hmap (accessed on 16 December 2018).
- Bae, H.-J.; Kang, J.E.; Lim, Y.-R. Assessing the health vulnerability caused by climate and air pollution in Korea using the fuzzy TOPSIS. Sustainability 2019, 11, 2894. [Google Scholar] [CrossRef]
- Sichuan Health Statistics Yearbook. Available online: https: //www.xnjdcbs.com (accessed on 15 March 2019).
- Liu, Z.; Yang, H.; Xiong, W.; Chen, G. Spatial accessibilities of medical services at county level based on optimized two-step floating catchment area method. Sci. Geogr. Sin. 2017, 37, 728–737. [Google Scholar]
- Zhou, T.; Sun, J.; Yu, H. Temporal and spatial patterns of China’s main air pollutants: Years 2014 and 2015. Atmosphere 2017, 8, 137. [Google Scholar] [CrossRef]
- Ambient Air Quality Standard (GB3095-2012). Available online: http://www.jingbian.gov.cn/zdzl/jbxzwgksdzl/zwwgk/jcgk/hjbh/62929.htm (accessed on 26 December 2018).
- Zhong, M. Health Risk and Health Impact Assessment of Exposure to Air Pollutants in Xi’an; Xi’an University of Architecture and Technology: Xian, China, 2017. [Google Scholar]
- Sun, J.; Zhou, T. Health risk assessment of China’s main air pollutants. BMC Public Health 2017, 17, 212. [Google Scholar] [CrossRef] [PubMed]
- US Environmental Protection Agency. Available online: http://www.epa.gov/ncea/expofac.htm (accessed on 5 January 2019).
- Wang, H.; Zhang, B.; Liu, Y.; Liu, Y.; Xu, S.; Deng, Y.; Zhao, Y.; Chen, Y.; Hong, S. Multi-dimensional analysis of urban expansion patterns and their driving forces based on the center of gravity-GTWR model: Acase study of the Beijing-Tianjin-Hebei urban agglomeration. Acta Geogr. Sin. 2018, 73, 1076–1092. [Google Scholar]
- Xiong, J.; Ye, C.; Cheng, W.; Guo, L.; Zhou, C.; Zhang, X. The spatiotemporal distribution of flash floods and analysis of partition driving forces in Yunnan Province. Sustainability 2019, 11, 2926. [Google Scholar] [CrossRef]
- Abdi, H.; Williams, L.J. Principal component analysis. Wiley Interdiscip. Rev. Comput. Stat. 2010, 2, 433–459. [Google Scholar] [CrossRef]
- He, C.; Li, M.; Li, T.; Peng, X.; Li, J.; Zhao, J. Comparison and analysis of the four methods of determining weights in multi-objective comprehensive evaluation. J. Hubei Univ. (Nat. Sci.) 2016, 38, 172–178. [Google Scholar]
- Xiu, C.; Wei, Y.; Wang, Q. Evaluation of urban resilience of Dalian city based on the perspective of “Size-Density-Morphology”. Acta Geogr. Sin. 2018, 73, 2315–2328. [Google Scholar]
- Safi, M.N.; Zobitz, J.M. Quantifying distribution in carbon uptake and environmental measurements with the Gini coefficient. Lett. Biomath. 2016, 3, 1–12. [Google Scholar] [CrossRef]
- Dong, L.; Liang, H. Spatial analysis on China’s regional air pollutants and CO2 emissions: Emission pattern and regional disparity. Atmos. Environ. 2014, 92, 280–291. [Google Scholar] [CrossRef]
- Saha, D.; Kemanian, A.R.; Montes, F.; Gall, H.; Adler, P.R.; Rau, B.M. Lorenz curve and Gini coefficient reveal hot spots and hot moments for nitrous oxide emissions. J. Geophys. Res. Biogeosci. 2018, 123, 193–206. [Google Scholar] [CrossRef]
- Ke, B. Research on the Emission Inventory of Major Air Pollutants in 2012 for the Sichuan City Cluster in China; Southwest Jiaotong University: Chengdu, China, 2014. [Google Scholar]
- Cheng, H.; Wang, Z.; Feng, J.; Chen, H.; Zhang, F.; Liu, J. Carbonaceous species composition and source apportionment of PM2.5 in urban atmosphere of Wuhan. Ecol. Environ. Sci. 2012, 21, 1574–1579. [Google Scholar]
- Zhou, X. Tibetan area economic development of Sichuan Province profile in Ganzi, Aba, and Muli County. J. Southwest Univ. Natl. (Humanit. Soc. Sci.) 2008, 29, 27–31. [Google Scholar]
- Zhao, B.; Ma, J. Development of an air pollutant emission inventory for Tianjin. Acta Sci. Circumst. 2008, 28, 368–375. [Google Scholar]
- Zhong, X. The only way to upgrade the industrial structure of Panzhihua is to extend and develop the vanadium titanium industrial chain. Sci. Technol. Inf. 2013, 25, 165–168. [Google Scholar]
- Yan, J.; Wang, W.; Yang, N.; Jiang, Y. Effect of increasing motor vehicles on atmospheric nitrogen dioxide concentration in Chengdu. Sichuan Environ. 2012, 31, 34–36. [Google Scholar]
- Wang, Y.; Ying, Q.; Hu, J.; Zhang, H. Spatial and temporal variations of six criteria air pollutants in 31 provincial capital cities in China during 2013–2014. Environ. Int. 2014, 73, 413–422. [Google Scholar] [CrossRef] [PubMed]
- Tai, A.P.K.; Mickley, L.J.; Jacob, D.J. Correlations between fine particulate matter (PM2.5) and meteorological variables in the United States: Implications for the sensitivity of PM2.5 to climate change. Atmos. Environ. 2010, 44, 3976–3984. [Google Scholar] [CrossRef]
- Xie, Y.; Zhao, B.; Zhang, L.; Luo, R. Spatiotemporal variations of PM2.5 and PM10 concentrations between 31 Chinese cities and their relationships with SO2, NO2, CO and O3. Particuology 2015, 20, 141–149. [Google Scholar] [CrossRef]
- Li, G.; Bei, N.; Cao, J.; Wu, J.; Long, X.; Feng, T.; Dai, W.; Liu, S.; Zhang, Q.; Tie, X. Widespread and persistent ozone pollution in eastern China during the non-winter season of 2015: Observations and source attributions. Atmos. Chem. Phys. 2017, 17, 2759–2774. [Google Scholar] [CrossRef]
- Millán, M.M.; Mantilla, E.; Salvador, R.; Carratalá, A.; Sanz, M.J.; Alonso, L.; Gangoiti, G.; Navazo, M. Ozone Cycles in the Western Mediterranean Basin: Interpretation of Monitoring Data in Complex Coastal Terrain. J. Appl. Meteorol. 2000, 39, 487–508. [Google Scholar] [CrossRef]
- Zeng, S.; Zheng, Y. Analysis of a Severe Pollution Episode in December 2017 in Sichuan Province. Atmosphere 2019, 10, 156. [Google Scholar] [CrossRef]
- Liu, N. Relevance of Air Pollutants with Respiratory Tract Infection in Children in Hengshui; Hebei Medical University: Shijiazhuang, China, 2015. [Google Scholar]
- Shi, J. Analytical solution for the dispersion of pollutants from elevated source particles under gravity sedimentation. Environ. Res. Monit. 1985, 1, 1–5. [Google Scholar]
- Morris, R.D. Airborne particulates and hospital admissions for cardiovascular disease: A quantitative review of the evidence. Environ. Health Perspect. 2001, 109, 495–500. [Google Scholar] [PubMed]
- Qiao, X.; Jaffe, D.; Tang, Y.; Bresnahan, M.; Song, J. Evaluation of air quality in Chengdu, Sichuan Basin, China: Are China’s air quality standards sufficient yet? Environ. Monit. Assess. 2015, 187, 250. [Google Scholar] [CrossRef] [PubMed]
- Mou, D. Prevention and control of animal diseases or an important breakthrough for industrial poverty alleviation—Thinking and suggestions on the poverty alleviation in Sichuan Tibetan areas. Sichuan Anim. Vet. Sci. 2018, 45, 20–21. [Google Scholar]
- Yang, T.; Wang, D. Governance of prairie rat wasteland in Ganzi. Chin. J. Anim. Sci. 2016, 54–56. [Google Scholar] [CrossRef]
- Mou, J. Economic scholar Du Shouhu: Paying attention to people’s livelihood is the key to development. Sichuan Prov. Cond. 2013, 27–29. [Google Scholar] [CrossRef]
- Zhang, Z. Spatiotemporal Distributions of PM2.5 Using Ground Monitor Data and Its Relationship with Hospital Visiting of Respiratory Diseases; Zhejiang University: Hangzhou, China, 2016. [Google Scholar]
- Ning, G.; Wang, S.; Ma, M.; Ni, C.; Shang, Z.; Wang, J.; Li, J. Characteristics of air pollution in different zones of Sichuan Basin, China. Sci. Total Environ. 2018, 612, 975–984. [Google Scholar] [CrossRef]
- Chen, P.; Yang, J.; Pu, T.; Li, C.; Guo, J.; Tripathee, L.; Kang, S. Spatial and temporal variations of gaseous and particulate pollutants in six sites in Tibet, China, during 2016–2017. Aerosol Air Qual. Res. 2019, 19, 516–527. [Google Scholar] [CrossRef]


| City | Abbreviation | City | Abbreviation | City | Abbreviation |
|---|---|---|---|---|---|
| Aba | AB | Guangyuan | GY | Neijiang | NJ |
| Bazhong | BZ | Leshan | LS | Panzhihua | PZH |
| Chengdu | CD | Liangshan | LSH | Suining | SN |
| Dazhou | DZ | Luzhou | LZ | Yaan | YA |
| Deyang | DY | Meishan | MS | Yibin | YB |
| Ganzi | GZ | Mianyang | MY | Ziyang | ZY |
| Guangan | GA | Nanchong | NC | Zigong | ZG |
| Indicators | Data Source | Resolution | Data Type | Time |
|---|---|---|---|---|
| Hospital | China: Yao Zhi Data | – | – | 2015 |
| GDP | China: Resource and Environment Data Cloud Platform | 1 km × 1 km | Raster data | 2015 |
| Roads | China: National Earth System Science Data Sharing Infrastructure | 1:250,000 | Vector data | 2016 |
| Land use | China: Resource and Environment Data Cloud Platform | 1 km × 1 km | Raster data | 2015 |
| NPP-VIIRS Night-time light | USA: National Oceanic and Atmospheric Administration | 500 × 500 m | Raster data | 2015–2017 |
| Air Pollutants | Annual Mean Concentration | Unit | |
|---|---|---|---|
| Grade I | Grade II | ||
| PM2.5 | 15 | 35 | μg m−3 |
| PM10 | 40 | 70 | μg m−3 |
| SO2 | 20 | 60 | μg m−3 |
| NO2 | 40 | 40 | μg m−3 |
| Exposed Group | IR (m3 day−1) | ED (day) | BW (kg) | AT (day) |
|---|---|---|---|---|
| Infant | 6.8 | 1 × 350 | 11.3 | 1 × 365 |
| Child | 13.5 | 12 × 350 | 45.3 | 12 × 365 |
| Adult | 13.3 | 30 × 350 | 71.8 | 30 × 365 |
© 2019 by the authors. Licensee MDPI, Basel, Switzerland. This article is an open access article distributed under the terms and conditions of the Creative Commons Attribution (CC BY) license (http://creativecommons.org/licenses/by/4.0/).
Share and Cite
Xiong, J.; Ye, C.; Zhou, T.; Cheng, W. Health Risk and Resilience Assessment with Respect to the Main Air Pollutants in Sichuan. Int. J. Environ. Res. Public Health 2019, 16, 2796. https://0-doi-org.brum.beds.ac.uk/10.3390/ijerph16152796
Xiong J, Ye C, Zhou T, Cheng W. Health Risk and Resilience Assessment with Respect to the Main Air Pollutants in Sichuan. International Journal of Environmental Research and Public Health. 2019; 16(15):2796. https://0-doi-org.brum.beds.ac.uk/10.3390/ijerph16152796
Chicago/Turabian StyleXiong, Junnan, Chongchong Ye, Tiancai Zhou, and Weiming Cheng. 2019. "Health Risk and Resilience Assessment with Respect to the Main Air Pollutants in Sichuan" International Journal of Environmental Research and Public Health 16, no. 15: 2796. https://0-doi-org.brum.beds.ac.uk/10.3390/ijerph16152796