Risk Assessment in Urban Large-Scale Public Spaces Using Dempster-Shafer Theory: An Empirical Study in Ningbo, China


Abstract
:1. Introduction
2. Related Studies
2.1. Risk and Risk Assessment Analysis
2.2. DST and Applications
2.3. Visualization of Risk Analysis Studies
3. Method
3.1. Dempster-Shafer Theory (DST)
3.1.1. Framework of Discernment (FoD)
3.1.2. Basic Belief Assignment (BBA)
3.1.3. Dempster’s Combination Rule
3.2. Risk Assessment Index System (RAIS)
3.2.1. Preliminary RAIS
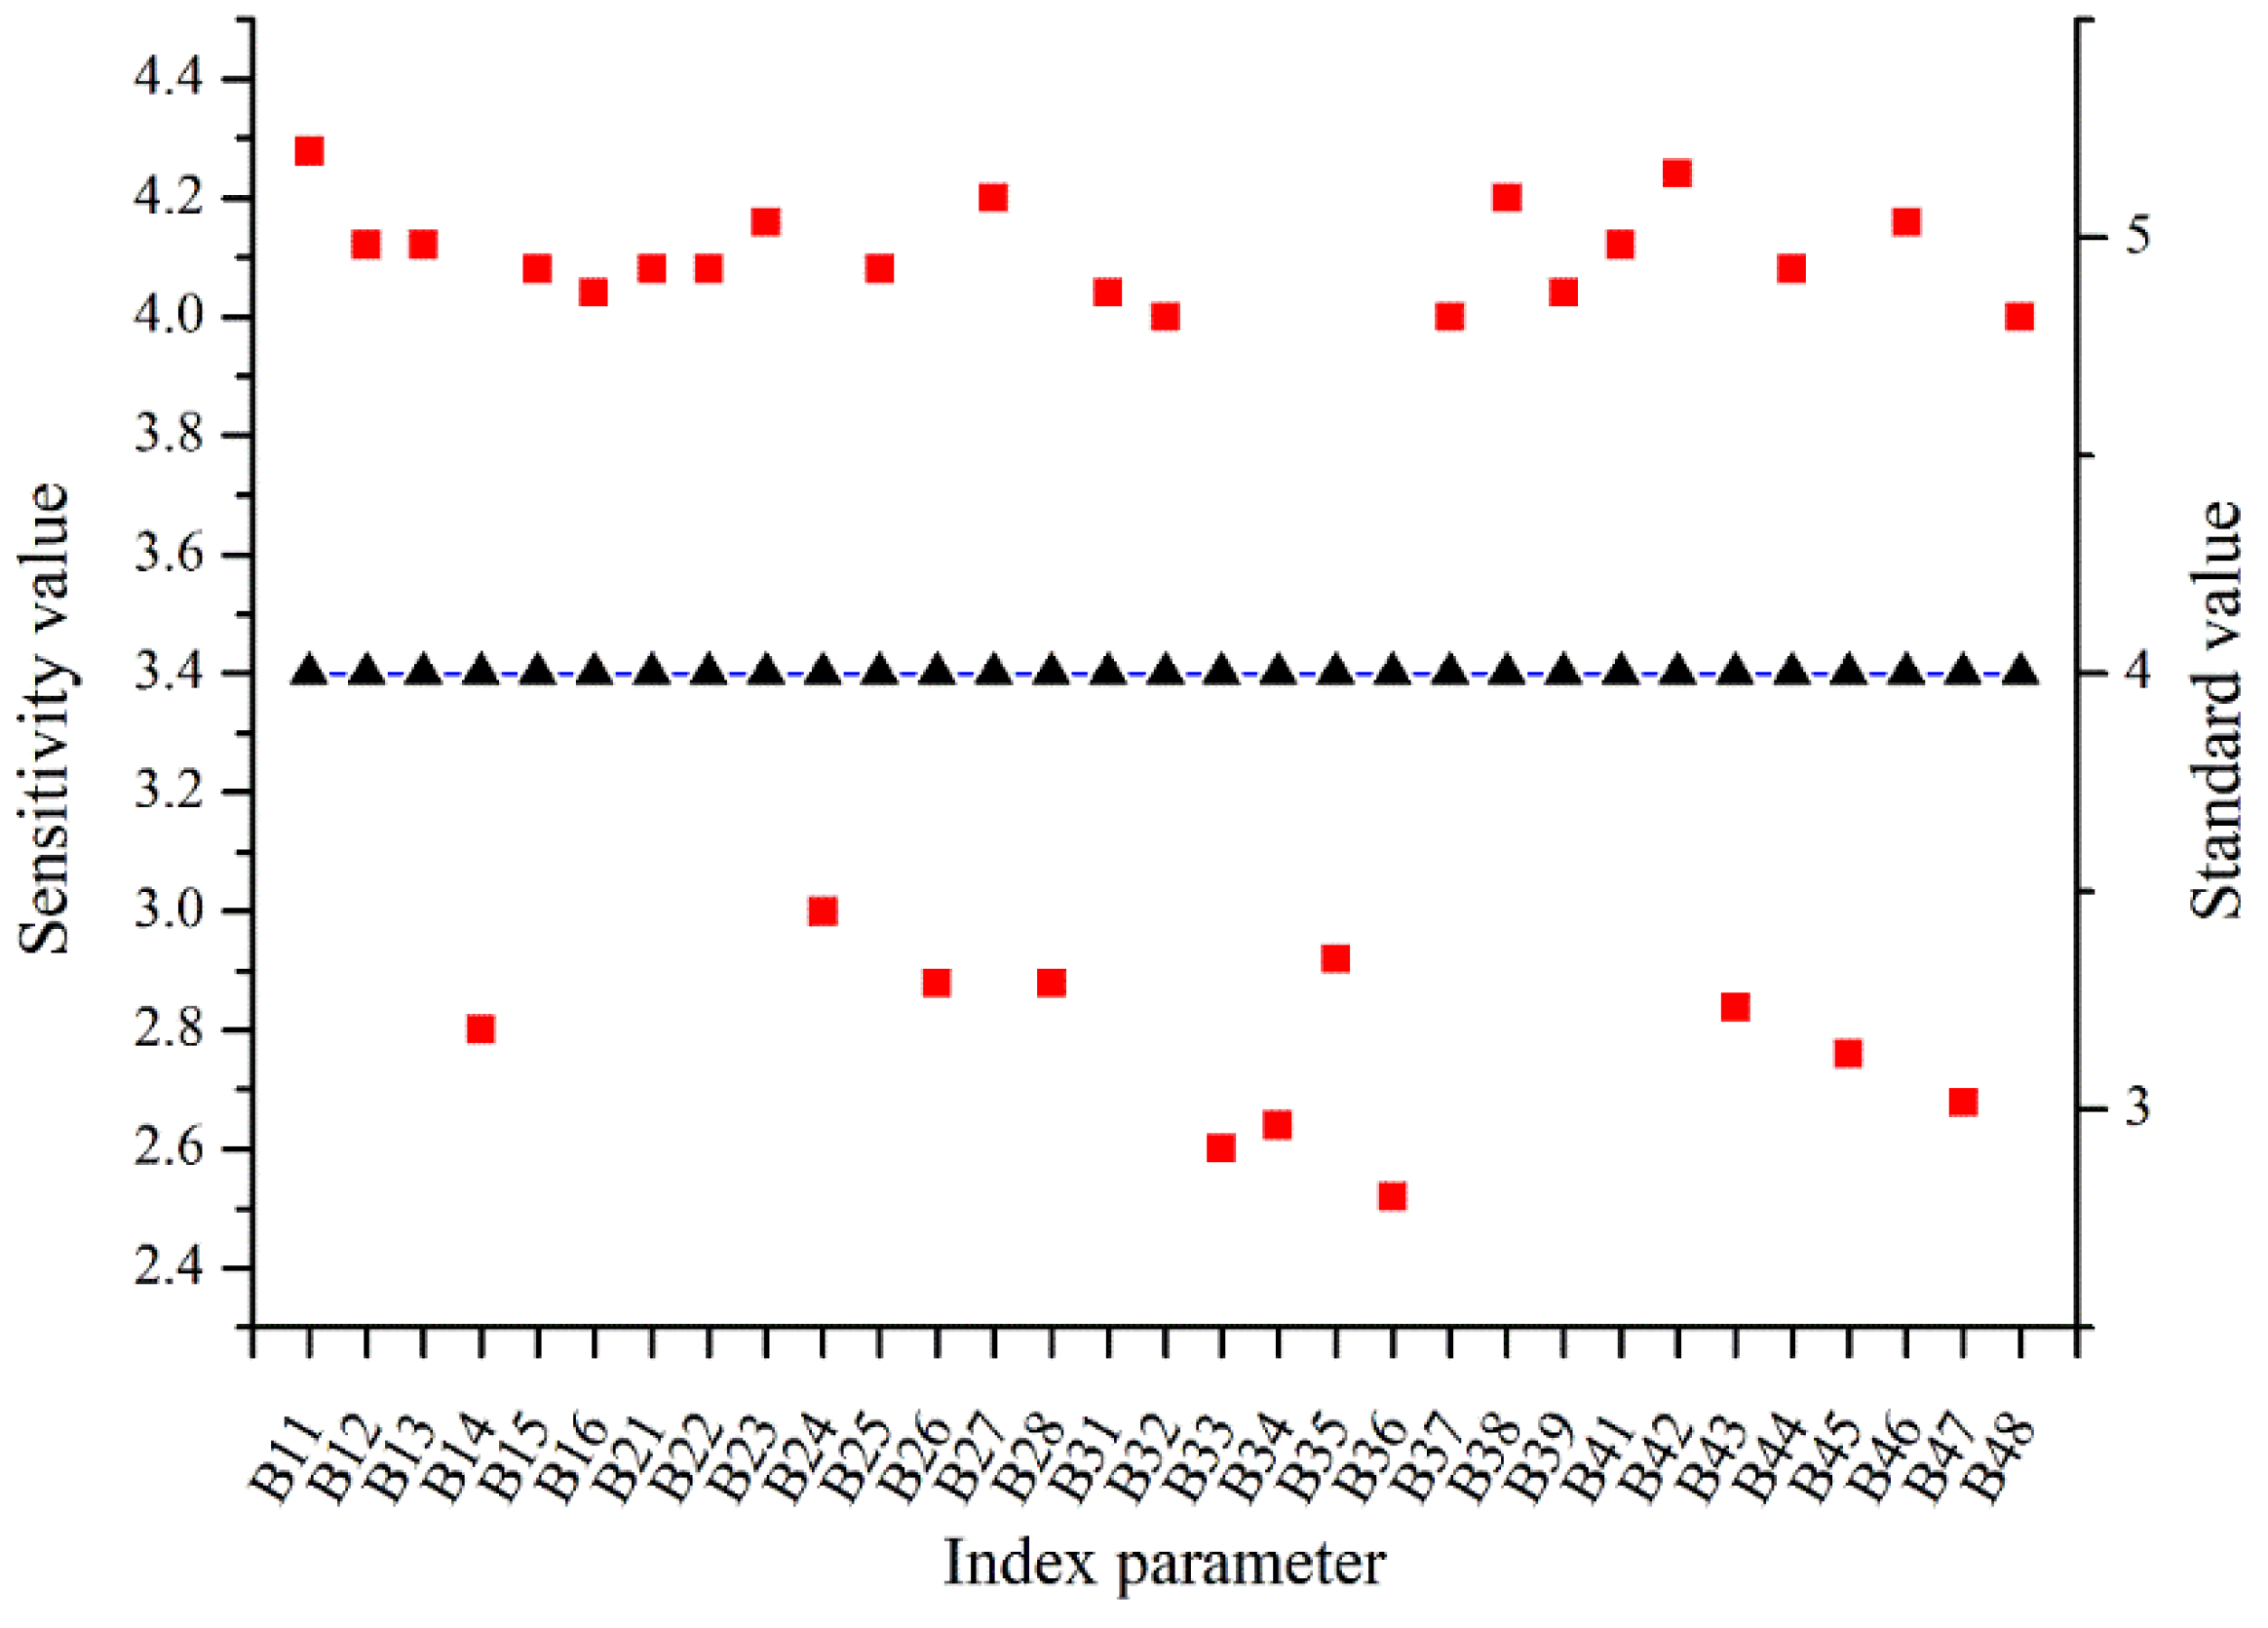
3.2.2. Sensitivity Analysis of Indicators
3.3. Determination of the Weight of Risk Assessment Indicators
3.3.1. Collection of Expert Opinions for RAIS
3.3.2. Calculation of Indicator Weight
4. Case Study
4.1. Data Collection
4.2. Calculation of Index Weight for RAIS
4.3. Evidence fusion Process of Security Risk Assessment
4.4. Outcome of the Risk Assessment
5. Discussions
6. Conclusions
- (1)
- A robust risk indicator system for assessing the security risk of large-scale public spaces were selected by Delphi method and information entropy method, which included four first-level indicators and twenty second-level indicators. The first-level indicators were environmental factors, human factors, infrastructure factors, and management factors. There was five second-level indicators belonging to the environmental factors, which were architectural layout, weather, external traffic, public health, and social stability; and there was also five second-level indicators belonging to the human factors, which were crowd characteristics, negligence behavior, macroscopic fundamental diagram, safety awareness, and panic. Meanwhile, there was five second-level indicators belonging to the infrastructure factors, which were exit, guide sign, alarm system, firefighting system, broadcasting and monitoring system; and there was also five second-level indicators belonging to the management factors, which were personnel training, public health management, event organization and management, emergency evacuation management, and infrastructure management.
- (2)
- Data were collected in Ningbo, using an expert questionnaire survey approach based on the RAIS. The survey results showed that the risk indicator system for the ULPS assessment process is scientific and reasonable. In the risk index system, twelve variables were found to be statistically significant, which were ranked by weights: emergency evacuation management, personnel training, crowd characteristic, macroscopic fundamental diagram, public health management, exit, event organization and management, broadcasting monitoring system, public health environment, negligence behavior, weather, alarm system, infrastructure management, panic, external traffic, guide sign, safety awareness, firefighting system, architectural layout, and social stability. In addition, in the calculation process of weights, we fully considered the expert’s knowledge background and opinions, and reduce the uncertainty in the assessment, which was characterized by strong explanatory and high precision.
- (3)
- A Dempster-Shafer Theory with evidence fusion technique was employed to analyze the interaction between the RAIS and risk level in the ULPS. The results from the DST approach indicated that three variables were found to be excellent level, which were ranked by importance: environmental factors, human factors, infrastructure factors. Only one variable was found to be good level, which were management factors. The results from the value of the MASS function indicated that three indicators were found in higher risk level, which were guiding signs, alarm system, and personnel training. Simultaneously, eleven indicators were found in a higher safety level, which were weather, external traffic, public health environment, social stability, crowd characteristic, negligence behavior, macroscopic fundamental diagram, panic, exit, broadcasting monitoring system, public health management. The findings of this study provided insight into the factors associated with environmental factors, human factors, infrastructure factors, and management factors in the ULPS.
Author Contributions
Funding
Conflicts of Interest
Abbreviations
| Symbol | Explain |
| Frame of discernment | |
| m(A) | Basic probability assignment function |
| bel(A) | Belief function, which is based on the basic probability assignment in the FoD |
| pl(A) | Plausibility function, which is based on the basic probability assignment in the FoD |
| Distance between two evidences, mi and mj | |
| D | A matrix of 2N×2N |
| Sim | Similarity matrix of evidence |
| Calibration coefficient, which is used to correct the original matrix | |
| K | Normalized constant |
| F | Linear weighting of the mass function and weight of each indicator |
| k | Number of experts in each group |
| n | Number of expert groups hired to participate in the review |
| k | Number of experts in each group |
| n | Number of expert groups hired to participate in the review |
| G | Ranking value given by the experts |
| N | Index value after standardization conversion |
| Membership degree | |
| n | Number of indicators |
| Index weight coefficient | |
| Ex | Expectation, that is the central value of the spatial distribution of cloud droplets in the universe |
| En | Entropy, that is a measure of the ambiguity of a qualitative concept, reflecting the range of cloud drip values that can be accepted by the concept space |
| He | Super-entropy, that is a measure of the uncertainty of entropy, reflecting the degree of dispersion of the cloud droplets and the thickness of the cloud. |
| ◦ | Process of cloud synthesis |
| Weight of the child cloud |
Appendix A

| Indicators | Original Matrix | Normalized Matrix | Indicators | Original Matrix | Normalized Matrix | ||||||||||||||||
|---|---|---|---|---|---|---|---|---|---|---|---|---|---|---|---|---|---|---|---|---|---|
| V | IV | III | II | I | V | IV | III | II | I | V | IV | III | II | I | V | IV | III | II | I | ||
| Architectural layout | 1.000 | 0.020 | 0.000 | 0.000 | 0.000 | 0.980 | 0.020 | 0.000 | 0.000 | 0.000 | Weather | 1.000 | 0.020 | 0.000 | 0.000 | 0.000 | 0.981 | 0.019 | 0.000 | 0.000 | 0.000 |
| 0.000 | 0.020 | 0.018 | 0.000 | 0.000 | 0.000 | 0.522 | 0.478 | 0.000 | 0.000 | 1.000 | 0.020 | 0.000 | 0.000 | 0.000 | 0.981 | 0.019 | 0.000 | 0.000 | 0.000 | ||
| 0.017 | 0.100 | 0.000 | 0.000 | 0.000 | 0.145 | 0.855 | 0.000 | 0.000 | 0.000 | 1.000 | 0.020 | 0.000 | 0.000 | 0.000 | 0.981 | 0.019 | 0.000 | 0.000 | 0.000 | ||
| 1.000 | 0.020 | 0.000 | 0.000 | 0.000 | 0.980 | 0.020 | 0.000 | 0.000 | 0.000 | 1.000 | 0.020 | 0.000 | 0.000 | 0.000 | 0.981 | 0.019 | 0.000 | 0.000 | 0.000 | ||
| 0.017 | 0.100 | 0.000 | 0.000 | 0.000 | 0.145 | 0.855 | 0.000 | 0.000 | 0.000 | 1.000 | 0.020 | 0.000 | 0.000 | 0.000 | 0.981 | 0.019 | 0.000 | 0.000 | 0.000 | ||
| External traffic | 0.017 | 0.995 | 0.000 | 0.000 | 0.000 | 0.016 | 0.984 | 0.000 | 0.000 | 0.000 | Public health | 1.000 | 0.020 | 0.000 | 0.000 | 0.000 | 0.981 | 0.019 | 0.000 | 0.000 | 0.000 |
| 1.000 | 0.020 | 0.000 | 0.000 | 0.000 | 0.981 | 0.019 | 0.000 | 0.000 | 0.000 | 1.000 | 0.020 | 0.000 | 0.000 | 0.000 | 0.981 | 0.019 | 0.000 | 0.000 | 0.000 | ||
| 1.000 | 0.020 | 0.000 | 0.000 | 0.000 | 0.981 | 0.019 | 0.000 | 0.000 | 0.000 | 1.000 | 0.020 | 0.000 | 0.000 | 0.000 | 0.981 | 0.019 | 0.000 | 0.000 | 0.000 | ||
| 1.000 | 0.020 | 0.000 | 0.000 | 0.000 | 0.981 | 0.019 | 0.000 | 0.000 | 0.000 | 1.000 | 0.020 | 0.000 | 0.000 | 0.000 | 0.981 | 0.019 | 0.000 | 0.000 | 0.000 | ||
| 1.000 | 0.020 | 0.000 | 0.000 | 0.000 | 0.981 | 0.019 | 0.000 | 0.000 | 0.000 | 1.000 | 0.020 | 0.000 | 0.000 | 0.000 | 0.981 | 0.019 | 0.000 | 0.000 | 0.000 | ||
| Social stability | 1.000 | 0.020 | 0.000 | 0.000 | 0.000 | 0.981 | 0.019 | 0.000 | 0.000 | 0.000 | Crowd characteristics | 0.017 | 0.995 | 0.000 | 0.000 | 0.000 | 0.016 | 0.984 | 0.000 | 0.000 | 0.000 |
| 1.000 | 0.020 | 0.000 | 0.000 | 0.000 | 0.981 | 0.019 | 0.000 | 0.000 | 0.000 | 1.000 | 0.020 | 0.000 | 0.000 | 0.000 | 0.981 | 0.019 | 0.000 | 0.000 | 0.000 | ||
| 1.000 | 0.020 | 0.000 | 0.000 | 0.000 | 0.981 | 0.019 | 0.000 | 0.000 | 0.000 | 1.000 | 0.020 | 0.000 | 0.000 | 0.000 | 0.981 | 0.019 | 0.000 | 0.000 | 0.000 | ||
| 1.000 | 0.020 | 0.000 | 0.000 | 0.000 | 0.981 | 0.019 | 0.000 | 0.000 | 0.000 | 1.000 | 0.020 | 0.000 | 0.000 | 0.000 | 0.981 | 0.019 | 0.000 | 0.000 | 0.000 | ||
| 1.000 | 0.020 | 0.000 | 0.000 | 0.000 | 0.981 | 0.019 | 0.000 | 0.000 | 0.000 | 1.000 | 0.020 | 0.000 | 0.000 | 0.000 | 0.981 | 0.019 | 0.000 | 0.000 | 0.000 | ||
| Negligence behavior | 1.000 | 0.020 | 0.000 | 0.000 | 0.000 | 0.981 | 0.019 | 0.000 | 0.000 | 0.000 | Macroscopic fundamental diagram | 1.000 | 0.020 | 0.000 | 0.000 | 0.000 | 0.981 | 0.019 | 0.000 | 0.000 | 0.000 |
| 1.000 | 0.020 | 0.000 | 0.000 | 0.000 | 0.981 | 0.019 | 0.000 | 0.000 | 0.000 | 1.000 | 0.020 | 0.000 | 0.000 | 0.000 | 0.981 | 0.019 | 0.000 | 0.000 | 0.000 | ||
| 1.000 | 0.020 | 0.000 | 0.000 | 0.000 | 0.981 | 0.019 | 0.000 | 0.000 | 0.000 | 1.000 | 0.020 | 0.000 | 0.000 | 0.000 | 0.981 | 0.019 | 0.000 | 0.000 | 0.000 | ||
| 1.000 | 0.020 | 0.000 | 0.000 | 0.000 | 0.981 | 0.019 | 0.000 | 0.000 | 0.000 | 1.000 | 0.020 | 0.000 | 0.000 | 0.000 | 0.981 | 0.019 | 0.000 | 0.000 | 0.000 | ||
| 1.000 | 0.020 | 0.000 | 0.000 | 0.000 | 0.981 | 0.019 | 0.000 | 0.000 | 0.000 | 1.000 | 0.020 | 0.000 | 0.000 | 0.000 | 0.981 | 0.019 | 0.000 | 0.000 | 0.000 | ||
| Safety awareness | 0.017 | 0.995 | 0.000 | 0.000 | 0.000 | 0.016 | 0.984 | 0.000 | 0.000 | 0.000 | Panic | 1.000 | 0.020 | 0.000 | 0.000 | 0.000 | 0.981 | 0.019 | 0.000 | 0.000 | 0.000 |
| 0.000 | 0.020 | 0.018 | 0.000 | 0.000 | 0.000 | 0.522 | 0.478 | 0.000 | 0.000 | 1.000 | 0.020 | 0.000 | 0.000 | 0.000 | 0.981 | 0.019 | 0.000 | 0.000 | 0.000 | ||
| 0.017 | 0.995 | 0.000 | 0.000 | 0.000 | 0.016 | 0.984 | 0.000 | 0.000 | 0.000 | 0.017 | 0.995 | 0.000 | 0.000 | 0.000 | 0.016 | 0.984 | 0.000 | 0.000 | 0.000 | ||
| 0.000 | 0.020 | 0.018 | 0.000 | 0.000 | 0.000 | 0.522 | 0.478 | 0.000 | 0.000 | 0.017 | 0.995 | 0.000 | 0.000 | 0.000 | 0.016 | 0.984 | 0.000 | 0.000 | 0.000 | ||
| 1.000 | 0.020 | 0.000 | 0.000 | 0.000 | 0.981 | 0.019 | 0.000 | 0.000 | 0.000 | 1.000 | 0.020 | 0.000 | 0.000 | 0.000 | 0.981 | 0.019 | 0.000 | 0.000 | 0.000 | ||
| Exit | 1.000 | 0.020 | 0.000 | 0.000 | 0.000 | 0.981 | 0.019 | 0.000 | 0.000 | 0.000 | Guide sign | 0.000 | 0.000 | 1.000 | 0.000 | 0.000 | 0.000 | 0.000 | 1.000 | 0.000 | 0.000 |
| 0.017 | 0.995 | 0.000 | 0.000 | 0.000 | 0.016 | 0.984 | 0.000 | 0.000 | 0.000 | 0.000 | 0.020 | 0.018 | 0.000 | 0.000 | 0.000 | 0.522 | 0.478 | 0.000 | 0.000 | ||
| 1.000 | 0.020 | 0.000 | 0.000 | 0.000 | 0.981 | 0.019 | 0.000 | 0.000 | 0.000 | 0.000 | 0.000 | 1.000 | 0.000 | 0.000 | 0.000 | 0.000 | 1.000 | 0.000 | 0.000 | ||
| 0.017 | 0.995 | 0.000 | 0.000 | 0.000 | 0.016 | 0.984 | 0.000 | 0.000 | 0.000 | 0.000 | 0.020 | 0.018 | 0.000 | 0.000 | 0.000 | 0.522 | 0.478 | 0.000 | 0.000 | ||
| 1.000 | 0.020 | 0.000 | 0.000 | 0.000 | 0.981 | 0.019 | 0.000 | 0.000 | 0.000 | 0.000 | 0.000 | 0.018 | 0.019 | 0.000 | 0.000 | 0.000 | 0.493 | 0.507 | 0.000 | ||
| Alarm system | 0.000 | 0.000 | 1.000 | 0.000 | 0.000 | 0.000 | 0.000 | 1.000 | 0.000 | 0.000 | Firefighting system | 0.000 | 0.020 | 0.018 | 0.000 | 0.000 | 0.000 | 0.522 | 0.478 | 0.000 | 0.000 |
| 0.000 | 0.000 | 1.000 | 0.000 | 0.000 | 0.000 | 0.000 | 1.000 | 0.000 | 0.000 | 0.000 | 0.020 | 0.018 | 0.000 | 0.000 | 0.000 | 0.522 | 0.478 | 0.000 | 0.000 | ||
| 0.000 | 0.000 | 1.000 | 0.000 | 0.000 | 0.000 | 0.000 | 1.000 | 0.000 | 0.000 | 0.017 | 0.995 | 0.000 | 0.000 | 0.000 | 0.016 | 0.984 | 0.000 | 0.000 | 0.000 | ||
| 0.000 | 0.020 | 0.018 | 0.000 | 0.000 | 0.000 | 0.522 | 0.478 | 0.000 | 0.000 | 0.017 | 0.995 | 0.000 | 0.000 | 0.000 | 0.016 | 0.984 | 0.000 | 0.000 | 0.000 | ||
| 0.000 | 0.020 | 0.018 | 0.000 | 0.000 | 0.000 | 0.522 | 0.478 | 0.000 | 0.000 | 0.000 | 0.020 | 0.018 | 0.000 | 0.000 | 0.000 | 0.522 | 0.478 | 0.000 | 0.000 | ||
| Broadcasting and monitoring system | 1.000 | 0.020 | 0.000 | 0.000 | 0.000 | 0.981 | 0.019 | 0.000 | 0.000 | 0.000 | Personnel training | 0.000 | 0.020 | 0.018 | 0.000 | 0.000 | 0.000 | 0.522 | 0.478 | 0.000 | 0.000 |
| 1.000 | 0.020 | 0.000 | 0.000 | 0.000 | 0.981 | 0.019 | 0.000 | 0.000 | 0.000 | 0.000 | 0.000 | 1.000 | 0.000 | 0.000 | 0.000 | 0.000 | 1.000 | 0.000 | 0.000 | ||
| 1.000 | 0.020 | 0.000 | 0.000 | 0.000 | 0.981 | 0.019 | 0.000 | 0.000 | 0.000 | 0.017 | 0.995 | 0.000 | 0.000 | 0.000 | 0.016 | 0.984 | 0.000 | 0.000 | 0.000 | ||
| 1.000 | 0.020 | 0.000 | 0.000 | 0.000 | 0.981 | 0.019 | 0.000 | 0.000 | 0.000 | 0.000 | 0.020 | 0.018 | 0.000 | 0.000 | 0.000 | 0.522 | 0.478 | 0.000 | 0.000 | ||
| 1.000 | 0.020 | 0.000 | 0.000 | 0.000 | 0.981 | 0.019 | 0.000 | 0.000 | 0.000 | 1.000 | 0.020 | 0.000 | 0.000 | 0.000 | 0.981 | 0.019 | 0.000 | 0.000 | 0.000 | ||
| Public health management | 1.000 | 0.020 | 0.000 | 0.000 | 0.000 | 0.981 | 0.019 | 0.000 | 0.000 | 0.000 | Event organization and management | 1.000 | 0.020 | 0.000 | 0.000 | 0.000 | 0.981 | 0.019 | 0.000 | 0.000 | 0.000 |
| 1.000 | 0.020 | 0.000 | 0.000 | 0.000 | 0.981 | 0.019 | 0.000 | 0.000 | 0.000 | 0.000 | 0.020 | 0.018 | 0.000 | 0.000 | 0.000 | 0.522 | 0.478 | 0.000 | 0.000 | ||
| 1.000 | 0.020 | 0.000 | 0.000 | 0.000 | 0.981 | 0.019 | 0.000 | 0.000 | 0.000 | 0.017 | 0.995 | 0.000 | 0.000 | 0.000 | 0.016 | 0.984 | 0.000 | 0.000 | 0.000 | ||
| 1.000 | 0.020 | 0.000 | 0.000 | 0.000 | 0.981 | 0.019 | 0.000 | 0.000 | 0.000 | 1.000 | 0.020 | 0.000 | 0.000 | 0.000 | 0.981 | 0.019 | 0.000 | 0.000 | 0.000 | ||
| 0.017 | 0.995 | 0.000 | 0.000 | 0.000 | 0.016 | 0.984 | 0.000 | 0.000 | 0.000 | 0.017 | 0.995 | 0.000 | 0.000 | 0.000 | 0.016 | 0.984 | 0.000 | 0.000 | 0.000 | ||
| Emergency evacuation management | 1.000 | 0.020 | 0.000 | 0.000 | 0.000 | 0.981 | 0.019 | 0.000 | 0.000 | 0.000 | Infrastructure management | 1.000 | 0.020 | 0.000 | 0.000 | 0.000 | 0.981 | 0.019 | 0.000 | 0.000 | 0.000 |
| 0.000 | 0.020 | 0.018 | 0.000 | 0.000 | 0.016 | 0.984 | 0.000 | 0.000 | 0.000 | 0.000 | 0.020 | 0.018 | 0.000 | 0.000 | 0.000 | 0.522 | 0.478 | 0.000 | 0.000 | ||
| 0.000 | 0.020 | 0.018 | 0.000 | 0.000 | 0.016 | 0.984 | 0.000 | 0.000 | 0.000 | 0.000 | 0.020 | 0.018 | 0.000 | 0.000 | 0.000 | 0.522 | 0.478 | 0.000 | 0.000 | ||
| 1.000 | 0.020 | 0.000 | 0.000 | 0.000 | 0.000 | 0.522 | 0.478 | 0.000 | 0.000 | 1.000 | 0.020 | 0.000 | 0.000 | 0.000 | 0.981 | 0.019 | 0.000 | 0.000 | 0.000 | ||
| 0.017 | 0.995 | 0.000 | 0.000 | 0.000 | 0.981 | 0.019 | 0.000 | 0.000 | 0.000 | 0.017 | 0.995 | 0.000 | 0.000 | 0.000 | 0.016 | 0.984 | 0.000 | 0.000 | 0.000 | ||
| Indicators | Similar Matrix | Modified Matrix | Indicators | Similar Matrix | Modified Matrix | ||||||||||||||||||
|---|---|---|---|---|---|---|---|---|---|---|---|---|---|---|---|---|---|---|---|---|---|---|---|
| V | IV | III | II | I | V | IV | III | II | I | Θ | V | IV | III | II | I | V | IV | III | II | I | Θ | ||
| Architectural layout | 1.000 | 0.151 | 0.036 | 1.000 | 0.036 | 0.865 | 0.017 | 0.000 | 0.000 | 0.000 | 0.118 | Weather | 1.000 | 1.000 | 1.000 | 1.000 | 1.000 | 0.981 | 0.019 | 0.000 | 0.000 | 0.000 | 0.000 |
| 0.151 | 1.000 | 0.530 | 0.151 | 0.530 | 0.000 | 0.483 | 0.442 | 0.000 | 0.000 | 0.075 | 1.000 | 1.000 | 1.000 | 1.000 | 1.000 | 0.981 | 0.019 | 0.000 | 0.000 | 0.000 | 0.000 | ||
| 0.036 | 0.530 | 1.000 | 0.036 | 1.000 | 0.016 | 0.984 | 0.000 | 0.000 | 0.000 | 0.000 | 1.000 | 1.000 | 1.000 | 1.000 | 1.000 | 0.981 | 0.019 | 0.000 | 0.000 | 0.000 | 0.000 | ||
| 1.000 | 1.000 | 0.036 | 1.000 | 0.036 | 0.865 | 0.017 | 0.000 | 0.000 | 0.000 | 0.118 | 1.000 | 1.000 | 1.000 | 1.000 | 1.000 | 0.981 | 0.019 | 0.000 | 0.000 | 0.000 | 0.000 | ||
| 0.036 | 0.530 | 1.000 | 0.036 | 1.000 | 0.016 | 0.984 | 0.000 | 0.000 | 0.000 | 0.000 | 1.000 | 1.000 | 1.000 | 1.000 | 1.000 | 0.981 | 0.019 | 0.000 | 0.000 | 0.000 | 0.000 | ||
| External traffic | 1.000 | 0.036 | 0.036 | 0.036 | 0.036 | 0.009 | 0.515 | 0.000 | 0.000 | 0.000 | 0.477 | Public health | 1.000 | 1.000 | 1.000 | 1.000 | 1.000 | 0.981 | 0.019 | 0.000 | 0.000 | 0.000 | 0.000 |
| 0.036 | 1.000 | 1.000 | 1.000 | 1.000 | 0.981 | 0.019 | 0.000 | 0.000 | 0.000 | 0.000 | 1.000 | 1.000 | 1.000 | 1.000 | 1.000 | 0.981 | 0.019 | 0.000 | 0.000 | 0.000 | 0.000 | ||
| 0.036 | 1.000 | 1.000 | 1.000 | 1.000 | 0.981 | 0.019 | 0.000 | 0.000 | 0.000 | 0.000 | 1.000 | 1.000 | 1.000 | 1.000 | 1.000 | 0.981 | 0.019 | 0.000 | 0.000 | 0.000 | 0.000 | ||
| 0.036 | 1.000 | 1.000 | 1.000 | 1.000 | 0.981 | 0.019 | 0.000 | 0.000 | 0.000 | 0.000 | 1.000 | 1.000 | 1.000 | 1.000 | 1.000 | 0.981 | 0.019 | 0.000 | 0.000 | 0.000 | 0.000 | ||
| 0.036 | 1.000 | 1.000 | 1.000 | 1.000 | 0.981 | 0.019 | 0.000 | 0.000 | 0.000 | 0.000 | 1.000 | 1.000 | 1.000 | 1.000 | 1.000 | 0.981 | 0.019 | 0.000 | 0.000 | 0.000 | 0.000 | ||
| Social stability | 1.000 | 1.000 | 1.000 | 1.000 | 1.000 | 0.981 | 0.019 | 0.000 | 0.000 | 0.000 | 0.000 | Crowd characteristics | 1.000 | 0.036 | 0.036 | 0.036 | 0.036 | 0.009 | 0.515 | 0.000 | 0.000 | 0.000 | 0.477 |
| 1.000 | 1.000 | 1.000 | 1.000 | 1.000 | 0.981 | 0.019 | 0.000 | 0.000 | 0.000 | 0.000 | 0.036 | 1.000 | 1.000 | 1.000 | 1.000 | 0.981 | 0.019 | 0.000 | 0.000 | 0.000 | 0.000 | ||
| 1.000 | 1.000 | 1.000 | 1.000 | 1.000 | 0.981 | 0.019 | 0.000 | 0.000 | 0.000 | 0.000 | 0.036 | 1.000 | 1.000 | 1.000 | 1.000 | 0.981 | 0.019 | 0.000 | 0.000 | 0.000 | 0.000 | ||
| 1.000 | 1.000 | 1.000 | 1.000 | 1.000 | 0.981 | 0.019 | 0.000 | 0.000 | 0.000 | 0.000 | 0.036 | 1.000 | 1.000 | 1.000 | 1.000 | 0.981 | 0.019 | 0.000 | 0.000 | 0.000 | 0.000 | ||
| 1.000 | 1.000 | 1.000 | 1.000 | 1.000 | 0.981 | 0.019 | 0.000 | 0.000 | 0.000 | 0.000 | 0.036 | 1.000 | 1.000 | 1.000 | 1.000 | 0.981 | 0.019 | 0.000 | 0.000 | 0.000 | 0.000 | ||
| Negligence behavior | 1.000 | 0.020 | 0.000 | 0.000 | 0.000 | 0.981 | 0.019 | 0.000 | 0.000 | 0.000 | 1.000 | Macroscopic fundamental diagram | 1.000 | 1.000 | 1.000 | 1.000 | 1.000 | 0.981 | 0.019 | 0.000 | 0.000 | 0.000 | 0.000 |
| 1.000 | 0.020 | 0.000 | 0.000 | 0.000 | 0.981 | 0.019 | 0.000 | 0.000 | 0.000 | 1.000 | 1.000 | 1.000 | 1.000 | 1.000 | 1.000 | 0.981 | 0.019 | 0.000 | 0.000 | 0.000 | 0.000 | ||
| 1.000 | 0.020 | 0.000 | 0.000 | 0.000 | 0.981 | 0.019 | 0.000 | 0.000 | 0.000 | 1.000 | 1.000 | 1.000 | 1.000 | 1.000 | 1.000 | 0.981 | 0.019 | 0.000 | 0.000 | 0.000 | 0.000 | ||
| 1.000 | 0.020 | 0.000 | 0.000 | 0.000 | 0.981 | 0.019 | 0.000 | 0.000 | 0.000 | 1.000 | 1.000 | 1.000 | 1.000 | 1.000 | 1.000 | 0.981 | 0.019 | 0.000 | 0.000 | 0.000 | 0.000 | ||
| 1.000 | 0.020 | 0.000 | 0.000 | 0.000 | 0.981 | 0.019 | 0.000 | 0.000 | 0.000 | 1.000 | 1.000 | 1.000 | 1.000 | 1.000 | 1.000 | 0.981 | 0.019 | 0.000 | 0.000 | 0.000 | 0.000 | ||
| Safety awareness | 1.000 | 0.530 | 1.000 | 0.530 | 0.036 | 0.016 | 0.958 | 0.000 | 0.000 | 0.000 | 0.026 | Panic | 1.000 | 1.000 | 0.036 | 0.036 | 1.000 | 0.981 | 0.019 | 0.000 | 0.000 | 0.000 | 0.000 |
| 0.530 | 1.000 | 0.530 | 1.000 | 0.151 | 0.000 | 0.522 | 0.478 | 0.000 | 0.000 | 0.000 | 1.000 | 1.000 | 0.036 | 0.036 | 1.000 | 0.981 | 0.019 | 0.000 | 0.000 | 0.000 | 0.000 | ||
| 1.000 | 0.530 | 1.000 | 0.530 | 0.036 | 0.016 | 0.958 | 0.000 | 0.000 | 0.000 | 0.026 | 0.036 | 0.036 | 1.000 | 1.000 | 0.036 | 0.013 | 0.755 | 0.000 | 0.000 | 0.000 | 0.233 | ||
| 0.530 | 1.000 | 0.530 | 1.000 | 0.151 | 0.000 | 0.522 | 0.478 | 0.000 | 0.000 | 0.000 | 0.036 | 0.036 | 1.000 | 1.000 | 0.036 | 0.013 | 0.755 | 0.000 | 0.000 | 0.000 | 0.233 | ||
| 0.036 | 0.151 | 0.036 | 0.151 | 1.000 | 0.573 | 0.011 | 0.000 | 0.000 | 0.000 | 0.416 | 1.000 | 1.000 | 0.036 | 0.036 | 1.000 | 0.981 | 0.019 | 0.000 | 0.000 | 0.000 | 0.000 | ||
| Exit | 1.000 | 0.036 | 1.000 | 0.036 | 1.000 | 0.981 | 0.019 | 0.000 | 0.000 | 0.000 | 0.000 | Guide sign | 1.000 | 0.478 | 1.000 | 0.478 | 0.493 | 0.000 | 0.000 | 1.000 | 0.000 | 0.000 | 0.000 |
| 0.036 | 1.000 | 0.036 | 1.000 | 0.036 | 0.013 | 0.755 | 0.000 | 0.000 | 0.000 | 0.233 | 0.478 | 1.000 | 0.478 | 1.000 | 0.485 | 0.000 | 0.521 | 0.477 | 0.000 | 0.000 | 0.002 | ||
| 1.000 | 0.036 | 1.000 | 0.036 | 1.000 | 0.981 | 0.019 | 0.000 | 0.000 | 0.000 | 0.000 | 1.000 | 0.478 | 1.000 | 0.478 | 0.493 | 0.000 | 0.000 | 1.000 | 0.000 | 0.000 | 0.000 | ||
| 0.036 | 1.000 | 0.036 | 1.000 | 0.036 | 0.013 | 0.755 | 0.000 | 0.000 | 0.000 | 0.233 | 0.478 | 1.000 | 0.478 | 1.000 | 0.485 | 0.000 | 0.521 | 0.477 | 0.000 | 0.000 | 0.002 | ||
| 1.000 | 0.036 | 1.000 | 0.036 | 1.000 | 0.981 | 0.019 | 0.000 | 0.000 | 0.000 | 0.000 | 0.493 | 0.485 | 0.493 | 0.485 | 1.000 | 0.000 | 0.000 | 0.444 | 0.456 | 0.000 | 0.100 | ||
| Alarm system | 1.000 | 1.000 | 1.000 | 0.478 | 0.478 | 0.000 | 0.000 | 1.000 | 0.000 | 0.000 | 0.000 | Firefighting system | 1.000 | 1.000 | 0.530 | 0.530 | 1.000 | 0.000 | 0.522 | 0.478 | 0.000 | 0.000 | 0.000 |
| 1.000 | 1.000 | 1.000 | 0.478 | 0.478 | 0.000 | 0.000 | 1.000 | 0.000 | 0.000 | 0.000 | 1.000 | 1.000 | 0.530 | 0.530 | 1.000 | 0.000 | 0.522 | 0.478 | 0.000 | 0.000 | 0.000 | ||
| 1.000 | 1.000 | 1.000 | 0.478 | 0.478 | 0.000 | 0.000 | 1.000 | 0.000 | 0.000 | 0.000 | 0.530 | 0.530 | 1.000 | 1.000 | 0.530 | 0.015 | 0.908 | 0.000 | 0.000 | 0.000 | 0.077 | ||
| 0.478 | 0.478 | 0.478 | 1.000 | 1.000 | 0.000 | 0.476 | 0.435 | 0.000 | 0.000 | 0.088 | 0.530 | 0.530 | 1.000 | 1.000 | 0.530 | 0.015 | 0.908 | 0.000 | 0.000 | 0.000 | 0.077 | ||
| 0.478 | 0.478 | 0.478 | 1.000 | 1.000 | 0.000 | 0.476 | 0.435 | 0.000 | 0.000 | 0.088 | 1.000 | 1.000 | 0.530 | 0.530 | 1.000 | 0.000 | 0.522 | 0.478 | 0.000 | 0.000 | 0.000 | ||
| Broadcasting and monitoring system | 1.000 | 1.000 | 1.000 | 1.000 | 1.000 | 0.981 | 0.019 | 0.000 | 0.000 | 0.000 | 0.000 | Personnel training | 1.000 | 0.478 | 0.530 | 1.000 | 0.151 | 0.000 | 0.522 | 0.478 | 0.000 | 0.000 | 0.000 |
| 1.000 | 1.000 | 1.000 | 1.000 | 1.000 | 0.981 | 0.019 | 0.000 | 0.000 | 0.000 | 0.000 | 0.478 | 1.000 | 0.008 | 0.478 | 0.009 | 0.000 | 0.000 | 0.725 | 0.000 | 0.000 | 0.275 | ||
| 1.000 | 1.000 | 1.000 | 1.000 | 1.000 | 0.981 | 0.019 | 0.000 | 0.000 | 0.000 | 0.000 | 0.530 | 0.008 | 1.000 | 0.530 | 0.036 | 0.012 | 0.743 | 0.000 | 0.000 | 0.000 | 0.244 | ||
| 1.000 | 1.000 | 1.000 | 1.000 | 1.000 | 0.981 | 0.019 | 0.000 | 0.000 | 0.000 | 0.000 | 1.000 | 0.478 | 0.530 | 1.000 | 0.151 | 0.000 | 0.522 | 0.478 | 0.000 | 0.000 | 0.000 | ||
| 1.000 | 1.000 | 1.000 | 1.000 | 1.000 | 0.981 | 0.019 | 0.000 | 0.000 | 0.000 | 0.000 | 0.151 | 0.009 | 0.036 | 0.151 | 1.000 | 0.569 | 0.011 | 0.000 | 0.000 | 0.000 | 0.420 | ||
| Public health management | 1.000 | 1.000 | 1.000 | 1.000 | 0.036 | 0.981 | 0.019 | 0.000 | 0.000 | 0.000 | 0.000 | Event organization and management | 1.000 | 0.020 | 0.000 | 0.000 | 0.000 | 0.865 | 0.017 | 0.000 | 0.000 | 0.000 | 0.119 |
| 1.000 | 1.000 | 1.000 | 1.000 | 0.036 | 0.981 | 0.019 | 0.000 | 0.000 | 0.000 | 0.000 | 0.017 | 0.995 | 0.000 | 0.000 | 0.000 | 0.000 | 0.483 | 0.442 | 0.000 | 0.000 | 0.075 | ||
| 1.000 | 1.000 | 1.000 | 1.000 | 0.036 | 0.981 | 0.019 | 0.000 | 0.000 | 0.000 | 0.000 | 0.017 | 0.995 | 0.000 | 0.000 | 0.000 | 0.016 | 0.984 | 0.000 | 0.000 | 0.000 | 0.000 | ||
| 1.000 | 1.000 | 1.000 | 1.000 | 0.036 | 0.981 | 0.019 | 0.000 | 0.000 | 0.000 | 0.000 | 0.000 | 0.020 | 0.018 | 0.000 | 0.000 | 0.865 | 0.017 | 0.000 | 0.000 | 0.000 | 0.119 | ||
| 0.036 | 0.036 | 0.036 | 0.036 | 1.000 | 0.009 | 0.515 | 0.000 | 0.000 | 0.000 | 0.477 | 1.000 | 0.020 | 0.000 | 0.000 | 0.000 | 0.016 | 0.984 | 0.000 | 0.000 | 0.000 | 0.000 | ||
| Emergency evacuation management | 1.000 | 0.036 | 0.036 | 0.151 | 1.000 | 0.865 | 0.017 | 0.000 | 0.000 | 0.000 | 0.119 | Infrastructure management | 1.000 | 0.151 | 0.151 | 1.000 | 0.036 | 0.848 | 0.017 | 0.000 | 0.000 | 0.000 | 0.135 |
| 0.036 | 1.000 | 1.000 | 0.530 | 0.036 | 0.016 | 0.984 | 0.000 | 0.000 | 0.000 | 0.000 | 0.151 | 1.000 | 1.000 | 0.151 | 0.530 | 0.000 | 0.522 | 0.478 | 0.000 | 0.000 | 0.000 | ||
| 0.036 | 1.000 | 1.000 | 0.530 | 0.036 | 0.016 | 0.984 | 0.000 | 0.000 | 0.000 | 0.000 | 0.151 | 1.000 | 1.000 | 0.151 | 0.530 | 0.000 | 0.522 | 0.478 | 0.000 | 0.000 | 0.000 | ||
| 0.151 | 0.530 | 0.530 | 1.000 | 0.151 | 0.000 | 0.483 | 0.442 | 0.000 | 0.000 | 0.075 | 1.000 | 0.151 | 0.151 | 1.000 | 0.036 | 0.848 | 0.017 | 0.000 | 0.000 | 0.000 | 0.135 | ||
| 1.000 | 0.036 | 0.036 | 0.151 | 1.000 | 0.865 | 0.017 | 0.000 | 0.000 | 0.000 | 0.119 | 0.036 | 0.530 | 0.530 | 0.036 | 1.000 | 0.013 | 0.796 | 0.000 | 0.000 | 0.000 | 0.191 | ||
References
- Wikipedia. List of Human Stampedes: World Crowd Disaster Map. Available online: https://en.wikipedia.org/wiki/List_of_human_stampedes (accessed on 3 July 2019).
- Generic Risk Assessment Model for Indoor and Outdoor Space Spraying of Insecticides; Department of Control of Neglected Tropical Diseases; World Health Organization: Geneva, Switzerland, 2018.
- Cornett, M.M.; Saunders, A. Financial Institutions Management: A Risk Management Approach (8th Edition); McGraw-Hill Education: New York, NY, USA, 2013. [Google Scholar]
- Mohaghegh, Z.; Kazemi, R.; Mosleh, A. Incorporating organizational factors into probabilistic risk assessment (PRA) of complex socio-technical systems: a hybrid technique formalization. Reliab. Eng. Syst. Safe. 2009, 94, 1000–1018. [Google Scholar] [CrossRef]
- Parry, G.W. The characterization of uncertainty in probabilistic risk assessments of complex systems. Reliab. Eng. Syst. Safe. 1996, 54, 119–126. [Google Scholar] [CrossRef]
- Chen, F.; Song, M.; Ma, X. Investigation on the injury severity of drivers in rear-end collisions between cars using a random parameters bivariate ordered probit model. Int. J. Environ. Res. Public Health. 2019. [Google Scholar] [CrossRef]
- Ma, C.; Hao, W.; Xiang, W.; Yan, W. The impact of aggressive driving behavior on driver-injury severity at highway-rail grade crossings accidents. J. Adv. Transport. 2018. [Google Scholar] [CrossRef]
- Guo, Y.; Li, Z.; Liu, P.; Wu, Y. Modeling correlation and heterogeneity in crash rates by collision types using full Bayesian random parameters multivariate Tobit model. Accid. Anal. Prev. 2019, 128, 164–174. [Google Scholar]
- Brener, N.D.; Collins, J.L.; Kann, L.; Warren, C.W.; Williams, B.I. Reliability of the youth risk behavior survey questionnaire. Am. J. Epidemiol. 1995, 141, 575–580. [Google Scholar] [CrossRef]
- Zou, P.; Zhang, G.; Wang, J. Understanding the key risks in construction projects in China. Int. J. Proj. Manag. 2007, 25, 601–614. [Google Scholar] [CrossRef]
- Guo, Y.; Zhou, J.; Wu, Y.; Li, Z. Identifying the factors affecting bike-sharing usage and degree of satisfaction in Ningbo, China. PloS one. 2017. [Google Scholar] [CrossRef]
- Shalev, D.M.; Tiran, J. Condition-based fault tree analysis (CBFTA): A new method for improved fault tree analysis (FTA), reliability and safety calculations. Reliab. Eng. Syst. Safe. 2007, 92, 1231–1241. [Google Scholar]
- Yazdi, M.; Zarei, E. Uncertainty handling in the safety risk analysis: an integrated approach based on fuzzy fault tree analysis. J. Fail. Anal. Pre. 2018, 18, 392–404. [Google Scholar] [CrossRef]
- Wu, P.; Meng, X.; Song, L.; Zuo, W. Crash Risk Evaluation and crash severity pattern analysis for different types of urban junctions: fault tree analysis and association rules approaches. Transportation Research Record. 2019, 2673, 403–416. [Google Scholar] [CrossRef]
- Mineo, S.; Pappalardo, G.; D’urso, A.; Calcaterra, D. Event tree analysis for rockfall risk assessment along a strategic mountainous transportation route. Environmental earth sciences. 2017, 76, 620–630. [Google Scholar] [CrossRef]
- Wu, Y.; Abdel-Aty, M.; Lee, J. Crash risk analysis during fog conditions using real-time traffic data. Accid. Anal. Prev. 2018, 114, 4–11. [Google Scholar] [CrossRef] [PubMed]
- Cordeiro, F.; Bezerra, B.; Peixoto, A.; Ramos, R. Methodological aspects for modeling the environmental risk of transporting hazardous materials by road. Transport. Res. D-Tr. E. 2016, 44, 105–121. [Google Scholar] [CrossRef]
- Liu, H.; You, J.; Duan, C. An integrated approach for failure mode and effect analysis under interval-valued intuitionistic fuzzy environment. Int. J. Prod. Eco. 2019, 207, 163–172. [Google Scholar] [CrossRef]
- Faiella, G.; Parand, A.; Franklin, B.; Chana, P.; Cesarelli, M.; Stanton, N.A.; Sevdalis, N. Expanding healthcare failure mode and effect analysis: A composite proactive risk analysis approach. Reliab. Eng. Syst. Safe. 2018, 169, 117–126. [Google Scholar] [CrossRef] [Green Version]
- Zhou, J.B.; Chen, H.; Yan, B.; Shi, X.; Li, X.W. Risk assessment of operation safety in freeway tunnels: An evaluation approach using multiple safety indices. J. Transp. Saf. Secur. 2014, 6, 93–116. [Google Scholar] [CrossRef]
- Chen, H.; Zhou, J.; Wang, J.; Li, X.; GAN, Z. Safety evaluation indexes and method for traffic environment of highway tunnels. J. Chang’an Univ., Nat. Sci. Ed. 2013, 33, 54–61. [Google Scholar]
- Chen, F.; Wang, J.; Deng, Y. Road safety risk evaluation by means of improved entropy TOPSIS–RSR. Saf. Sci. 2015, 79, 39–54. [Google Scholar] [CrossRef]
- Tang, J.; Liang, J.; Han, C.; Li, Z.; Huang, H. Crash injury severity analysis using a two-layer stacking framework. Accid. Anal. Prev. 2019, 122, 226–238. [Google Scholar] [CrossRef]
- Kokangül, A.; Polat, U.; Dağsuyu, C. A new approximation for risk assessment using the AHP and Fine Kinney methodologies. Saf. Sci. 2017, 91, 24–32. [Google Scholar] [CrossRef]
- Shen, L.; Lu, J.; Long, M.; Chen, T. Identification of accident blackspots on rural roads using grid clustering and principal component clustering. Math. Probl. Eng. 2019, 2019, 1–12. [Google Scholar] [CrossRef]
- Zou, Y.; Zhong, X.; Tang, J.; Ye, X.; Wu, L.; Ijaz, M.; Wang, Y. A copula-based approach for accommodating the underreporting effect in wildlife-vehicle crash analysis. Sustainability. 2019. [Google Scholar] [CrossRef]
- Rhee, K.A.; Kim, J.K.; Lee, Y.I.; Ulfarsson, G.F. Spatial regression analysis of traffic crashes in Seoul. Accid. Anal. Prev. 2016, 91, 190–199. [Google Scholar] [CrossRef] [PubMed]
- Shi, Q.; Abdel-Aty, M.; Lee, J. A Bayesian ridge regression analysis of congestion’s impact on urban expressway safety. Accid. Anal. Prev. 2016, 88, 124–137. [Google Scholar] [CrossRef] [PubMed]
- Ma, C.; Hao, W.; Wang, A.; Zhao, H. Developing a coordinated signal control system for urban ring road under the vehicle-infrastructure connected environment. IEEE Access. 2018, 6, 52471–52478. [Google Scholar] [CrossRef]
- Zong, F.; Chen, X.; Tang, J.; Yu, P.; Wu, T. Analyzing traffic crash severity with combination of information entropy and Bayesian network. IEEE Access. 2019, 7, 63288–63302. [Google Scholar] [CrossRef]
- Guo, Y.; Wu, Y.; Lu, J.; Zhou, J. Modeling the unobserved heterogeneity in e-bike collision severity using full Bayesian random parameters multinomial logit regression. Sustainability 2019. [Google Scholar] [CrossRef]
- Guo, Y.; Essa, M.; Sayed, T.; Haque, M.M.; Washington, S. A comparison between simulated and field-measured conflicts for safety assessment of signalized intersections in Australia. Transport. Res. C-Emer. 2019, 101, 96–110. [Google Scholar] [CrossRef]
- Chen, F.; Chen, S.; Ma, X. Analysis of hourly crash likelihood using unbalanced panel data mixed logit model and real-time driving environmental big data. J. Safety. Res. 2018, 65, 153–159. [Google Scholar] [CrossRef]
- Ma, X.; Chen, S.; Chen, F. Multivariate space-time modeling of crash frequencies by injury severity levels. Anal. Methods. Accid. Res. 2017, 15, 29–40. [Google Scholar] [CrossRef]
- Chen, F.; Chen, S. Injury severities of truck drivers in single-and multi-vehicle accidents on rural highways. Accid. Anal. Prev. 2011, 43, 1677–1688. [Google Scholar] [CrossRef]
- Yanmaz-Tuzel, O.; Ozbay, K. A comparative Full Bayesian before-and-after analysis and application to urban road safety countermeasures in New Jersey. Accid. Anal. Prev. 2010, 42, 2099–2107. [Google Scholar] [CrossRef] [PubMed]
- Lord, D.; Mannering, F. The statistical analysis of crash-frequency data: a review and assessment of methodological alternatives. Transport. Res. A-Pol. 2010, 44, 291–305. [Google Scholar] [CrossRef]
- Dempster, A. Upper and lower probabilities induced by a multivalued mapping. In Classic Works of the Dempster-Shafer Theory of Belief Functions; Springer: Berlin, Germany, 2008; pp. 57–72. [Google Scholar]
- Shafer, G. A Mathematical Theory of Evidence; Princeton University Press: Princeton, NJ, USA, 1976. [Google Scholar]
- Wikipedia. Dempster-Shafer theory. Available online: https://en.wikipedia.org/wiki/Dempster%E2%80%93Shafer_theory (accessed on 5 July 2019).
- Smets, P. Advances in the Dempster-Shafer Theory of Evidence; John Wiley & Sons: New York, NY, USA, 1994; pp. 5–34. [Google Scholar]
- Denoeux, T. A neural network classifier based on Dempster-Shafer theory. IEEE Trans. Syst. Man. Cybern. A. Syst. Hum. 2000, 30, 131–150. [Google Scholar] [CrossRef]
- Sun, L.; Srivastava, R.; Mock, T. An information systems security risk assessment model under the Dempster-Shafer theory of belief functions. J. Manage. Inform. Syst. 2006, 22, 109–142. [Google Scholar] [CrossRef]
- Zeng, D.; Xu, J.; Xu, G. Data fusion for traffic incident detection using DS evidence theory with probabilistic SVMs. J. Comput. 2008, 3, 36–43. [Google Scholar] [CrossRef]
- Rassafi, A.; Ganji, S.; Pourkhani, H. Road safety assessment under uncertainty using a multi attribute decision analysis based on Dempster-Shafer theory. KSCE. J. Civil. Eng. 2018, 22, 3137–3152. [Google Scholar] [CrossRef]
- Ma, C.; Yang, D.; Zhou, J.; Feng, Z.; Yuan, Q. Risk riding behaviors of urban e-bikes: a literature review. Int. J. Env. Res. Pub. He. 2019. [Google Scholar] [CrossRef]
- Production Safety Law of the People’s Republic Of China, no. 13, Order of the President of the People’s Republic of China; Ministry of Emergency Management of the People’s Republic of China: Beijing, China, 2018; Volume 13, pp. 1–32.
- Department of Defense Standard Practice System Safety (MIL-STD-882E); Department of Defense: Washington, WA, USA, 2012; pp. 9–20.
- Li, D.; Liu, C.; Gan, W. A new cognitive model: Cloud model. Int. J. Intell. Syst. 2009, 24, 357–375. [Google Scholar] [CrossRef]
- Peng, H.; Wang, J. A multicriteria group decision-making method based on the normal cloud model with zadeh’sz-numbers. IEEE. Trans. Fuzzy. Syst. 2018, 26, 3246–3260. [Google Scholar] [CrossRef]


| Time | Place | Type | Death | Injury | Reason |
|---|---|---|---|---|---|
| 9 March 2000 | Jiaozuo, China | Theatre | 74 | / | Fire |
| 25 March 2000 | Durban, South Africa | Ballroom | 13 | 150 | Fire |
| 9 May 2001 | Ghana | Stadium | 100 | / | Crowd |
| 3 September 2001 | Shaanxi, China | Yuquan Park | 16 | 6 | Crowd |
| 20 February 2002 | Egypt | Train | 350 | / | Fire |
| 19 February 2003 | South Korea | Train | 120 | 387 | Arson |
| 5 February 2004 | Beijing, China | Lantern Show | 37 | 15 | Crowd |
| 11 March 2004 | Spain | Station | 200 | 1800 | Terrorist Attack |
| 1 September 2004 | Russia | School | 300 | / | Terrorist Attack |
| 10 June 2005 | Shantou, China | Hotel | 31 | 15 | Fire |
| 7 July 2005 | London, UK | Metro | 52 | 700 | Terrorist Attack |
| 12 September 2006 | Yemen | / | 51 | 200 | Crowd |
| 18 July 2007 | Jinan, China | / | 25 | 170 | Rainstorm |
| 3 August 2008 | India | Temple | 162 | 47 | Crowd |
| 5 July 2009 | Urumqi, China | / | 184 | 939 | Terrorist Attack |
| 15 November 2010 | Shanghai, China | Apartment | 85 | 71 | Fire |
| 15 January 2011 | India | Temple | 102 | 100 | Crowd |
| 18 March 2012 | Egypt | Gathering | 3 | 137 | Crowd |
| 28 October 2013 | Beijing, China | Square | 5 | 40 | Terrorist Attack |
| 1 March 2014 | Kunming, China | Train Station | 29 | 143 | Terrorist Attack |
| 13 November 2015 | France | Stadium | 197 | / | Terrorist Attack |
| 21 May 2016 | Dalian, China | Market | 3 | / | Fire |
| 25 May 2017 | Henan, China | Senior Apartment | 39 | 6 | Fire |
| 14 May 2018 | Bengal | Ramadan Rally | 10 | 50 | Crowd |
| 25 August 2018 | Harbin, China | Hotel | 20 | 23 | Fire |
| 9 September 2018 | Luanda | Stadium | 5 | 7 | Crowd |
| 17 March 2019 | Northern Ireland. | Hotel | 3 | / | Human Crush |
| 26 June 2019 | Madagascar | Stadium | 16 | 101 | Human Crush |
| First-Level Indicators | Second-Level Indicators | Explanations |
|---|---|---|
| Environmental factors (A1) | Architectural layout (B11) | These indicators reflect the relationship between various environmental factors and safety risks in UPLS, and reflect the impact of random factors on safety risk assessment. |
| Weather (B12) | ||
| External traffic (B13) | ||
| Internal traffic (B14) | ||
| Public health (B15) | ||
| Social stability (B16) | ||
| Human factors (A2) | Crowd characteristics (B21) | These indicators reflect the relationship between human factors and risk level in UPLS, and reflect the impact of human factors on risk assessment level of UPLS. |
| Negligence behavior (B22) | ||
| Macroscopic fundamental diagram (B23) | ||
| Age and gender (B24) | ||
| Safety awareness (B25) | ||
| Physical fitness (B26) | ||
| Panic (B27) | ||
| Trip purpose (B28) | ||
| Infrastructure factors (A3) | Exit (B31) | These indicators reflect the relationship between infrastructure factors and risk level of UPLS, and reflect the impact of static factors on risk assessment level of UPLS. |
| Guide sign (B32) | ||
| Power system (B33) | ||
| Lighting system (B34) | ||
| Fume exhaust system (B35) | ||
| Drainage system (B36) | ||
| Alarm system (B37) | ||
| Firefighting system (B38) | ||
| Broadcasting and monitoring system (B39) | ||
| Management factors (A4) | Personnel training (B41) | These indicators reflect the relationship between the management mechanism of public places and risk level of public places, and reflect the impact of dynamic factors on risk assessment level of UPLS. |
| Public health management (B42) | ||
| Security risk management (B43) | ||
| Event organization and management (B44) | ||
| Fire safety management (B45) | ||
| Emergency evacuation management (B46) | ||
| Store management (B47) | ||
| Infrastructure management (B48) |
| Indicators | The importance Value of RAIS a | The level Value of RAIS b, d | ||||||||
|---|---|---|---|---|---|---|---|---|---|---|
| E1 c | E2 | E3 | E4 | E5 | E1 | E2 | E3 | E4 | E5 | |
| Environmental factor | 2 | 3 | 4 | 2 | 3 | / | / | / | / | / |
| Human factor | 2 | 2 | 2 | 3 | 1 | / | / | / | / | / |
| Equipment factors | 3 | 2 | 3 | 1 | 3 | / | / | / | / | / |
| Management factors | 1 | 1 | 1 | 1 | 2 | / | / | / | / | / |
| Architectural layout | 5 | 4 | 2 | 3 | 5 | 8 | 6 | 7 | 9 | 7 |
| Weather | 2 | 2 | 3 | 2 | 4 | 9 | 9 | 8 | 9 | 10 |
| External traffic | 3 | 3 | 4 | 4 | 3 | 7 | 8 | 9 | 8 | 9 |
| Public health environment | 1 | 1 | 1 | 3 | 2 | 9 | 10 | 8 | 8 | 9 |
| Social stability | 4 | 5 | 5 | 5 | 4 | 10 | 9 | 10 | 10 | 9 |
| Crowd characteristic | 3 | 3 | 2 | 3 | 1 | 7 | 9 | 8 | 8 | 10 |
| Negligence behavior | 4 | 1 | 4 | 3 | 4 | 9 | 8 | 9 | 8 | 8 |
| Macroscopic fundamental diagram | 1 | 2 | 2 | 4 | 2 | 9 | 8 | 9 | 8 | 9 |
| Safety awareness | 5 | 5 | 4 | 5 | 4 | 7 | 6 | 7 | 6 | 8 |
| Panic | 2 | 4 | 5 | 2 | 5 | 8 | 9 | 7 | 7 | 8 |
| Exit | 2 | 1 | 1 | 2 | 1 | 9 | 7 | 8 | 7 | 9 |
| Guide sign | 5 | 3 | 2 | 4 | 2 | 5 | 6 | 5 | 6 | 4 |
| Alarm system | 3 | 3 | 4 | 3 | 3 | 5 | 5 | 5 | 6 | 6 |
| Firefighting system | 4 | 4 | 4 | 5 | 4 | 6 | 6 | 7 | 7 | 6 |
| Broadcasting monitoring system | 1 | 2 | 2 | 1 | 2 | 10 | 10 | 9 | 9 | 10 |
| Personnel training | 1 | 2 | 2 | 1 | 2 | 6 | 5 | 7 | 6 | 8 |
| Public health management | 4 | 2 | 1 | 2 | 3 | 8 | 9 | 8 | 8 | 7 |
| Infrastructure management | 3 | 4 | 4 | 4 | 5 | 9 | 6 | 7 | 8 | 7 |
| Event organization and management | 2 | 3 | 3 | 3 | 4 | 8 | 7 | 7 | 6 | 8 |
| Emergency evacuation management | 2 | 1 | 2 | 1 | 1 | 8 | 6 | 6 | 8 | 7 |
| First-Level Indicators | Weights | Second-Level Indicators | Weights |
|---|---|---|---|
| Environmental factor | 0.200 | Architectural layout | 0.155 |
| Weather | 0.231 | ||
| External traffic | 0.208 | ||
| Public health environment | 0.271 | ||
| Social stability | 0.135 | ||
| Human factor | 0.259 | Crowd characteristic | 0.252 |
| Negligence behavior | 0.201 | ||
| Macroscopic fundamental diagram | 0.246 | ||
| Safety awareness | 0.139 | ||
| Panic | 0.161 | ||
| Equipment factors | 0.230 | Exit | 0.254 |
| Guide sign | 0.160 | ||
| Alarm system | 0.193 | ||
| Firefighting system | 0.144 | ||
| Broadcasting monitoring system | 0.249 | ||
| Management factors | 0.311 | Personnel training | 0.238 |
| Public health management | 0.193 | ||
| Infrastructure management | 0.140 | ||
| Event organization and management | 0.186 | ||
| Emergency evacuation management | 0.243 |
| Secondary Indicators | R1 | R2 | R3 | R4 | R5 | |
|---|---|---|---|---|---|---|
| Architectural layout | 0.002 | 0.998 | 0.000 | 0.000 | 0.000 | 0.000 |
| Weather | 1.000 | 0.000 | 0.000 | 0.000 | 0.000 | 0.000 |
| External traffic | 1.000 | 0.000 | 0.000 | 0.000 | 0.000 | 0.000 |
| Public health environment | 1.000 | 0.000 | 0.000 | 0.000 | 0.000 | 0.000 |
| Social stability | 1.000 | 0.000 | 0.000 | 0.000 | 0.000 | 0.000 |
| Crowd characteristic | 1.000 | 0.000 | 0.000 | 0.000 | 0.000 | 0.000 |
| Negligence behavior | 1.000 | 0.000 | 0.000 | 0.000 | 0.000 | 0.000 |
| Macroscopic fundamental diagram | 1.000 | 0.000 | 0.000 | 0.000 | 0.000 | 0.000 |
| Safety awareness | 0.000 | 0.999 | 0.001 | 0.000 | 0.000 | 0.000 |
| Panic | 1.000 | 0.000 | 0.000 | 0.000 | 0.000 | 0.000 |
| Exit | 1.000 | 0.000 | 0.000 | 0.000 | 0.000 | 0.000 |
| Guide sign | 0.000 | 0.000 | 1.000 | 0.000 | 0.000 | 0.000 |
| Alarm system | 0.000 | 0.000 | 1.000 | 0.000 | 0.000 | 0.000 |
| Firefighting system | 0.000 | 0.995 | 0.005 | 0.000 | 0.000 | 0.000 |
| Broadcasting monitoring system | 1.000 | 0.000 | 0.000 | 0.000 | 0.000 | 0.000 |
| Personnel training | 0.000 | 0.577 | 0.423 | 0.000 | 0.000 | 0.000 |
| Public health management | 1.000 | 0.000 | 0.000 | 0.000 | 0.000 | 0.000 |
| Infrastructure management | 0.002 | 0.998 | 0.000 | 0.000 | 0.000 | 0.000 |
| Event organization and management | 0.002 | 0.998 | 0.000 | 0.000 | 0.000 | 0.000 |
| Emergency evacuation management | 0.000 | 0.886 | 0.114 | 0.000 | 0.000 | 0.000 |
| First-Level Indicators | R1 | R2 | R3 | R4 | R5 | |
|---|---|---|---|---|---|---|
| Environmental factors | 1.000 | 0.000 | 0.000 | 0.000 | 0.000 | 0.000 |
| Human Factors | 1.000 | 0.000 | 0.000 | 0.000 | 0.000 | 0.000 |
| Infrastructure factors | 0.000 | 0.000 | 1.000 | 0.000 | 0.000 | 0.000 |
| Management factor | 0.000 | 1.000 | 0.000 | 0.000 | 0.000 | 0.000 |
| Primary Indicators | Excellent a,b | Good | Satisfactory | Fair | Poor |
|---|---|---|---|---|---|
| Environmental factors | 0.845 | 0.155 | 0.000 | 0.000 | 0.000 |
| Human factors | 0.861 | 0.139 | 0.000 | 0.000 | 0.000 |
| Infrastructure factors | 0.503 | 0.143 | 0.354 | 0.000 | 0.000 |
| Management factors | 0.194 | 0.678 | 0.128 | 0.000 | 0.000 |
© 2019 by the authors. Licensee MDPI, Basel, Switzerland. This article is an open access article distributed under the terms and conditions of the Creative Commons Attribution (CC BY) license (http://creativecommons.org/licenses/by/4.0/).
Share and Cite
Zhou, J.; Mao, X.; Wang, Y.; Zhang, M.; Dong, S. Risk Assessment in Urban Large-Scale Public Spaces Using Dempster-Shafer Theory: An Empirical Study in Ningbo, China. Int. J. Environ. Res. Public Health 2019, 16, 2942. https://0-doi-org.brum.beds.ac.uk/10.3390/ijerph16162942
Zhou J, Mao X, Wang Y, Zhang M, Dong S. Risk Assessment in Urban Large-Scale Public Spaces Using Dempster-Shafer Theory: An Empirical Study in Ningbo, China. International Journal of Environmental Research and Public Health. 2019; 16(16):2942. https://0-doi-org.brum.beds.ac.uk/10.3390/ijerph16162942
Chicago/Turabian StyleZhou, Jibiao, Xinhua Mao, Yiting Wang, Minjie Zhang, and Sheng Dong. 2019. "Risk Assessment in Urban Large-Scale Public Spaces Using Dempster-Shafer Theory: An Empirical Study in Ningbo, China" International Journal of Environmental Research and Public Health 16, no. 16: 2942. https://0-doi-org.brum.beds.ac.uk/10.3390/ijerph16162942