Internal and External Demands in Basketball Referees during the U-16 European Women’s Championship

 , , and
Abstract
:1. Introduction
2. Materials and Methods
2.1. Design
2.2. Participants
2.3. Ethics
2.4. Variables
2.5. Internal Load
2.6. External Load
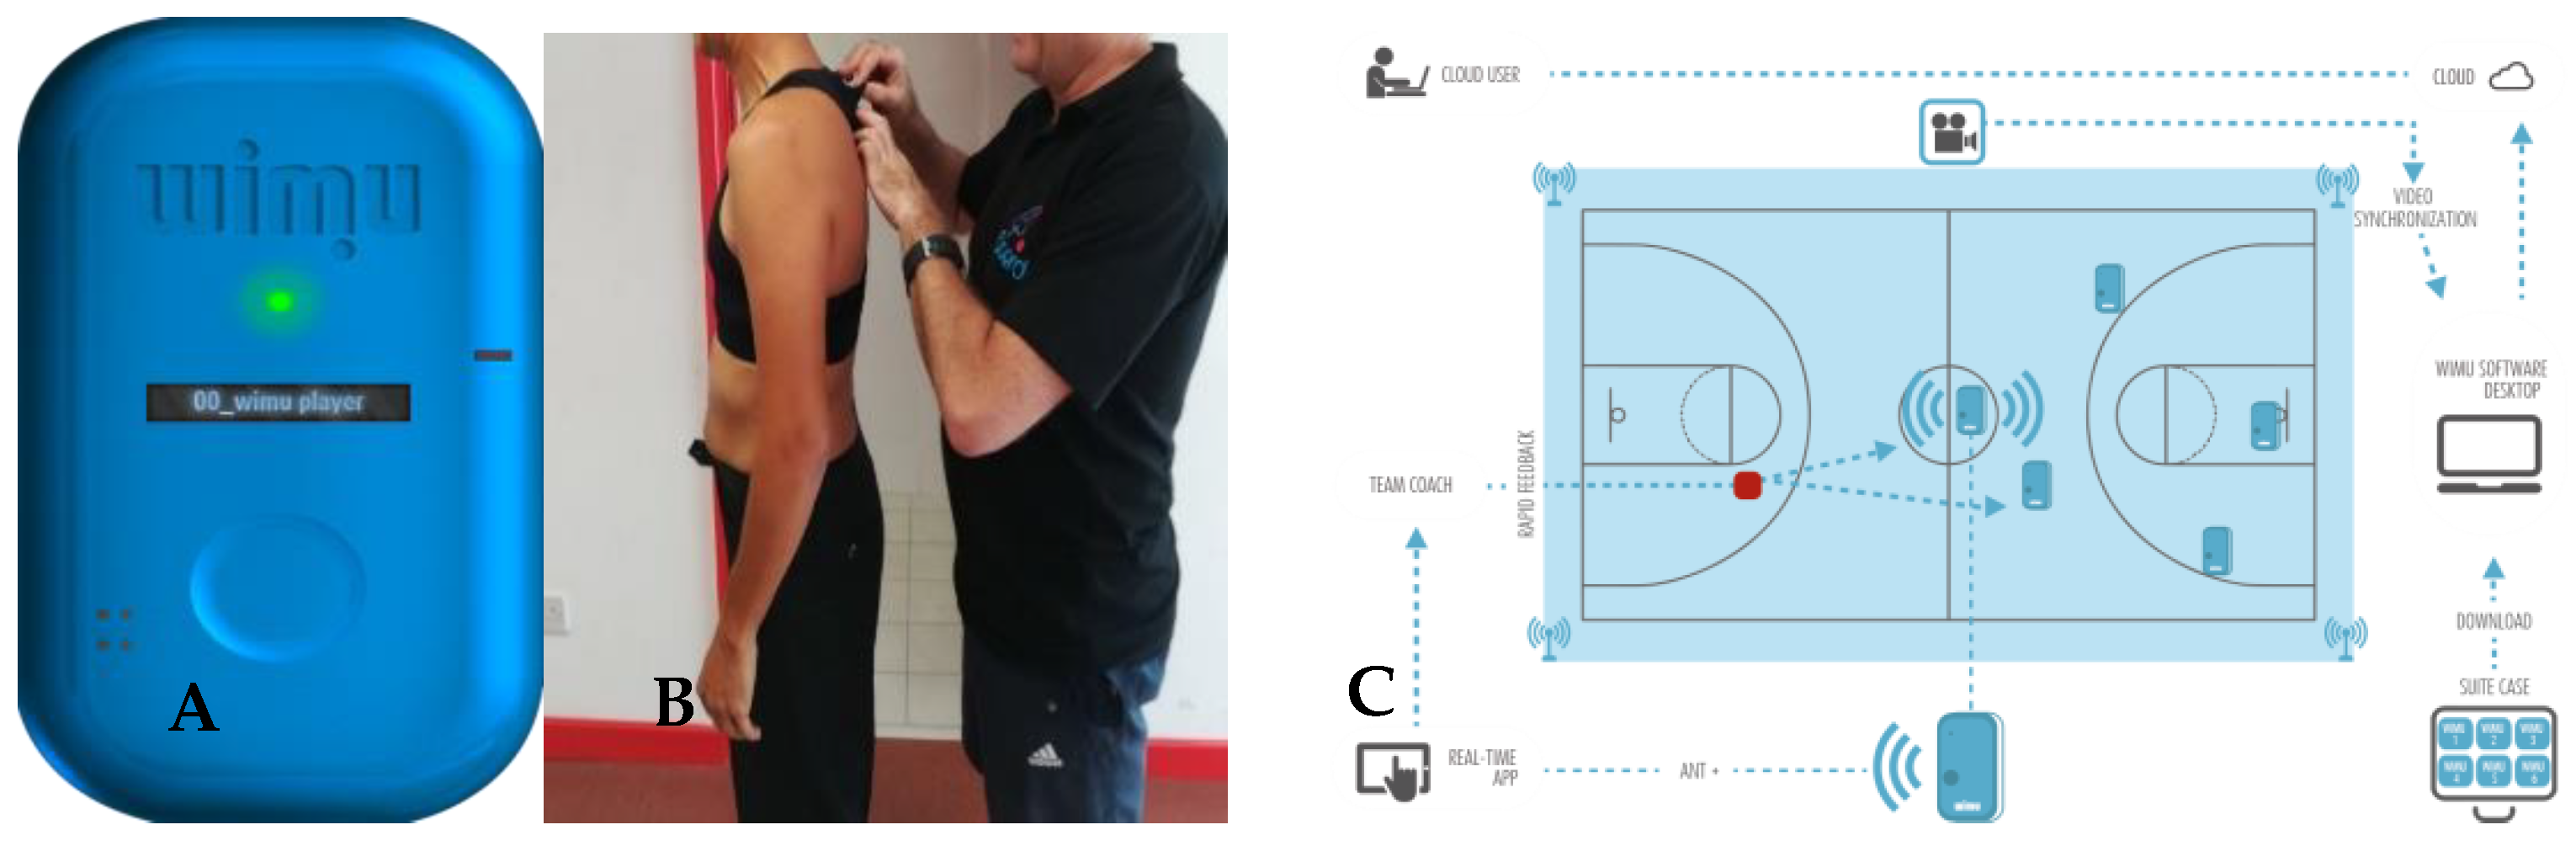
2.7. Materials
2.8. Statistical analysis
3. Results
4. Discussion
5. Conclusions
6. Practical Applications
Author Contributions
Acknowledgments
Conflicts of Interest
References
- Allegretti, L.M.; Misuta, M.S.; Nicolletti, C.; Monezi, l.; Bonganha, V.; Daniel, J.F.; Cavaglieri, C.R.; Borin, J.P.; Montagner, P.C. Distances covered per quarter by elite basketball referees in competition. Gazz. Med. Ita. 2015, 174, 1–2. [Google Scholar]
- Ibáñez, S.J.; García-Rubio, J.; Gómez, M.A.; González-Espinosa, S. The impact of rule modifications on elite basketball teams’ performance. J. Hum. Kinet. 2018, 64, 181–193. [Google Scholar] [CrossRef] [PubMed]
- Schelling, X.; Torres, L. Accelerometer Load Profiles for Basketball-Specific Drills in Elite Players. J. Sports Sci. Med. 2016, 15, 585. [Google Scholar] [PubMed]
- Vaquera, A.; Mielgo-Ayuso, J.; Calleja-González, J.; Leicht, A.S. Sex differences in cardiovascular demands of refereeing during international basketball competition. Physician Sportsmed. 2016, 44, 164–169. [Google Scholar] [CrossRef] [PubMed]
- Myers, N.D.; Feltz, D.L.; Guillén, F.; Dithurbide, L. Development of, and initial validity evidence for, the Referee Self-Efficacy Scale: A multistudy report. J. Sport Exerc. Psychol. 2012, 34, 737–765. [Google Scholar] [CrossRef] [PubMed]
- García-Santos, D.; Ibáñez, S.J. Diseño y validación de un instrumento de observación para la valoración de un árbitro de baloncesto (IOVAB). Sport TK—Rev. Euroam. Cienc. Dep. 2016, 5, 15–26. [Google Scholar] [CrossRef]
- Ruiz, A.; Reina, R.; Luis, V.; Sabido, R.; Moreno, F.J. Estrategias de búsqueda visual elaboradas por árbitros de baloncesto con diferente nivel de experiencia. Un estudio de casos. [Visual search strategies utilized by referees of differing experience levels]. Cult. Cienc. Dep. 2004, 1, 32–37. [Google Scholar] [CrossRef]
- Impellizzeri, F.M.; Marcora, S.M.; Coutts, A.J. Internal and external training load: 15 years on. Int. J. Sport Physiol. Perform. 2019, 14, 270–273. [Google Scholar] [CrossRef]
- Leicht, A.S. Physiological demands of basketball refereeing during international competition. J. Sci. Med. Sport 2008, 11, 357–360. [Google Scholar] [CrossRef]
- Matković, A.; Rupčić, T.; Knjaz, D. Physiological load of referees during basketball games. Kinesiology 2014, 46, 258–265. [Google Scholar]
- Vaquera, A.; Renfree, A.; Thomas, G.; St Clair Gibson, A.; Calleja-González, J. Heart Rate Responses of Referees During the 2011 EuroBasket Championship. J. Hum. Sport Exerc. 2014, 9, 43–48. [Google Scholar] [CrossRef]
- Vaquera, A.; Mielgo-Ayuso, J.; Calleja-Gonzalez, J.; Leicht, A.S. Cardiovascular and perceptual stress of female basketball referees during women’s International matches. J. Sports Med. Phys. Fit. 2017, 57, 476–482. [Google Scholar]
- Reilly, T.; Gregson, W. Special populations: The referee and assistant referee. J. Sports Sci. 2006, 24, 795–801. [Google Scholar] [CrossRef] [PubMed]
- Castillo, D.; Cámara, J.; Yanci, J. Análisis de las respuestas físicas y fisiológicas de árbitros y árbitros asistentes de fútbol durante partidos oficiales de Tercera División de España [Analysis of the physical and physiological responses of referees and referees’ assistants during oficial 3rd Division matches in Spain]. RICYDE Rev. Int. Cienc. Dep. 2016, 12, 250–261. [Google Scholar]
- Dixon, D. A pilot study of the physiological demands of futsal referees engaged in international friendly matches. Am. J. Sports Sci. Med. 2014, 2, 103–107. [Google Scholar] [CrossRef]
- Ahmed, H.; Davison, G.; Dixon, D. Analysis of activity patterns, physiological demands and decision-making performance of elite Futsal referees during matches. Int. J. Perform. Anal. Sport 2017, 17, 737–751. [Google Scholar] [CrossRef]
- Da Silva, J.F.; Castagna, C.; Carminatti, L.J.; Foza, V.; Guglielmo, L.G.A.; de Oliveira, F.R. Physiological demands of team-handball referees during games. J. Strength Cond. Res. 2010, 24, 1960–1962. [Google Scholar] [CrossRef]
- García-Santos, D.; Gamonales, J.M.; León, K.; Muñoz, J. A case study: Characterization of physiological, Kinematic and neuromuscular demands of handball referee during competition. E-Balonmano: Rev. Cienc. Dep. 2017, 13, 207–216. [Google Scholar]
- Gómez-Carmona, C.; Pino-Ortega, J. Kinematic and physiological analysis of the performance of the referee football and its relationship with decision making. J. Hum. Sport Exerc. 2016, 11, 397–414. [Google Scholar] [CrossRef]
- Nabli, M.A.; Abdelkrim, N.B.; Castagna, C.; Jabri, I.; Batikh, T.; Chamari, K. Energy Demands and Metabolic Equivalents (METS) in U-19 Basketball Refereeing During Official Games. J. Sports Med. Doping Stud. 2017, 7, 190. [Google Scholar] [CrossRef]
- O’Hara, J.P.; Brightmore, A.; Till, K.; Mitchell, I.; Cummings, S.; Cooke, C.B. Evaluation of movement and physiological demands of rugby league referees using global positioning systems tracking. Int. J. Sports Med. 2013, 34, 825–831. [Google Scholar] [CrossRef] [PubMed]
- Borin, J.P.; Daniel, J.F.; Bonganha, V.; de Moraes, A.M.; Cavaglieri, C.R.; Mercadante, M.A.; da Silva, M.T.N.; Montagner, P.C. The distances covered by basketball referees in a match increase throughout the competition phases, with no change in physiological demand. Open Acess J. Sport Med. 2013, 4, 193–198. [Google Scholar] [Green Version]
- Nabli, M.A.; Ben Abdelkrim, N.; Fessi, M.S.; DeLang, M.D.; Moalla, W.; Chamari, K. Sport science applied to basketball refereeing: A narrative review. Physician Sportsmed. 2019, 1–10. [Google Scholar] [CrossRef] [PubMed]
- Larkin, P.; O’Brien, B.; Mesagno, C.; Berry, J.; Harvey, J.; Spittle, M. Assessment of decision-making performance and in-game physical exertion of Australian football umpires. J. Sports Sci. 2014, 32, 1446–1453. [Google Scholar] [CrossRef] [PubMed]
- Paradis, K.; Larkin, P.; O’Connor, D. The effects of physical exertion on decision-making performance of Australian football umpires. J. Sports Sci. 2016, 34, 1535–1541. [Google Scholar] [CrossRef] [PubMed]
- Malone, J.J.; Lovell, R.; Varley, M.C.; Coutts, A.J. Unpacking the black box: Applications and considerations for using GPS devices in sport. Int. J. Sports Physiol. Perform. 2017, 12, 2–18. [Google Scholar] [CrossRef] [PubMed]
- Costa, E.C.; Vieira, C.M.; Moreira, A.; Ugrinowitsch, C.; Castagna, C.; Aoki, M.S. Monitoring external and internal loads of Brazilian soccer referees during official matches. J. Sports Sci. Med. 2013, 12, 559–564. [Google Scholar]
- Castillo, D.; Yanci, J.; Cámara, J.; Weston, M. The influence of soccer match play on physiological and physical performance measures in soccer referees and assistant referees. J. Sports Sci. 2016, 34, 557–563. [Google Scholar] [CrossRef]
- Bastida-Castillo, A.; Gómez-Carmona, C.; de la Cruz, E.; Pino Ortega, J. Accuracy, intra- and inter-unit reliability, and comparison between GPS and UWB-based position-tracking systems used for time-motion analyses in soccer. Eur. J. Sport Sci. 2018, 18, 450–457. [Google Scholar] [CrossRef]
- Leser, R.; Schleindlhuber, A.; Lyons, K.; Baca, A. Accuracy of an UWB-based position tracking system used for time-motion analyses in game sports. Eur. J. Sport Sci. 2014, 14, 635–642. [Google Scholar] [CrossRef]
- Serpiello, F.R.; Hopkins, W.G.; Barnes, S.; Tavrou, J.; Duthie, G.M.; Aughey, R.J.; Ball, K. Validity of an ultra-wideband local positioning system to measure locomotion in indoor sports. J. Sports Sci. 2017, 36, 1727–1733. [Google Scholar] [CrossRef] [PubMed] [Green Version]
- Rhodes, J.; Mason, B.; Perrat, B.; Smith, M.; Goosey-Tolfrey, V. The validity and reliability of a novel indoor player tracking system for use within wheelchair court sports. J. Sports Sci. 2014, 32, 1639–1647. [Google Scholar] [CrossRef] [PubMed] [Green Version]
- Ato, M.; López, J.J.; Benavente, A. A classification system for research designs in psychology. An. Psicol. 2013, 29, 1038–1059. [Google Scholar]
- Whaley, M.H.; Kaminsky, L.A.; Dwyer, G.B.; Getchell, L.H.; Norton, J.A. Predictors of over- and underachievement of age-predicted maximal heart rate. Med. Sci. Sports Exerc. 1992, 24, 1173–1179. [Google Scholar] [CrossRef] [PubMed]
- Puente, C.; Abián-Vicén, J.; Areces, F.; López, R.; Del Coso, J. Physical and physiological demands of experienced male basketball players during a competitive game. J. Strength Cond. Res. 2017, 31, 956–962. [Google Scholar] [CrossRef]
- Barret, S. The Utility of PlayerLoadTM in Soccer: An Examination of the Reliability, Validity, Determinants and the within Match Patterns. Ph.D. Thesis, University of Hull, Hull, UK, 2016. [Google Scholar]
- Barreira, P.; Robinson, M.A.; Drust, B.; Nedergaard, N.; Raja Azidin, R.M.F.; Vanrenterghem, J. Mechanical Player Load™ using trunk-mounted accelerometry in football: Is it a reliable, task-and player-specific observation? J. Sports Sci. 2017, 35, 1674–1681. [Google Scholar] [CrossRef]
- Cormack, S.J.; Mooney, M.G.; Morgan, W.; McGuigan, M.R. Influence of neuromuscular fatigue on accelerometer load in elite Australian football players. Int. J. Sports Physiol. Perform. 2013, 8, 373–378. [Google Scholar] [CrossRef]
- Osgnach, C.; Poser, S.; Bernardini, R.; Rinaldo, R.; Di Prampero, P.E. Energy cost and metabolic power in elite soccer: A new match analysis approach. Med. Sci. Sports Exerc. 2010, 42, 170–178. [Google Scholar] [CrossRef]
- Molina-Carmona, I.; Gómez-Carmona, C.D.; Bastida-Castillo, A.; Pino-Ortega, J. Validez del dispositivo inercial WIMU PRO para el registro de la frecuencia cardiaca en un test de campo. Sportk: Rev. Euroam. Cienc. Dep. 2018, 7, 81–86. [Google Scholar] [CrossRef]
- Gómez-Carmona, C.D.; Bastida-Castillo, A.; García-Rubio, J.; Ibáñez, S.J.; Pino-Ortega, J. Static and dynamic reliability of WIMU PRO™ accelerometers according to anatomical placement. Proc. Inst. Mech. Engin. Part P J. Sports Eng. Tech. 2018, 233, 238–248. [Google Scholar] [CrossRef]
- Field, A. Discovering Statistics Using SPSS, 3rd ed.; SAGE: London, UK, 2009. [Google Scholar]
- Cárdenas, J.M.; Arancibia, H. Potencia estadística y cálculo del tamaño del efecto en G* Power: Complementos a las pruebas de significación estadística y su aplicación en psicología [Statistical power and effect size calculation in G Power: Complementary approaches to significance tests and their application in psychology]. Salud Soc. 2014, 5, 210–244. [Google Scholar]
- Ziv, G.; Lidor, R. Physical attributes, physiological characteristics, on-court performances and nutritional strategies of female and male basketball players. Sports Med. 2009, 39, 547–568. [Google Scholar] [CrossRef] [PubMed]
- Royal, K.A.; Farrow, D.; Mujika, I.; Halson, S.L.; Pyne, D.; Abernethy, B. The effects of fatigue on decision making and shooting skill performance in water polo players. J. Sports Sci. 2006, 24, 807–815. [Google Scholar] [CrossRef] [PubMed]
- Kitsantas, A.; Zimmerman, B.J. Comparing self-regulatory processes among novice, non-expert, and expert volleyball players: A microanalytic study. J. Appl. Sport Psychol. 2002, 14, 91–105. [Google Scholar] [CrossRef]
- Delaney, J.A.; Cummins, C.J.; Thornton, H.R.; Duthie, G.M. Importance, reliability and usefulness of acceleration measures in team sports. J. Strength Cond. Res. 2017, 32, 3485–3493. [Google Scholar] [CrossRef] [PubMed]
- Howatson, G.; Milak, A. Exercise-induced muscle damage following a bout of sport specific repeated sprints. J. Strength Cond. Res. 2009, 23, 2419–2424. [Google Scholar] [CrossRef] [PubMed]
- Aoki, M.S.; Ronda, L.T.; Marcelino, P.R.; Drago, G.; Carling, C.; Bradley, P.S.; Moreira, A. Monitoring Training Loads in Professional Basketball Players Engaged in a Periodized Training Program. J. Strength Cond. Res. 2017, 31, 348–358. [Google Scholar]
- Hoppe, M.W.; Baumgart, C.; Slomka, M.; Polglaze, T.; Freiwald, J. Variability of Metabolic Power Data in Elite Soccer Players During Pre-Season Matches. J. Hum. Kinet. 2017, 58, 233–245. [Google Scholar] [CrossRef] [Green Version]
- Dalen, T.; Jørgen, I.; Gertjan, E.; Havard, H.G.; Ulrik, W. Player load, acceleration, and deceleration during forty-five competitive matches of elite soccer. J. Strength Cond. Res. 2016, 30, 351–359. [Google Scholar] [CrossRef]
- Oxendale, C.L.; Highton, J.; Twist, C. Energy expenditure, metabolic power and high speed activity during linear and multi-directional running. J. Sci. Med. Sport 2017, 20, 957–961. [Google Scholar] [CrossRef]
- Rupčić, T.; Matković, B.R.; Knjaz, D.; Nedić, A.; Popek, S. Differences in physiological load of the referees with consideration to the period of the basketball game. SportLogia 2012, 8, 51–56. [Google Scholar] [CrossRef]
- Weston, M.; Castagna, C.; Impellizzeri, F.M.; Rampinini, E.; Abt, G. Analysis of physical match performance in English Premier League soccer referees with particular reference to first half and player work rates. J. Sci. Med. Sport 2007, 10, 390–397. [Google Scholar] [CrossRef] [PubMed]
- Gómez, M.A.; Jiménez, S.; Navarro, R.; Lago-Penas, C.; Sampaio, J. Effects of coaches’ timeouts on basketball teams’ offensive and defensive performances according to momentary differences in score and game period. Eur. J. Sport Sci. 2011, 11, 303–308. [Google Scholar] [CrossRef]
- García-Rubio, J.; Gómez, M.Á.; Cañadas, M.; Ibáñez, S.J. Offensive Rating-Time coordination dynamics in basketball. Complex systems theory applied to Basketball. Int. J. Perform. Anal. Sport 2015, 15, 513–526. [Google Scholar] [CrossRef]

| Male (6) | Female (3) | |||||
|---|---|---|---|---|---|---|
| Mean | Minimum | Maximum | Mean | Minimum | Maximum | |
| Age (Yrs.) | 44 | 37 | 49 | 39 | 34 | 44 |
| Experience (Yrs.) | 25 | 20 | 32 | 15 | 10 | 21 |
| Height (m) | 1.83 | 1.78 | 1.96 | 1.74 | 1.70 | 1.80 |
| Body Mass (kg) | 78.48 | 67.3 | 92.5 | 71.13 | 61.2 | 86.9 |
| Body Fat (%) | 13.55 | 9.5 | 16.3 | 23.87 | 19.9 | 29.2 |
| Muscle Mass (%) | 64.27 | 55.7 | 73.6 | 50.80 | 46.5 | 57.9 |
| Bone Mass (%) | 3.33 | 2.9 | 3.8 | 2.73 | 2.5 | 3.1 |
| BMI | 23.17 | 20.4 | 25.1 | 23.27 | 20.4 | 26.8 |
| DCI (kcal) | 4079 | 3530 | 4748 | 2865 | 2619 | 3284 |
| Metabolic Age (Yrs.) | 29 | 22 | 34 | 27 | 19 | 37 |
| Body Water (%) | 62.28 | 59.5 | 65.5 | 55.67 | 51.6 | 58.4 |
| Visceral Fat (%) | 5 | 4 | 7 | 3 | 1 | 5 |
| Variables | Periods | Mean | SD | 95% IC | Min | Max | F | Sig. | f | ϕ | p | DbP | ||
|---|---|---|---|---|---|---|---|---|---|---|---|---|---|---|
| L | U | |||||||||||||
| Internal Load Variables | ||||||||||||||
| %HRMax | 1 | 63 | 8 | 61 | 65 | 42 | 77 | 3.155 | 0.026 | 0.982 | 1.000 | * | π | |
| 2 | 64 | 8 | 61 | 66 | 47 | 82 | ||||||||
| 3 | 59 | 9 | 57 | 62 | 36 | 85 | ||||||||
| 4 | 60 | 9 | 57 | 63 | 36 | 86 | ||||||||
| TG | 62 | 7 | 60 | 64 | 47 | 78 | ||||||||
| HRavg (bpm) | 1 | 126 | 15 | 122 | 131 | 84 | 154 | 3.155 | 0.026 | 0.982 | 1.000 | * | π | |
| 2 | 128 | 17 | 123 | 133 | 93 | 164 | ||||||||
| 3 | 119 | 18 | 113 | 124 | 71 | 169 | ||||||||
| 4 | 120 | 18 | 114 | 125 | 72 | 172 | ||||||||
| TG | 124 | 14 | 119 | 128 | 93 | 156 | ||||||||
| Zones HRMax (% time per zones) | 50–60% | 1 | 25.52 | 21.00 | 19.14 | 31.91 | 0.00 | 73.22 | 2.505 | 0.061 | 0.669 | 1.000 | ||
| 2 | 26.83 | 21.64 | 20.25 | 33.41 | 0.00 | 69.67 | ||||||||
| 3 | 35.51 | 21.09 | 29.17 | 41.84 | 0.00 | 65.12 | ||||||||
| 4 | 34.61 | 23.31 | 27.61 | 41.62 | 0.00 | 69.73 | ||||||||
| TG | 30.93 | 18.10 | 25.50 | 36.37 | 0.00 | 64.57 | ||||||||
| 60–70% | 1 | 40.25 | 21.76 | 33.63 | 46.87 | 0.00 | 75.76 | 0.814 | 0.488 | 0.741 | 1.000 | |||
| 2 | 38.74 | 23.06 | 31.72 | 45.75 | 0.00 | 81.87 | ||||||||
| 3 | 33.38 | 20.73 | 27.15 | 39.60 | 0.00 | 74.45 | ||||||||
| 4 | 36.32 | 23.25 | 29.34 | 43.31 | 0.00 | 88.24 | ||||||||
| TG | 36.88 | 19.39 | 31.05 | 42.70 | 0.00 | 72.41 | ||||||||
| 70–80% | 1 | 20.13 | 22.54 | 13.27 | 26.98 | 0.00 | 76.90 | 2.799 | 0.042 | 0.379 | 1.000 | * | β | |
| 2 | 18.68 | 20.87 | 12.34 | 25.03 | 0.00 | 71.83 | ||||||||
| 3 | 10.53 | 17.21 | 5.36 | 15.70 | 0.00 | 70.30 | ||||||||
| 4 | 11.37 | 17.59 | 6.08 | 16.65 | 0.00 | 84.37 | ||||||||
| TG | 15.04 | 17.89 | 9.67 | 20.42 | 0.00 | 75.35 | ||||||||
| 80–90% | 1 | 2.91 | 8.42 | 0.35 | 5.47 | 0.00 | 51.50 | 0.928 | 0.428 | 0.091 | 0.986 | |||
| 2 | 4.29 | 11.06 | 0.92 | 7.65 | 0.00 | 51.44 | ||||||||
| 3 | 1.70 | 7.08 | –0.42 | 3.83 | 0.00 | 42.79 | ||||||||
| 4 | 1.71 | 6.78 | –0.33 | 3.75 | 0.00 | 36.07 | ||||||||
| TG | 2.65 | 6.09 | 0.82 | 4.48 | 0.00 | 27.50 | ||||||||
| 90–95% | 1 | 0.28 | 1.88 | –0.29 | 0.86 | 0.00 | 12.48 | 0.325 | 0.807 | 0.033 | 0.673 | |||
| 2 | 0.70 | 2.68 | –0.11 | 1.52 | 0.00 | 12.64 | ||||||||
| 3 | 0.35 | 2.32 | –0.35 | 1.04 | 0.00 | 15.59 | ||||||||
| 4 | 0.32 | 2.12 | –0.32 | 0.95 | 0.00 | 14.23 | ||||||||
| TG | 0.40 | 1.49 | –0.05 | 0.85 | 0.00 | 7.44 | ||||||||
| >95% | 1 | 0.09 | 0.59 | –0.09 | 0.27 | 0.00 | 3.93 | 0.479 | 0.697 | 0.015 | 0.364 | |||
| 2 | 0.19 | 1.26 | –0.19 | 0.57 | 0.00 | 8.37 | ||||||||
| 3 | 0.00 | 0.00 | 0.00 | 0.00 | 0.00 | 0.00 | ||||||||
| 4 | 0.08 | 0.57 | –0.09 | 0.26 | 0.00 | 3.81 | ||||||||
| TG | 0.09 | 0.36 | –0.02 | 0.20 | 0.00 | 2.04 | ||||||||
| Variables | Periods | Mean | SD | 95% IC | Min | Max | F | Sig. | f | ϕ | p | DbP | |||
|---|---|---|---|---|---|---|---|---|---|---|---|---|---|---|---|
| L | U | ||||||||||||||
| Kinematic External Load Variables | |||||||||||||||
| Accelerations (n) | 1 | 282.45 | 44.029 | 269.07 | 295.84 | 180 | 396 | 1.098 | 0.351 | 0.968 | 1.000 | ||||
| 2 | 267.89 | 43.951 | 254.52 | 281.25 | 183 | 364 | |||||||||
| 3 | 272.69 | 44.349 | 259.36 | 286.01 | 188 | 414 | |||||||||
| 4 | 264.38 | 63.805 | 245.21 | 283.55 | 135 | 490 | |||||||||
| TG | 1079.36 | 192.344 | 1021.57 | 1137.14 | 371 | 1639 | |||||||||
| Decelerations (n) | 1 | 131.50 | 39.032 | 119.63 | 143.37 | 58 | 236 | 0.246 | 0.864 | 0.920 | 1.000 | ||||
| 2 | 126.91 | 35.824 | 116.02 | 137.80 | 70 | 208 | |||||||||
| 3 | 126.16 | 32.891 | 116.27 | 136.04 | 61 | 227 | |||||||||
| 4 | 125.07 | 43.434 | 112.02 | 138.12 | 53 | 270 | |||||||||
| TG | 505.49 | 138.441 | 463.90 | 547.08 | 126 | 890 | |||||||||
| Acc/min (m/s2) | 1 | 13.99 | 2.16 | 13.33 | 14.64 | 9.86 | 17.80 | 0.589 | 0.623 | 0.977 | 1.000 | ||||
| 2 | 13.70 | 2.07 | 13.07 | 14.33 | 10.25 | 18.40 | |||||||||
| 3 | 13.72 | 2.18 | 13.06 | 14.37 | 9.58 | 19.67 | |||||||||
| 4 | 13.39 | 2.15 | 12.74 | 14.03 | 9.44 | 17.98 | |||||||||
| TG | 13.65 | 1.92 | 13.07 | 14.23 | 10.12 | 17.35 | |||||||||
| Dec/min (m/s2) | 1 | 6.56 | 2.13 | 5.91 | 7.21 | 3.23 | 11.46 | 0.158 | 0.924 | 0.921 | 1.000 | ||||
| 2 | 6.53 | 1.91 | 5.95 | 7.11 | 3.54 | 11.98 | |||||||||
| 3 | 6.38 | 1.78 | 5.85 | 6.92 | 3.11 | 11.20 | |||||||||
| 4 | 6.32 | 1.82 | 5.78 | 6.87 | 3.14 | 10.40 | |||||||||
| TG | 6.40 | 1.68 | 5.90 | 6.91 | 3.44 | 9.87 | |||||||||
| VMax (m/s) | 1 | 18.61 | 1.24 | 18.24 | 18.99 | 16.00 | 21.77 | 0.961 | 0.413 | 0.996 | 1.000 | ||||
| 2 | 18.69 | 1.12 | 18.35 | 19.03 | 16.95 | 22.89 | |||||||||
| 3 | 18.59 | 1.31 | 18.19 | 18.98 | 15.54 | 21.85 | |||||||||
| 4 | 18.29 | 1.15 | 17.94 | 18.63 | 16.43 | 22.54 | |||||||||
| TG | 18.91 | 1.17 | 18.56 | 19.26 | 16.86 | 22.89 | |||||||||
| Vavg (m/s) | 1 | 4.99 | 0.23 | 4.92 | 5.06 | 4.52 | 5.57 | 4.843 | 0.003 | 0.997 | 1.000 | ** | γβ | ||
| 2 | 4.89 | 0.29 | 4.80 | 4.97 | 4.32 | 5.77 | |||||||||
| 3 | 4.83 | 0.27 | 4.75 | 4.91 | 4.27 | 5.40 | |||||||||
| 4 | 4.78 | 0.31 | 4.69 | 4.87 | 4.12 | 5.36 | |||||||||
| TG | 4.87 | 0.21 | 4.80 | 4.93 | 4.45 | 5.48 | |||||||||
| Steps (n) | 1 | 713 | 130 | 673 | 752 | 389 | 979 | 3.504 | 0.017 | 0.961 | 1.000 | * | γ | ||
| 2 | 657 | 117 | 621 | 692 | 421 | 932 | |||||||||
| 3 | 647 | 132 | 607 | 686 | 295 | 993 | |||||||||
| 4 | 623 | 157 | 576 | 671 | 288 | 986 | |||||||||
| TG | 2616 | 543 | 2452 | 2779 | 1065 | 3728 | |||||||||
| Steps/min | 1 | 35 | 6 | 33 | 37 | 22 | 49 | 2.093 | 0.103 | 0.961 | 1.000 | ||||
| 2 | 34 | 7 | 32 | 36 | 21 | 47 | |||||||||
| 3 | 33 | 7 | 31 | 35 | 13 | 44 | |||||||||
| 4 | 32 | 7 | 30 | 34 | 12 | 46 | |||||||||
| TG | 33 | 6 | 31 | 35 | 16 | 44 | |||||||||
| Distance (m) | 1 | 1164 | 145 | 1120 | 1208 | 865 | 1434 | 4.774 | 0.003 | 0.982 | 1.000 | ** | γ | ||
| 2 | 1089 | 112 | 1055 | 1123 | 902 | 1339 | |||||||||
| 3 | 1083 | 127 | 1045 | 1121 | 730 | 1309 | |||||||||
| 4 | 1049 | 194 | 990 | 1107 | 690 | 1738 | |||||||||
| TG | 4330 | 603 | 4149 | 4512 | 1832 | 5553 | |||||||||
| Distance/min (m/min) | 1 | 58 | 7 | 56 | 60 | 44 | 74 | 3.264 | 0.023 | 0.986 | 1.000 | * | γ | ||
| 2 | 56 | 7 | 54 | 58 | 45 | 78 | |||||||||
| 3 | 54 | 6 | 53 | 56 | 44 | 71 | |||||||||
| 4 | 54 | 7 | 51 | 56 | 42 | 68 | |||||||||
| TG | 55 | 5 | 53 | 57 | 45 | 70 | |||||||||
| Speed Zones (m) | V1 | 1 | 513.89 | 83.25 | 488.58 | 539.20 | 358.02 | 718.21 | 0.312 | 0.816 | 0.974 | 1.000 | |||
| 2 | 499.80 | 67.48 | 479.29 | 520.32 | 382.38 | 672.81 | |||||||||
| 3 | 502.95 | 73.09 | 480.99 | 524.91 | 361.80 | 690.82 | |||||||||
| 4 | 498.61 | 102.78 | 467.73 | 529.49 | 262.55 | 845.39 | |||||||||
| TG | 2000.06 | 317.48 | 1904.68 | 2095.45 | 765.11 | 2777.68 | |||||||||
| V2 | 1 | 389.45 | 54.72 | 372.81 | 406.08 | 280.06 | 530.40 | 1.460 | 0.227 | 0.978 | 1.000 | ||||
| 2 | 370.14 | 45.50 | 356.31 | 383.98 | 277.85 | 484.52 | |||||||||
| 3 | 368.38 | 46.63 | 354.37 | 382.39 | 275.89 | 491.62 | |||||||||
| 4 | 368.67 | 73.35 | 346.64 | 390.71 | 224.66 | 641.77 | |||||||||
| TG | 1483.23 | 201.53 | 1422.69 | 1543.78 | 737.59 | 1901.84 | |||||||||
| V3 | 1 | 235.71 | 55.92 | 218.71 | 252.71 | 138.31 | 370.24 | 9.974 | 0.000 | 0.925 | 1.000 | ** | αβγε | ||
| 2 | 202.40 | 61.41 | 183.73 | 221.07 | 86.73 | 399.46 | |||||||||
| 3 | 194.79 | 62.52 | 176.00 | 213.57 | 52.88 | 329.70 | |||||||||
| 4 | 169.15 | 51.16 | 153.78 | 184.52 | 69.67 | 339.18 | |||||||||
| TG | 794.13 | 201.76 | 733.52 | 854.75 | 329.51 | 1399.68 | |||||||||
| V4 | 1 | 19.47 | 13.88 | 15.25 | 23.68 | 2.99 | 59.76 | 6.167 | 0.001 | 0.614 | 1.000 | ** | γ | ||
| 2 | 13.99 | 10.93 | 10.67 | 17.31 | 0.00 | 45.15 | |||||||||
| 3 | 14.89 | 12.02 | 11.28 | 18.50 | 0.00 | 53.39 | |||||||||
| 4 | 9.03 | 8.54 | 6.46 | 11.60 | 0.00 | 33.16 | |||||||||
| TG | 56.70 | 34.11 | 46.46 | 66.95 | 0.00 | 143.31 | |||||||||
| Variables | Periods | Mean | SD | 95% IC | Min | Max | F | Sig. | f | ϕ | p | DbP | |
|---|---|---|---|---|---|---|---|---|---|---|---|---|---|
| L | U | ||||||||||||
| Neuromuscular External Load Variables | |||||||||||||
| PlayerLoad (PL) | 1 | 11.92 | 1.89 | 11.35 | 12.50 | 8.58 | 16.03 | 4.940 | 0.003 | 0.973 | 1.000 | ** | γ |
| 2 | 11.08 | 1.75 | 10.55 | 11.62 | 7.81 | 14.64 | |||||||
| 3 | 11.04 | 1.78 | 10.50 | 11.58 | 6.98 | 14.47 | |||||||
| 4 | 10.39 | 2.10 | 9.76 | 11.02 | 7.08 | 14.91 | |||||||
| TG | 44.13 | 7.92 | 41.75 | 46.51 | 19.06 | 62.77 | |||||||
| PlayerLoad/min (PL/m) | 1 | 0.59 | 0.09 | 0.56 | 0.62 | 0.40 | 0.86 | 3.134 | 0.027 | 0.973 | 1.000 | * | γ |
| 2 | 0.57 | 0.10 | 0.54 | 0.60 | 0.36 | 0.82 | |||||||
| 3 | 0.55 | 0.09 | 0.53 | 0.58 | 0.39 | 0.85 | |||||||
| 4 | 0.53 | 0.10 | 0.50 | 0.56 | 0.37 | 0.79 | |||||||
| TG | 0.56 | 0.08 | 0.53 | 0.58 | 0.39 | 0.77 | |||||||
| Power Metabolic (PMet) | 1 | 3.61 | 0.48 | 3.47 | 3.76 | 2.54 | 4.60 | 4.615 | 0.004 | 0.969 | 1.000 | ** | γ |
| 2 | 3.43 | 0.93 | 3.15 | 3.71 | 2.69 | 9.03 | |||||||
| 3 | 3.32 | 0.40 | 3.20 | 3.45 | 2.15 | 4.25 | |||||||
| 4 | 3.14 | 0.51 | 2.99 | 3.29 | 2.11 | 4.74 | |||||||
| TG | 15.60 | 2.57 | 14.83 | 16.37 | 5.60 | 21.65 | |||||||
| Power Metabolic/min (PMet/m) | 1 | 0.18 | 0.02 | 0.17 | 0.19 | 0.14 | 0.23 | 4.104 | 0.008 | 0.976 | 1.000 | ** | γ |
| 2 | 0.18 | 0.04 | 0.16 | 0.19 | 0.14 | 0.38 | |||||||
| 3 | 0.17 | 0.02 | 0.16 | 0.17 | 0.13 | 0.22 | |||||||
| 4 | 0.16 | 0.02 | 0.15 | 0.17 | 0.10 | 0.20 | |||||||
| TG | 0.20 | 0.03 | 0.19 | 0.21 | 0.15 | 0.27 | |||||||
| Impacts | 1 | 277 | 100 | 247 | 307 | 84 | 542 | 1.450 | 0.230 | 0.883 | 1.000 | ||
| 2 | 257 | 99 | 227 | 287 | 76 | 480 | |||||||
| 3 | 262 | 91 | 234 | 289 | 98 | 445 | |||||||
| 4 | 236 | 90 | 209 | 263 | 86 | 418 | |||||||
| TG | 1025 | 372 | 913 | 1136 | 344 | 1890 | |||||||
© 2019 by the authors. Licensee MDPI, Basel, Switzerland. This article is an open access article distributed under the terms and conditions of the Creative Commons Attribution (CC BY) license (http://creativecommons.org/licenses/by/4.0/).
Share and Cite
García-Santos, D.; Pino-Ortega, J.; García-Rubio, J.; Vaquera, A.; Ibáñez, S.J. Internal and External Demands in Basketball Referees during the U-16 European Women’s Championship. Int. J. Environ. Res. Public Health 2019, 16, 3421. https://0-doi-org.brum.beds.ac.uk/10.3390/ijerph16183421
García-Santos D, Pino-Ortega J, García-Rubio J, Vaquera A, Ibáñez SJ. Internal and External Demands in Basketball Referees during the U-16 European Women’s Championship. International Journal of Environmental Research and Public Health. 2019; 16(18):3421. https://0-doi-org.brum.beds.ac.uk/10.3390/ijerph16183421
Chicago/Turabian StyleGarcía-Santos, David, José Pino-Ortega, Javier García-Rubio, Alejandro Vaquera, and Sergio J. Ibáñez. 2019. "Internal and External Demands in Basketball Referees during the U-16 European Women’s Championship" International Journal of Environmental Research and Public Health 16, no. 18: 3421. https://0-doi-org.brum.beds.ac.uk/10.3390/ijerph16183421