Injury Severity and Contributing Driver Actions in Passenger Vehicle–Truck Collisions


Abstract
:1. Introduction
- Quantify the associations between unsafe driving behaviors and injury severity outcomes in passenger vehicle–truck collisions. Specifically, the intentional and unintentional driving actions of truck and passenger vehicle drivers.
- Explore unobserved heterogeneity in the associations of injury severity with unsafe pre-crash behaviors, while controlling for the driver, vehicle, and roadway factors.
2. Literature Review
3. Methodology
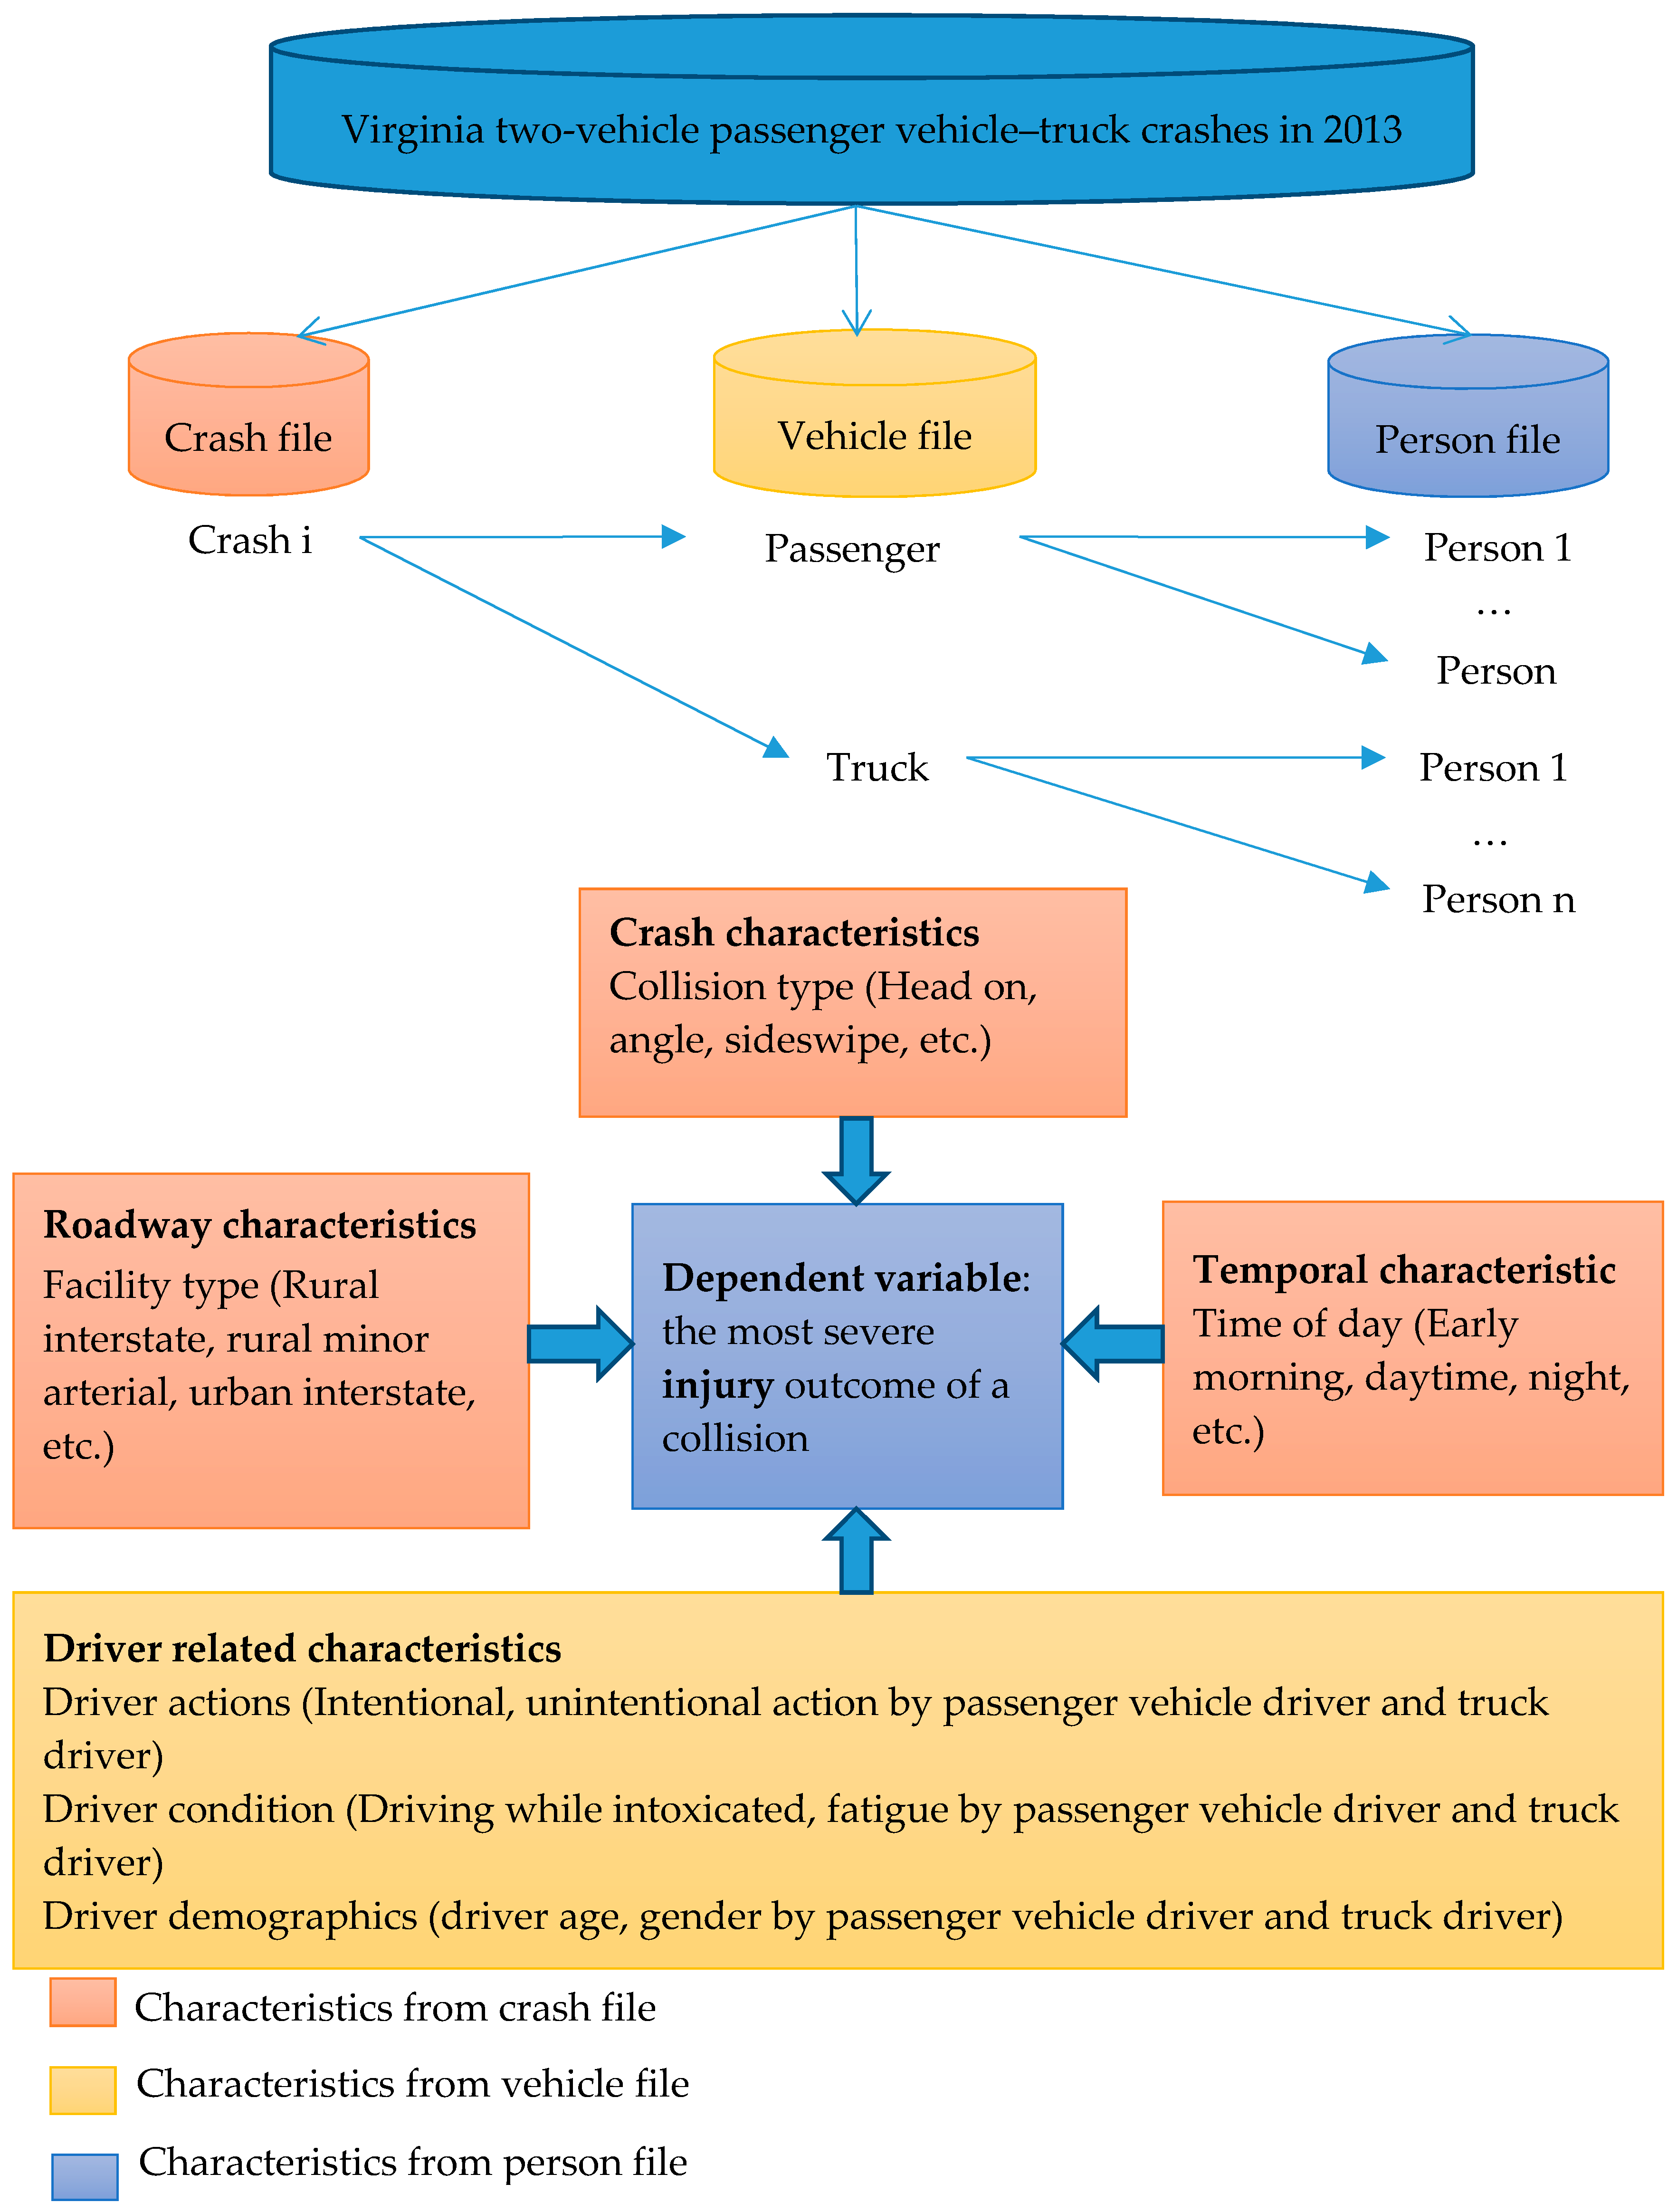
3.1. Data Source
3.2. Modeling Framework
4. Results
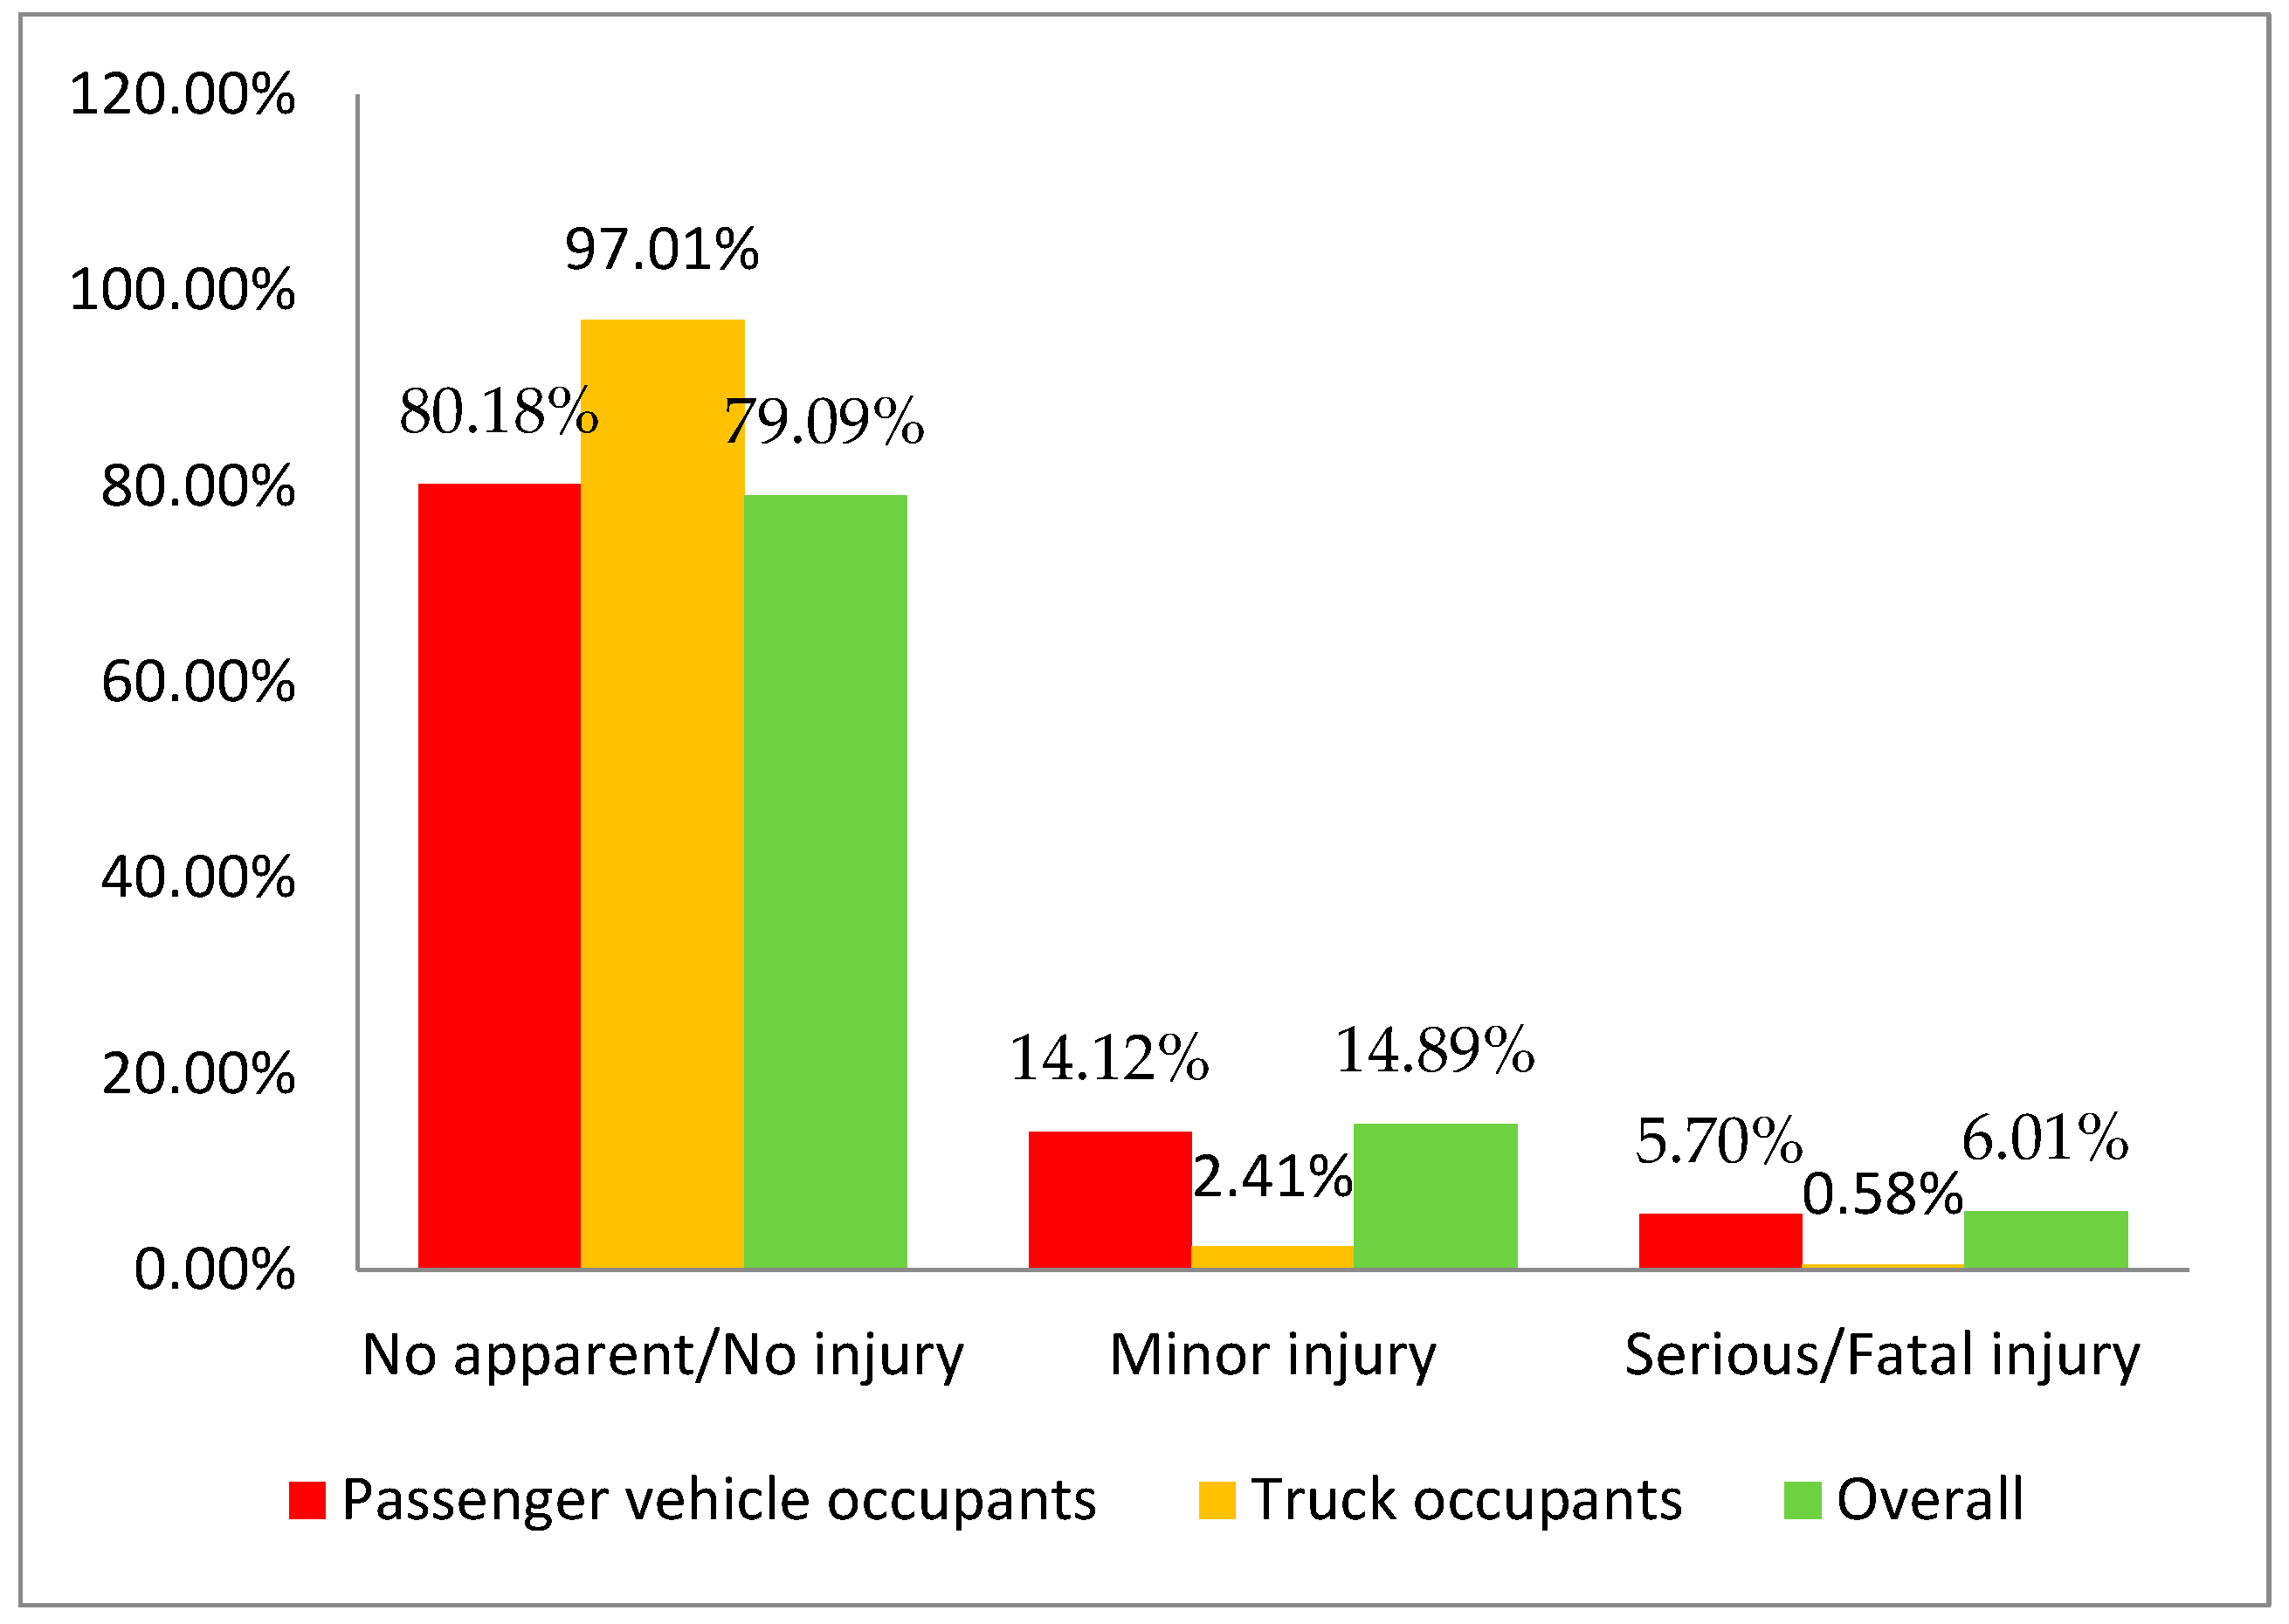
4.1. Descriptive Statistics
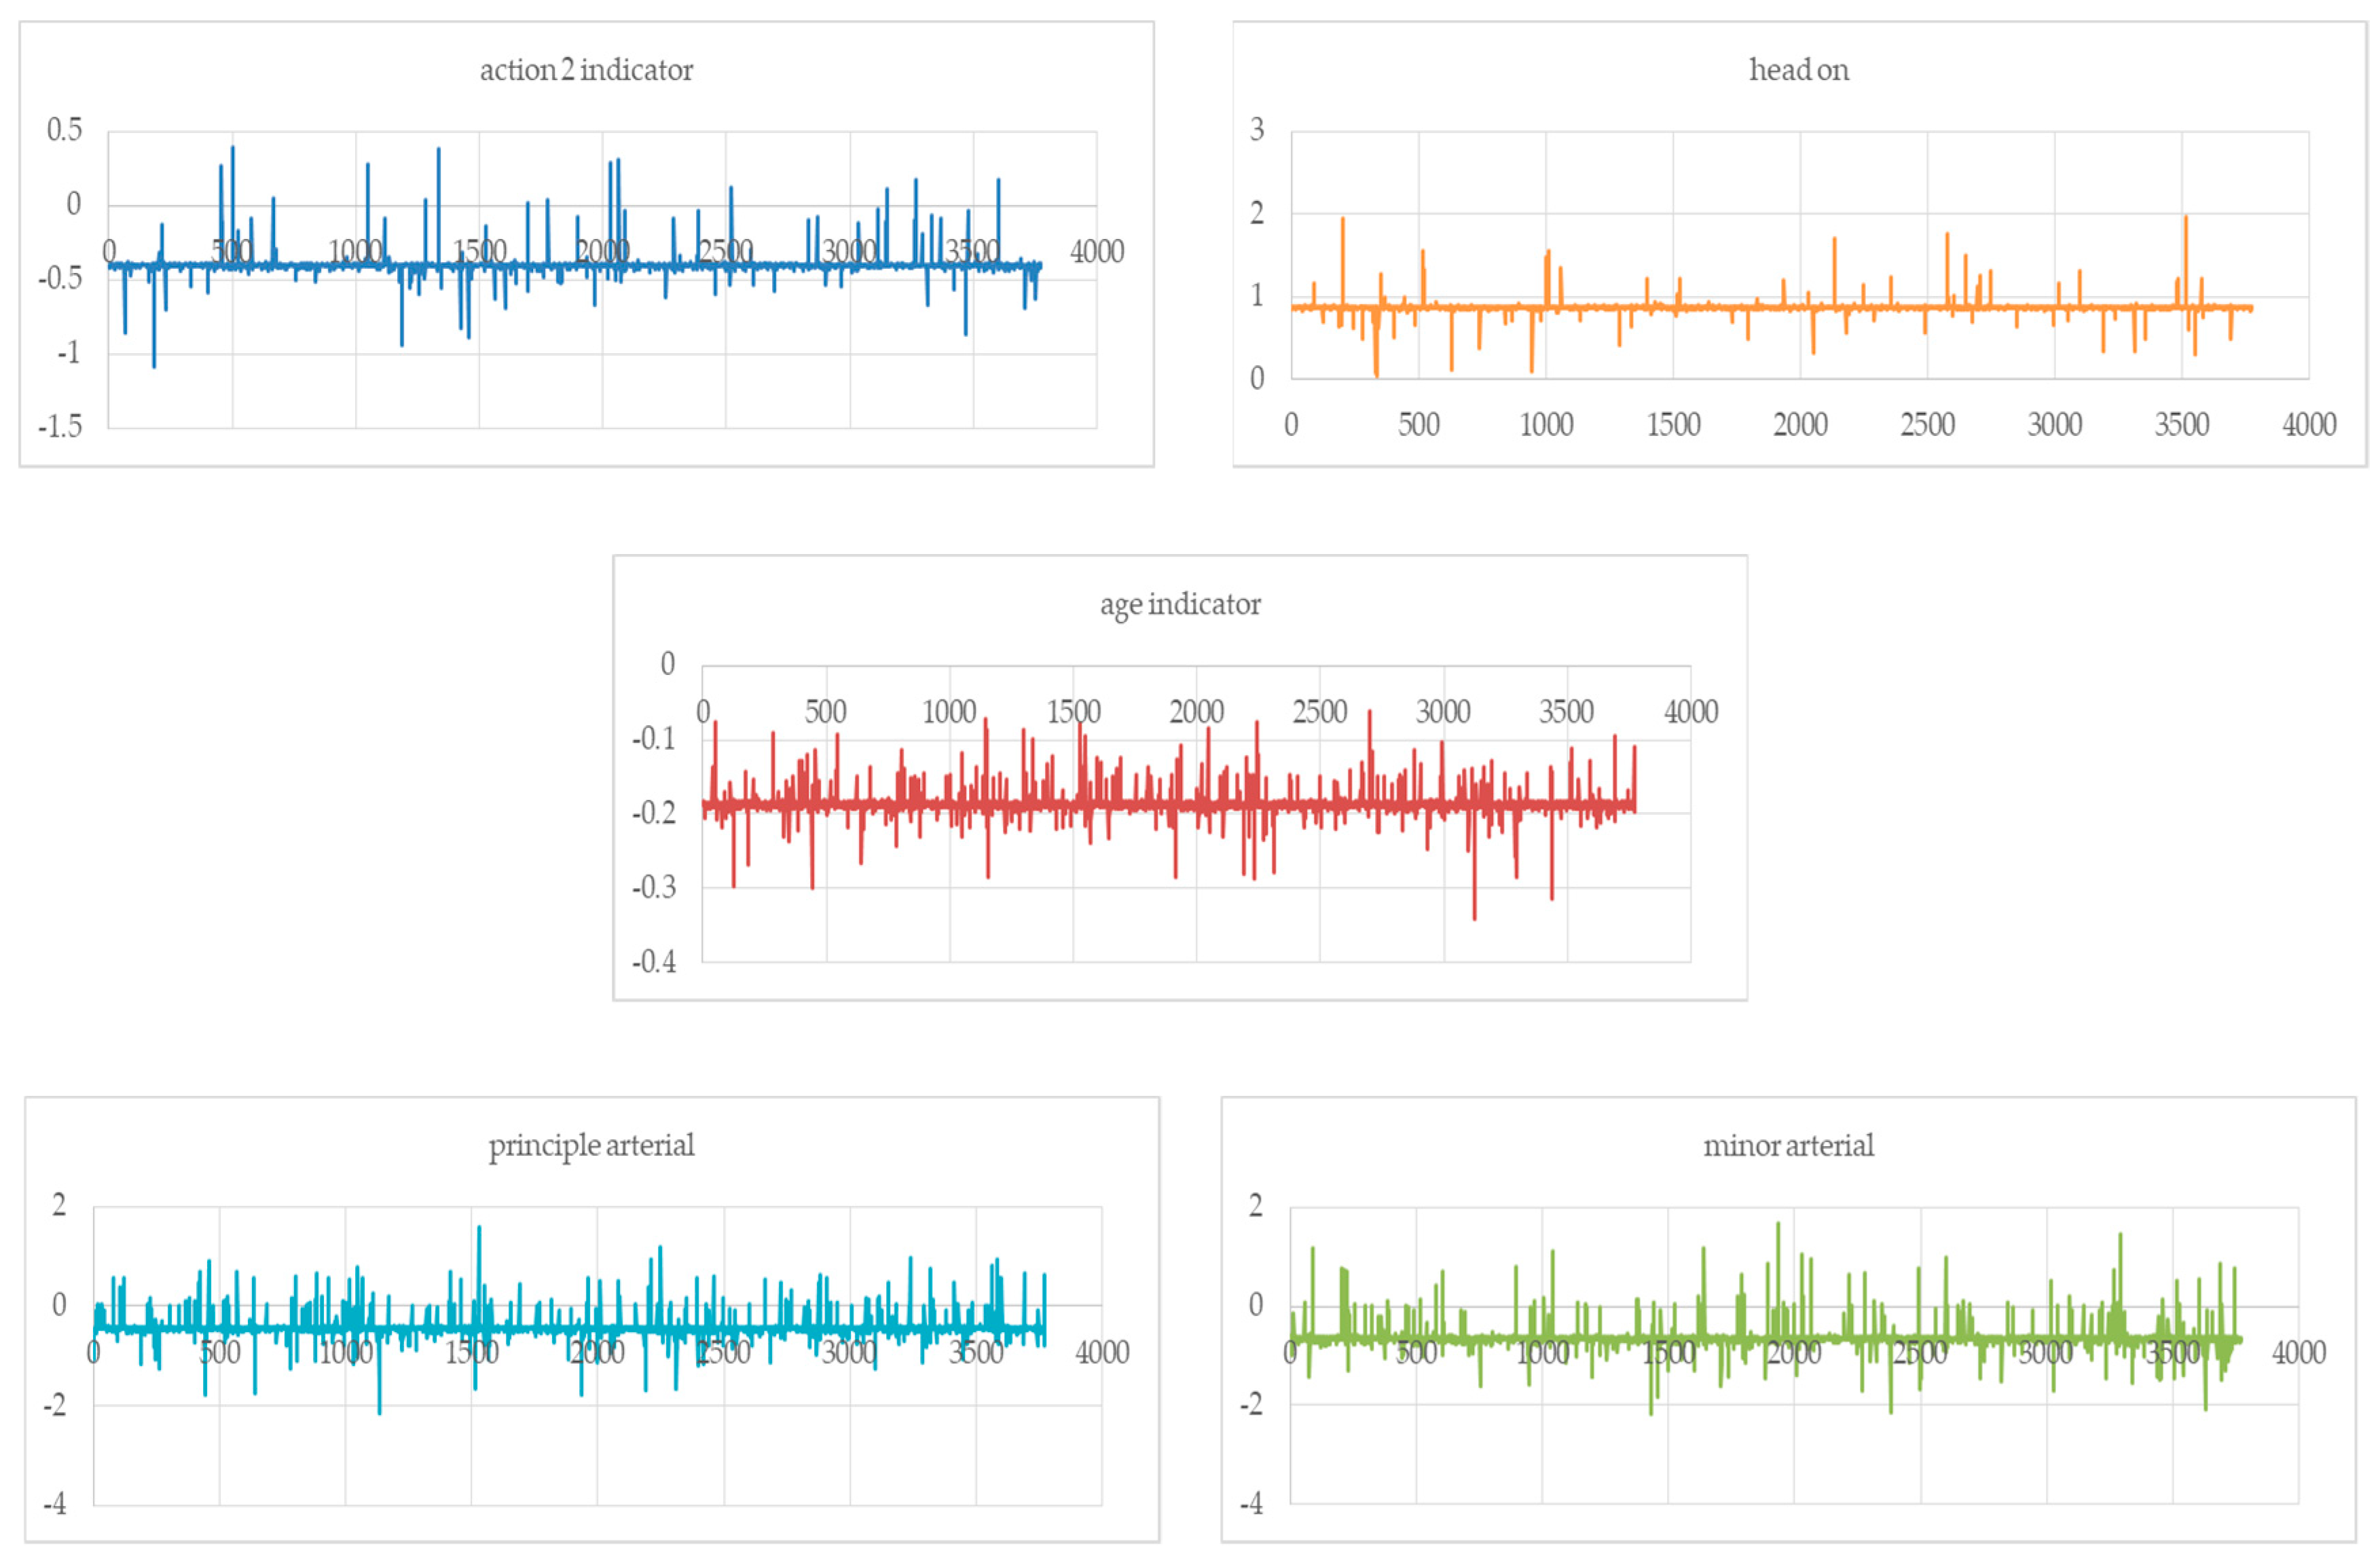
4.2. Modeling Results
4.3. Discussion
4.3.1. Driver Actions
4.3.2. Driver Related Factors and Time of Day
4.3.3. Roadway Types
4.3.4. Collision Types
5. Limitation
6. Conclusions
Author Contributions
Funding
Conflicts of Interest
References
- Friswell, R.; Williamson, A. Work characteristics associated with injury among light/short-haul transport drivers. Accid. Anal. Prev. 2010, 42, 2068–2074. [Google Scholar] [CrossRef]
- Newnam, S.; Goode, N. Do not blame the driver: A systems analysis of the causes of road freight crashes. Accid. Anal. Prev. 2015, 76, 141–151. [Google Scholar] [CrossRef]
- Federal Motor Carrier Safety Administration. Large Truck and Bus Crash Facts. 2015. Available online: https://www.fmcsa.dot.gov/safety/data-and-statistics/large-truck-and-bus-crash-facts-2015 (accessed on 17 September 2019).
- Duncan, C.S.; Khattak, A.J.; Council, F.M. Applying the Ordered Probit Model to Injury Severity in Truck-Passenger Car Rear-End Collisions. Transp. Res. Rec. J. Transp. Res. Board 1998, 1635, 63–71. [Google Scholar] [CrossRef]
- IIHS. Insurance Institute for Highway Safety, Large Trucks. Available online: http://www.iihs.org/iihs/topics/t/large-trucks/fatalityfacts/large-trucks (accessed on 17 September 2019).
- Federal Motor Carrier Safety Administration. Large Truck and Bus Crash Facts. 2014. Available online: https://www.fmcsa.dot.gov/safety/data-and-statistics/large-truck-and-bus-crash-facts-2014 (accessed on 17 September 2019).
- Hanrahan, R.B.; Layde, P.M.; Zhu, S.; Guse, C.E.; Hargarten, S.W. The Association of Driver Age with Traffic Injury Severity in Wisconsin. Traffic Inj. Prev. 2009, 10, 361–367. [Google Scholar] [CrossRef]
- Thompson, J.; Baldock, M.; Mathias, J.; Wundersitz, L. Older Drivers in Rural and Urban Areas: Comparisons of Crash, Serious Injury, and Fatality Rates. In Proceedings of the Australasian Road Safety Research, Policing and Education Conference, Canberra, Australia, 31 August–3 September 2010. [Google Scholar]
- Gonzalez, R.P.; Cummings, G.R.; Phelan, H.A.; Harlin, S.; Mulekar, M.; Rodning, C.B. Increased Rural Vehicular Mortality Rates: Roadways with Higher Speed Limits or Excessive Vehicular Speed? J. Trauma Inj. Infect. Crit. Care 2007, 63, 1360–1363. [Google Scholar] [CrossRef]
- Clarke, D.D.; Ward, P.; Bartle, C.; Truman, W. Killer crashes: Fatal road traffic accidents in the UK. Accid. Anal. Prev. 2010, 42, 764–770. [Google Scholar] [CrossRef]
- Tasca, L. A Review of the Literature on Aggressive Driving Research; Ontario Ministry of Transportation: Toronto, ON, Canada, 2000.
- Goodwin, A.H.; Thomas, L.J.; Hall, W.L.; Tucker, M.E. Countermeasures that Work: A Highway Safety Countermeasure Guide for State Highway Safety Offices; National Highway Traffic Safety Administration: Washington, DC, USA, 2010.
- Paleti, R.; Eluru, N.; Bhat, C.R. Examining the influence of aggressive driving behavior on driver injury severity in traffic crashes. Accid. Anal. Prev. 2010, 42, 1839–1854. [Google Scholar] [CrossRef] [Green Version]
- Golob, T.F.; Recker, W.W. An analysis of truck-involved freeway accidents using log-linear modeling. J. Saf. Res. 1987, 18, 121–136. [Google Scholar] [CrossRef]
- Chang, L.-Y.; Mannering, F. Analysis of injury severity and vehicle occupancy in truck- and non-truck-involved accidents. Accid. Anal. Prev. 1999, 31, 579–592. [Google Scholar] [CrossRef]
- Khattak, A.J.; Schneider, R.J.; Targa, F. Risk Factors in Large Truck Rollovers and Injury Severity: Analysis of Single-Vehicle Collisions. In Proceedings of the Transportation Research Board 82nd Annual Meeting, Washington, DC, USA, 12–16 January 2003. [Google Scholar]
- Lemp, J.D.; Kockelman, K.M.; Unnikrishnan, A. Analysis of large truck crash severity using heteroskedastic ordered probit models. Accid. Anal. Prev. 2011, 43, 370–380. [Google Scholar] [CrossRef]
- Christoforou, Z.; Cohen, S.; Karlaftis, M.G. Vehicle occupant injury severity on highways: An empirical investigation. Accid. Anal. Prev. 2010, 42, 1606–1620. [Google Scholar] [CrossRef]
- Wei, X.; Shu, X.; Huang, B.; Taylor, E.L.; Chen, H. Analyzing Traffic Crash Severity in Work Zones under Different Light Conditions. J. Adv. Transp. 2017, 2017, 5783696. [Google Scholar] [CrossRef]
- Lee, C.; Hellinga, B.; Saccomanno, F. Evaluation of variable speed limits to improve traffic safety. Transp. Res. Part C Emerg. Technol. 2006, 14, 213–228. [Google Scholar] [CrossRef]
- Nathens, A.B.; Jurkovich, G.J.; Cummings, P.; Rivara, F.P.; Maier, R.V. The Effect of Organized Systems of Trauma Care on Motor Vehicle Crash Mortality. JAMA 2000, 283, 1990–1994. [Google Scholar] [CrossRef] [Green Version]
- Wu, L.; Sun, J.; Li, T. Relationship between Lane Width and Safety along Urban Expressways in Shanghai. J. Transp. Eng. Part A Syst. 2019, 145, 05018004. [Google Scholar] [CrossRef]
- Islam, M.; Hernandez, S. Large Truck–Involved Crashes: Exploratory Injury Severity Analysis. J. Transp. Eng. 2013, 139, 596–604. [Google Scholar] [CrossRef]
- Kostyniuk, L.P.; Streff, F.M.; Zakrajsek, J. Identifying Unsafe Driver Actions that Lead to Fatal Car-Truck Crashes; AAA Foundation for Traffic Safety: Washington, DC, USA, 2002; Volume 9. [Google Scholar]
- Khorashadi, A.; Niemeier, D.; Shankar, V.; Mannering, F. Differences in rural and urban driver-injury severities in accidents involving large-trucks: An exploratory analysis. Accid. Anal. Prev. 2005, 37, 910–921. [Google Scholar] [CrossRef]
- Zhu, X.; Srinivasan, S. A comprehensive analysis of factors influencing the injury severity of large-truck crashes. Accid. Anal. Prev. 2011, 43, 49–57. [Google Scholar] [CrossRef]
- Stuster, J. The Unsafe Driving Acts of Motorists in the Vicinity of Large Trucks; Anacapa Sciences: Santa Barbara, CA, USA, 1999. [Google Scholar]
- Council, F.; Harkey, D.; Nabors, D.; Khattak, A.; Mohamedshah, Y. Examination of fault, unsafe driving acts, and total harm in car-truck collisions. Transp. Res. Rec. 2003, 1830, 63–71. [Google Scholar] [CrossRef]
- Mannering, F.L.; Bhat, C.R. Analytic methods in accident research: Methodological frontier and future directions. Anal. Methods Accid. Res. 2014, 1, 1–22. [Google Scholar] [CrossRef]
- Zou, Y.J.; Ash, J.E.; Park, B.J.; Lord, D.; Wu, L.T. Empirical Bayes estimates of finite mixture of negative binomial regression models and its application to highway safety. J. Appl. Stat. 2018, 45, 1652–1669. [Google Scholar] [CrossRef]
- Xiong, Y.; Mannering, F.L. The heterogeneous effects of guardian supervision on adolescent driver-injury severities: A finite-mixture random-parameters approach. Transp. Res. Part B Methodol. 2013, 49, 39–54. [Google Scholar] [CrossRef]
- Zou, Y.; Zhong, X.; Tang, J.; Ye, X.; Wu, L.; Ijaz, M.; Wang, Y. A Copula-Based Approach for Accommodating the Underreporting Effect in Wildlife‒Vehicle Crash Analysis. Sustainability 2019, 11, 418. [Google Scholar] [CrossRef]
- Ye, F.; Lord, D. Investigation of Effects of Underreporting Crash Data on Three Commonly Used Traffic Crash Severity Models Multinomial Logit, Ordered Probit, and Mixed Logit. Transp. Res. Rec. 2011, 2241, 51–58. [Google Scholar] [CrossRef]
- Russo, B.J.; Savolainen, P.T.; Schneider, W.H.; Anastasopoulos, P.C. Comparison of factors affecting injury severity in angle collisions by fault status using a random parameters bivariate ordered probit model. Anal. Methods Accid. Res. 2014, 2, 21–29. [Google Scholar] [CrossRef]
- Liu, J.; Khattak, A.; Zhang, M. What role do precrash driver actions play in work zone crashes? Application of hierarchical models to crash data. Transp. Res. Rec. 2016, 2555, 1–11. [Google Scholar] [CrossRef]
- Anastasopoulos, P.C.; Mannering, F.L. A note on modeling vehicle accident frequencies with random-parameters count models. Accid. Anal. Prev. 2009, 41, 153–159. [Google Scholar] [CrossRef]
- Greene, W.H. Econometric Analysis, 5th ed.; Prentice Hall: Upper Saddle River, NJ, USA, 2003. [Google Scholar]
- Harmon, T.; Bahar, G.; Gross, F. Crash Cost for Highway Safety Analysis; FHWA-SA-17-071, Federal Highway Administration: Washington, DC, USA, 2018. [Google Scholar]
- Khattak, A.; Targa, F. Injury severity and total harm in truck-involved work zone crashes. Transp. Res. Rec. 2004, 1877, 106–116. [Google Scholar] [CrossRef]
- Khattak, A. Injury severity in multivehicle rear-end crashes. Transp. Res. Rec. 2001, 1746, 59–68. [Google Scholar] [CrossRef]
- Khattak, A.J.; Liu, J.; Wali, B.; Li, X.; Ng, M. Modeling Traffic Incident Duration Using Quantile Regression. Transp. Res. Rec. J. Transp. Res. Board 2016, 2554, 139–148. [Google Scholar] [CrossRef]
- Washington, S.P.; Karlaftis, M.G.; Mannering, F. Statistical and Econometric Methods for Transportation Data Analysis; CRC press: Boca Raton, FL, USA, 2010. [Google Scholar]
- Khattak, A.; Rocha, M. Are SUVs “supremely unsafe vehicles”?: Analysis of rollovers and injuries with sport utility vehicles. Transp. Res. Rec. 2003, 1840, 167–177. [Google Scholar] [CrossRef]


| Possible Combinations | Truck Driver | Passenger Vehicle Driver |
|---|---|---|
| 1 | I | No |
| 2 | U | No |
| 3 | No | I |
| 4 | No | U |
| 5 | I | I |
| 6 | U | U |
| 7 | I | U |
| 8 | U | I |
| 9 | No | No |
| Variable | Description | Mean | SD | VIF |
|---|---|---|---|---|
| Driver actions | ||||
| Action 1 indicator | 1 if passenger vehicle driver undertook no improper action while truck driver undertook intentional improper action, 0 otherwise | 0.375 | 0.484 | 2.487 |
| Action 2 indicator | 1 if passenger vehicle driver undertook no improper action while truck driver undertook unintentional improper action, 0 otherwise | 0.079 | 0.270 | 1.263 |
| Action 3 indicator | 1 if passenger vehicle driver undertook intentional improper action while truck driver undertook no improper action, 0 otherwise | 0.413 | 0.492 | 2.507 |
| Action 4 indicator | 1 if passenger vehicle driver undertook unintentional improper action while truck driver undertook no improper action,0 otherwise | 0.133 | 0.340 | 1.640 |
| Collision type | ||||
| Angle | 1 If collision type is angle, 0 otherwise | 0.298 | 0.457 | 1.290 |
| Head-on | 1 if collision type is head-on, 0 otherwise | 0.017 | 0.130 | 1.060 |
| Sideswipe-same direction | 1 If collision type is sideswipe-same direction, 0 otherwise | 0.306 | 0.461 | 1.350 |
| Injury count | Total number of injuries in a collision | 0.388 | 0.709 | 1.050 |
| Roadway Type | ||||
| Interstate (Base) | 1 if roadway type is interstate, 0 otherwise | 0.409 | 0.492 | 3.640 |
| principal arterial | 1 if roadway type is principal arterial, 0 otherwise | 0.269 | 0.443 | 3.060 |
| minor arterial | 1 if roadway type is minor arterial, 0 otherwise | 0.186 | 0.389 | 2.543 |
| collector | 1 if roadway type is collector, 0 otherwise | 0.101 | 0.301 | 1.835 |
| local | 1 if roadway type is local, 0 otherwise | 0.035 | 0.184 | 1.168 |
| Driver condition | ||||
| Drinking and driving (pass. veh. driver) | 1 if the passenger vehicle driver is drunk, 0 otherwise | 0.023 | 0.148 | 1.030 |
| Fatigued driving (pass. veh. driver) | 1 if the passenger vehicle driver is fatigued or asleep, 0 otherwise | 0.019 | 0.135 | 1.060 |
| Demographics | ||||
| Age (pass. veh. driver) | 1 if the passenger vehicle driver is 20–29 years old, 0 otherwise | 0.241 | 0.428 | 1.020 |
| Time of Day | ||||
| Late night/early morning | 1 if a crash happened between 01:00 and 08:00, 0 otherwise | 0.207 | 0.405 | 1.010 |
| Fixed-Parameter Model | Random-Parameter Model | |||
|---|---|---|---|---|
| Variable | β | t-Stats | β | t-Stats |
| Driver actions | ||||
| Action 1 (Base) | ||||
| Action 2 | −0.167 | −1.43 | −0.391 *** | −2.93 |
| standard deviation | --- | --- | 0.658 *** | 5.45 |
| Action 3 | 0.133 ** | 2.07 | 0.150 ** | 2.09 |
| Action 4 | 0.315 *** | 3.72 | 0.381 *** | 4.32 |
| Collision type | ||||
| Angle | 0.160 ** | 2.50 | 0.178 *** | 2.63 |
| Head-on | 0.793 *** | 4.62 | 0.856 *** | 4.39 |
| standard deviation | --- | --- | 0.932 *** | 4.62 |
| Sideswipe-same direction | −0.262 *** | −3.46 | −0.273 *** | −3.10 |
| Injury count | 1.310 *** | 36.54 | 1.571 *** | 43.80 |
| Roadway Type | ||||
| Interstate (Base) | ||||
| principal arterial | −0.142 ** | −2.02 | −0.433 *** | −5.40 |
| standard deviation | --- | --- | 0.849 *** | 15.02 |
| minor arterial | −0.253 *** | −3.17 | −0.640 *** | −6.78 |
| standard deviation | --- | --- | 1.004 *** | 14.43 |
| collector | −0.227 ** | −2.29 | −0.297 *** | −2.94 |
| local | −0.531 *** | −3.11 | −0.639 *** | −3.94 |
| Driver condition | ||||
| Drinking and driving (pass. veh. driver) | 0.533 *** | 3.54 | 0.581 *** | 3.67 |
| Fatigued driving (pass. veh. driver) | 0.299 * | 1.75 | 0.335 * | 1.86 |
| Demographics | ||||
| Age (pass. veh. driver) | −0.158 ** | −2.39 | −0.187 *** | −2.62 |
| standard deviation | --- | --- | 0.232 *** | 3.77 |
| Time of Day | ||||
| Late night/early morning | 0.196 *** | 3.06 | 0.270 *** | 3.82 |
| μ(1) | 1.262 *** | 26.71 | 1.518 *** | 29.25 |
| Number of observations | 3774 | 3774 | ||
| Log-likelihood with constant only | −2408.439 | −2408.439 | ||
| Log-likelihood at convergence | −1494.187 | −1472.797 | ||
| Likelihood Ratio Test | Chi–square = 42.780; p–value = 0.005 | |||
| Fixed-Parameter Model | Random-Parameter Model | |||||
|---|---|---|---|---|---|---|
| Variables | No Apparent/No Injury | Minor Injury | Serious/Fatal Injury | No Apparent/No Injury | Minor Injury | Serious/Fatal Injury |
| Driver actions | ||||||
| Action 2 indicator | 0.032 | −0.029 | −0.003 | 0.050 | −0.049 | −0.002 |
| Action 3 indicator | −0.028 | 0.025 | 0.003 | −0.025 | 0.024 | 0.001 |
| Action 4 indicator | −0.074 | 0.065 | 0.009 | −0.074 | 0.070 | 0.004 |
| Collision type | ||||||
| Angle | −0.035 | 0.031 | 0.004 | −0.030 | 0.029 | 0.001 |
| Head-on | −0.234 | 0.190 | 0.044 | −0.220 | 0.201 | 0.020 |
| Sideswipe-same direction | 0.051 | −0.046 | −0.005 | 0.041 | −0.039 | −0.002 |
| Injury count | −0.272 | 0.243 | 0.029 | −0.253 | 0.243 | 0.010 |
| Roadway Type | ||||||
| principal arterial | 0.028 | −0.025 | −0.003 | 0.061 | −0.059 | −0.002 |
| minor arterial | 0.048 | −0.043 | −0.005 | 0.079 | −0.076 | −0.003 |
| collector | 0.042 | −0.038 | −0.004 | 0.041 | −0.039 | −0.001 |
| local | 0.081 | −0.075 | −0.007 | 0.068 | −0.066 | −0.002 |
| Driver condition | ||||||
| Drinking and driving (pass. veh. driver) | −0.143 | 0.121 | 0.022 | −0.131 | 0.122 | 0.009 |
| Fatigued driving (pass. veh. driver) | −0.072 | 0.063 | 0.009 | −0.066 | 0.063 | 0.004 |
| Demographics | ||||||
| Age (pass. veh. driver) | 0.031 | −0.028 | −0.003 | 0.028 | −0.027 | −0.001 |
| Time of Day | ||||||
| Late night/early morning | −0.043 | 0.038 | 0.005 | −0.048 | 0.046 | 0.002 |
© 2019 by the authors. Licensee MDPI, Basel, Switzerland. This article is an open access article distributed under the terms and conditions of the Creative Commons Attribution (CC BY) license (http://creativecommons.org/licenses/by/4.0/).
Share and Cite
Xu, J.; Wali, B.; Li, X.; Yang, J. Injury Severity and Contributing Driver Actions in Passenger Vehicle–Truck Collisions. Int. J. Environ. Res. Public Health 2019, 16, 3542. https://0-doi-org.brum.beds.ac.uk/10.3390/ijerph16193542
Xu J, Wali B, Li X, Yang J. Injury Severity and Contributing Driver Actions in Passenger Vehicle–Truck Collisions. International Journal of Environmental Research and Public Health. 2019; 16(19):3542. https://0-doi-org.brum.beds.ac.uk/10.3390/ijerph16193542
Chicago/Turabian StyleXu, Jingjing, Behram Wali, Xiaobing Li, and Jiaqi Yang. 2019. "Injury Severity and Contributing Driver Actions in Passenger Vehicle–Truck Collisions" International Journal of Environmental Research and Public Health 16, no. 19: 3542. https://0-doi-org.brum.beds.ac.uk/10.3390/ijerph16193542